Review

Artificial Intelligence Techniques for the Hydrodynamic Characterization of Two-Phase Liquid–Gas Flows: An Overview and Bibliometric Analysis

by
July Aandrea Gómez Camperos
1,*,
Marlon Mauricio Hernández Cely
2 and
Aldo Pardo García
3
1
Mechanical Engineering Department, Universidad Francisco de Paula Santander, Seccional Ocaña, Vía Acolsure, Sede el Algodonal Ocaña, Ocaña 546552, Colombia
2
Control and Automation Engineering, Engineering Center, Federal University of Pelotas, Rua Benjamin Constant, N° 989, Porto, Pelotas 96010-020, RS, Brazil
3
Grupo Automatización y Control (A&C), Universidad de Pamplona, Pamplona 543050, Colombia
*
Author to whom correspondence should be addressed.
Fluids 2024, 9(7), 158; https://doi.org/10.3390/fluids9070158
Submission received: 3 May 2024 / Revised: 28 May 2024 / Accepted: 17 June 2024 / Published: 8 July 2024

Abstract

:
Accurately and instantly estimating the hydrodynamic characteristics in two-phase liquid–gas flow is crucial for industries like oil, gas, and other multiphase flow sectors to reduce costs and emissions, boost efficiency, and enhance operational safety. This type of flow involves constant slippage between gas and liquid phases caused by a deformable interface, resulting in changes in gas volumetric fraction and the creation of structures known as flow patterns. Empirical and numerical methods used for prediction often result in significant inaccuracies during scale-up processes. Different methodologies based on artificial intelligence (AI) are currently being applied to predict hydrodynamic characteristics in two-phase liquid–gas flow, which was corroborated with the bibliometric analysis where AI techniques were found to have been applied in flow pattern recognition, volumetric fraction determination for each fluid, and pressure gradient estimation. The results revealed that a total of 178 keywords in 70 articles, 29 of which reached the threshold (machine learning, flow pattern, two-phase flow, artificial intelligence, and neural networks as the high predominance), were published mainly in Flow Measurement and Instrumentation. This journal has the highest number of published articles related to the studied topic, with nine articles. The most relevant author is Efteknari-Zadeh, E, from the Institute of Optics and Quantum Electronics.

1. Introduction

1.1. General Aspects

The progression of Industry 4.0 in recent times has spurred the petrochemical sector to concentrate on innovating new technologies, simplifying the adoption of advanced systems for accurate measurement of multiphase flow. Multiphase flow refers to the simultaneous movement of substances in distinct states or phases (solid, liquid, gas), leading to the formation of a stratified layer with a blend of phases or distinctive patterns arising from the initial hydrodynamic parameters of flow as it traverses through pipelines [1,2].
In the smart society era, flexible electronics with versatile functionalities have experienced notable advancements propelled by the rapid evolution of artificial intelligence of things (AIoT) and fifth generation (5G) (See Figure 1). One crucial aspect of this development is the flexible and stretchable mechanical sensors, which can measure external mechanical stimuli in mechanical properties such as pressure, strain, shear force, and vibration using electrical signals. However, unlike traditional rigid sensors, flexible mechanical sensors can adapt to various shapes, making them suitable for applications such as conforming to the human skin, robotic devices, prosthetics, and smart gadgets, thereby enhancing their sensing capabilities. Additionally, advancements in flexible mechanical sensors have incorporated features like optical transparency, enabling them to operate discreetly. As a result, these sensors find applications in a wide range of fields, including health and motion monitoring, human–machine interfaces, and smart home technologies [3].

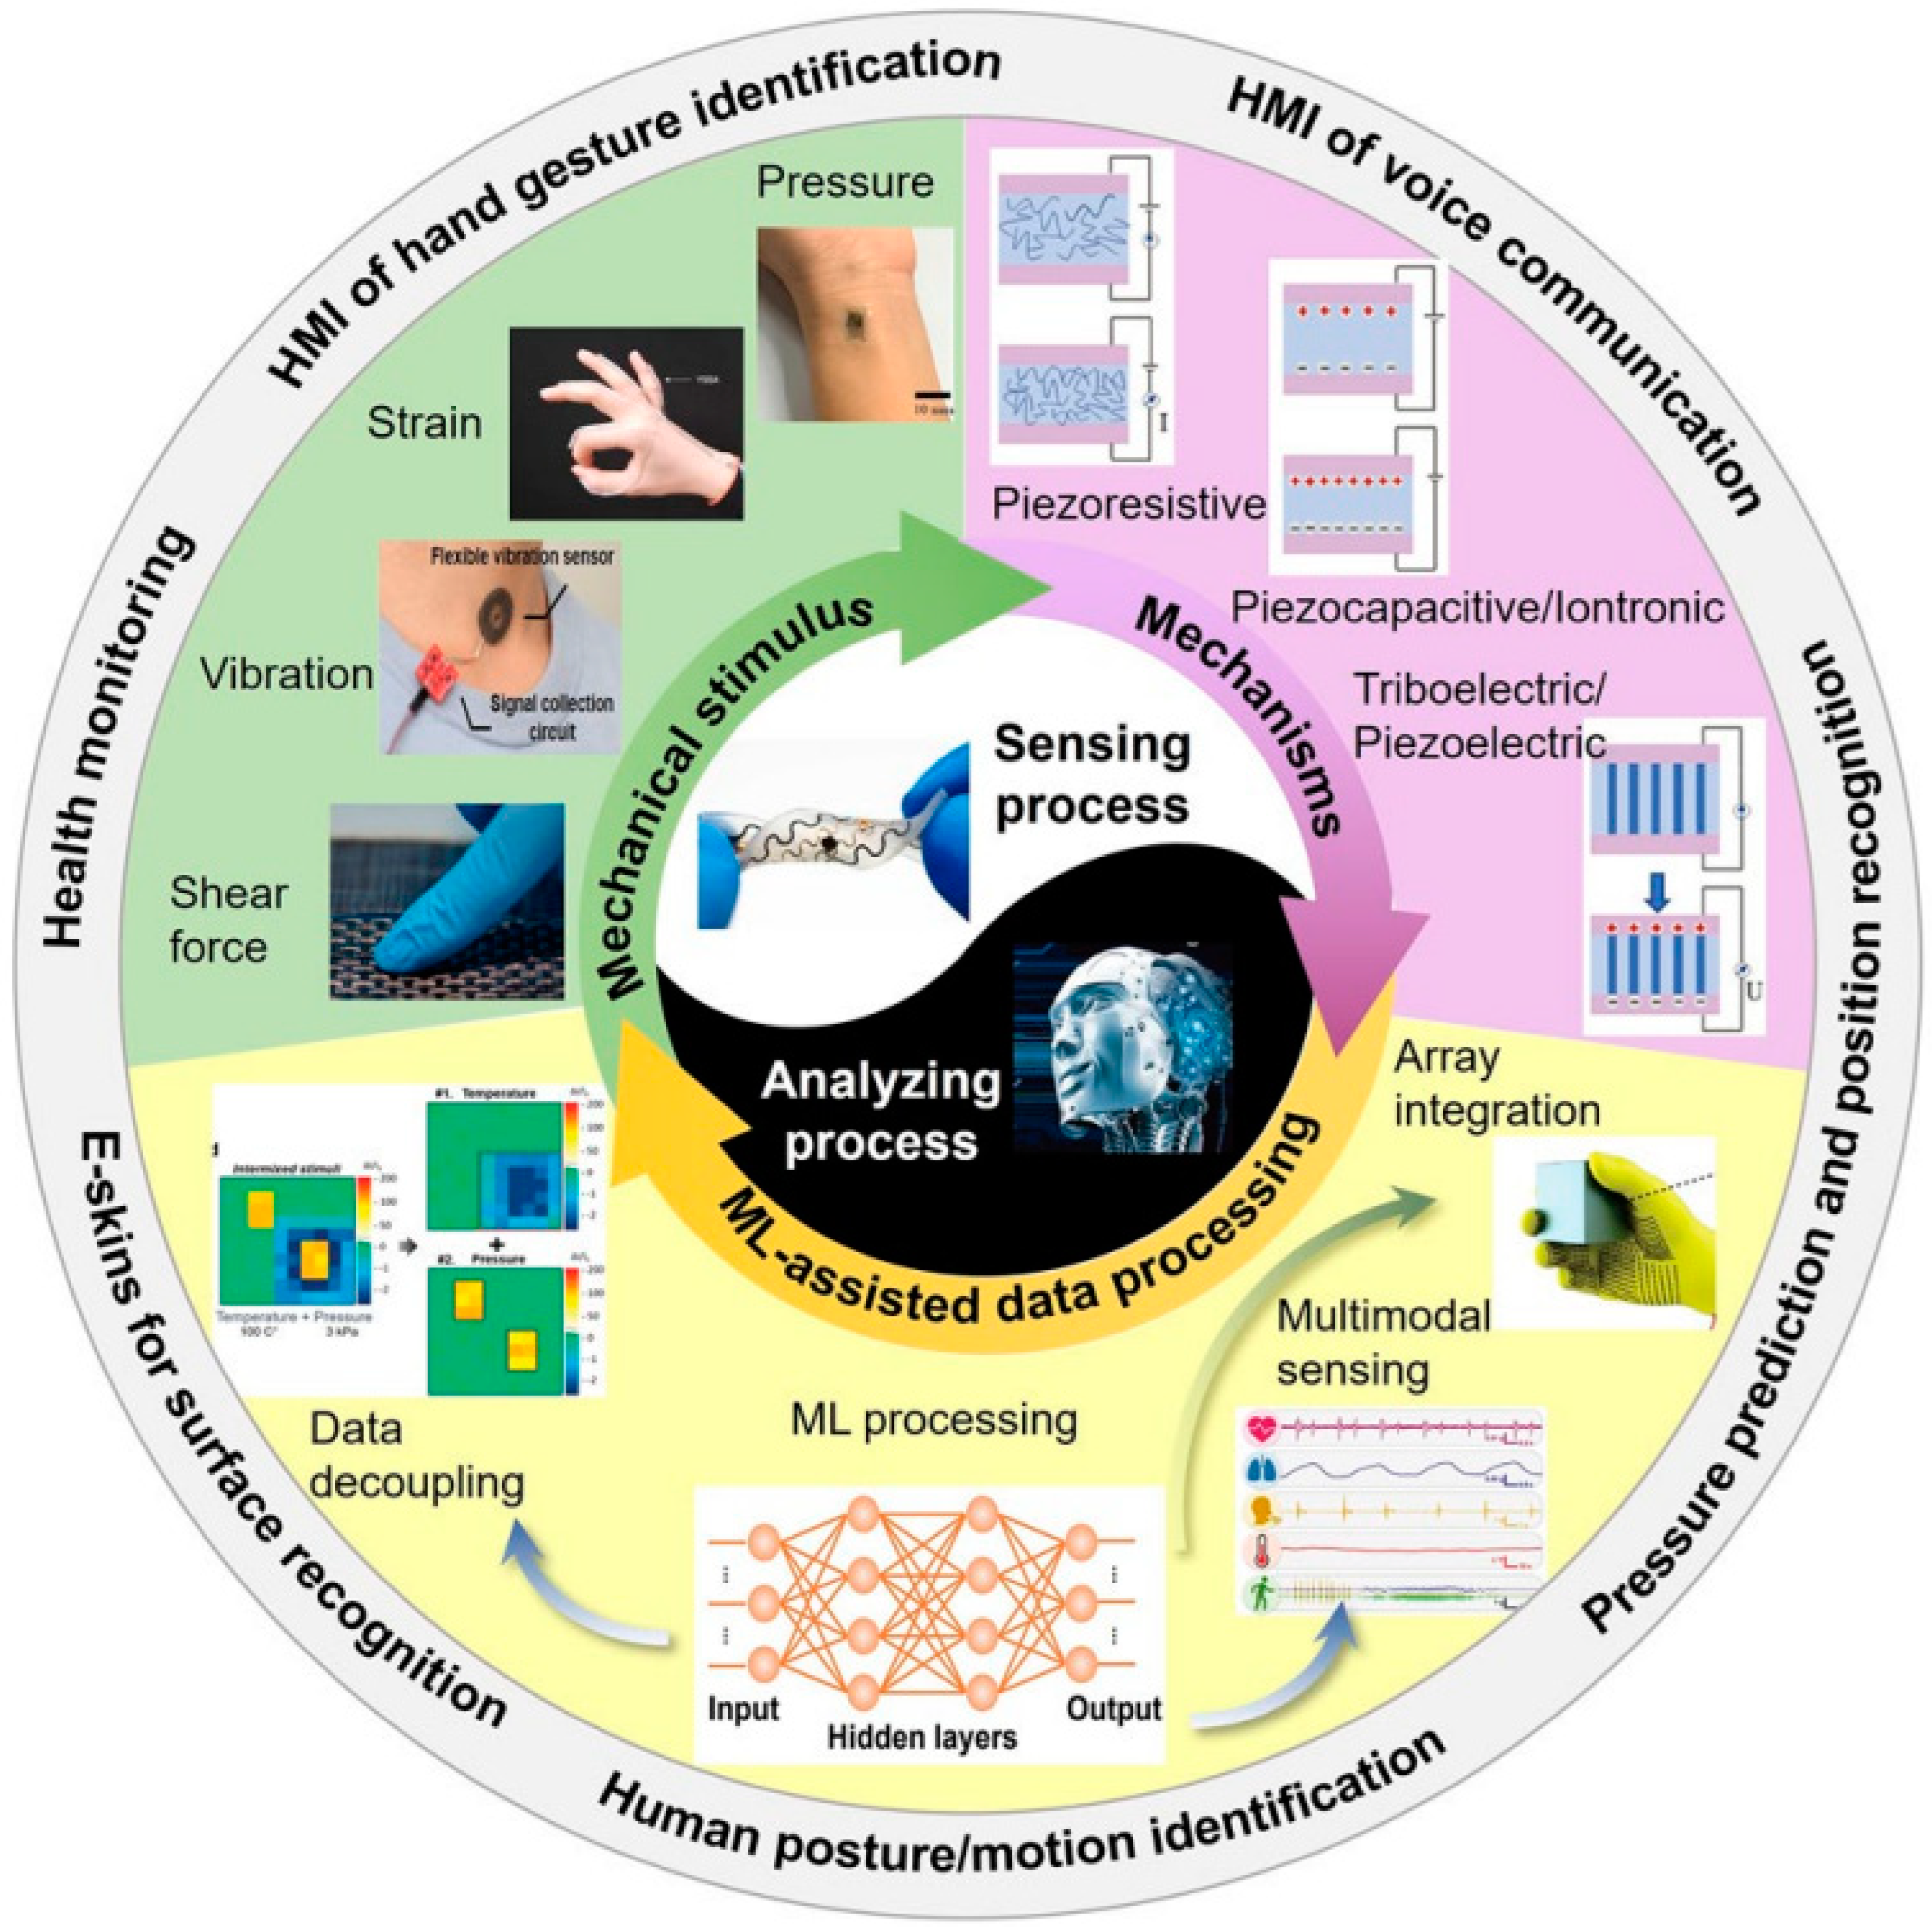
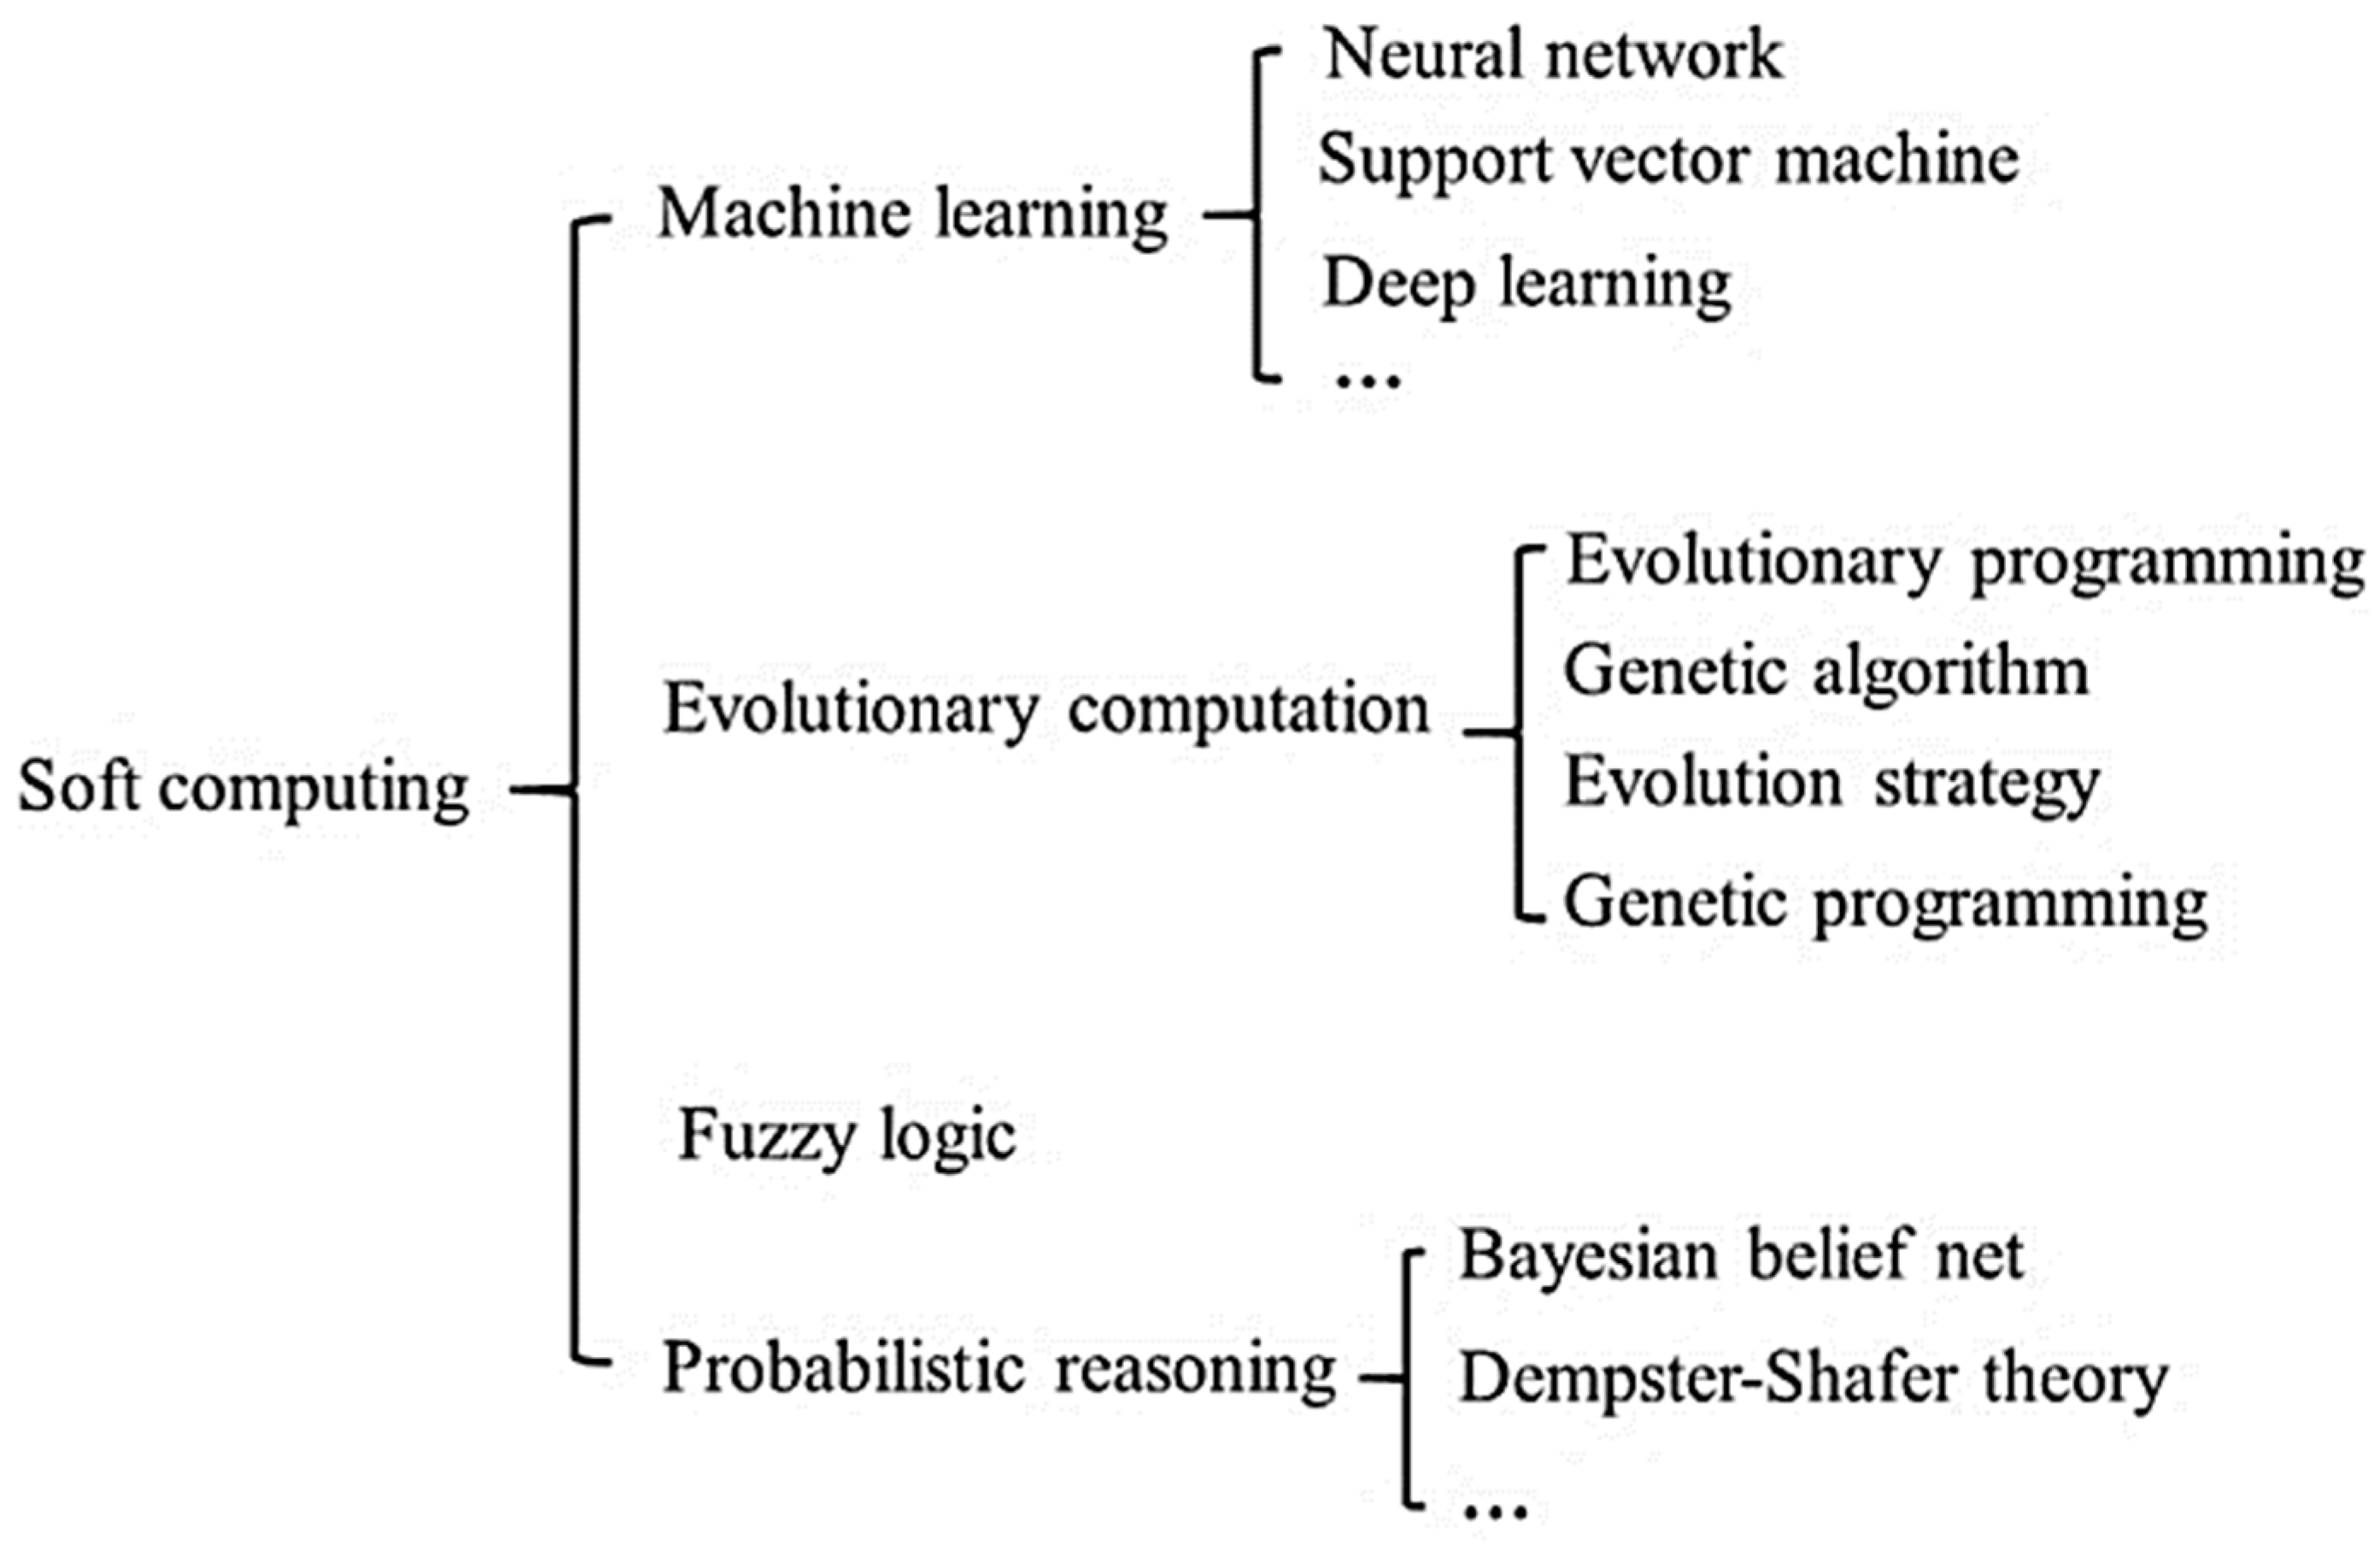
1.1.1. Main Components of Soft Computing

Figure 2 shows that the main components of soft computing techniques are machine learning, evolutionary computation, fuzzy logic, and probabilistic reasoning. Each one is subdivided according to the application. Although each technique can operate independently, they synergize in hybrid models, offering augmented capabilities when combined.

1.1.2. Industrial Implications

Optimizing the fluid catalytic cracking (FCC) process is a critical component in the petroleum refining industry, responsible for converting heavy hydrocarbons into lighter, more valuable products such as gasoline and olefins. This complex chemical process operates under high temperatures and pressures, using a catalyst to facilitate the cracking of large hydrocarbon molecules. Despite its importance, the FCC process faces several challenges. These include the need for precise control to optimize yield and quality, maintaining catalyst activity and longevity, and managing the environmental impact of emissions. Advanced technologies like 5G, sensors, and sophisticated computational methods are increasingly being integrated to address these issues, enhancing the efficiency, reliability, and environmental compliance of FCC operations.
In this way, FCC process conditions offers substantial economic advantages by enhancing yields, product quality, and energy efficiency, while minimizing operational costs. However, the FCC process is known for its complex, time-varying, nonlinear dynamics and the intricate interplay among process variables, making it susceptible to various disturbances. Achieving these goals while ensuring safe and stable operation presents an opportunity for the development and implementation of intelligent control techniques.
The selection of controlled variables (CVs) and manipulated variables (MVs) is crucial in designing controllers for the FCC unit. Key control loops in the FCC unit include flow, temperature, pressure, and catalyst level. Certain dominant variables significantly impact the overall process performance due to strong correlations among process variables. By regulating these dominant variables, the unit can be effectively controlled. For instance, the flue gas valve directly controls the regenerator pressure to maintain a constant differential pressure between the reactor and the regenerator, influencing the wet gas compressor, air blower balance, and catalytic circulation.
Conversely, the pressure controller on the overhead receiver indirectly regulates the reactor pressure by adjusting the inlet pressure to the wet gas compressor (WGC). The catalyst level in the reactor is managed using the spent catalyst slide valve to facilitate catalyst flow toward the regenerator. However, direct control of the catalyst level in the regenerator is impractical, leading to fluctuations within a predetermined range influenced by catalyst activity loss, withdrawal, and addition policies. The ROT set point regulates the flow rate of the regenerated catalyst. Critical CVs include riser outlet temperature, regenerator temperature, catalyst level, stack gas oxygen concentration, and reactor and/or regenerator pressures [5].
Key manipulated variables (MVs) include the spent and regenerated catalyst, stack gas, and blower air flow rates. Additionally, critical operating parameters encompass the fresh feed rate, LCO, HCO, or slurry recycle to the riser, feed preheat temperature, stripping steam rate, feed nozzle atomization steam, and catalyst addition rate or fresh catalyst surface area.
The liquid–gas two-phase flow is one of the multiphase flows encountered in the petroleum industries, and the accurate and instantaneous estimation of hydrodynamic characteristics is crucial for reducing costs and emissions and improving efficiency [6,7]. The flow in each pipe’s cross-sectional area is characterized by the phase volume fractions, pressure, and flow pattern according to its physical distribution phases [8]. During liquid–gas two-phase flow, the flow regime depends on the magnitudes of the forces acting on the fluid from other fluids or the pipe wall [9]. In this way, the local pressure gradient meaningly depends on the flow pattern. However, the volume fractions and the flow regime along the pipe are required to determine the pressure gradient [10].
Conventional studies suggest separating each phase of the mixture and then using single-phase flow meters to measure single-phase flow as a feasible method [11]. However, this method always requires complex separation equipment and lacks real-time detection capability [12]. Several attempts have been made to find possible measurement techniques for two-phase flow [13]. Devices based on the detection of differential pressure, such as the Venturi tube and orifice plate, which work well in single-phase flow measurement, have been tested in multiphase flow measurement [14]. However, such approaches have failed to address the accurate detection of multiphase flow, especially in scenarios with high gas volume fraction (GVF). The failure to detect high GVF multiphase flow using a Venturi tube is mainly because the differential pressure detected across the Venturi throat is sensitive to the instantaneous change in the amount of liquid. Specifically, a small amount of liquid generally leads to a large increase in the measured differential pressure across the Venturi tube, thus causing an excessive reading of the gas flow rate [15].

1.1.3. Advances in Artificial Intelligence (AI)

Recent advancements in artificial intelligence, using traditional machine learning algorithms and deep learning architectures, address complex classification problems [16,17]. In the petrochemical industry, the development of artificial intelligence has facilitated the adoption of techniques for identifying the hydrodynamic characteristics of two-phase liquid–gas flow using experimental data to identify flow hydrodynamic characteristics automatically [18].
The accuracy of data-driven flow pattern identification in gas–liquid two-phase flow depends on the quality of training data [19]. Several methods have recently been proposed for identifying hydrodynamic characteristics using artificial intelligence techniques in this context. For instance, Olbrich et al., 2022 [20] focused on slug flow patterns, which are most hazardous when formed through a pipeline as they can cause blockages and serious accidents. They utilized a convolutional neural network-based image processing technique to extract the gas–liquid interface from video observations of multiphase flows in horizontal pipelines. Quintino et al., 2020 [21] demonstrated that a hybrid model using artificial neural networks offers good transition prediction performance even with insufficient training data. Iliyasu et al., 2023 [22] employed a detection system consisting of a Pyrex glass tube between an X-ray tube and a NaI detector to record photons and a neural network to calculate volume percentages in a gas–liquid flow system. Quiao et al., 2022 [23] developed a novel deep learning algorithm that integrates convolutional neural networks (CNNs) and long short-term memory (LSTM) networks aimed at discerning various two-phase flow patterns within a Z-shaped pipeline. The outcomes demonstrated that the proposed algorithm enhances identification accuracy while attaining quicker convergence speed and heightened computational efficiency.
Another hydrodynamic characteristic of liquid–gas two-phase flow is the pressure gradient, which properly predicts and aids in pipeline design in the oil industry [24,25]. Therefore, accurate pressure gradient prediction enhances operational safety, equipment performance, and investment profitability [26,27]. Mayet et al., 1996 [28] employed a neural network to determine the volume percentage of each phase.
In Faraji et al., 2022 [29], various artificial neural network models, including six multilayer perceptrons (MLPs) and a radial basis function (RBF), were proposed to find friction pressure drop in a two-phase flow of different pipe diameters using 4124 experimental data points obtained from the literature to determine pressure gradient.

1.2. Multiphase Flux and Their Characteristics

1.2.1. Multiphase Flows

Multiphase flow can be defined as the flow of two or more materials with different phases and chemical properties through a pipeline [30]. This flow type is common in various fields of science and engineering, including the petrochemical, nuclear reactor, geothermal energy, food, biomedical, and chemical industries. In the petrochemical industry, multiphase flows occur in the form of liquid–liquid (oil–water), gas–liquid (gas–water or gas–oil), or three-phase mixtures (water–oil–gas, sometimes including solids).

Flow Regime or Flow Pattern

The interfaces’ geometric and topological configurations determine the flow regime or pattern [31]. Flow patterns depend on the fluids’ mixture velocity, water fraction, and physical properties.

Flow Maps or Flow Charts

Flow maps or charts are tools used to determine flow patterns based on the superficial velocities of the phases (or volumetric flows, volumetric fractions, total velocity, pressure drop, and combinations). These tools graphically show that the transition boundaries between flow patterns are directly related to pipe geometry and fluid properties. These tools are used in generating models to more accurately identify the location of transition boundaries between phases and the flow patterns integrated within them.

1.2.2. Gas–Liquid Flow Patterns

Gas–liquid flow patterns and the transitions between flow patterns vary with pipe geometry, pipe inclination, gas and liquid inlet conditions, the physical properties of the working fluid, flow orientation, and flow parameters. These characteristics form the basis for understanding the gas–liquid two-phase flow dynamics [32].
  • Horizontal pipe: Figure 3 depicts five flow patterns described in the proposed research [33] into horizontal gas–liquid two-phase flow. These are described below;
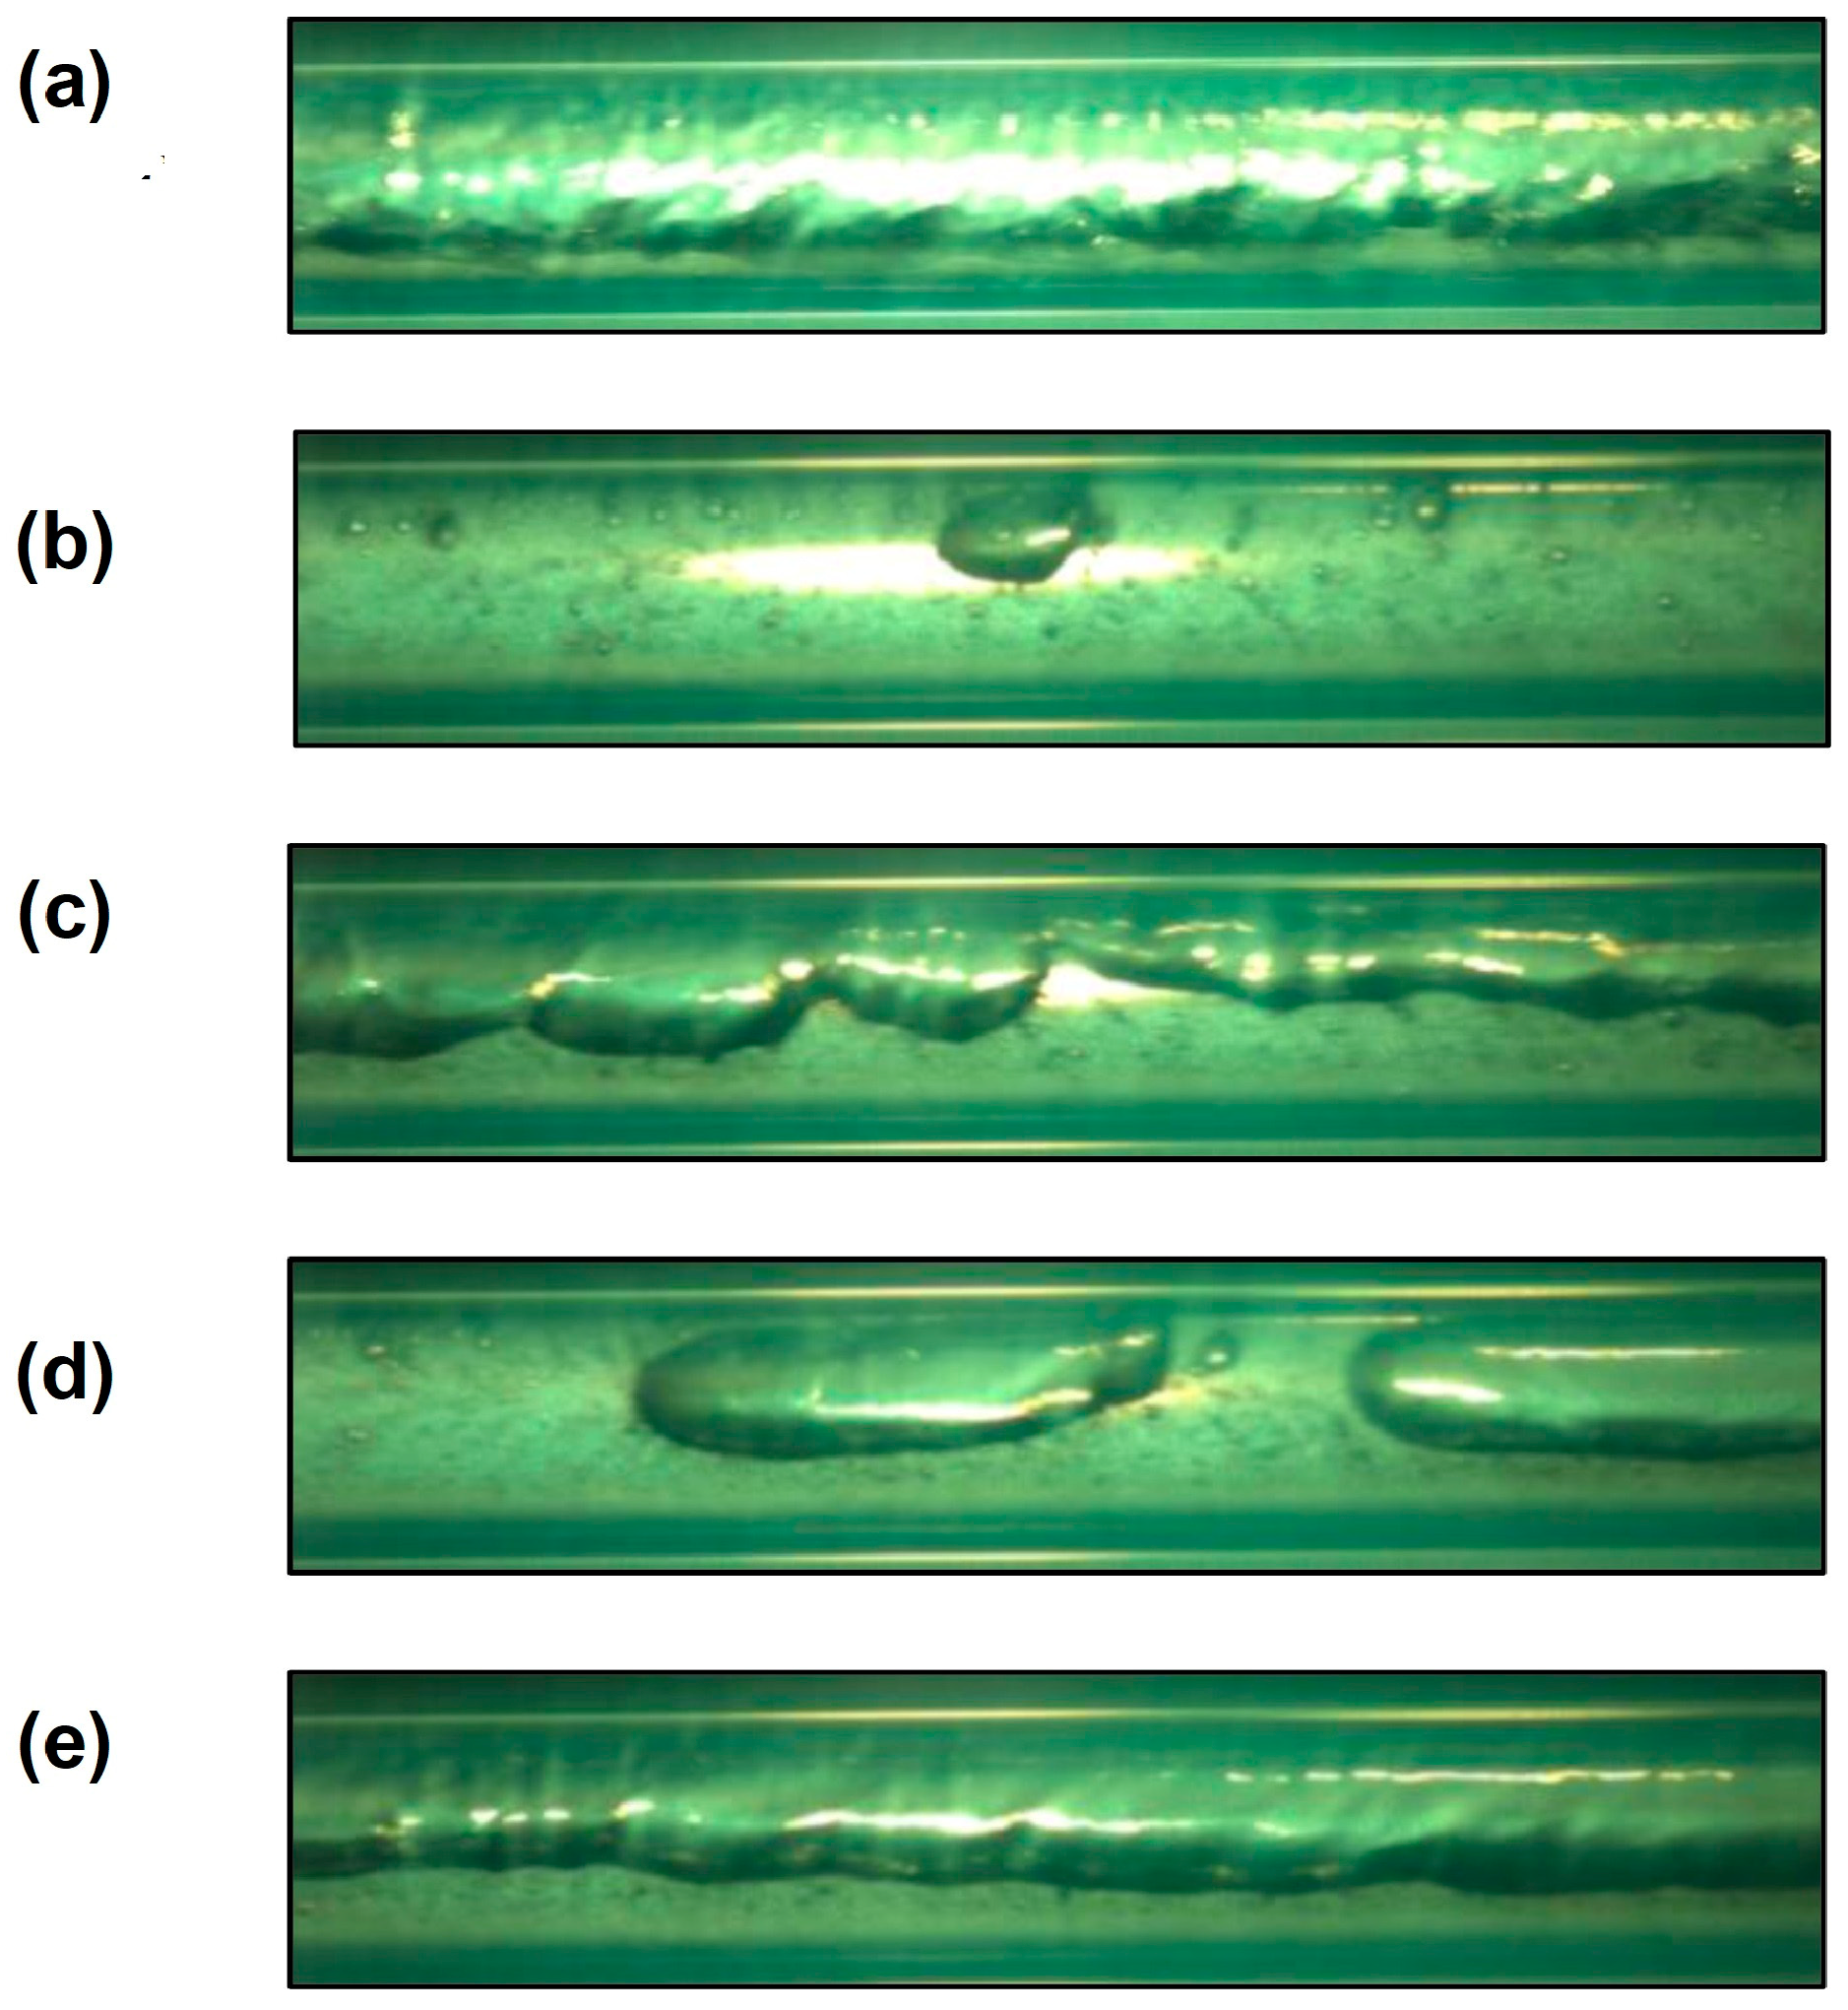
  • Annular flow: In this flow pattern, the gas converges to form a high-velocity gas core flowing in the center of the pipe (Figure 3a). Most of the liquid is distributed as liquid film layers lining the circumferential wall of the pipe. Some of the liquid phase is entrained as small droplets in the gas core;
  • Bubble flow: As shown in Figure 3b, the gaseous phase exists in small discrete bubbles dispersed within the continuous liquid phase, with liquid comprising most of the fluid;
  • Agitated flow: The agitated flow is called the slug-to-annular or stratified transition flow. The image of this flow pattern shows that both phases are discontinuous, and gas bubbles become narrower and irregular (Figure 3c). With the oscillation and perturbation of the gas–liquid interface, the liquid phase accumulates and is lifted by the gas. Consequently, a liquid bridge is formed;
  • Intermittent or slug flow: This flow is characterized by irregular blocky and bullet-shaped bubbles (Figure 3d). Some giant bullet-shaped bubbles move closer to the top of the pipe, a process known as piston flow;
  • Stratified flow: The gas–liquid interface and each phase are distinct for stratified flow. The liquid flows at the bottom of the pipe, and the gas flows at the top (Figure 3e). Even if there is a wave in the gas–liquid interface in the images, they are identified as stratified flow if the wave does not hit the upper film and form a liquid bridge.

1.2.3. Vertical Pipeline

Figure 4 schematically illustrates the flow patterns observed in vertical pipelines for gas–liquid two-phase flow.
According to [34,35], the most common patterns for this inclination are as follows:
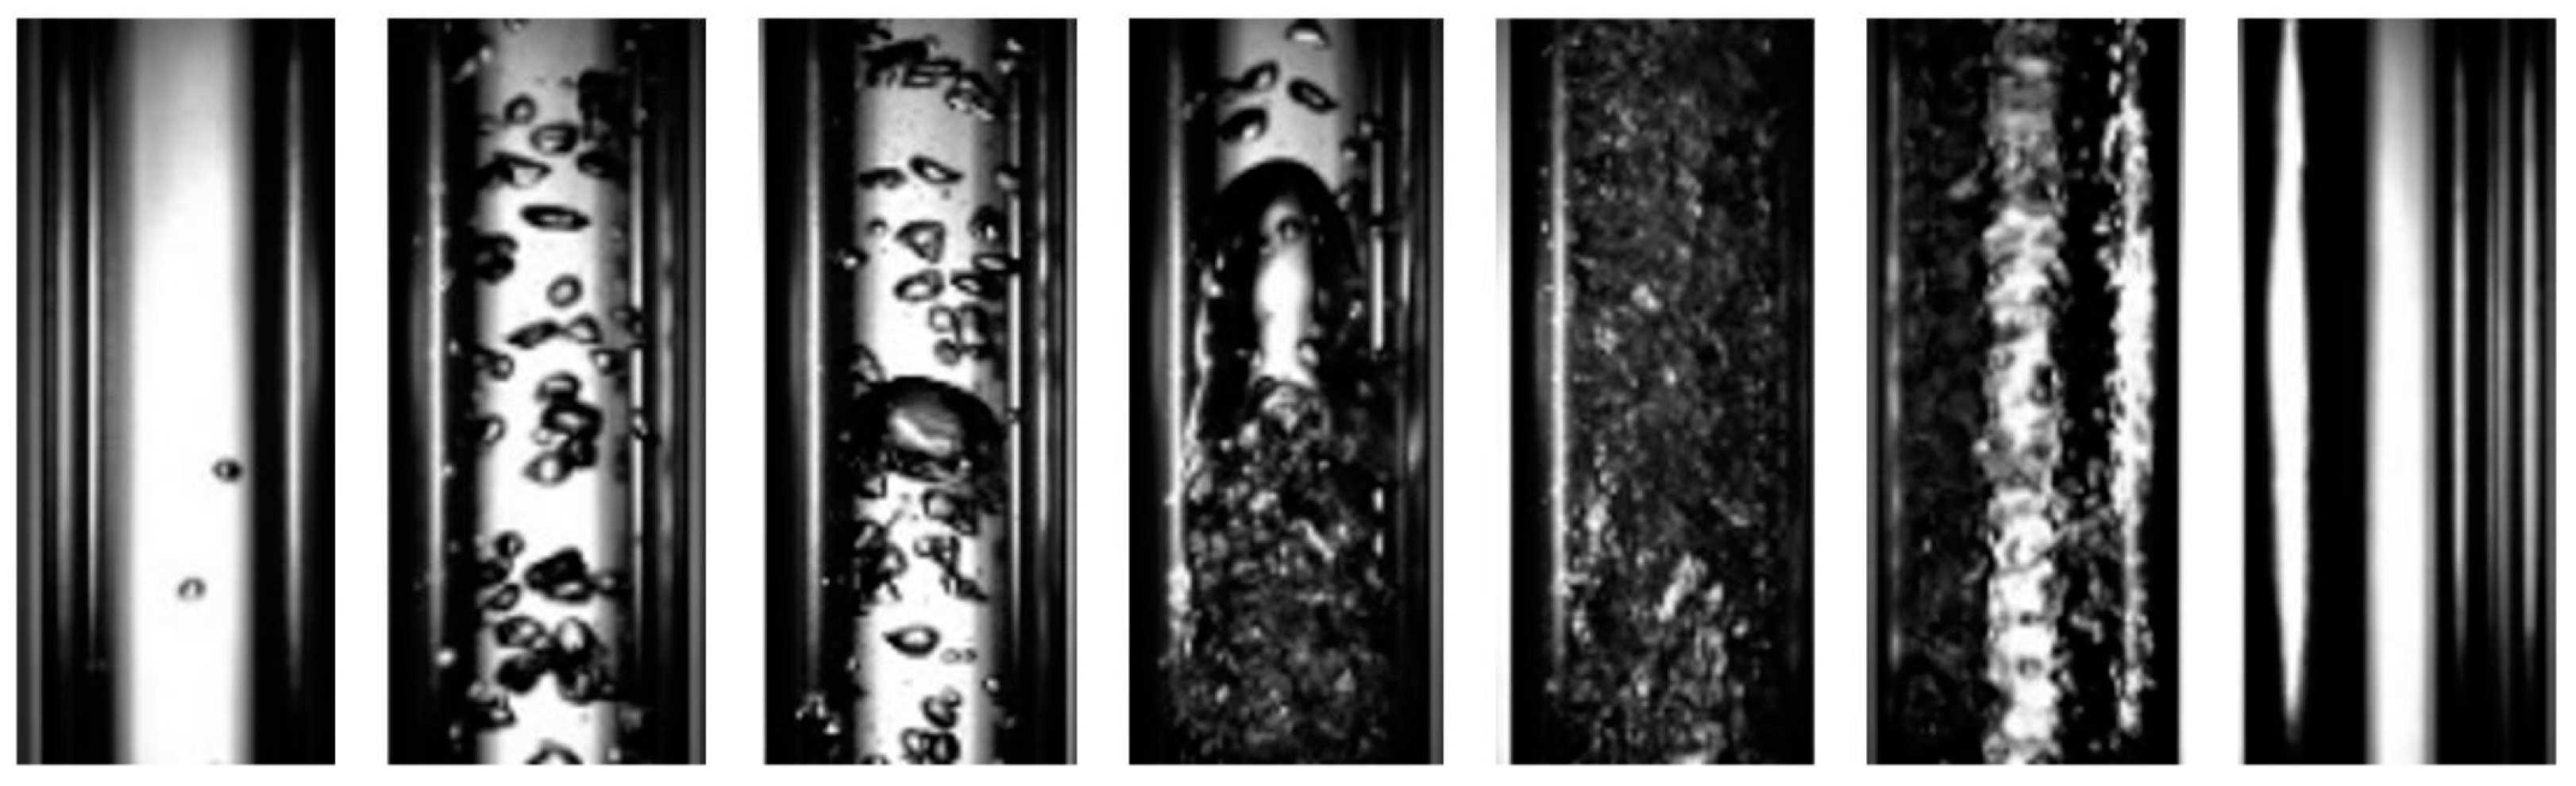
  • Liquid/tiny bubbles: A small number of tiny and discrete gas bubbles flow in a continuous liquid phase;
  • Small bubbles: A few small and discrete gas bubbles flow in a continuous liquid phase;
  • Large bubbles: Small and discrete gas bubbles, large spherical bubbles, and slug-like bubbles within the fluid flow in a continuous liquid phase;
  • Dense bubbles/Taylor bubbles: Many small- to medium-sized bubbles flow in a continuous liquid phase. The bubbles are distributed more consistently and densely along the image, with more than half of the tube’s visualization section occupied by bubbles. Taylor bubbles are also found in this frame;
  • Churn or agitation: A mixture of gas and liquid flowing chaotically, without visible bubbles;
  • Annular: A gas core forms from the center of the pipeline. A wavy liquid film flows along the pipeline walls, and liquid droplets are dispersed within the gas core;
  • Mist/vapor: No liquid is seen as a continuous gas phase flows through the channel.
When two or more phases flow through the same pipeline, they generate various configurations depending on operating conditions (temperature, pressure, and flow), fluid properties (surface tension, viscosity, concentration, and density), and pipe geometry (diameter, length, and inclination).

1.3. Characteristics Calculation to Determine Flow Patterns

Multiphase flows exhibit related hydrodynamic characteristics that are important for their identification, which are detailed below.

1.3.1. Volumetric Fractions

Volumetric fraction is the ratio between the volume occupied by a specific phase, such as water and/or oil, and the total volume of the mixture [36].

1.3.2. Injection Volumetric Fractions

The injection flow rates of the water (Qw) and oil (Qo) phases allow the determination of an essential characteristic in multiphase flows, called the injection volumetric fraction C of the phases. Equation (1) shows how it can be determined:
C w = Q w Q w + Q O , C O = Q O Q w + Q O

1.3.3. Surface Injection Velocities

The surface velocities of the water phase Jw and oil phase Jo, based on injection flow rates and the cross-sectional area of the pipeline, are defined in Equation (2) and allow the obtainment of the mixture velocity J by summing their magnitudes, as defined in Equation (3):
J w = Q w A , J o = Q o A
J = J w + J o
Combining Equations (2) and (3) yields the relationship of surface velocities with injection volumetric fractions. Equation (4) shows the relationship.
J w J O = C W C O

1.3.4. Holdup or In Situ Volumetric Fraction

In a two-phase flow, it is assumed that each phase occupies a fraction of the cross-sectional area of the pipe A. Specifically, Aw is the area occupied by water and Ao by oil, allowing the determination of the in situ volumetric fraction or holdup of each phase inside the pipe. Equation (5) shows the relationship.
ε w A w A , ε o = A o A

1.3.5. In Situ Velocities

Consequently, the superficial velocity of each fluid (Jw and Jo) differs from the in situ velocity of the same fluids (Vw and Vo) due to the slippage occurring between the phases of the multiphase mixture. These in situ velocities are calculated based on the flow rate through the specific area occupied by each phase, which is smaller than the cross-sectional area of the tube, also in Equation (6).
w w = Q w A w , V o = Q o A O

1.3.6. The Real In Situ Velocity

It can also be expressed in terms of the superficial velocity of the phase and its holdup, as shown in Equation (7):
w w = J w ε w , V O = J O ε O

1.4. Aim of This Work

This paper provides essential information on the hydrodynamic characterization of two-phase liquid–gas flows by offering a comprehensive literature review, detailed bibliometric analysis (BA), and synthesis of current results and trends because a BA is not reported in the open literature. Its comprehensive approach and critical analysis make it an important reference for the scientific and technical community interested in this topic. Therefore, the following aspects are considered:
(1)
The article provides a comprehensive and updated review of the state-of-the-art use of artificial intelligence techniques to characterize two-phase liquid–gas flows in a hydrodynamic manner. This review allows researchers and professionals to understand the current research landscape, identify emerging trends, and evaluate the progress made in developing new methodologies;
(2)
A bibliometric analysis is carried out that quantitatively examines scientific production in the area, including the number of publications, publication trends over time, major thematic areas addressed, and geographic distribution of authors. This analysis provides an overview of research activity in artificial intelligence applied to characterizing two-phase liquid–gas flows;
(3)
Different approaches and methodologies used in applying artificial intelligence for hydrodynamic characterization of two-phase flows are identified and described. These include convolutional neural networks, recurrent neural networks, multilayer perceptrons, image processing techniques, and video analysis integration;
(4)
Based on the review and bibliometric analysis, the article synthesizes the main results obtained in the literature, highlighting significant advances, challenges yet to be overcome, and possible future research directions. This synthesis provides valuable guidance for researchers and professionals interested in further advancing the field.

2. Methodology

The advancement of Industry 4.0 in recent years has led the petrochemical industry to focus on developing new technologies that enable the acquisition of updated systems for the precise measurement of multiphase flow. Multiphase flow is a concurrent flow of substances in certain states or phases (solid, liquid, and gas), which generate a layer of separation with a mixture between the phases or characteristic patterns derived from the initial hydrodynamic parameters of the flow when transported through pipes.
The main objectives of the petrochemical industry are to improve process efficiency, reduce costs, production, and product transportation times, and increase operational safety. Hence, further investigation of the phenomenological and hydrodynamic behavior of multiphase flows is necessary to generate models that simplify industrial processes.
Fluid parameters such as flow velocity, retention, pressure, and phase distribution obtained from sensors can describe flow behavior from different aspects, laying the foundation for monitoring the state of multiphase flow. Given the importance of process control in the petrochemical industry, there is a need to characterize fluids inside pipelines. This work describes the hydrodynamic characteristics of multiphase flows and details the flow regimes or patterns that form in horizontal and vertical pipelines for different mixtures.
Considering the above, this work employs a mixed-method approach with an exploratory methodology consisting of a systematic literature review and descriptive analysis. The objective and contribution are to analyze the current state of artificial intelligence techniques applied for the hydrodynamic characterization of liquid–gas two-phase flows in the petroleum industry. The aim is to determine which artificial intelligence techniques have been used to detect flow regimes or patterns and identify other characteristics, such as the mixture’s volumetric fractions of each fluid, velocities, and viscosities.
The systematic literature review proposed in Li et al., 2024 [37] was conducted using the PRISMA statement [38,39], followed by bibliometric analysis using VOS viewer (version 1.6.20) and Bibliometric software (https://www.vosviewer.com/download), allowing statistical and mathematical techniques to be applied through bibliometrics, a branch of scientometrics, for the retrieval, organization, and analysis of indexed scientific documents [40,41,42].

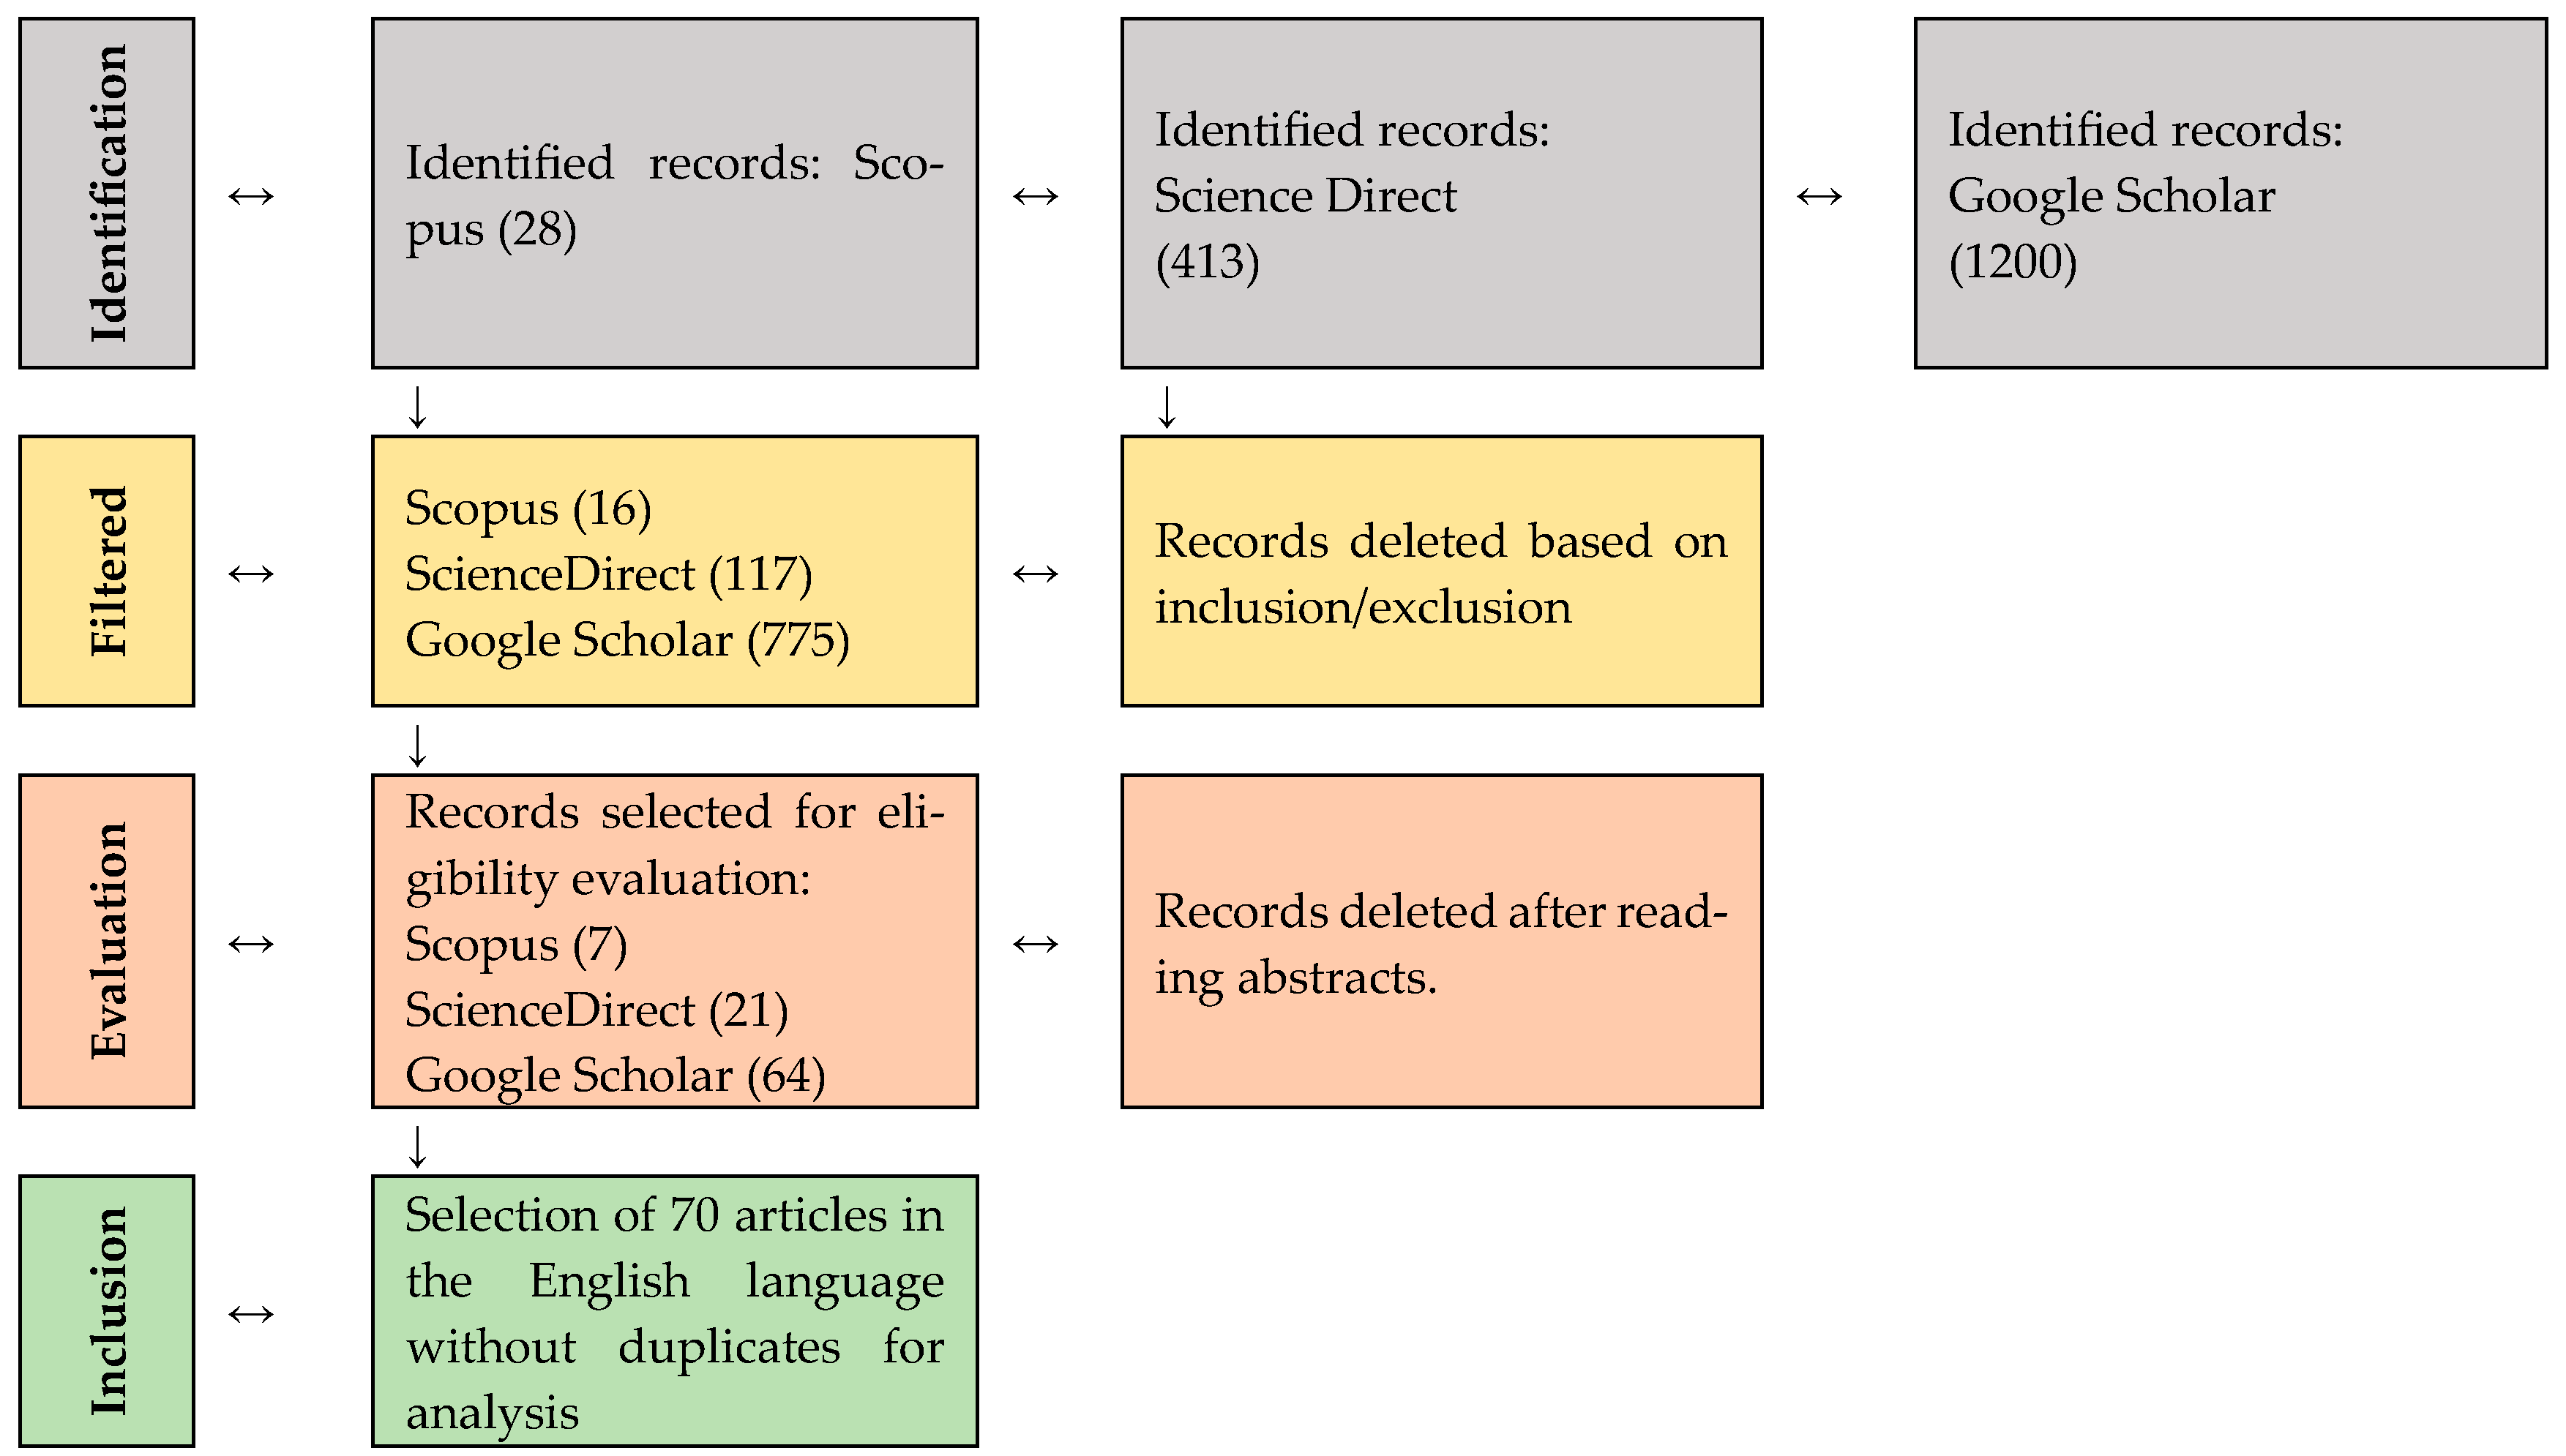
2.1. Systematic Literature Review

The PRISMA statement proposed in Ciapponi 2021 [39] was used to conduct the systematic literature review and is adopted for identifying sources, search strategy, and data analysis. Figure 5 depicts the PRISMA flow diagram utilized for the identification, screening, eligibility, and inclusion of scientific documents.

2.1.1. Search Strategy

The following questions were formulated to establish the search for articles:
  • What artificial intelligence techniques have been used to detect pipeline liquid–gas two-phase flow patterns?
  • What artificial intelligence techniques have been used to determine volumetric fractions in liquid–gas two-phase flows in pipelines?
Considering the above, Table 1 presents the search equation for retrieving studies from the Science Direct, Scopus, and Google Scholar databases. The research equation was applied to databases’ topic, focus, and context for document searches.

2.1.2. Inclusion Criteria

The literature review was conducted within a search range between 2019 and 2024, utilizing keywords including artificial intelligence, machine learning, two-phase flow, liquid–gas flow, and volume fraction—two-phase flow. Additionally, articles written in English were selected because most scientific documentation was published in this language [34,37]. The selected databases were Science Direct, Scopus, and Google Scholar. Table 2 summarizes the inclusion and exclusion criteria for information related to scientific publications.

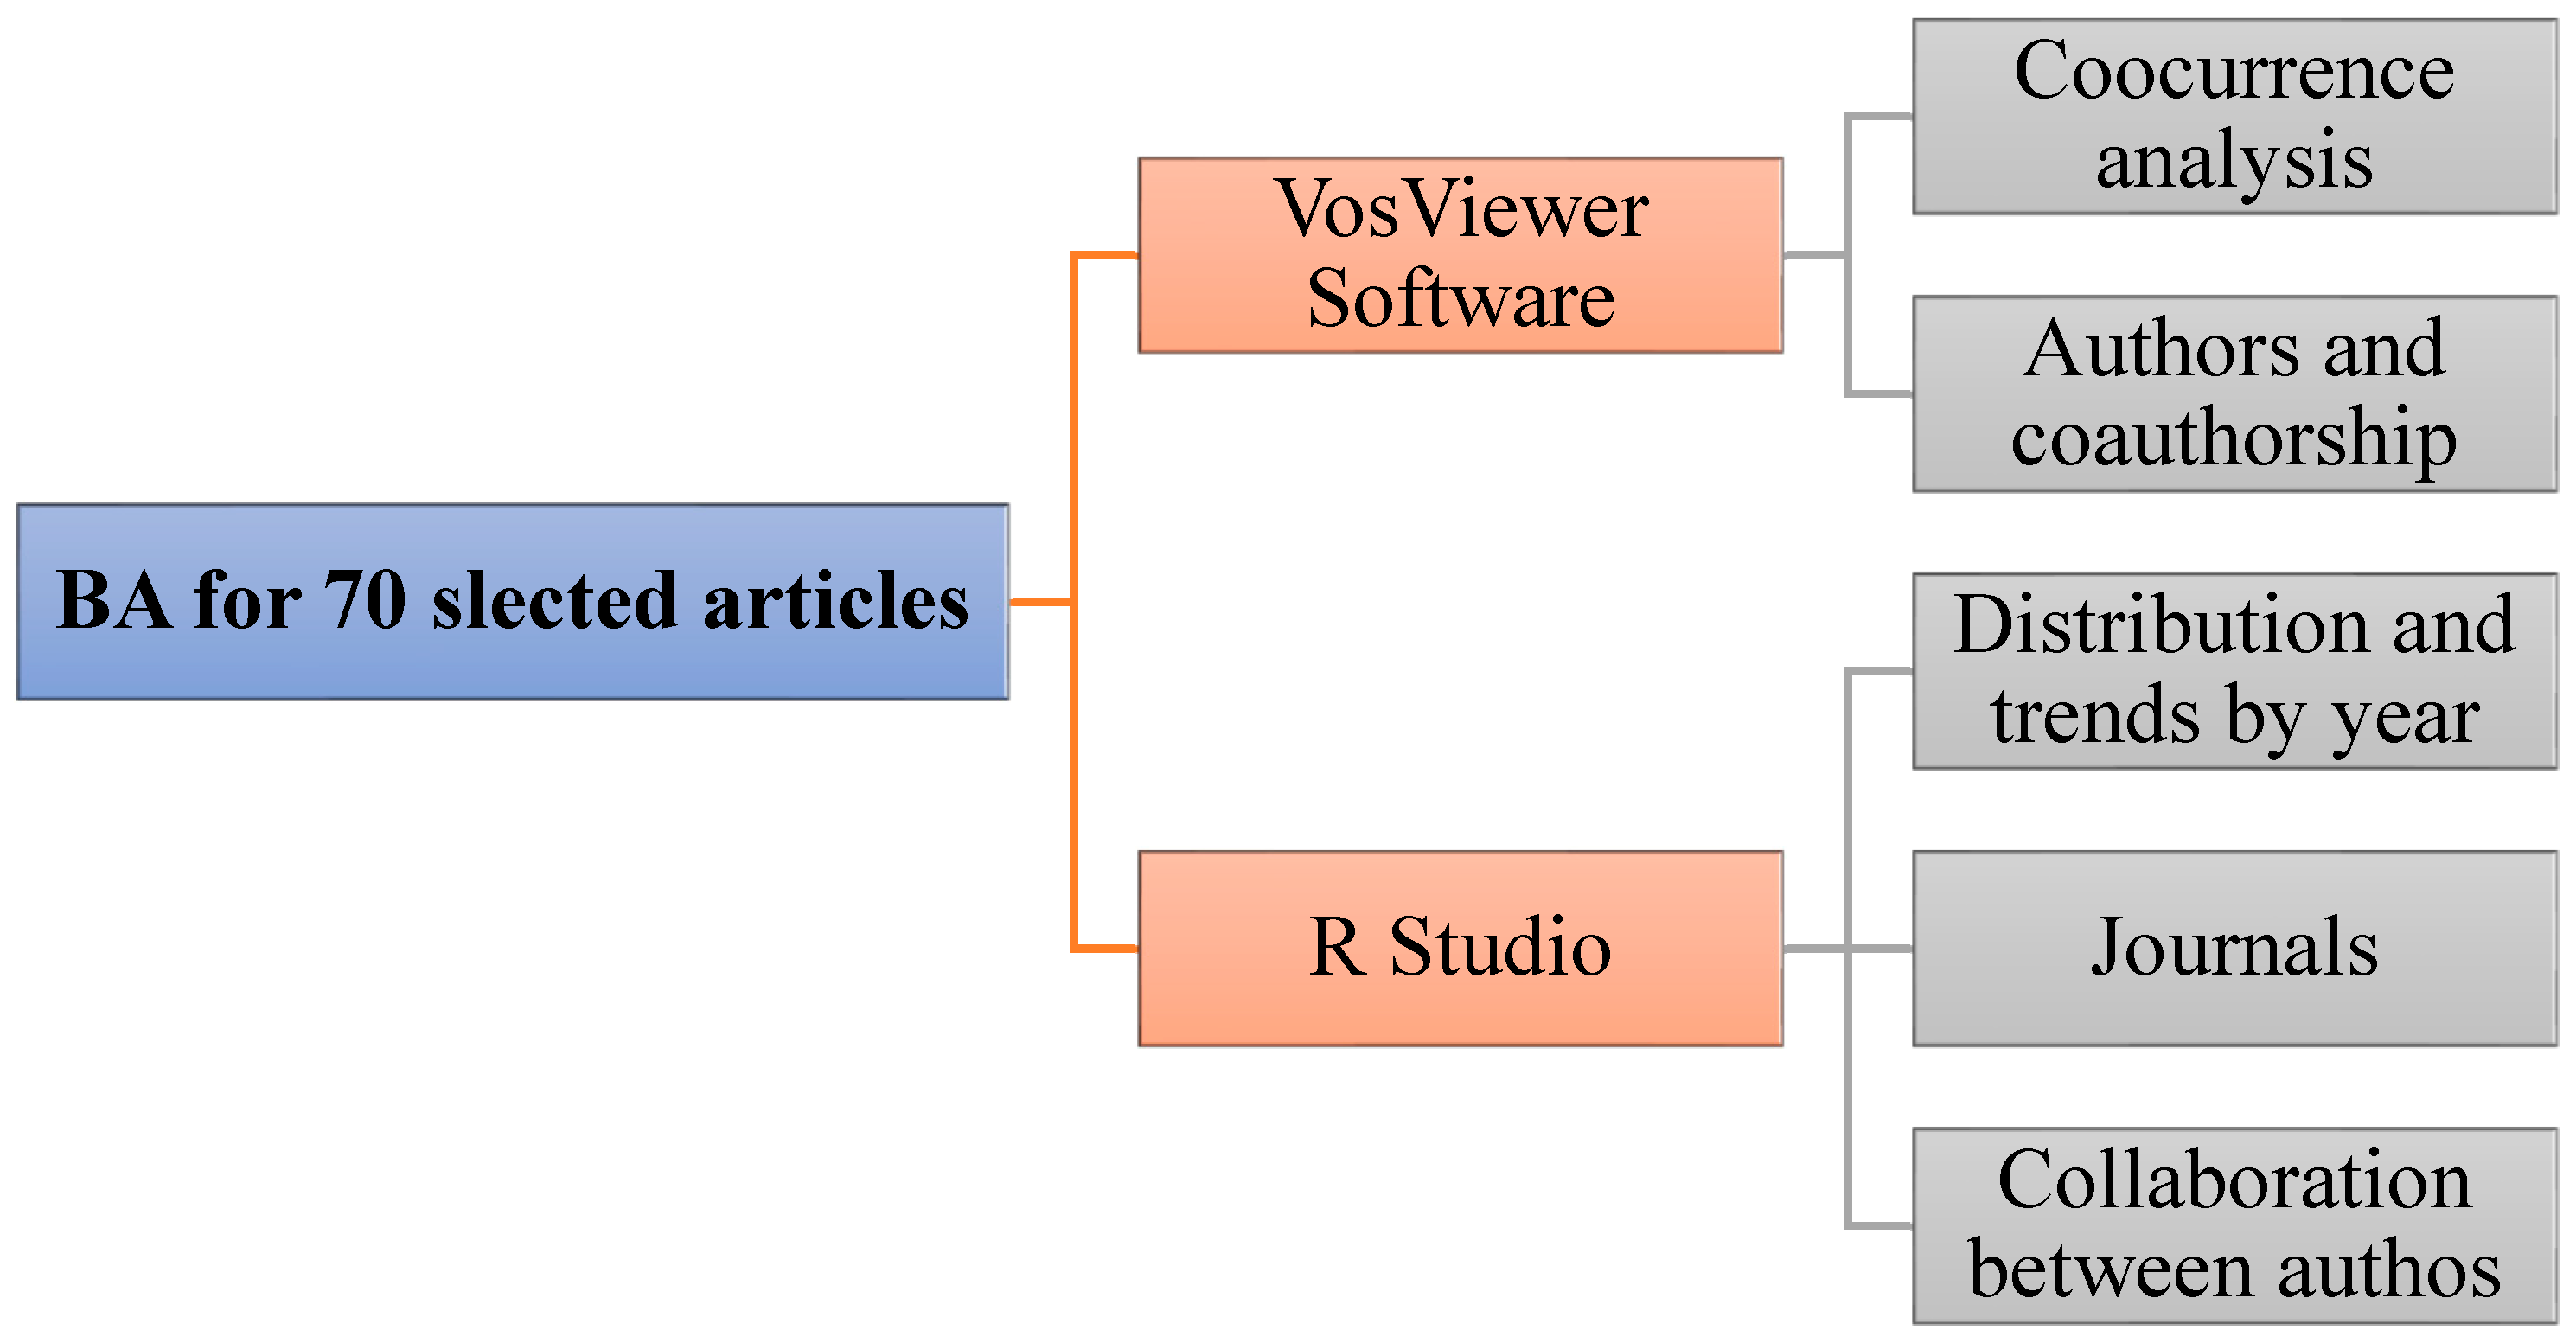
2.2. Bibliometric Analysis (BA)

Following the systematic literature review, a bibliometric analysis was conducted using the Scopus database, which is considered the most authoritative database, covering more publications than other sources [44,45,46]. However, ScienceDirect and Google Scholar databases were also utilized to avoid limiting it solely to this database, covering additional publications. The time period was limited from 2019 to 2024. For the analysis, VOS viewer and Bibliometric software were employed. Figure 6 illustrates the methodology used.
Figure 6 depicts the steps involved in the bibliometric analysis, including data collection from multiple databases, selection of the time period, utilization of VOS viewer and Bibliometric software for analysis, and visualization of results.

3. Results and Discussions

3.1. Artificial Intelligence Techniques Used for Hydrodynamic Characterization of Two-Phase Flow

In the systematic literature review, a total of 70 articles were collected, from which information was gathered and analyzed regarding the selected search questions, and the results are presented below:

Support Vector Machine (SVM)
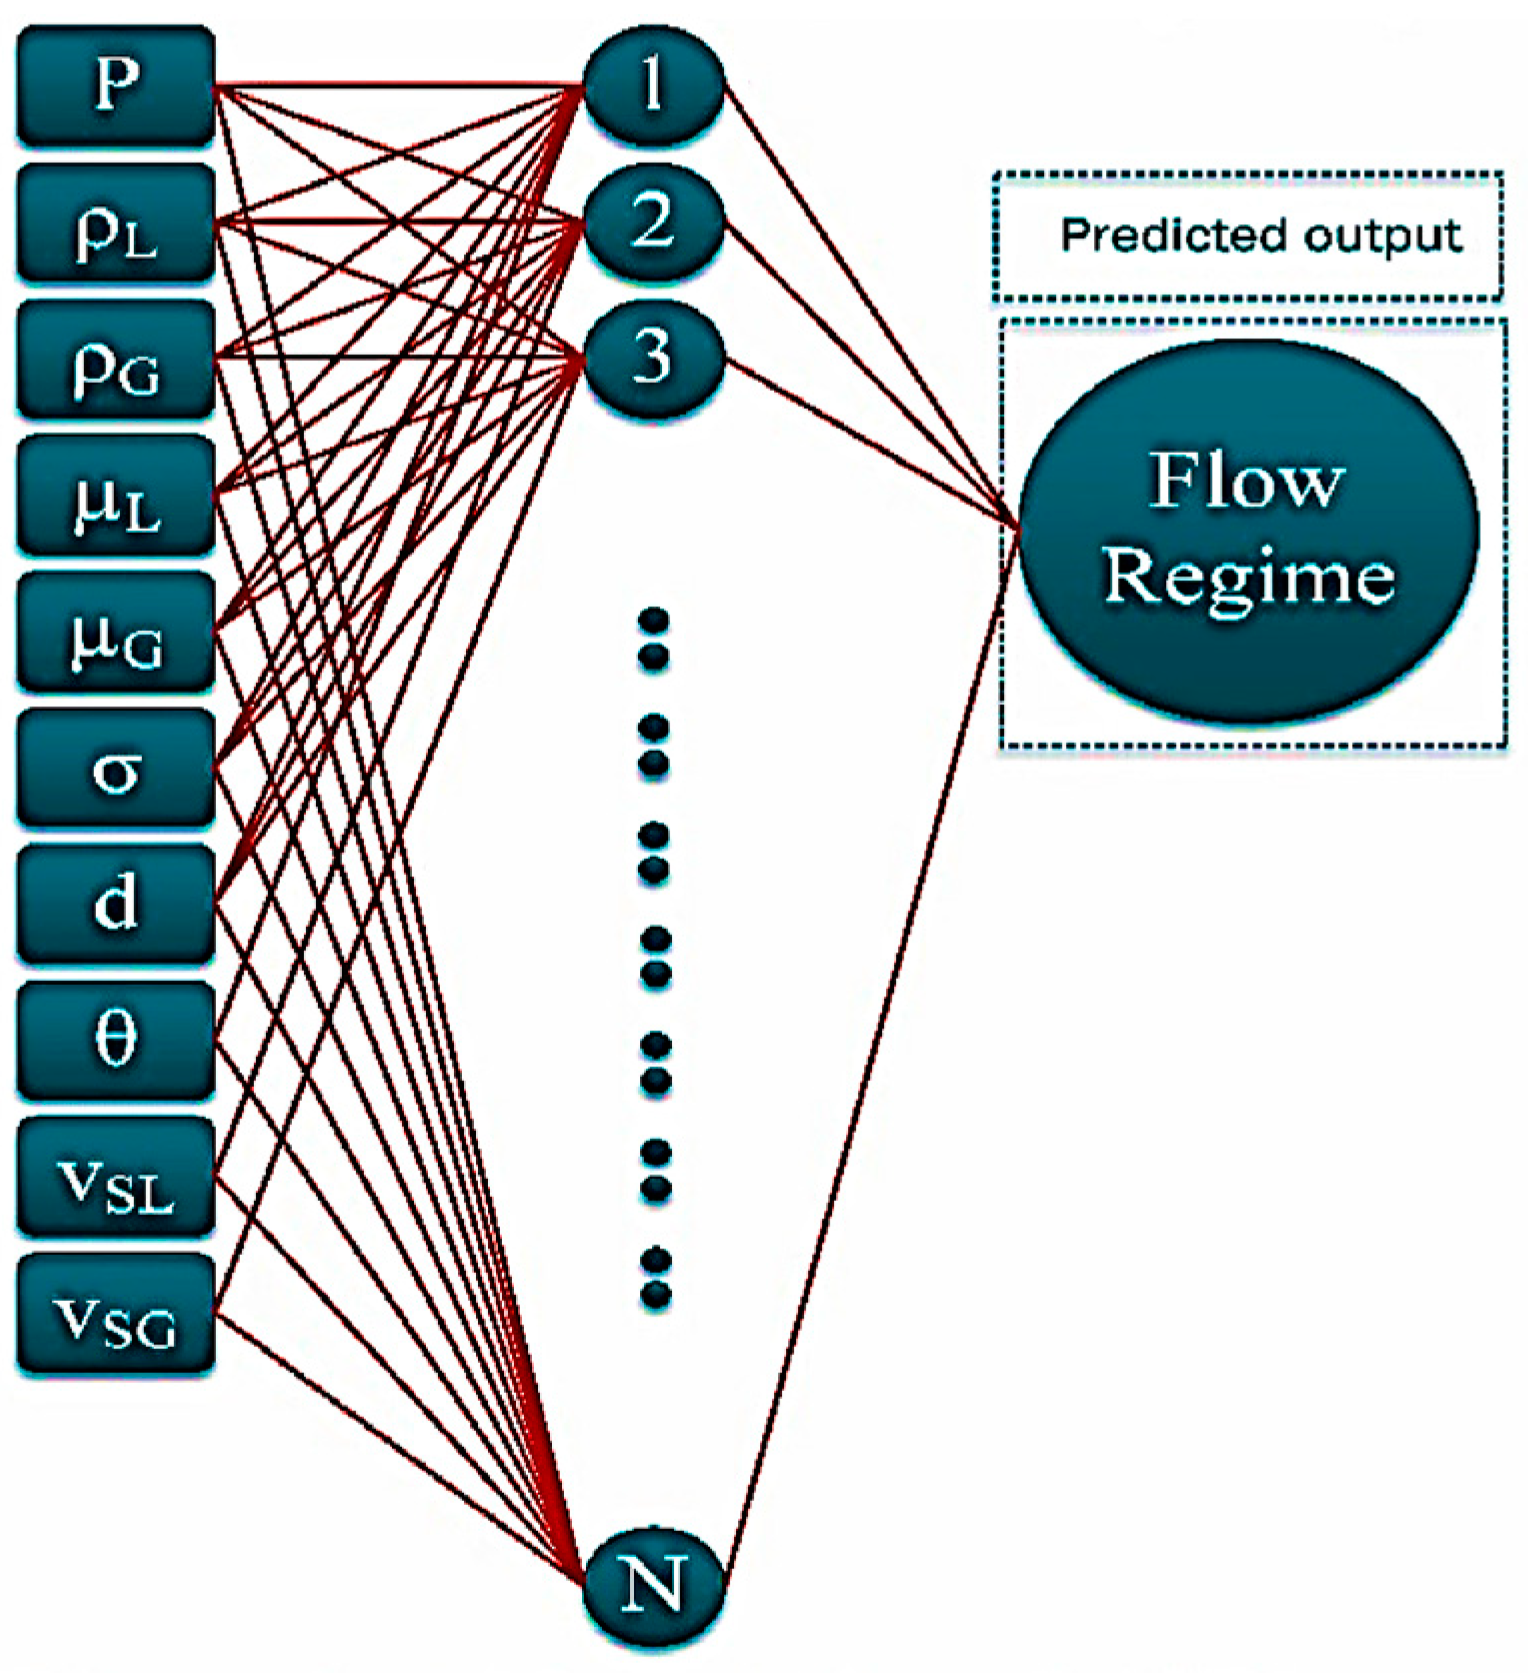
The analyzed results for the SVM method are presented in Table 3, where it can be defined that, depending on the measurement instrument and pipeline characteristics, good accuracy can be achieved in obtaining different flow patterns.

3.2. Neural Network

Artificial neural networks are an advanced method for predicting flow patterns, volumetric fractions, and pressure gradients based on data measured using an intrusive or non-intrusive technique [50,51].

3.2.1. Data-Driven Approaches

AlSaif et al., 2022 [52] employed an artificial neural network (ANN) model to forecast the two-phase flow pattern across horizontal and vertical pipelines, encompassing various inclination angles. The ANN model was fed with inputs including pipe geometry (diameter, inclination), fluid properties (viscosity, density, surface tension), and fluid condition (velocity, pressure). These inputs were employed to implement the model using ten-dimensional inputs and corresponding dimensionless variables (liquid and gas surface, Reynolds numbers, Froude mixtures numbers, and Weber numbers). From a dataset comprising 8766 experimental samples, 70%, 15%, and 10% were randomly selected for the flow pattern model training, validation, and testing, respectively (See Figure 7).
The ANN architecture consists of three layers; an input layer, one or more hidden layers, and an output layer. The number of neurons in the input layer corresponds to the input parameters, while the output layer matches the output parameters. The Levenberg–Marquardt backpropagation and Bayesian regularization methods, known for effectively minimizing mean squared error, were employed to train the ANN model. The selected ANN exhibited a high prediction performance, achieving an overall accuracy of 97.30%.
Ruiz-Diaz et al., 2021 [53] used a multilayer perceptron neural network with backpropagation to identify the volume fraction of flow composed of water and mineral oil in a 12 m horizontal pipe.

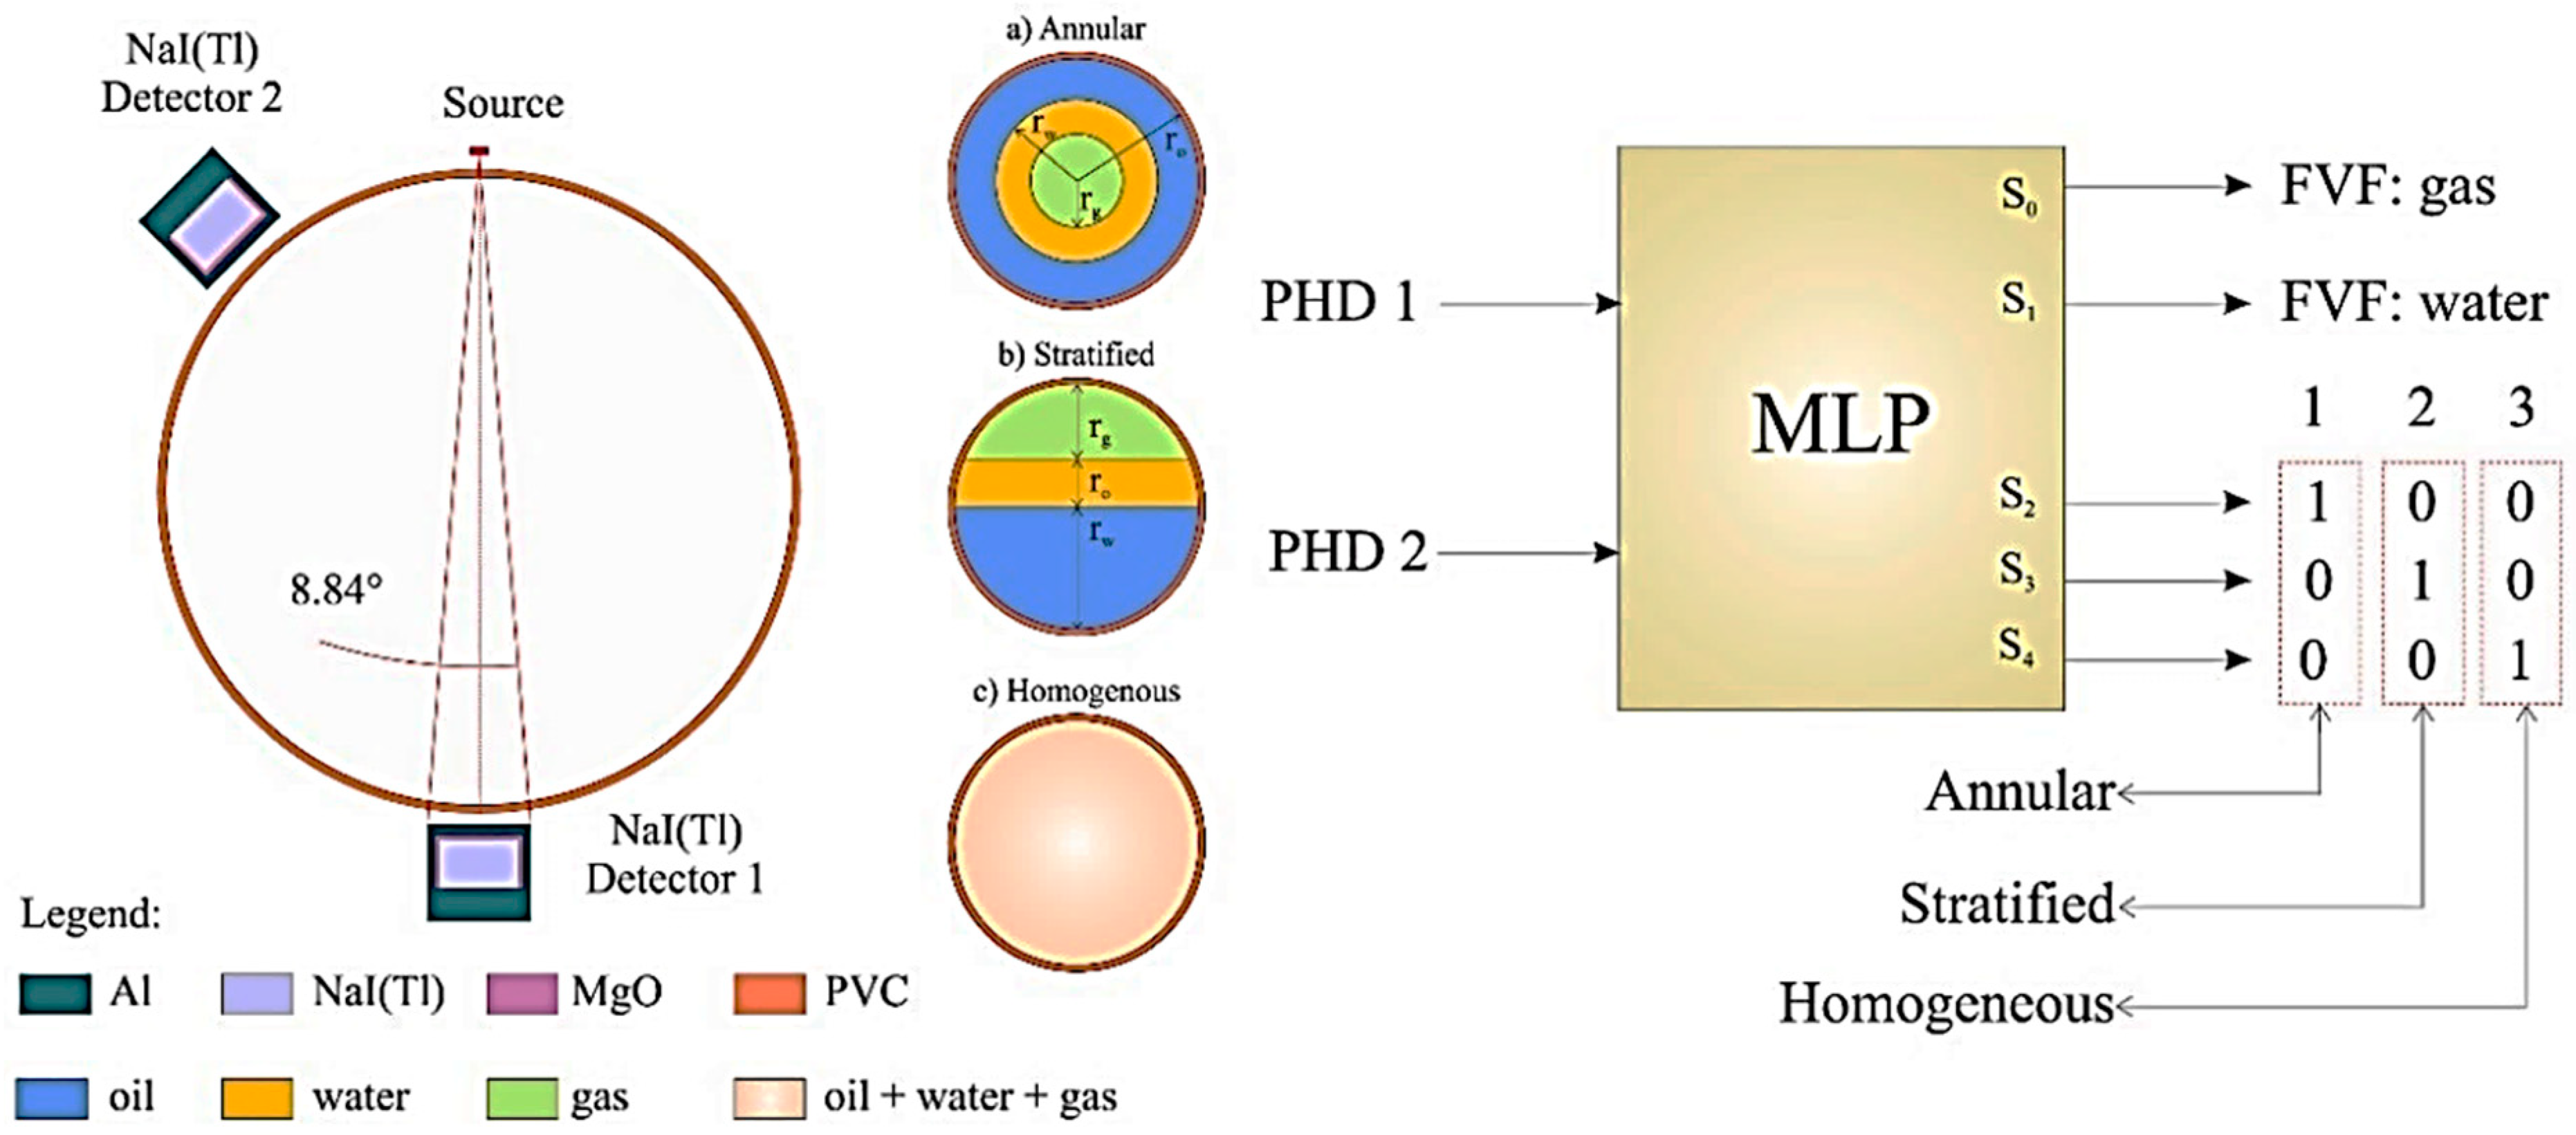
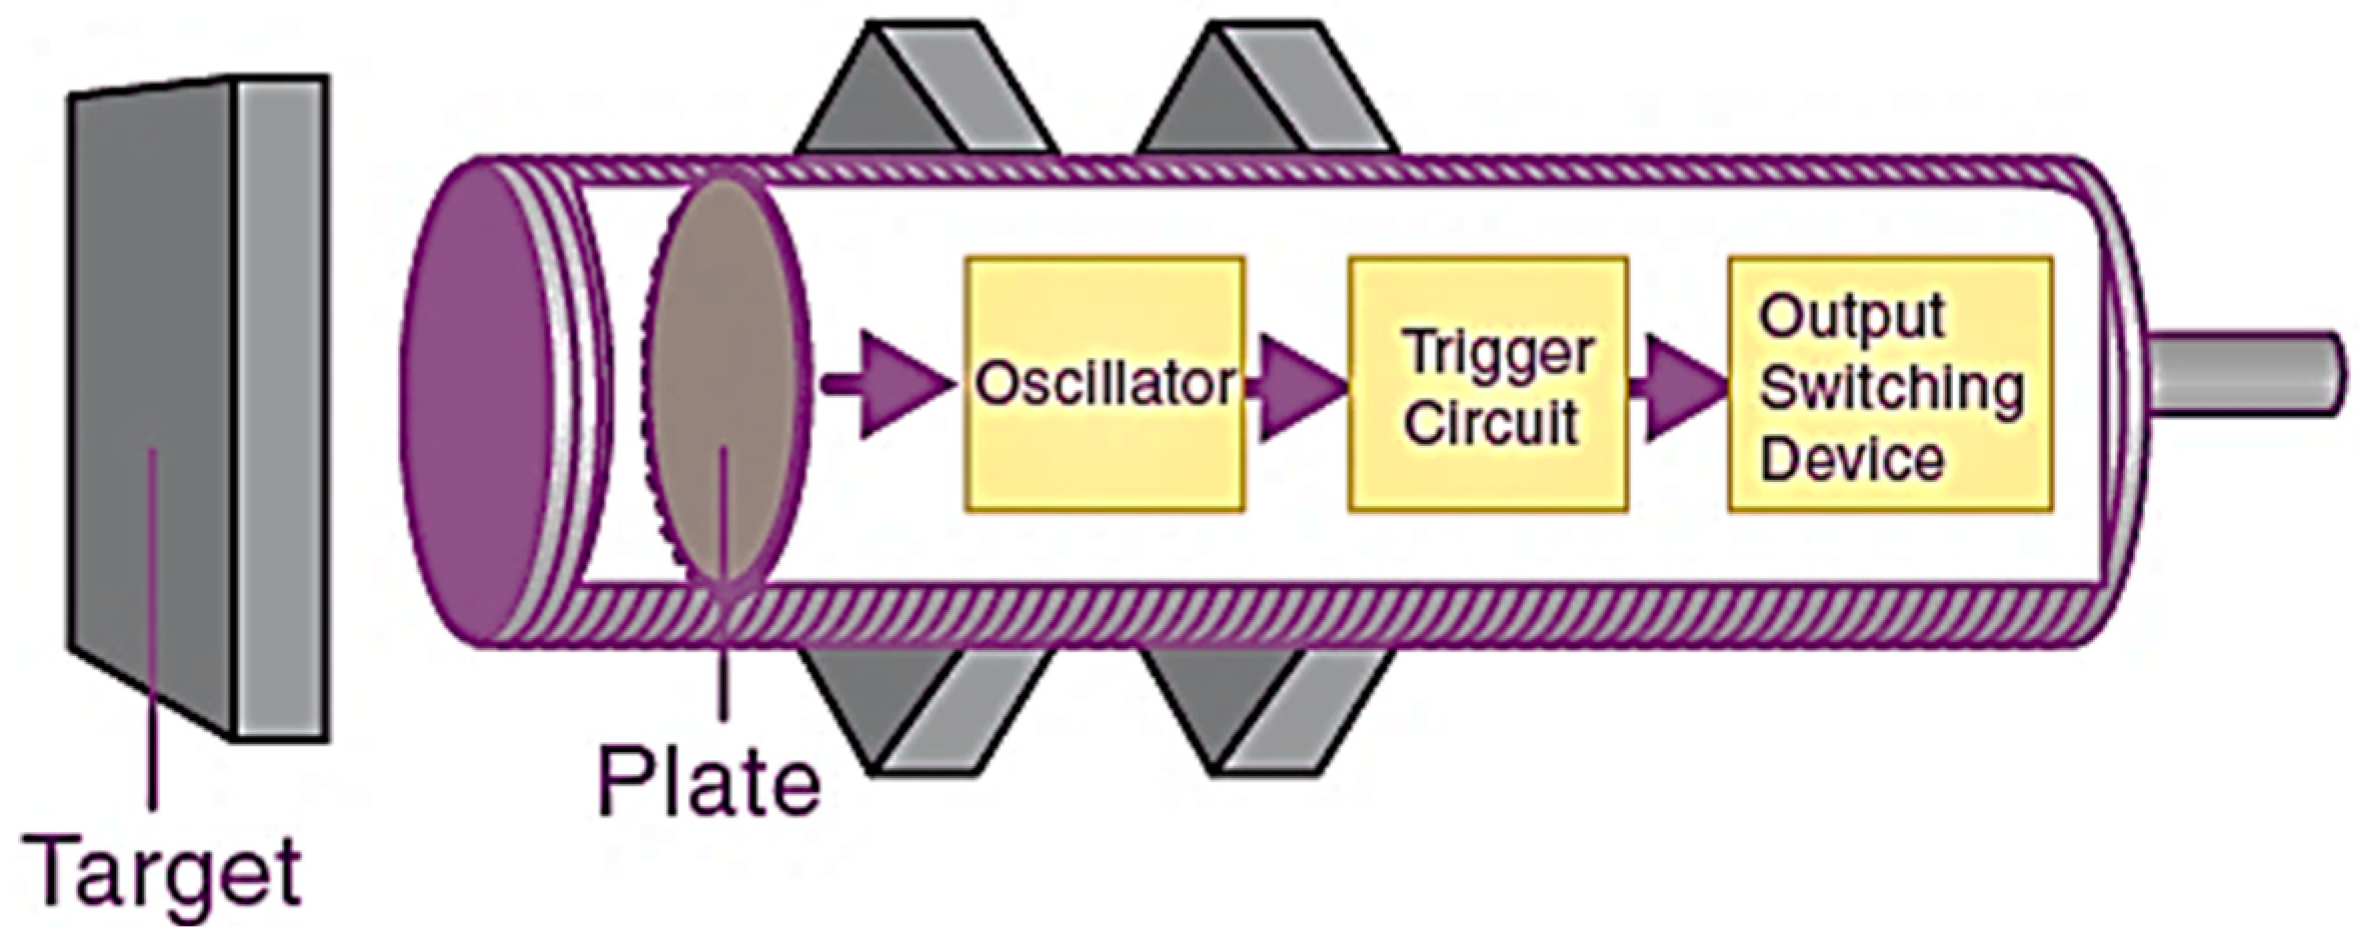
3.2.2. Gamma Ray Sensor

Salgado et al., 2021 [54] developed a method which was devised utilizing gamma-ray densitometry, employing a multilayer perceptron within an artificial neural network (ANN) framework to discern the flow regime and forecast the volumetric fraction of gas, water, and oil in multiphase flow. The detection system is equipped with two NaI(Tl) scintillation detectors tasked with capturing transmission and scattering beams alongside a source featuring two gamma-ray energies, thus forming the detection geometry, as shown in Figure 8.
The gamma-ray spectra recorded by both detectors were assigned as input data to the artificial neural network. The flow regimes identified were stratified, homogeneous, and annular. All three flow regimes were correctly distinguished for 98% of the investigated patterns, and the volumetric fraction in multiphase systems was predicted with a relative error of less than 5% for gas and water phases.
Table 4 provides an overview of the structure, learning method, and purpose of frequently utilized artificial neural networks (ANNs) in engineering. It also comprehensively overviews various ANN topologies and their corresponding functions. Multilayer perceptron (MLP), backpropagation (BRF), wavelet neural network (WNN), and extreme learning machine (ELM) are among the ANNs listed, each serving functions such as pattern recognition, function approximation, and classification. Recurrent networks like Elman and Hopfield are tailored for time-series forecasting, associative memory, and optimization. Self-organizing maps, exemplified by Kohonen networks, excel in pattern recognition and classification. Probabilistic neural networks (PNNs) and cellular neural networks (CNNs) find applications in classification and optimization tasks. Additionally, committee machine (CM) employs multiple neural networks for diverse functions such as pattern recognition and modeling. A specific example includes MLP for predicting weight percent conversion and coke yield, while SOC-CNN is involved in modeling and operational optimization. These ANNs, with varying topologies and functions, cater to various tasks in fields like modeling, optimization, and predictive analysis within the context of neural network applications.
Figueiredo et al., 2016 [55] utilized a set of four ultrasonic sensors along with an artificial neural network (ANN) to discern the flow pattern and determine the gas volume fraction in a two-phase flow scenario. As depicted in Figure 9, the ANN’s input consists of energy ratios derived from the four acoustic sensors. The ANN model comprises two hidden layers, with five and two hidden neurons, respectively. The output layer of the ANN provides either the recognized flow pattern or the estimated gas volume fraction, which is important when considering the position angles for the sensors.
Table 5 presents the studies using gamma-ray sensors to characterize flow patterns and volumetric fractions. When analyzing each article (published from 2020 to 2023), it was evident that some references used simulation software (https://www.r-studio.com/es/) to represent the sensors and obtain data for training neural networks. Furthermore, these studies conducted in different years present a variety of approaches in terms of the artificial techniques used, measurement instruments, accuracy obtained, and specific flow characteristics. Additionally, the advancement of technology and the application of artificial intelligence techniques, such as neural networks, have revolutionized the way challenges are addressed in various fields, including the measurement and prediction of physical phenomena. In the context of parameter measurement in two-phase flow systems, such as fluid transport pipelines, different methods based on artificial intelligence have been developed to improve the accuracy and efficiency of data acquisition.

3.2.3. Capacitive Sensors

Capacitive sensors are devices used to detect the presence of gases and measure their properties and their main components are detailed in Figure 10. These sensors measure changes in electrical capacitance between two conducting plates when a gas interacts with them. As gas molecules approach the sensor plates, they alter the electric field between them, resulting in a change in capacitance. This change is then converted into an electrical signal that can be measured and analyzed to determine the gas’s presence, concentration, or other characteristics.
Chen et al., 2023 [63] employed a neural network to forecast the gas percentage in a two-phase fluid, regardless of changes in the liquid phase. To gather data for the neural network, a novel combined sensor employing capacitance consisted of a concave sensor and a ring sensor. The trained network adopted a multilayer perceptron (MLP) architecture and was implemented using MATLAB software. Leveraging the precise measurement system, the MLP model could predict the void fraction with a mean absolute error (MAE) of 4.919 [64,65]. These studies used COMSOL Multiphysics software to simulate a concave sensor in a homogeneous regime and established an experimental sample to evaluate the results. The objective was to predict the void fraction of a homogeneous air–liquid two-phase regime independently of liquid phase changes.

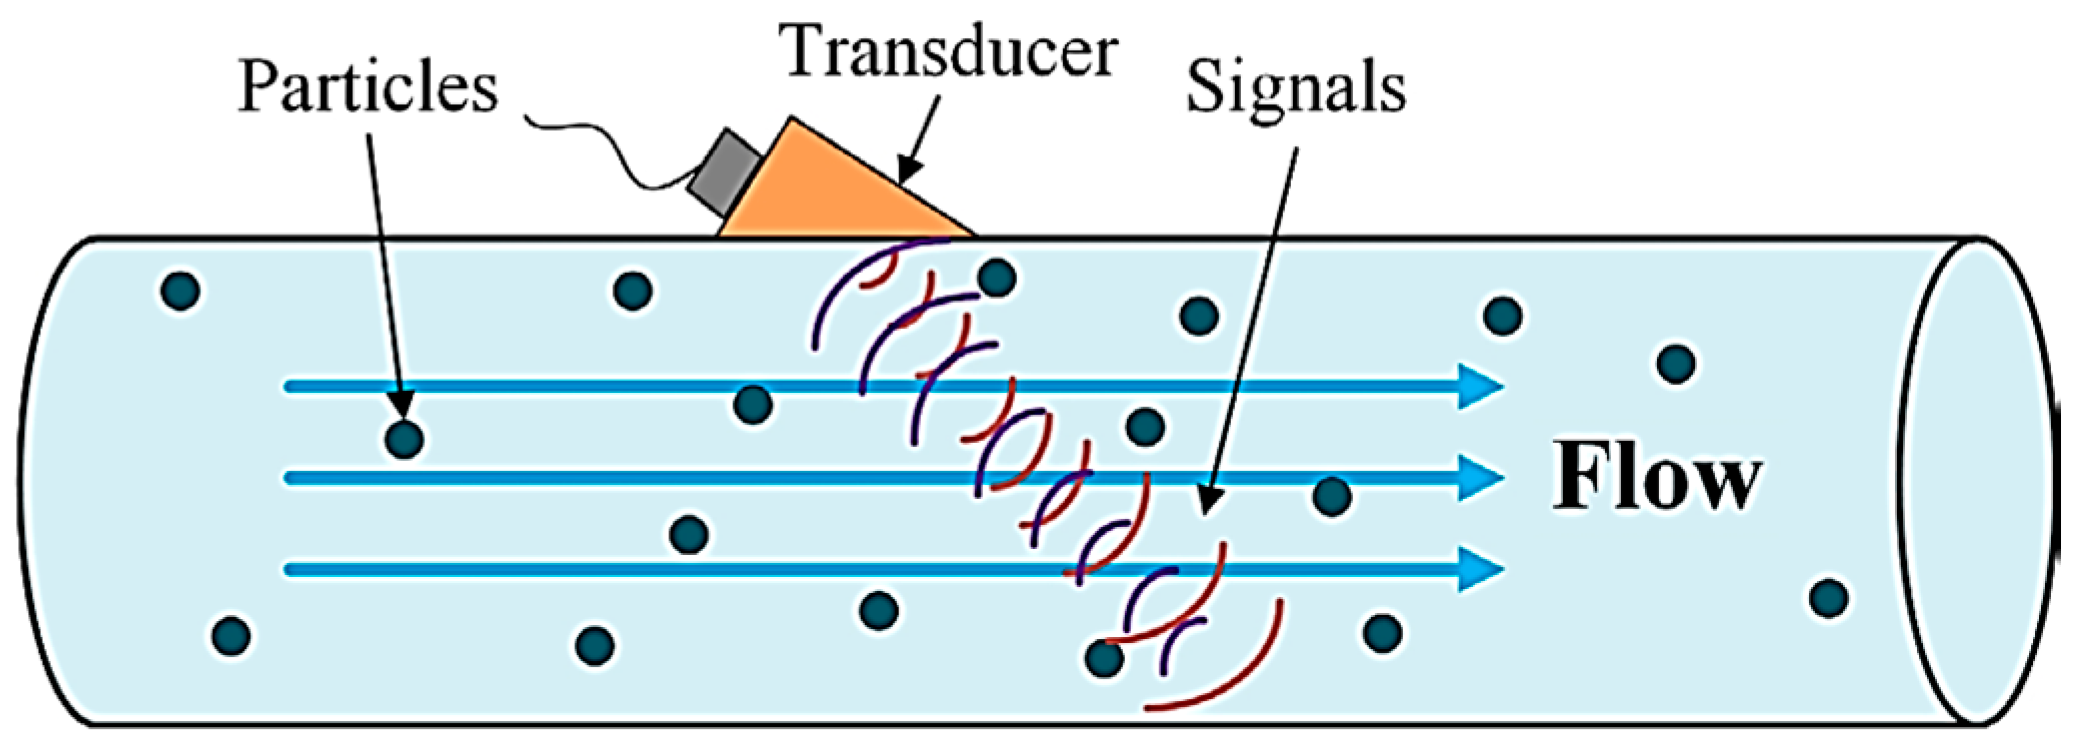
3.2.4. Doppler Ultrasonic Sensor

Doppler ultrasonic flowmeters function by detecting changes in frequency, known as the Doppler effect, of a signal transmitted into a flowing liquid stream within a pipe. This signal reflects off bubbles or particles in the stream and returns to the transducer (See Figure 11). When the flow moves away from the sensor, the signal frequency decreases. The flowmeter then contrasts this frequency shift with the initial signal and computes the flow velocity. In this way, to guarantee precise measurements with Doppler-type ultrasonic flowmeters, the fluid must contain a satisfactory concentration of particles or bubbles to effectively reflect the signal.
These flowmeters are effective in suspension flows where the particle concentration exceeds 100 parts per million, and the particle size ranges from larger than 100 μm to less than 15 percent in concentration. However, they are not suitable for use with clean water. Doppler flowmeters typically feature only one transducer, making the measurement setup simpler than transit time flowmeters, which affects their cost.
Nnabuife et al., 2022 [67] proposed a method for classifying flow regimes using a feedforward neural network with 20 hidden neurons. They considered an ultrasonic signal of flows using a discrete wavelet transform (DWT) or power spectral density (PSD). The flow regimes were classified into four types; annular, swirling, slug, and bubbly, with an accuracy of 95.8%.

3.2.5. Pressure Gradient

Ajbar et al., 2024 [68] proposed artificial intelligence techniques (shallow neural networks) and conventional correlations to evaluate their accuracy in predicting smooth pipes’ two-phase friction pressure gradient. For this purpose, these authors collected 8000 experimental data points of two-phase friction pressure drop from 49 independent sources in the scientific literature. The neural network demonstrated, therefore, higher overall accuracy. However, using artificial neural networks does not guarantee a physical trend, which is preserved with conventional prediction methods.

3.3. Convolutional Neural Network (CNN)

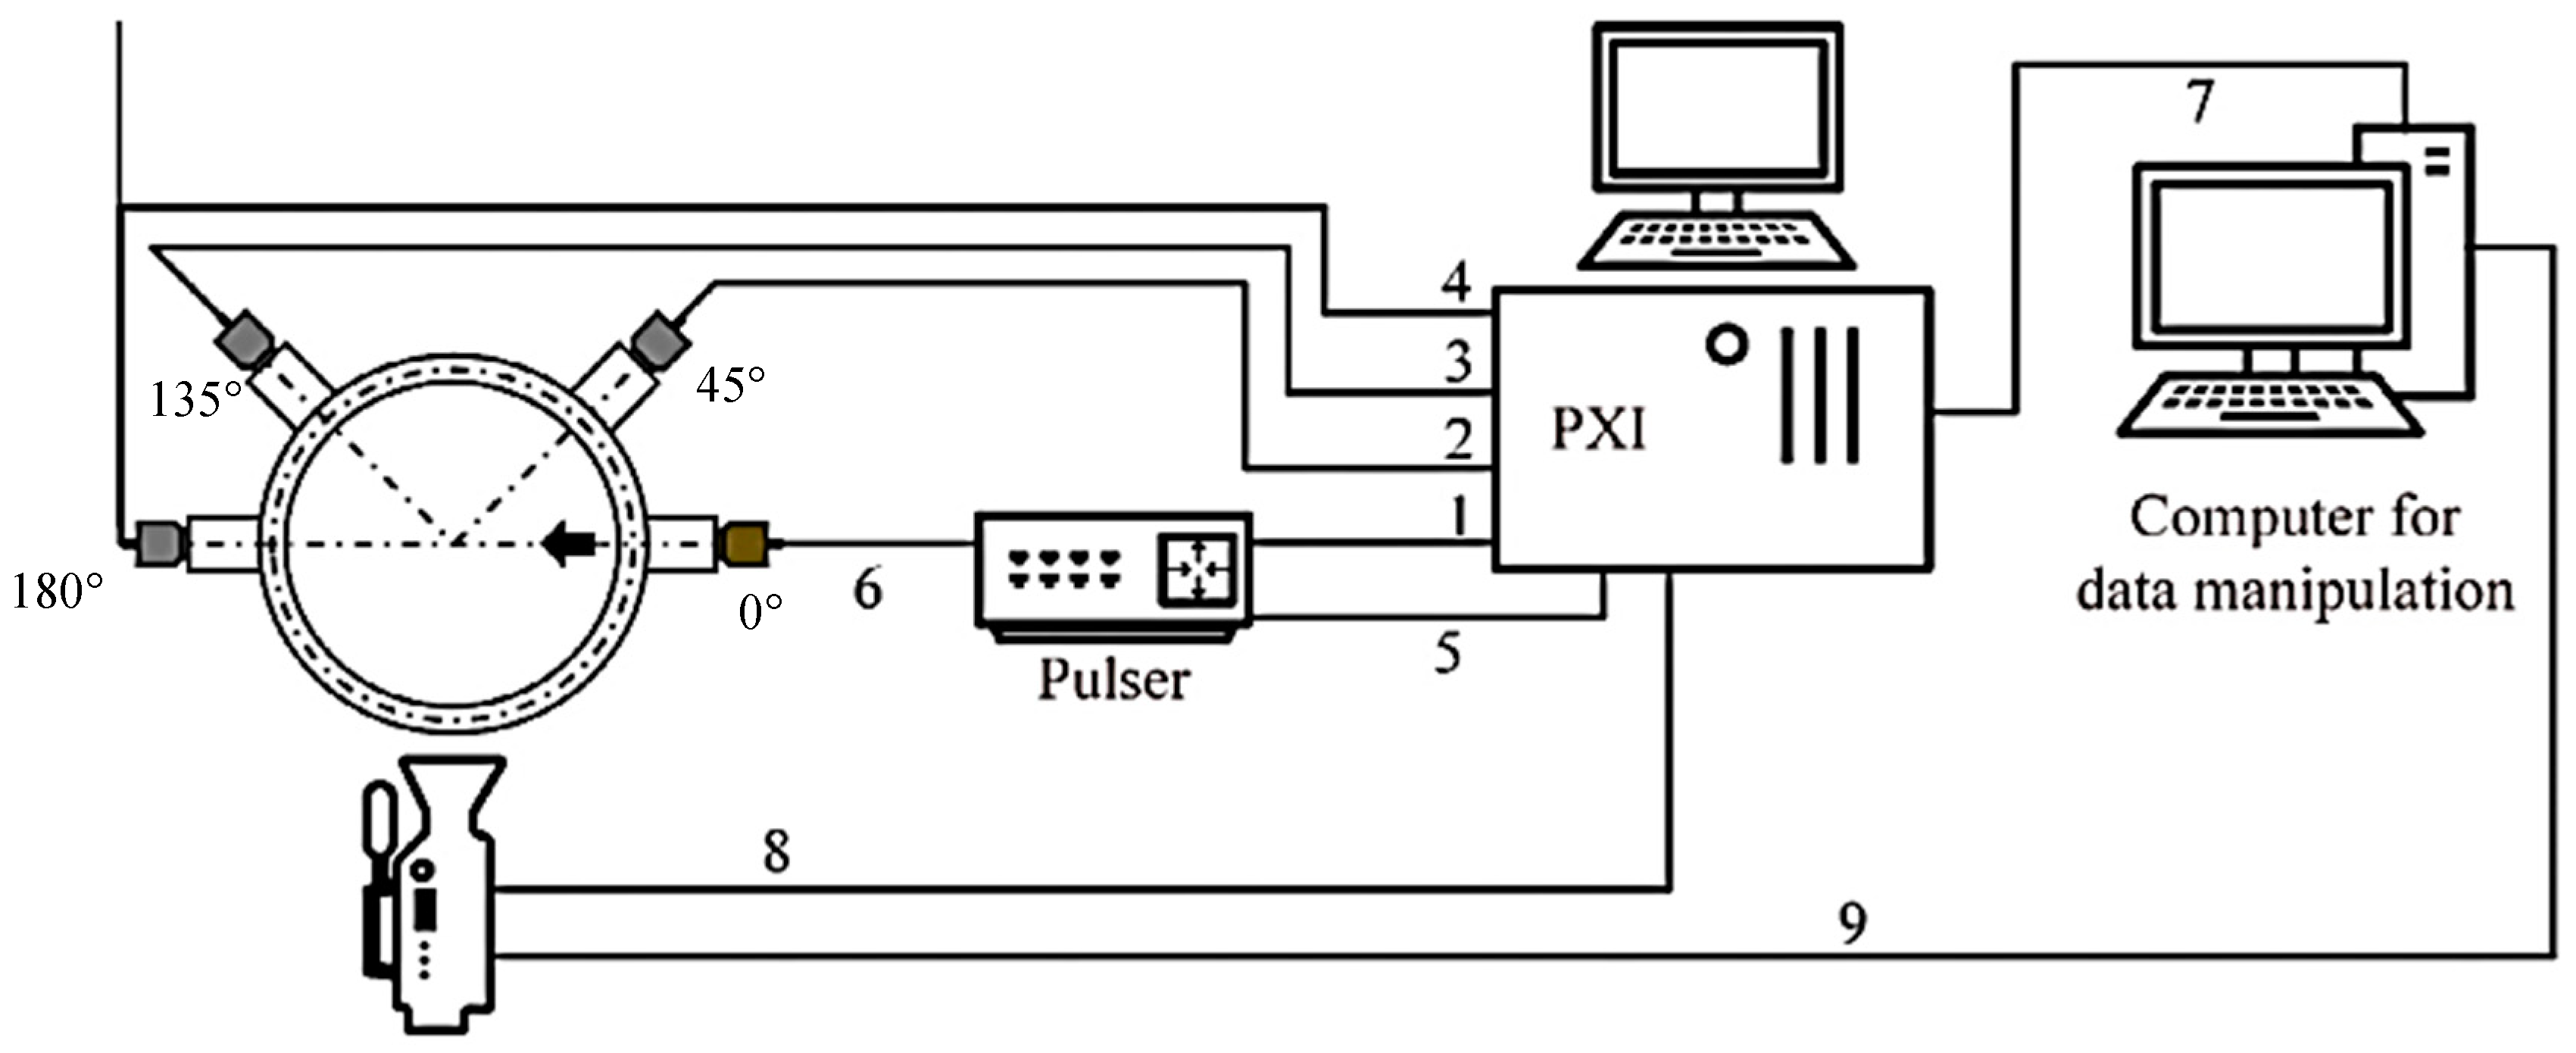
3.3.1. Ultrasound Doppler Velocimetry (UDV)

Mao et al., 2022 [69] applied the ultrasonic Doppler velocimetry (UDV) technique to capture velocity data of gas–liquid flow in a horizontal pipe non-intrusively. The fundamental approach of the UDV method involves utilizing ultrasound pulse-echo principles to detect echo signals. A transducer emits periodic ultrasonic bursts, and the transducer receives the echoes reflected by tracer particles in the liquid after a specific time interval [70]. Additionally, the researchers employed a high-speed camera to capture synchronized images to validate the flow regimes acquired through the Doppler velocimetry method. Subsequently, they utilized a straightforward CNN model architecture to construct the identification model. This method yielded superior identification speed and accuracy compared to the AlexNet, VGG-16, and ResNet models. Under trained conditions, the overall identification accuracy for the test datasets reached 96.5%, while under untrained conditions, it was 92.7%. These findings indicate considerable potential for industrial applications. Figure 12 presents a non-invasive sensor for flow diagnosis in different dimensions according to the measurement strategies and evolution across the years [71].
Zhang et al., 2020 [72] utilized the liquid phase velocity, a deep neural network, and ultrasonic Doppler velocimetry to measure the liquid velocity to identify the flow regime in a horizontal pipe. The study showed that the real-time flow regime identification accuracy based on a flow regime map can reach up to 93.1%.
For the identification of a gas–liquid (two-phase) flow regime in an S-shaped upward pipe, Kuang et al., 2022 [73] employed a non-intrusive ultrasonic Doppler sensor and convolutional recurrent neural networks (CRNNs). Compared to existing results, they achieved compatible performance while considerably reducing the model complexity. The test and validation accuracies were 98.13% and 98.06%, respectively, while the complexity decreased by 98.4% (only 117,702 parameters).

3.3.2. Data-Driven Approaches

Lin et al., 2020 [13] utilized deep learning neural networks to predict flow patterns along inclined pipes (0–90°), using input parameters such as individual phase superficial velocities and pipe inclination angles. The developed approach was equipped with a deep-learning neural network for flow pattern identification using experimental datasets from various studies reported in the literature. The predictive model was validated based on conventional flow regime maps. Additionally, the deep learning algorithm identified the intensity of key features in flow pattern prediction, which is difficult to capture using commonly used correlation approaches.
Gomez-Camperos et al., 2023 [74] developed a review of data from different studies found in the literature, and flow map data were extracted to identify flow patterns in horizontal and vertical pipes. The information was normalized and converted into numerical values by developing an artificial neural network, the input layer of which was composed of superficial velocities of each fluid, mixture velocity, volumetric fraction of substances, pipe diameter and inclination, and oil viscosity. The database used to train, validate, and test the model consisted of 6993 rows of information corresponding to the inputs of the neural network. Finally, the mean squared error obtained by the model was around 1.38%, with a maximum coefficient of determination of 0.79.
Finally, Seong et al., 2020 [75] employed a deep neural network to evaluate the liquid holdup and pressure gradient of gas–liquid two-phase flow in a horizontal pipe. They achieved mean absolute percentage errors of 8.08% for liquid holdup and 23.76% for pressure gradient, with R2 values of 0.89 for liquid holdup and 0.98 for pressure gradient. The simulation data were obtained from previous literature sources.

3.3.3. Image Identification

Nie et al., 2022 [33] employed a flow pattern classification approach based on convolutional neural network (CNN) algorithms to automatically and objectively identify two-phase flow patterns. They curated a database comprising 696 test conditions, incorporating 105,642 images depicting methane and tetrafluoromethane condensation flow patterns in a horizontal circular tube. Utilizing 80% of the image data for training and parameter tuning, they developed trained models capable of identifying five flow patterns; annular flow, bubbly flow, churn flow, slug flow, and stratified flow. The proposed method demonstrated high accuracy, with prediction accuracies exceeding 90.63 and 91.45% for the test dataset and the complete database, respectively. The average accuracy for predicting all data points in the database exceeded 97.56%. These findings highlight the efficacy of CNN algorithms in providing objective predictions with satisfactory accuracy and universality for identifying two-phase flow patterns.

3.4. Transformer Neural Network

In the research developed by Ruiz et al., 2024 [76], the authors proposed a transformer neural network to identify flow patterns based on literature data, highlighting that this type of network had not been previously used in the oil and gas industry. The developed model successfully predicted 9 out of the 10 flow patterns present in the database, achieving a maximum accuracy of 53.07%. Furthermore, the various predicted flow patterns exhibited an average accuracy of 63.21% and an overall accuracy of 86.51%.

4. Analysis of Bibliometric Indicators

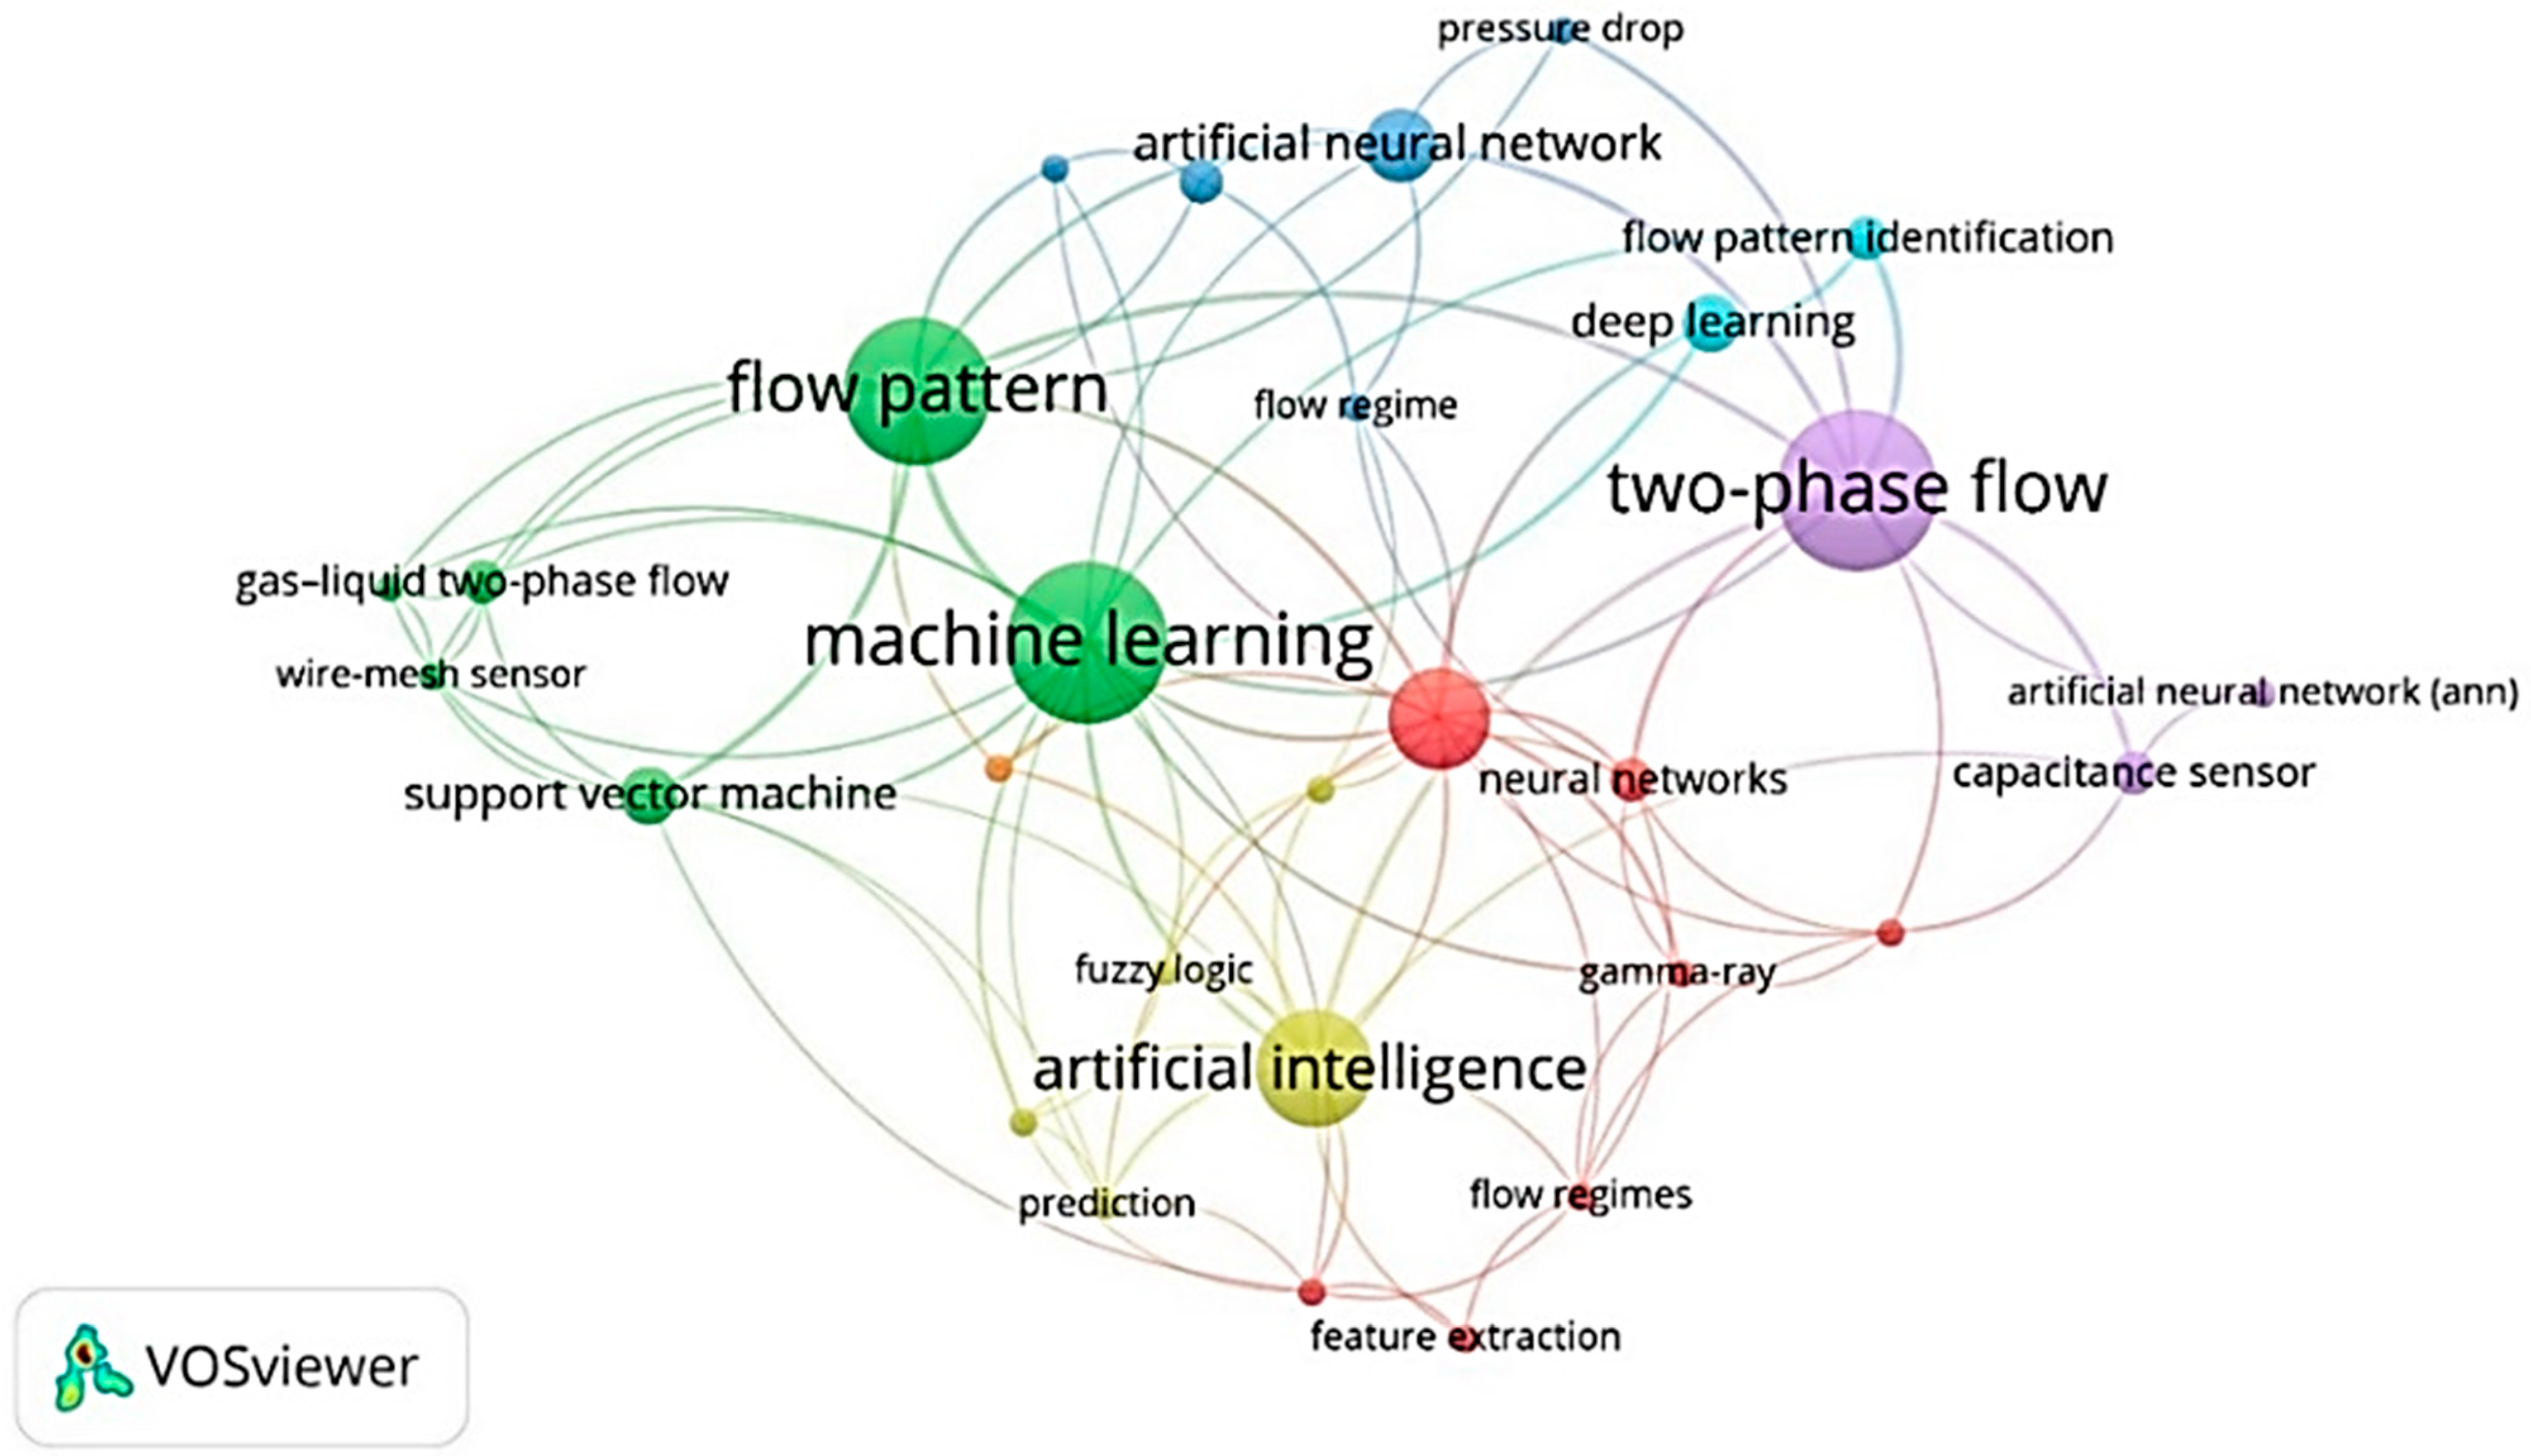
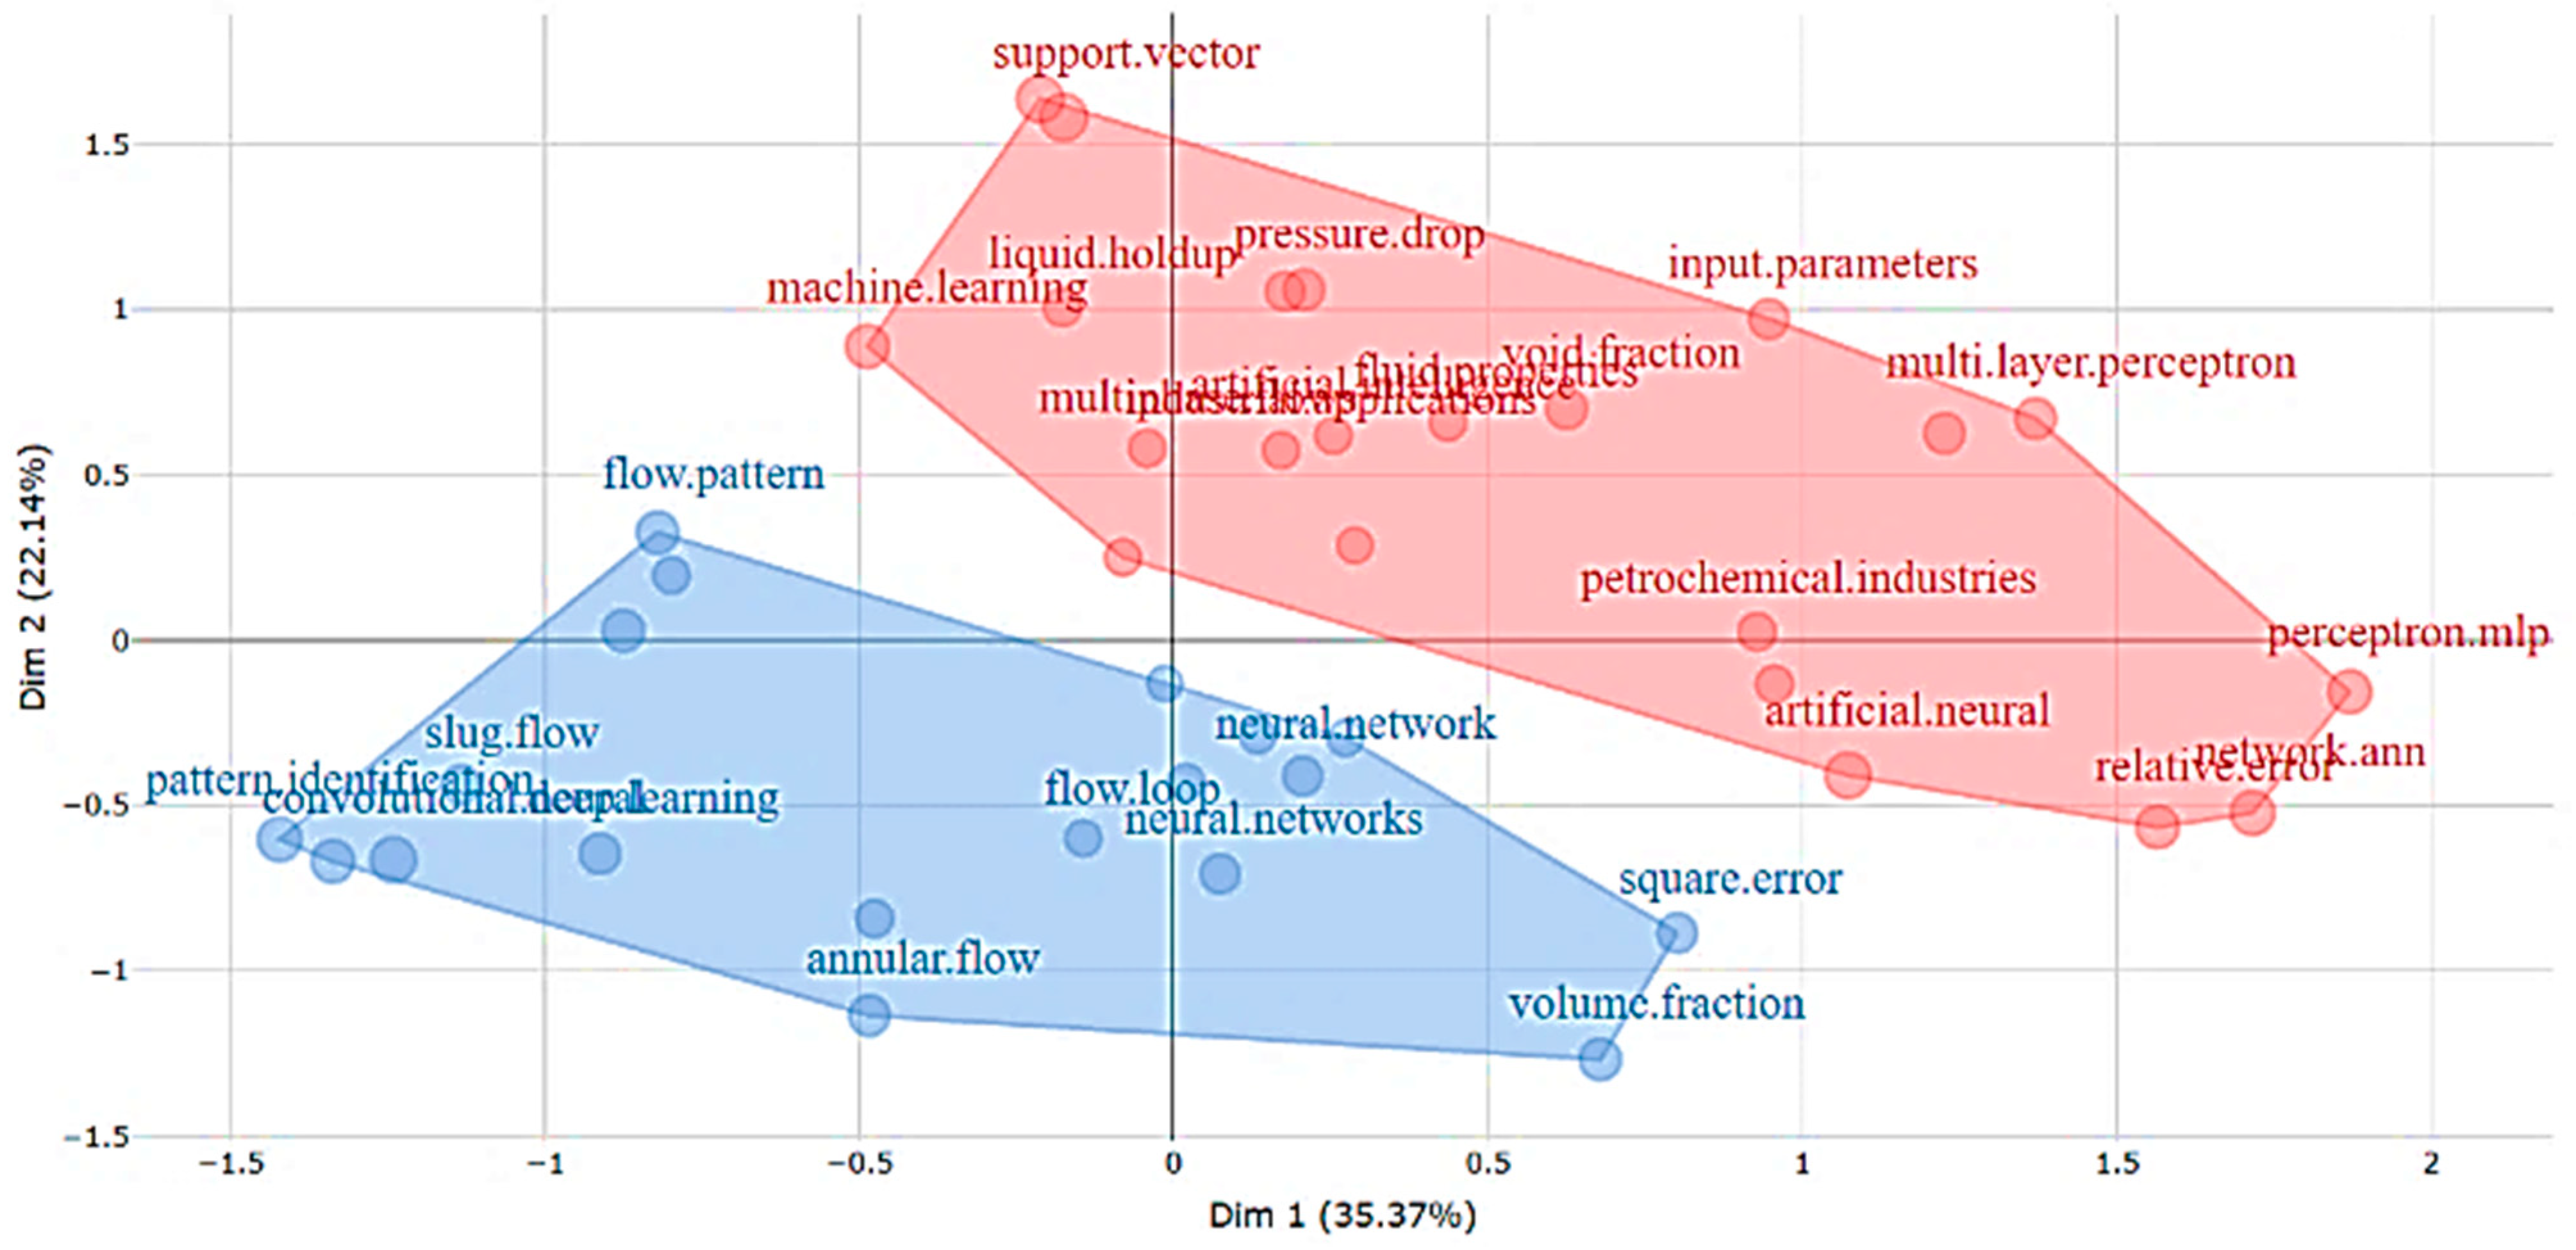
4.1. Co-Ocurrence analysis

Once the articles for the study were selected, they were imported into VOS viewer (version 1.6.20), where a co-occurrence analysis was conducted to evaluate the relationships between articles based on keywords [37,71,77]. Keywords provide an easy way to describe the main research topic of an article and give insight into the knowledge domain to which a particular article belongs [78]. The keyword mapping shows their interconnection and defines the research areas within a domain [79].
Furthermore, an “author keywords” map was constructed in VOS viewer using “fractional counting” as the analysis method. The threshold limit for the minimum number of occurrences was kept at ‘2’. Out of a total of 178 keywords in 70 articles, 29 reached the threshold, as shown in Figure 13. It is possible to observe that frequently occurring keywords have larger node sizes. For example, machine learning, flow pattern, two-phase flow, artificial intelligence, and neural networks.
Regarding the thematic clusters formed by the proximity and repetition of keywords in the research, the methodology of the bibliometric software can propose a thematic map that schematically suggests clusters as areas of scientific influence. In the case of this research, the results show two groupings (Figure 14).

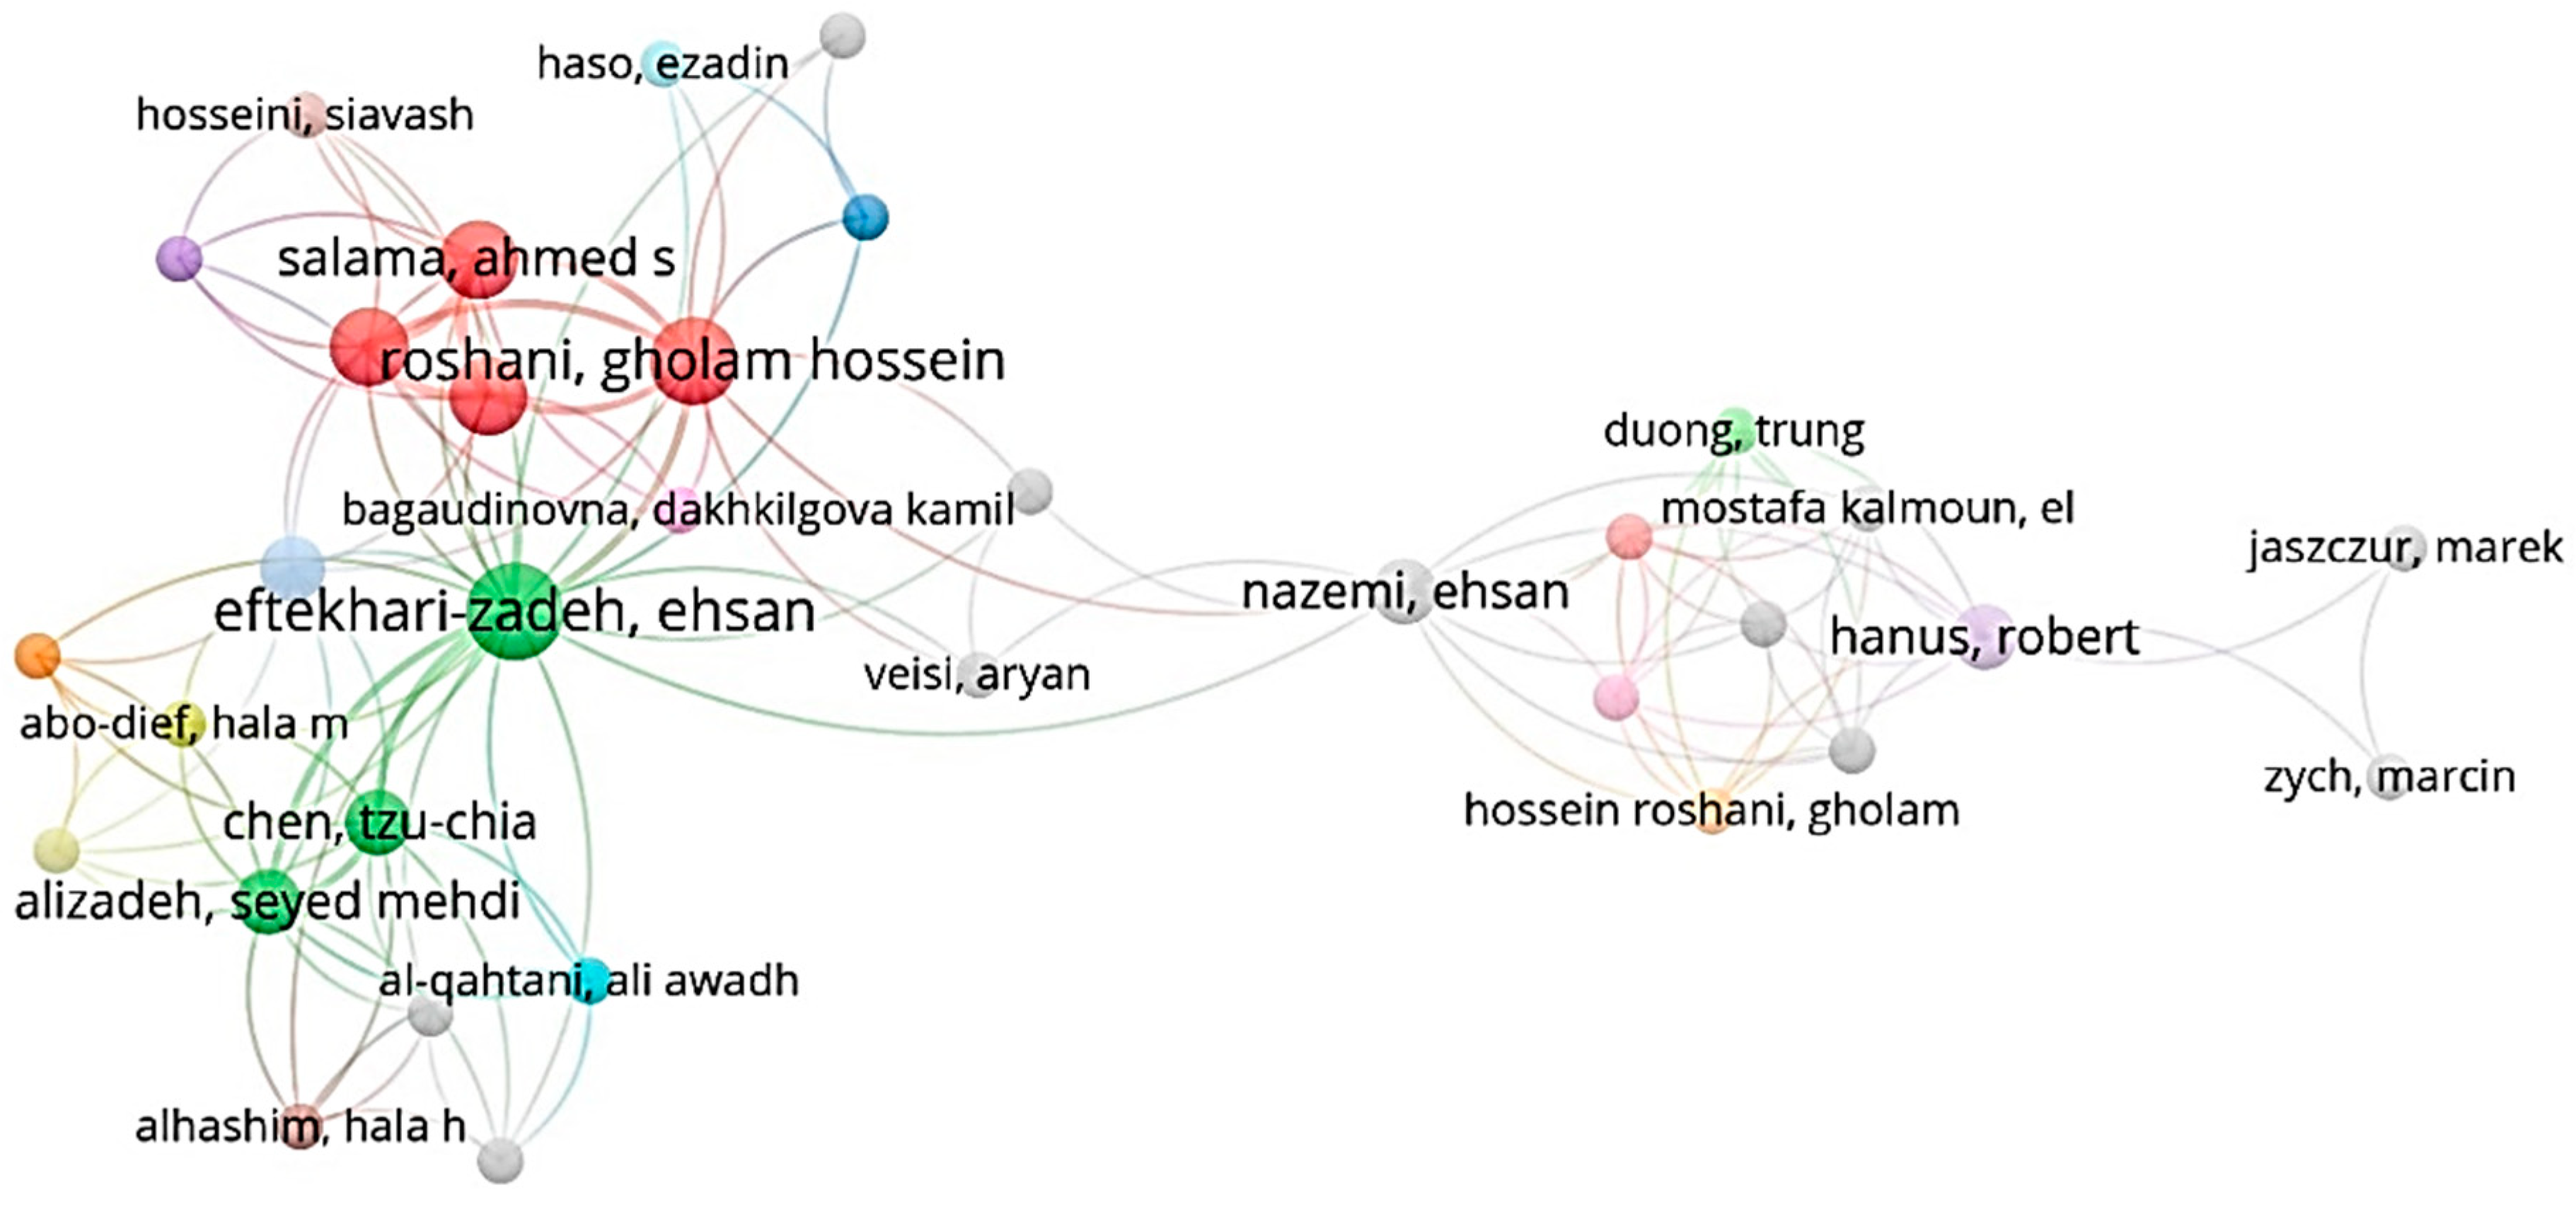
4.2. Authors and Co-Authorship

Co-authorship analysis is a method utilized to examine the collaborative connections between authors in published articles. When two or more authors collaborate to produce a published work, they are linked in a co-authorship network, indicating their joint contribution to the research. This network illustrates the collaborative relationships between authors and provides insights into their collaborative patterns and interactions within the academic community. This information can help authors find support from other researchers publishing on a topic of interest. Figure 15 illustrates the co-authorship network [34,35].

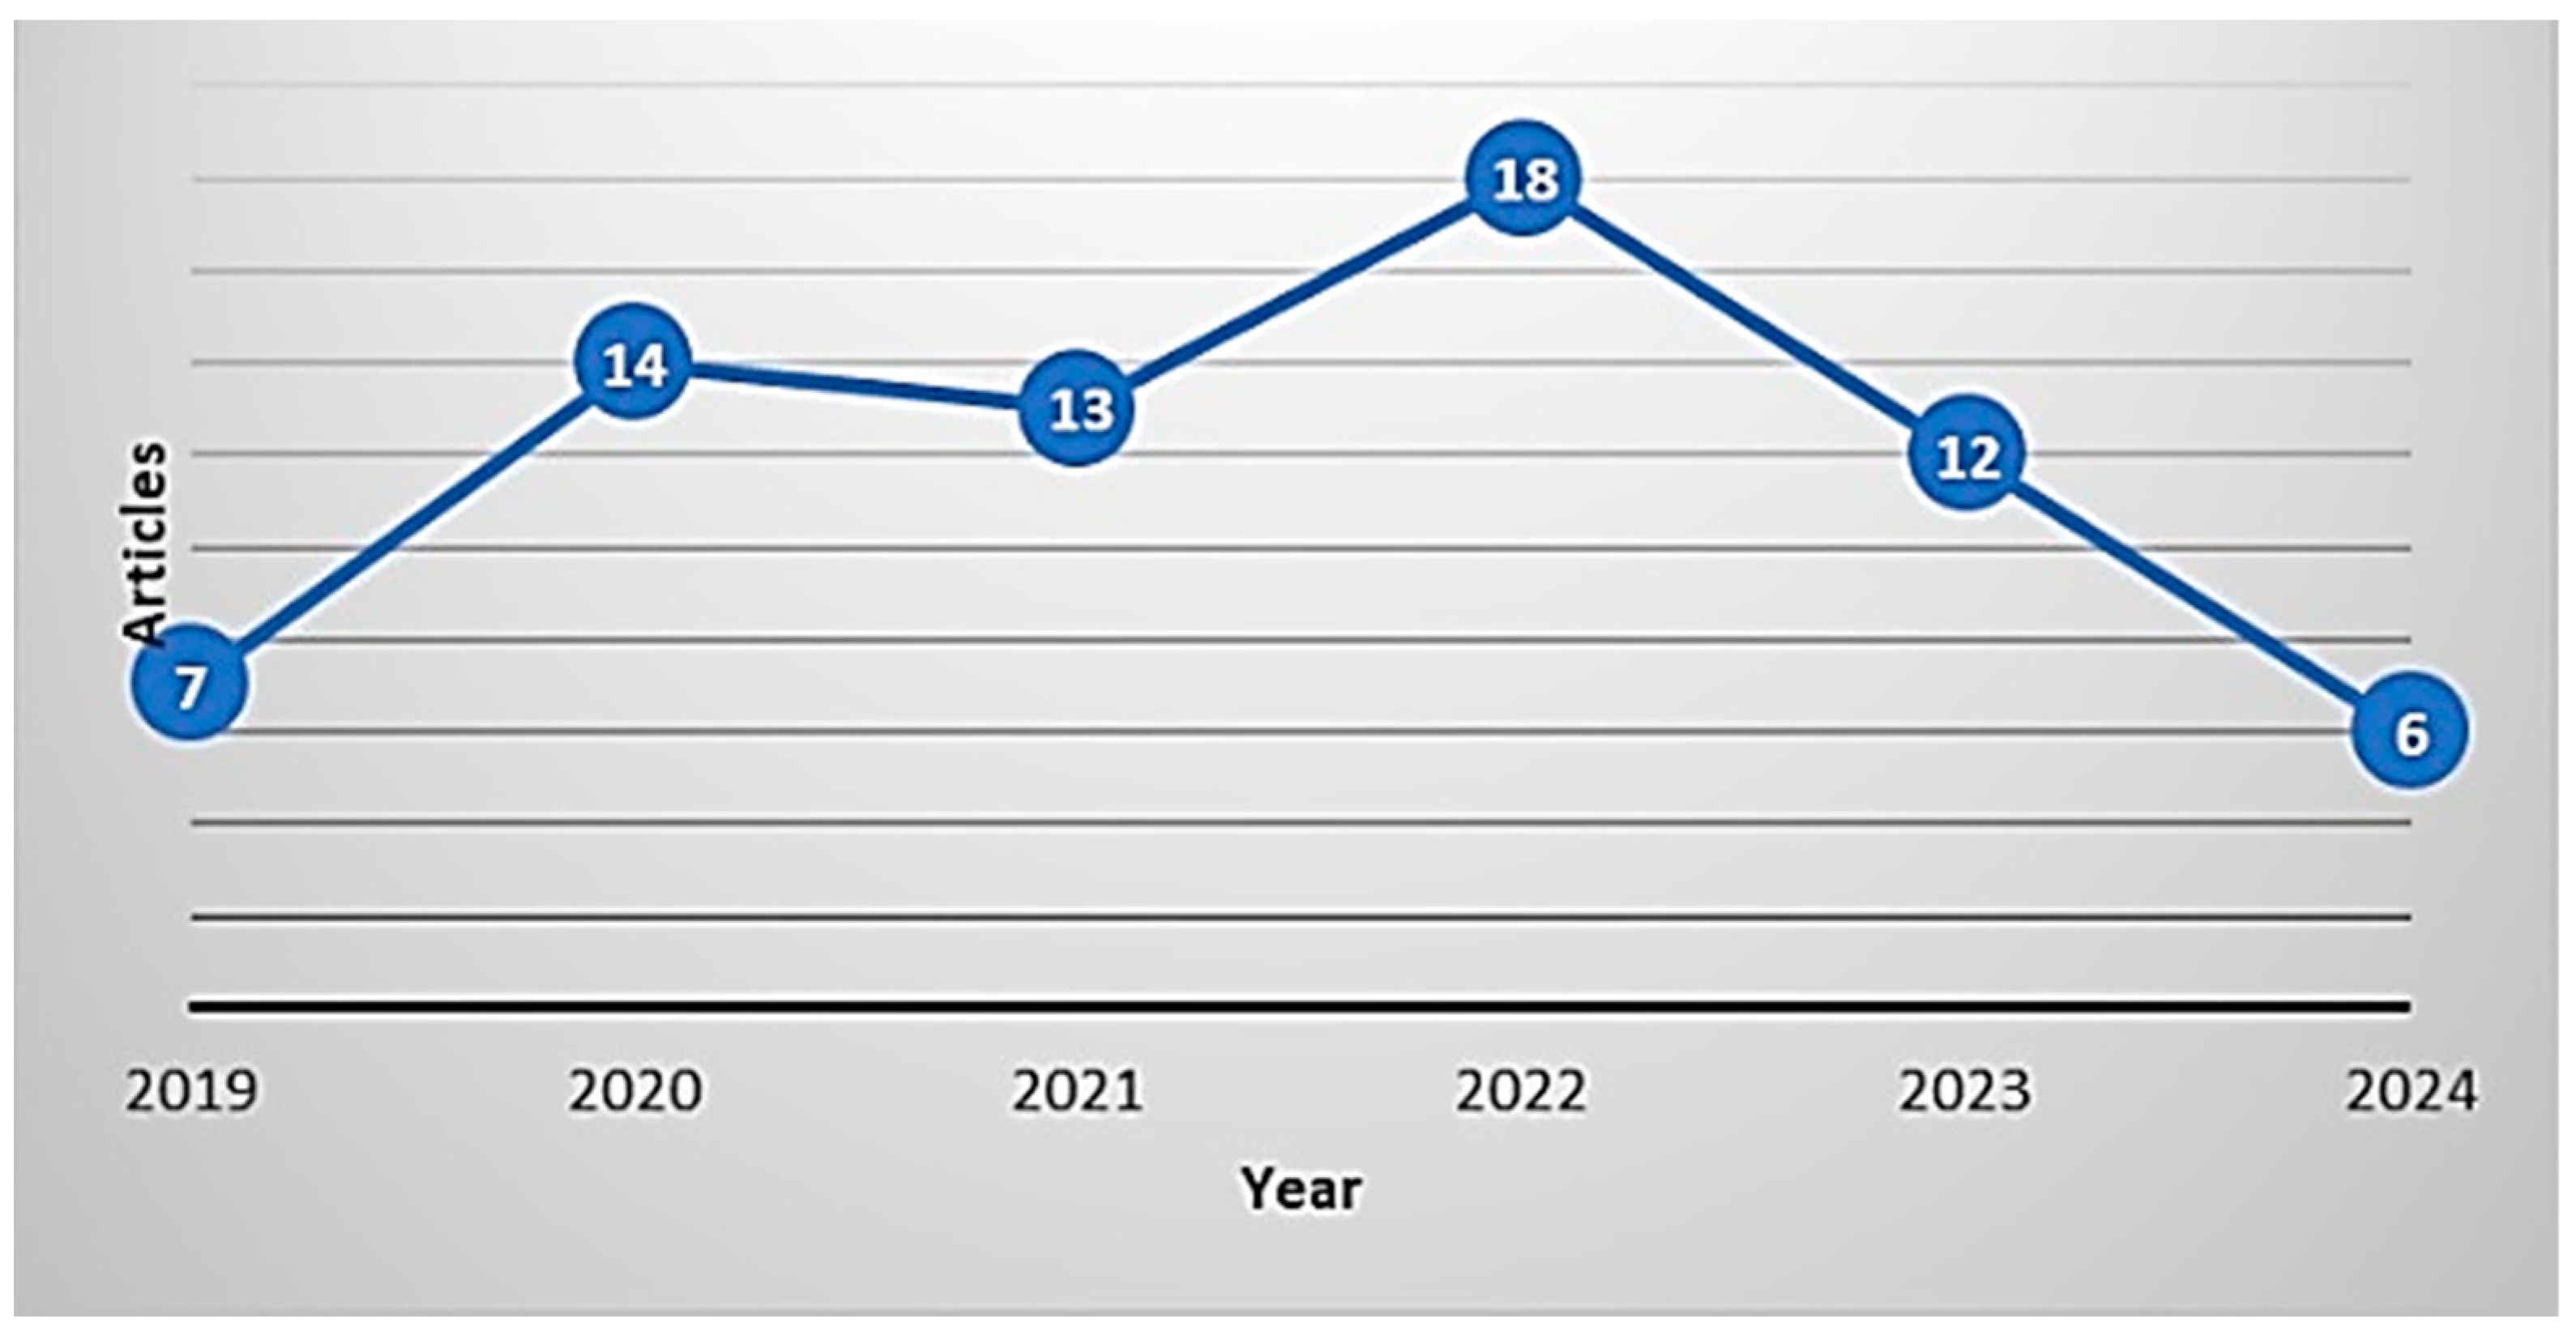
4.3. Publication Trends

In Figure 16, the search was conducted from 2019 to 2024, indicating an ongoing research topic. Analyzing the publication trend, it was possible to identify that 2022 saw the highest number of articles published (18) regarding artificial intelligence techniques for the hydrodynamic characterization of liquid–gas two-phase flows.

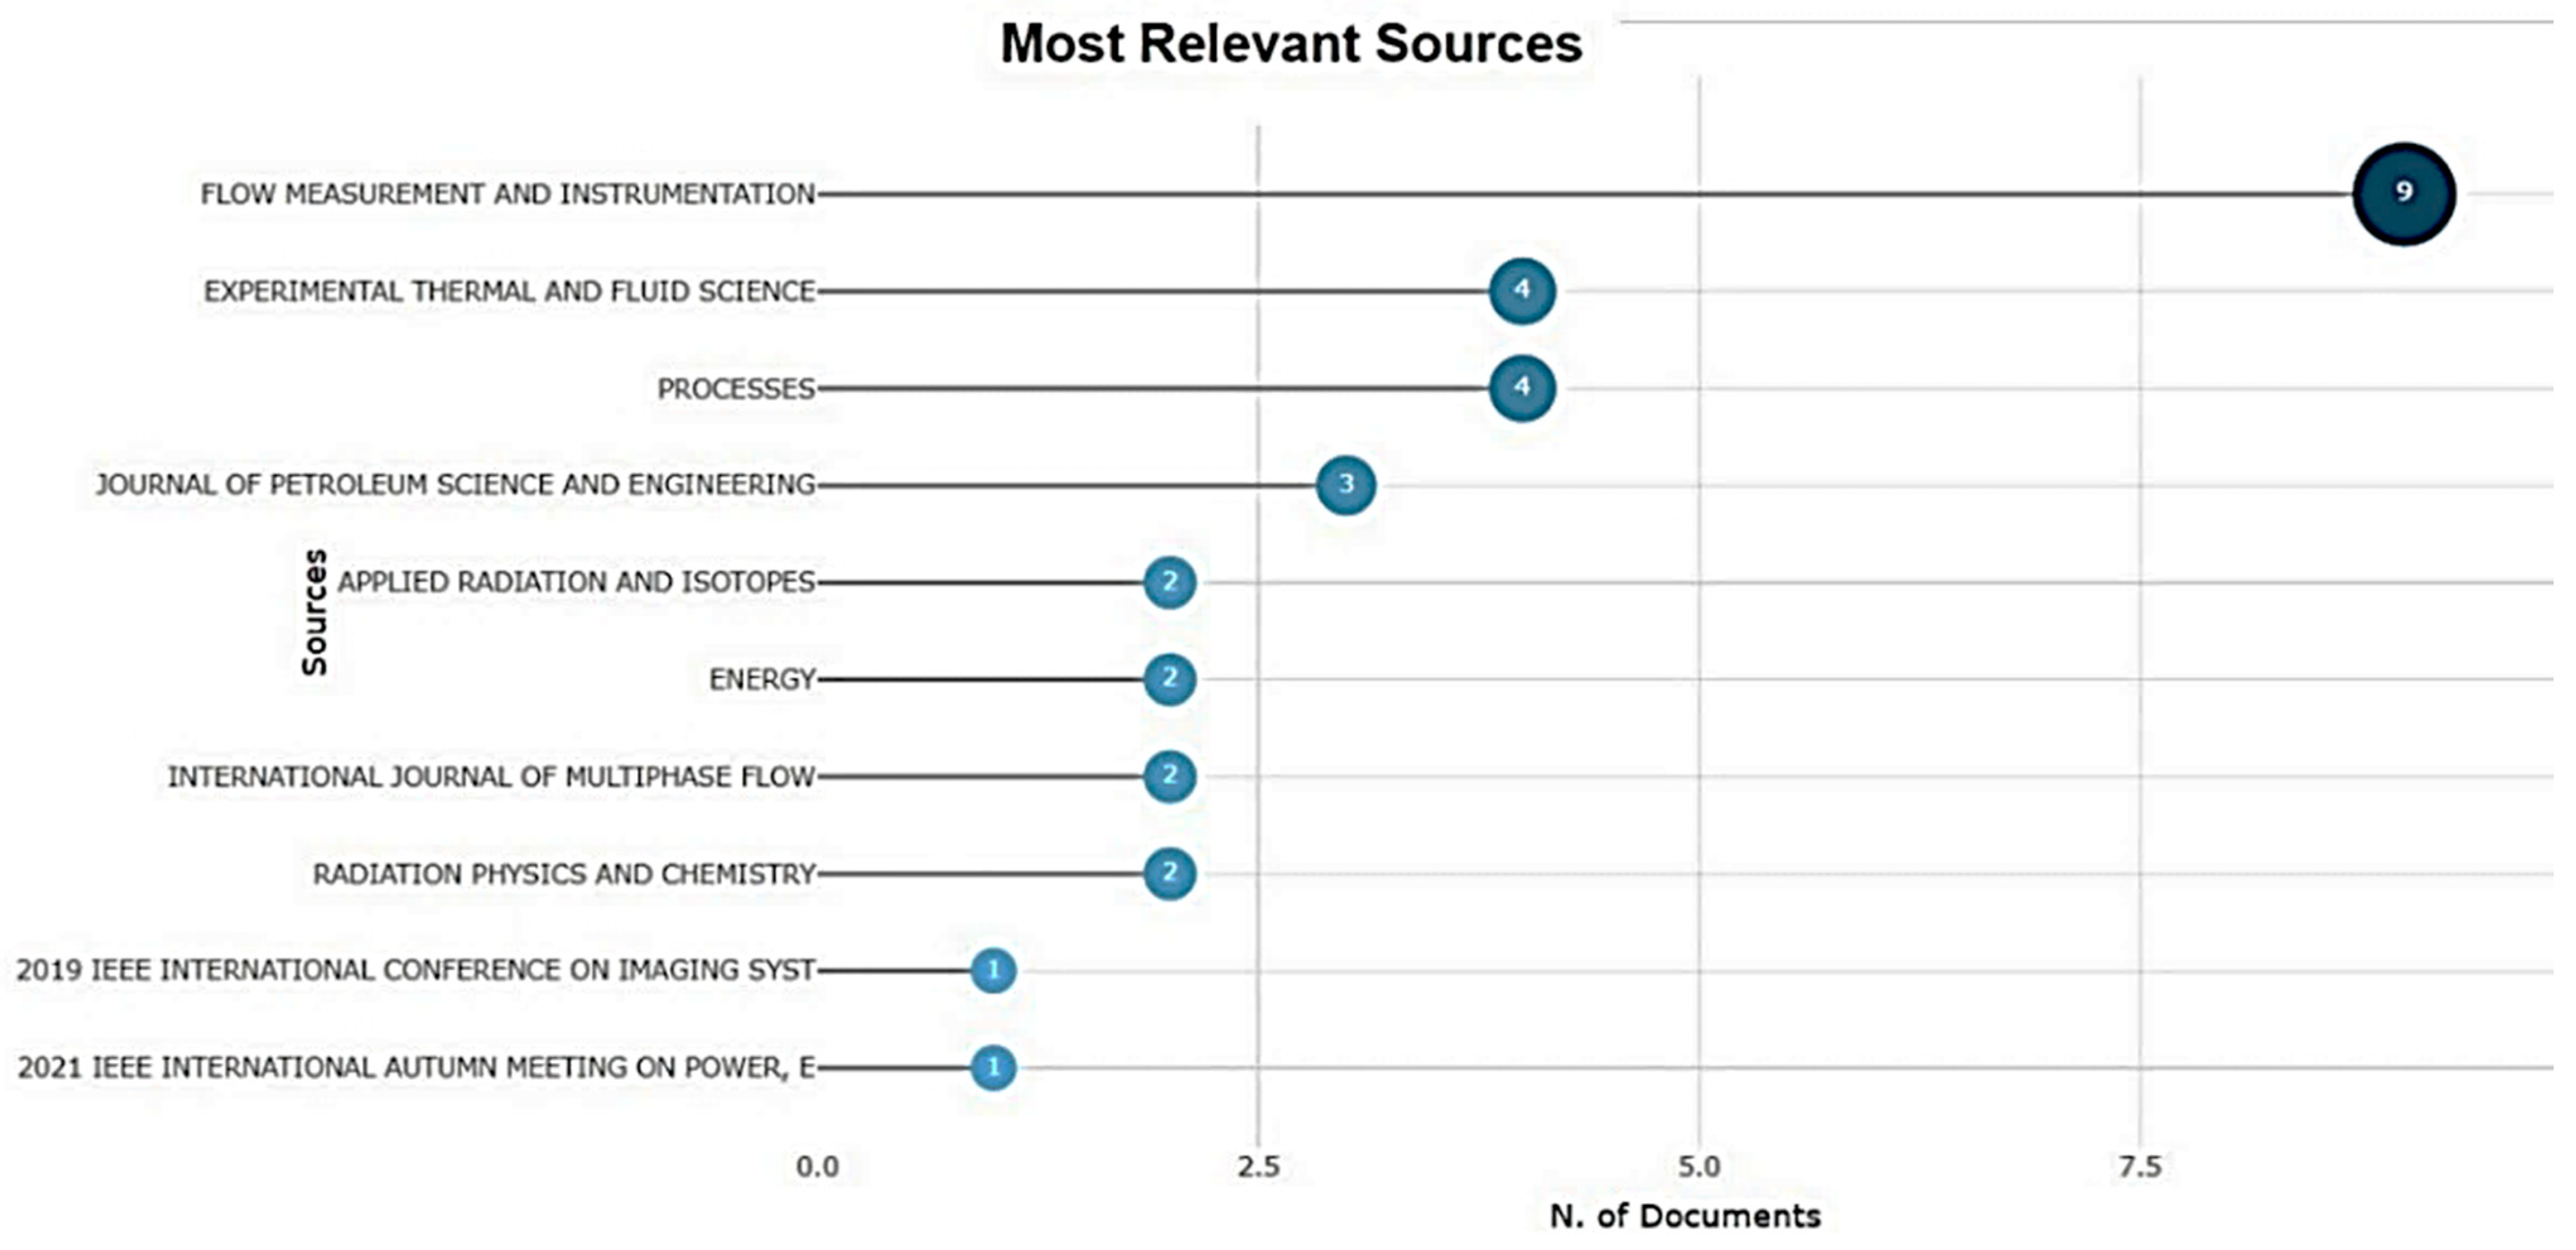
4.4. Most Relevant Sources

Figure 17 illustrates the relevance of sources measured by the number of published articles. It also shows the distribution of publications across different journals, indicating the number of records obtained from each database. The journal “Flow Measurement and Instrumentation” has the highest number of published articles related to the studied topic, with nine articles.
Figure 18 illustrates the results related to the annual growth of the number of published articles according to the most relevant sources. Particularly, the Journal of Petroleum Science and Engineering shows significant growth starting from 2021, possibly due to the COVID-19 pandemic, during which authors in this field increased their submissions and publications [80].

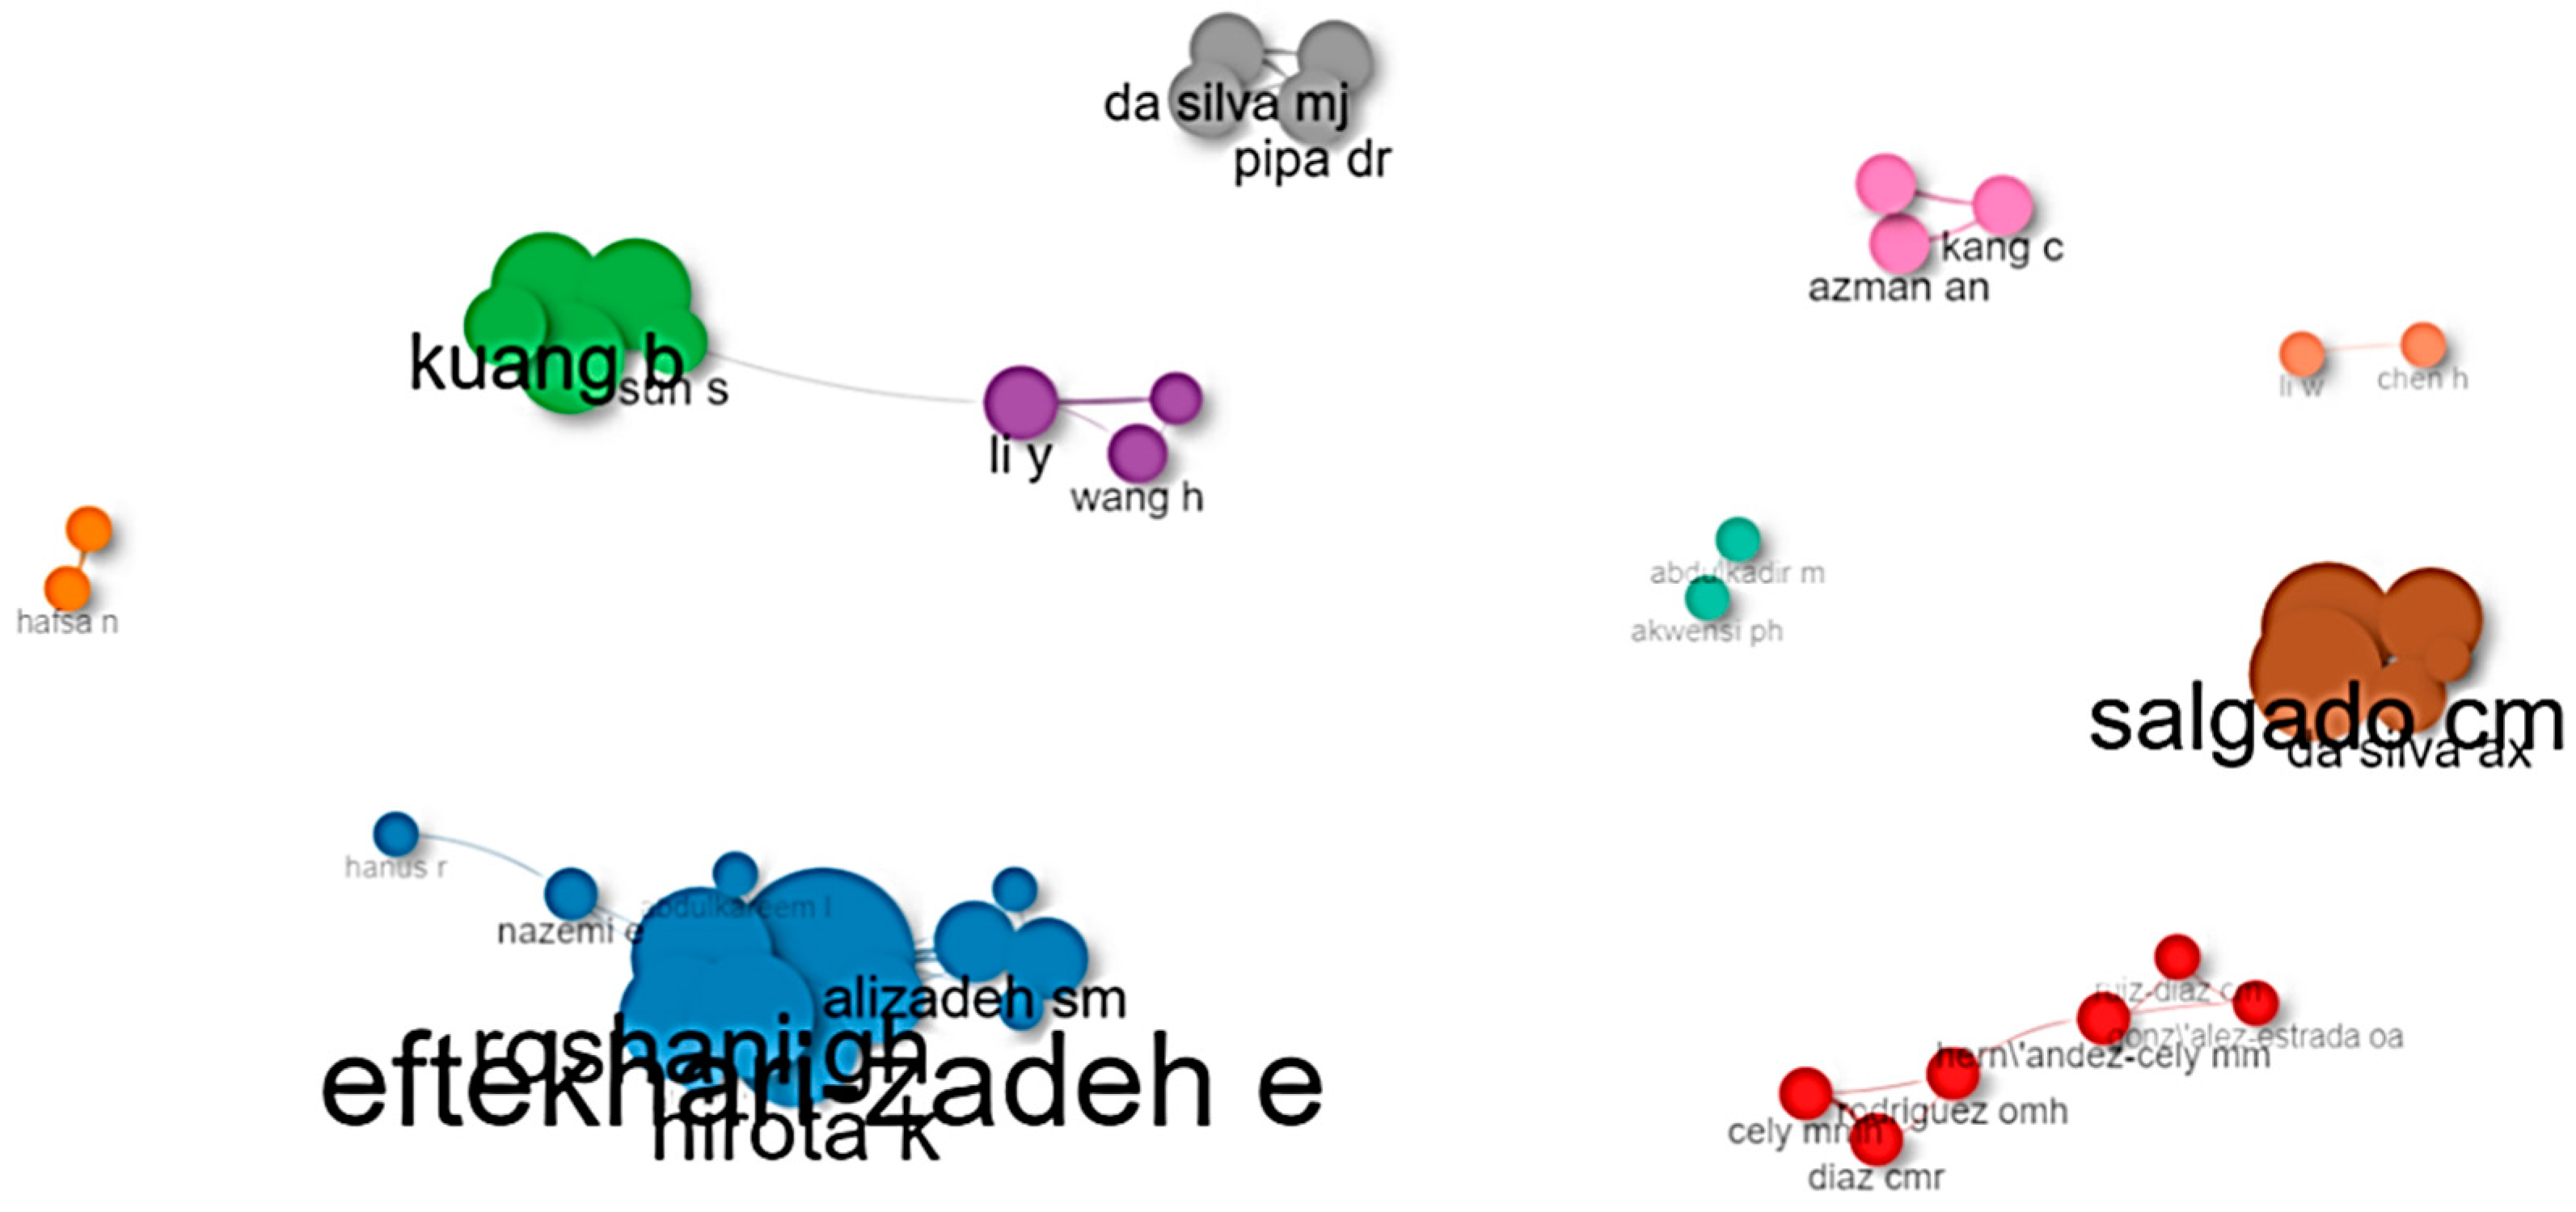
4.5. Collaboration between Authors

Figure 19 shows the collaboration among authors, revealing the presence of various collaboration networks (ten in total), among which the blue collaboration network was led by Efteknari-Zadeh, E from the Institute of Optics and Quantum Electronics, Friedrich Schiller University Jena, with a h-index of 13 from Google Scholar. Most of the authors are from Germany and have extensive experience in research related to the topic analyzed through bibliometrics in this field.

5. Conclusions and Trends

This study initiates with a systematic literature review aimed at identifying AI techniques utilized for discerning flow patterns, determining the volumetric fraction of each fluid, and evaluating pressure gradients. Subsequently, a scientometric analysis is performed to achieve three primary objectives; (1) retrieve pertinent research articles from Scopus, Google Scholar, and Science Direct, (2) visualize trends in publication, and (3) analyze the scientific landscape by mapping influential authors and occurrences of key keywords.
Flow regimes in gas–liquid two-phase flow are accurately identified using sensors and signal analysis methods, ensuring objective classification. Among these methods, non-intrusive sensors are preferred for their minimal disruption to the flow, as they are installed externally on conduit walls. This setup avoids flow interruption, reduces pressure losses, and mitigates sensor exposure to erosion and corrosion, particularly in high-velocity flows. Various non-intrusive detection technologies are employed for flow regime identification, including radioactive, hydraulic, electrical, magnetic, acoustic, and optical sensors.
Different flow patterns exhibit distinct hydrodynamic characteristics in phase distribution, velocity profile, interfacial resistance, wall resistance, and pressure gradients. In this regard, transition regions between flow patterns pose risks in oil production and transportation processes, as flow control cannot be achieved within them. For example, a slug flow pattern can exacerbate pipeline component aging and affect equipment lifespan. Identifying, monitoring, and measuring flow patterns in pipelines is important, especially in the petroleum industry, due to their influence on the proper functioning of actuators such as valves and pumps and in maintaining the actual process conditions.
While machine learning is widely applied in gas–liquid two-phase flow analysis, data-driven methods are often perceived as black boxes, lacking interpretability and extrapolation capabilities. To address this challenge, integrating machine learning with physical principles shows promise in enhancing the generalization and interpretability of deep neural networks. This approach aims to combine the strengths of machine learning with fundamental physical understanding, offering improved model interpretation and broader applicability in gas–liquid two-phase flow measurement.
Determining the volume percentage of each phase transitioning within the oil pipeline will optimize the system and enhance the oil industry’s performance. Therefore, designing and implementing a system to detect the volume percentage can effectively address the industry’s challenges.
Accurate and instantaneous estimation of hydrodynamic characteristics in two-phase liquid–gas flow is paramount for assisting industries such as oil, gas, and other multiphase flow industries in cost reduction, emissions reduction, and efficiency enhancement while enhancing operational safety. The hydrodynamic flow of two-phase liquid–gas is characterized by constant slippage between the gas and liquid phases due to a deformable interface leading to variations in gas volumetric fraction and the formation of flow patterns. Traditional numerical and empirical methods used for prediction have resulted in significant inaccuracies in scale-up processes. Consequently, various methodologies based on artificial intelligence (AI) are currently being applied to predict hydrodynamic characteristics in two-phase liquid–gas flow.
Traditional sensors and soft computing methods offer effective solutions for measuring phase flow rates and fractions in sensor fusion. Multi-sensor systems exhibit higher accuracy in estimating parameters. For instance, conductance sensors paired with artificial neural networks (ANNs) can measure air–water flow with less than ±10% error. Coriolis mass flowmeters, especially when combined with sensor fusion, demonstrate superior accuracy in mass flowrate measurement compared to other flowmeters, showing promise for future multiphase flow measurement applications.
In soft computing techniques, MLP neural networks are commonly used for estimating flow rates and phase fractions, but their structure parameters often require adjustment through trial and error. With fixed structures and fewer adjustable parameters, RBF neural networks have been explored to improve training efficiency. While ANN-based methods have been effective, they may suffer from overfitting, prompting the use of alternative options like SVMs, which have shown better generalizability in some cases.
Data-driven modeling involves developing empirical models with soft computing methods based on available data. If sufficient data are available, these models are useful for practical problem-solving, though challenges arise in real-world applications due to variations in operating conditions. Model performance depends on factors like input variable selection and model evaluation, which are crucial for achieving optimal solutions. Optimization algorithms like GA are employed to tune parameters, and careful consideration of input variable selection methods and model evaluation is essential in the development process to ensure accurate multiphase flow measurement.
In summary, trends in the area of flow regime identification include the use of non-intrusive sensors, the diversification of detection technologies, integration of machine learning and physical principles, and the pursuit of more interpretable and extrapolatable models. These trends reflect a multidisciplinary approach to characterizing and understanding gas–liquid systems, aiming to enhance measurement accuracy and reliability in various industrial and scientific applications.
In the future, the role of deep learning in identifying flow patterns, particularly in image recognition, is expected to become more prominent. However, the complexity of underwater environments poses challenges for relying solely on real-time image-based flow pattern identification in practical engineering applications. An overview of trends in artificial intelligence techniques for hydrodynamic characterization of two-phase liquid–gas flow is described in the following.
  • Advancements in artificial intelligence applications: Exploring how recent advancements in artificial intelligence have revolutionized the characterization of hydrodynamic properties in two-phase liquid–gas flows, providing a comprehensive overview of cutting-edge techniques and methodologies;
  • Emerging technologies in hydrodynamic characterization: Investigating the latest trends and emerging technologies in the application of artificial intelligence for accurately characterizing the hydrodynamic behavior of two-phase liquid–gas flows, highlighting key developments and their implications for various industries;
  • AI-driven insights into two-phase flow dynamics: Analyzing how artificial intelligence techniques are reshaping our understanding of the complex dynamics involved in two-phase liquid–gas flows, offering insights into flow patterns, volumetric fractions, and pressure gradients through advanced computational models and data-driven approaches;
  • Integration of AI methods in hydrodynamic analysis: Examining the integration of artificial intelligence methods such as machine learning, deep learning, and neural networks into hydrodynamic analysis, showcasing their effectiveness in predicting flow behavior, optimizing process parameters, and enhancing overall efficiency;
  • Future directions and challenges: Discussing future directions and challenges in the field of hydrodynamic characterization of two-phase liquid–gas flows using artificial intelligence. Addressing issues such as scalability, model interpretability, and data quality while outlining potential avenues for further research and innovation.

Author Contributions

J.A.G.C., Contributed to Investigation, Methodology, Formal Analysis, Funding Acquisition, Original Draft, Writing—Review and Editing. M.M.H.C. and A.P.G. contributed to Conceptualization, Methodology, Supervision, Formal Analysis, other contributions. All authors have read and agreed to the published version of the manuscript.

Funding

This work was completed in the Universidad Francisco de Paula Santander Ocaña and Universidad de Pamplona.

Data Availability Statement

Not applicable.

Acknowledgments

J.A. Gómez Camperos thanks the Universidad Francisco de Paula Santander Ocaña and Universidad de Pamplona for their support in the financial sources of this work.

Conflicts of Interest

The authors declare no conflicts of interest.

Abbreviations

AIArtificial Intelligence
AIoTArtificial Intelligence of Things
ARTAdaptive Resonance Theory
BABibliometric Analysis
CMCommittee Machine
CMACCerebellar Model Articulation Controller
CNNCellular Neural Network
CNnConvolutional Neural Networks
CVControlled Variable
DRNNDeep Rectifier Neural Network
DWTDiscrete Wavelet Transform
ELMExtreme Learning Machine
FCCFluid Catalytic Cracking
FLFour Layer
GVFGas Volume Fraction
HCOHeavy Cycle Oil
LCOLight Cycle Oil
LSTMShort-Term Memory
MAEMean Absolute Error
MLMultilayer
MLPMultilayer Perceptron
MVManipulated Variable
PNNProbabilistic Neural Network
PSDPower Spectral Density
RBFRadial Basis Function
SLSingle Layer
SVMSupport Vector Machine
TLThree Layers
UDVUltrasonic Doppler Velocimetry
WGCWet Gas Compressor
WNNWavelet Neural Network

References

  1. Pietrzak, M.; Płaczek, M.; Witczak, S. Upward flow of air-oil-water mixture in vertical pipe. Exp. Therm. Fluid Sci. 2017, 81, 175–186. [Google Scholar] [CrossRef]
  2. Yan, R.; Viumdal, H.; Mylvaganam, S. Process tomography for model free adaptive control (MFAC) via flow regime identification in multiphase flows. IFAC-PapersOnLine 2020, 53, 11753–11760. [Google Scholar] [CrossRef]
  3. Wang, Y.; Adam, M.L.; Zhao, Y.; Zheng, W.; Gao, L.; Yin, Z.; Zhao, H. Machine Learning-Enhanced Flexible Mechanical Sensing. Nano-Micro Lett. 2023, 15, 55. [Google Scholar] [CrossRef] [PubMed]
  4. Yan, Y.; Wang, L.; Wang, T.; Wang, X.; Hu, Y.; Duan, Q. Application of soft computing techniques to multiphase flow measurement: A review. Flow Meas. Instrum. 2018, 60, 30–43. [Google Scholar] [CrossRef]
  5. Khaldi, M.K.; Al-Dhaifallah, M.; Taha, O. Artificial intelligence perspectives: A systematic literature review on modeling, control, and optimization of fluid catalytic cracking. Alex. Eng. J. 2023, 80, 294–314. [Google Scholar] [CrossRef]
  6. Sestito, G.S.; Álvarez-Briceño, R.; Ribatski, G.; da Silva, M.M.; de Oliveira, L.P.R. Vibration-based multiphase-flow pattern classification via machine learning techniques. Flow Meas. Instrum. 2023, 89, 102290. [Google Scholar] [CrossRef]
  7. Li, S.; Zhao, F.; Bai, B. Gas–liquid intermittent flow rates measurement based on two-phase mass flow multiplier and neural network. Meas. Sci. Technol. 2021, 32, 105306. [Google Scholar] [CrossRef]
  8. Urbina-Salas, I.; Vázquez-Ramírez, E.E.; García-Sánchez, E.; Martínez-Rodríguez, E.D.; García-García, L.; De La Rosa, L.G.; Razón-González, J.P. Application of convolutional neural networks for the classification of two-phase flow patterns. In Proceedings of the 2021 IEEE International Autumn Meeting on Power, Electronics and Computing (ROPEC), Ixtapa, Mexico, 10–12 November 2021; Volume 5, pp. 1–6. [Google Scholar] [CrossRef]
  9. Nnabuife, S.G.; Kuang, B.; Whidborne, J.F.; Rana, Z.A. Development of gas-liquid flow regimes identification using a noninvasive ultrasonic sensor, belt-shape features, and convolutional neural network in an S-shaped riser. IEEE Trans. Cybern. 2021, 53, 3–17. [Google Scholar] [CrossRef] [PubMed]
  10. Kanin, E.A.; Osiptsov, A.A.; Vainshtein, A.L.; Burnaev, E.V. A predictive model for steady-state multiphase pipe flow: Machine learning on lab data. J. Pet. Sci. Eng. 2019, 180, 727–746. [Google Scholar] [CrossRef]
  11. Jiang, Z.; Wang, H.; Yang, Y.; Li, Y. Comparison of machine learning methods for multiphase flowrate prediction. In Proceedings of the IST 2019—2019 IEEE International Conference on Imaging Systems and Techniques, Abu Dhabi, United Arab Emirates, 9–10 December 2019. [Google Scholar] [CrossRef]
  12. Hasanzadeh, Y.; Alavifazel, S.A.; Azizi, Z.; Peyghambarzadeh, S.M.; Azimi, A. Prediction of the pressure drop in water-high viscosity oil flows using artificial neural network. Solid State Technol. 2021, 64, 7167–7186. [Google Scholar]
  13. Lin, Z.; Liu, X.; Lao, L.; Liu, H. Prediction of two-phase flow patterns in upward inclined pipes via deep learning. Energy 2020, 210, 118541. [Google Scholar] [CrossRef]
  14. Zhang, G.; Wang, L.; Wang, H.; Chen, Y.; Dang, J. Theoretical and experimental research on two-phase flow image reconstruction and flow pattern recognition. Rev. Sci. Instrum. 2023, 94, 034709. [Google Scholar] [CrossRef] [PubMed]
  15. Zhu, J.H.; Munjal, R.; Sivaram, A.; Paul, S.R.; Tian, J.; Jolivet, G. Flow regime detection using gamma-ray-based multiphase flowmeter: A machine learning approach. Int. J. Comput. Methods Exp. Meas. 2022, 10, 26–37. [Google Scholar] [CrossRef]
  16. Arteaga-Arteaga, H.B.; Mora-Rubio, A.; Florez, F.; Murcia-Orjuela, N.; Diaz-Ortega, C.E.; Orozco-Arias, S.; delaPava, M.; Bravo-Ortíz, M.A.; Robinson, M.; Guillen-Rondon, P.; et al. Machine learning applications to predict two-phase flow patterns. PeerJ Comput. Sci. 2021, 7, e798. [Google Scholar] [CrossRef] [PubMed]
  17. Cantarero-Rivera, F.J.; Yang, R.; Li, H.; Qi, H.; Chen, J. An artificial neural network-based machine learning approach to correct coarse-mesh-induced error in computational fluid dynamics modeling of cell culture bioreactor. Food Bioprod. Process. 2024, 143, 128–142. [Google Scholar] [CrossRef]
  18. Rushd, S.; Hafsa, N.; Yusuf, H. Comparative Performance of Machine Learning and Deep Learning Algorithms in Predicting Gas-Liquid Flow Regimes. SSRN 2022, 4225318. [Google Scholar] [CrossRef]
  19. Wu, Q.; Zou, S.; Xu, Q.; Chang, Y.; Zhao, X.; Yao, T.; Guo, L. A comparison of gas-liquid two-phase flow behaviors between two offshore pipeline-riser systems with different geometric parameters: From view of flow pattern identification. Ocean Eng. 2023, 288, 116179. [Google Scholar] [CrossRef]
  20. Olbrich, M.; Riazy, L.; Kretz, T.; Leonard, T.; van Putten, D.S.; Bär, M.; Oberleithner, K.; Schmelter, S. Deep learning based liquid level extraction from video observations of gas–liquid flows. Int. J. Multiph. Flow 2022, 157, 104247. [Google Scholar] [CrossRef]
  21. Quintino, A.M.; da Rocha, D.L.L.N.; Júnior, R.F.; Rodriguez, O.M.H. Flow Pattern Transition in Pipes Using Data-Driven and Physics-Informed Machine Learning. J. Fluids Eng. 2020, 143, 031401. [Google Scholar] [CrossRef]
  22. Iliyasu, A.M.; Bagaudinovna, D.K.; Salama, A.S.; Roshani, G.H.; Hirota, K. A Methodology for Analysis and Prediction of Volume Fraction of Two-Phase Flow Using Particle Swarm Optimization and Group Method of Data Handling Neural Network. Mathematics 2023, 11, 916. [Google Scholar] [CrossRef]
  23. Qiao, W.; Huang, E.; Guo, H.; Li, W.; Chen, H. Identification of two-phase flow patterns in Z-shaped offshore pipelines based on deep learning technologies. Ocean Eng. 2024, 291, 116422. [Google Scholar] [CrossRef]
  24. Salgado, W.L.; de Freitas Dam, R.S.; da Silva, A.X.; Salgado, C.M. Void fraction prediction using prompt gamma neutron activation analysis and artificial intelligence. Radiat. Phys. Chem 2023, 213, 111212. [Google Scholar] [CrossRef]
  25. Shadloo, M.S.; Rahmat, A.; Karimipour, A.; Wongwises, S. Estimation of pressure drop of two-phase flow in horizontal long pipes using artificial neural networks. J. Energy Resour. Technol. 2020, 142, 112110. [Google Scholar] [CrossRef]
  26. Ribeiro, J.X.F.; Liao, R.; Aliyu, A.M.; Liu, Z. Prediction of pressure gradient in two and three-phase flows in vertical pipes using an artificial neural network model. Int. J. Eng. Technol. Innov. 2019, 9, 155–170. [Google Scholar]
  27. Mauro, A.W.; Revellin, R.; Viscito, L. Development and assessment of performance of artificial neural networks for prediction of frictional pressure gradients during two-phase flow. Int. J. Heat Mass Transf. 2024, 221, 125106. [Google Scholar] [CrossRef]
  28. Mayet, A.M.; Chen, T.C.; Alizadeh, S.M.; Al-Qahtani, A.A.; Qaisi, R.M.A.; Alhashim, H.H.; Eftekhari-Zadeh, E. Application of Artificial Intelligence for Determining the Volume Percentages of a Stratified Regime’s Three-Phase Flow, Independent of the Oil Pipeline’s Scale Thickness. Processes 2022, 10, 1996. [Google Scholar] [CrossRef]
  29. Faraji, F.; Santim, C.; Chong, P.L.; Hamad, F. Two-phase flow pressure drop modelling in horizontal pipes with different diameters. Nucl. Eng. Des. 2022, 395, 111863. [Google Scholar] [CrossRef]
  30. Raza, S.; Sherin, S.; Hussain, S. Review of Phase Interference in Multiphase Flow for Enhancing. J. Hunan Univ. Sci. 2023, 50, 81–113. [Google Scholar]
  31. Yadigaroglu, G.; Hetsroni, G. Nature of Multiphase Flows and Basic Concepts. In Introduction to Multiphase Flow: Basic Concepts, Applications and Modelling; Springer: Cham, Switzerland, 2018. [Google Scholar]
  32. Cheng, L.; Xia, G. Flow patterns and flow pattern maps for adiabatic and diabatic gas liquid two phase flow in microchannels: Fundamentals, mechanisms and applications. Exp. Therm. Fluid Sci. 2023, 148, 110988. [Google Scholar] [CrossRef]
  33. Nie, F.; Wang, H.; Song, Q.; Zhao, Y.; Shen, J.; Gong, M. Image identification for two-phase flow patterns based on CNN algorithms. Int. J. Multiph. Flow 2022, 152, 104067. [Google Scholar] [CrossRef]
  34. Kadish, S.; Schmid, D.; Son, J.; Boje, E. Computer Vision-Based Classification of Flow Regime and Vapor Quality in Vertical Two-Phase Flow. Sensors 2022, 22, 996. [Google Scholar] [CrossRef] [PubMed]
  35. Zhang, L.; Zhang, S. Gas/Liquid Two-Phase Flow Pattern Identification Method Using Gramian Angular Field and Densely Connected Network. IEEE Sens. J. 2023, 23, 4022–4032. [Google Scholar] [CrossRef]
  36. Casas-Pulido, A.F.; Hernández-Cely, M.M.; Rodríguez-Hernández, O.M. Análisis experimental de flujo líquido-líquido en un tubo horizontal usando redes neuronales artificiales. Rev. UIS Ing. 2023, 22, 49–56. [Google Scholar] [CrossRef]
  37. Li, H.; Li, Y.; Zheng, G.; Zhou, Y. Interaction between household energy consumption and health: A systematic review. Renew. Sustain. Energy Rev. 2024, 189, 113859. [Google Scholar] [CrossRef]
  38. Donald, W.E.; Baruch, Y.; Ashleigh, M.J. Construction and operationalisation of an Employability Capital Growth Model (ECGM) via a systematic literature review (2016–2022). Stud. High. Educ. 2024, 49, 1–15. [Google Scholar] [CrossRef]
  39. Ciapponi, A. La declaración PRISMA 2020: Una guía actualizada para reportar revisiones sistemáticas. Evid. Actual. Práctica Ambulatoria 2021, 24, e002139. [Google Scholar] [CrossRef]
  40. Yuan, J.; Mao, W.; Hu, C.; Zheng, J.; Zheng, D.; Yang, Y. Leak detection and localization techniques in oil and gas pipeline: A bibliometric and systematic review. Eng. Fail. Anal. 2023, 146, 107060. [Google Scholar] [CrossRef]
  41. García-León, R.A.; Martínez-Trinidad, J.; Campos-Silva, I. Historical Review on the Boriding Process using Bibliometric Analysis. Trans. Indian Inst. Met. 2021, 74, 541–557. [Google Scholar] [CrossRef]
  42. García-León, R.A.; Afanador-García, N.; Guerrero-Gómez, G. A Scientometric Review on Tribocorrosion in Hard Coatings. J. Bio-Tribo-Corros. 2023, 9, 39. [Google Scholar] [CrossRef]
  43. Hou, Z.; Lee, C.K.M.; Lv, Y.; Keung, K.L. Fault detection and diagnosis of air brake system: A systematic review. J. Manuf. Syst. 2023, 71, 34–58. [Google Scholar] [CrossRef]
  44. García-León, R.A.; Gómez-Camperos, J.A.; Jaramillo, H.Y. Scientometric Review of Trends on the Mechanical Properties of Additive Manufacturing and 3D Printing. J. Mater. Eng. Perform. 2021, 30, 4724–4734. [Google Scholar] [CrossRef]
  45. Hu, Z.; Tariq, S.; Zayed, T. A comprehensive review of acoustic based leak localization method in pressurized pipelines. Mech. Syst. Signal Process. 2021, 161, 107994. [Google Scholar] [CrossRef]
  46. Fan, H.; Tariq, S.; Zayed, T. Acoustic leak detection approaches for water pipelines. Autom. Constr. 2022, 138, 104226. [Google Scholar] [CrossRef]
  47. Dong, F.; Zhang, S.; Shi, X.; Wu, H.; Tan, C. Flow regimes identification-based multidomain features for gas–liquid two-phase flow in horizontal pipe. IEEE Trans. Instrum. Meas. 2021, 70, 1–11. [Google Scholar] [CrossRef]
  48. Amirsoleymani, A.; Ting, D.S.K.; Carriveau, R.; Brown, D.; McGillis, A. Two-phase flow pattern identification in CAES systems with dimensional analysis coupled with support vector machine. Int. J. Multiph. Flow 2023, 160, 104343. [Google Scholar] [CrossRef]
  49. Xu, Q.; Wang, X.; Luo, X.; Tang, X.; Yu, H.; Li, W.; Guo, L. Machine learning identification of multiphase flow regimes in a long pipeline-riser system. Flow Meas. Instrum. 2022, 88, 102233. [Google Scholar] [CrossRef]
  50. Yaqub, M.W.; Marappagounder, R.; Rusli, R.; Prasad, D.M.R.; Pendyala, R. Flow pattern identification and measurement techniques in gas-liquid-liquid three-phase flow: A review. Flow Meas. Instrum. 2020, 76, 101834. [Google Scholar] [CrossRef]
  51. Jeshvaghani, P.A.; Khorsandi, M.; Panahi, R. Flow regime identification and gas volume fraction prediction in two-phase flows using a simple gamma-ray gauge combined with parallel artificial neural networks. Flow Meas. Instrum. 2022, 86, 102190. [Google Scholar] [CrossRef]
  52. AlSaif, A.; Al-Sarkhi, A.; Ismaila, K.; Abdulkadir, M. Road map to develop an artificial neural network to predict two-phase flow regime in inclined pipes. J. Pet. Sci. Eng. 2022, 217, 110877. [Google Scholar] [CrossRef]
  53. Ruiz-Diaz, C.M.; Hernández-Cely, M.M.; González-Estrada, O.A. A Predictive Model for the Identification of the Volume Fraction in Two-Phase Flow. Cienc. Desarro. 2021, 12, 49–55. [Google Scholar]
  54. Salgado, W.L.; Dam, R.S.F.; Salgado, C.M. Optimization of a flow regime identification system and prediction of volume fractions in three-phase systems using gamma-rays and artificial neural network. Appl. Radiat. Isot. 2021, 169, 109552. [Google Scholar] [CrossRef] [PubMed]
  55. Figueiredo, M.M.F.; Goncalves, J.L.; Nakashima, A.M.V.; Fileti, A.M.F.; Carvalho, R.D.M. The use of an ultrasonic technique and neural networks for identification of the flow pattern and measurement of the gas volume fraction in multiphase flows. Exp. Therm. Fluid Sci. 2016, 70, 29–50. [Google Scholar] [CrossRef]
  56. Mohammed, S.; Abdulkareem, L.; Roshani, G.H.; Eftekhari-Zadeh, E.; Haso, E. Enhanced Multiphase Flow Measurement Using Dual Non-Intrusive Techniques and ANN Model for Void Fraction Determination. Processes 2022, 10, 2371. [Google Scholar] [CrossRef]
  57. Roshani, M.; Phan, G.T.; Ali PJ, M.; Roshani, G.H.; Hanus, R.; Duong, T.; Corniani, E.; Nazemi, E.; Kalmoun, E.M. Evaluation of flow pattern recognition and void fraction measurement in two phase flow independent of oil pipeline’s scale layer thickness. Alexandria Eng. J. 2021, 60, 1955–1966. [Google Scholar] [CrossRef]
  58. Jeshvaghani, P.A.; Saraee, K.R.E.; Feghhi, S.A.H.; Jafari, A. Using statistical features and a neural network to predict gas volume fractions independent of flow regime changes. Flow Meas. Instrum. 2023, 93, 102430. [Google Scholar] [CrossRef]
  59. Hosseini, S.; Iliyasu, A.M.; Akilan, T.; Salama, A.S.; Eftekhari-Zadeh, E.; Hirota, K. Accurate flow regime classification and void fraction measurement in two-phase flowmeters using frequency-domain feature extraction and neural networks. Separations 2022, 9, 160. [Google Scholar] [CrossRef]
  60. Affonso, R.R.W.; Dam, R.S.F.; Salgado, W.L.; da Silva, A.X.; Salgado, C.M. Flow regime and volume fraction identification using nuclear techniques, artificial neural networks and computational fluid dynamics. Appl. Radiat. Isot. 2020, 159, 109103. [Google Scholar] [CrossRef] [PubMed]
  61. Salgado, C.M.; Dam, R.S.F.; Salgado, W.L.; Santos, M.C.; Schirru, R. Development of a deep rectifier neural network for fluid volume fraction prediction in multiphase flows by gamma-ray densitometry. Radiat. Phys. Chem. 2021, 189, 109708. [Google Scholar] [CrossRef]
  62. Byjus. Capacitive Sensors. WebPage 2023. Available online: https://byjus.com/physics/capacitive-sensors/ (accessed on 20 February 2024).
  63. Chen, T.-C.; Alizadeh, S.M.; Alanazi, A.K.; Grimaldo Guerrero, J.W.; Abo-Dief, H.M.; Eftekhari-Zadeh, E.; Fouladinia, F. Using ANN and combined capacitive sensors to predict the void fraction for a two-phase homogeneous fluid independent of the liquid phase type. Processes 2023, 11, 940. [Google Scholar] [CrossRef]
  64. Iliyasu, A.M.; Fouladinia, F.; Salama, A.S.; Roshani, G.H.; Hirota, K. Intelligent Measurement of Void Fractions in Homogeneous Regime of Two Phase Flows Independent of the Liquid Phase Density Changes. Fractal Fract. 2023, 7, 179. [Google Scholar] [CrossRef]
  65. Veisi, A.; Shahsavari, M.H.; Roshani, G.H.; Eftekhari-Zadeh, E.; Nazemi, E. Experimental Study of Void Fraction Measurement Using a Capacitance-Based Sensor and ANN in Two-Phase Annular Regimes for Different Fluids. Axioms 2023, 12, 66. [Google Scholar] [CrossRef]
  66. Masasi, B.; Frazier, R.; Taghvaeian, S. Review and Operational Guidelines for Portable Ultrasonic Flowmeters; Department of Biosystems & Agricultural Engineering, Oklahoma State University: Stillwater, OK, USA, 2017; Volume 1, pp. 1535-1–1535-8. [Google Scholar]
  67. Nnabuife, S.G.; Kuang, B.; Rana, Z.A.; Whidborne, J. Classification of flow regimes using a neural network and a non-invasive ultrasonic sensor in an S-shaped pipeline-riser system. Chem. Eng. J. Adv. 2022, 9, 100215. [Google Scholar] [CrossRef]
  68. Ajbar, W.; Torres, L.; Guzmán, J.E.V.; Hernández-García, J.; Palacio-Pérez, A. Development of artificial neural networks for the prediction of the pressure field along a horizontal pipe conveying high-viscosity two-phase flow. Flow Meas. Instrum. 2024, 96, 102541. [Google Scholar] [CrossRef]
  69. Mao, N.; Azman, A.N.; Ding, G.; Jin, Y.; Kang, C.; Kim, H.-B. Black-box real-time identification of sub-regime of gas-liquid flow using Ultrasound Doppler Velocimetry with deep learning. Energy 2022, 239, 122319. [Google Scholar] [CrossRef]
  70. Yin, P.; Cao, X.; Zhang, P.; Yang, W.; Bian, J.; Guo, D. Investigation of slug flow characteristics in hilly terrain pipeline using ultrasonic Doppler method. Chem. Eng. Sci. 2020, 211, 115300. [Google Scholar] [CrossRef]
  71. Wajman, R. Computer methods for non-invasive measurement and control of two-phase flows: A review study. Inf. Technol. Control 2019, 48, 464–486. [Google Scholar] [CrossRef]
  72. Zhang, J.; Huang, Y.; Pu, R.; Gonzalez-Moreno, P.; Yuan, L.; Wu, K.; Huang, W. Monitoring plant diseases and pests through remote sensing technology: A review. Comput. Electron. Agric. 2019, 165, 104943. [Google Scholar] [CrossRef]
  73. Kuang, B.; Nnabuife, S.G.; Sun, S.; Whidborne, J.F.; Rana, Z.A. Gas-liquid flow regimes identification using non-intrusive Doppler ultrasonic sensor and convolutional recurrent neural networks in an s-shaped riser. Digit. Chem. Eng. 2022, 2, 100012. [Google Scholar] [CrossRef]
  74. Camperos, J.A.G.; Diaz, C.M.R.; Cely, M.M.H. Specialist system in flow pattern identification using artificial neural networks. J. Appl. Eng. Sci. 2023, 21, 285–299. [Google Scholar]
  75. Seong, Y.; Park, C.; Choi, J.; Jang, I. Surrogate model with a deep neural network to evaluate gas–liquid flow in a horizontal pipe. Energies 2020, 13, 968. [Google Scholar] [CrossRef]
  76. Ruiz-Díaz, C.M.; Perilla-Plata, E.E.; González-Estrada, O.A. Two-Phase Flow Pattern Identification in Vertical Pipes Using Transformer Neural Networks. Inventions 2024, 9, 15. [Google Scholar] [CrossRef]
  77. García-León, R.A.; Gomez-Camperos, J.; Jaramillo, H. Bibliometric analysis in brake disc: An overview. Dyna 2021, 88, 23–31. [Google Scholar] [CrossRef]
  78. He, Q.; Wang, G.; Luo, L.; Shi, Q.; Xie, J.; Meng, X. ScienceDirect Mapping the managerial areas of Building Information Modeling (BIM) using scientometric analysis. Int. J. Proj. Manag. 2017, 35, 670–685. [Google Scholar] [CrossRef]
  79. Aria, M.; Cuccurullo, C. bibliometrix: An R-tool for comprehensive science mapping analysis. J. Informetr. 2017, 11, 959–975. [Google Scholar] [CrossRef]
  80. Casado-Aranda, L.-A.; Sánchez-Fernández, J.; Viedma-del-Jesús, M.I. Analysis of the scientific production of the effect of COVID-19 on the environment: A bibliometric study. Environ. Res. 2021, 193, 110416. [Google Scholar] [CrossRef]
Figure 1. An overview of flexible mechanical sensing technology. Source: Obtained from [3].
Fluids 09 00158 g001
Figure 2. Main soft computing techniques. Source: Obtained from [4].
Fluids 09 00158 g002
Figure 3. Annular (a), bubble (b), agitated (c), intermittent (d), stratified (e). Source: Obtained from [33].
Fluids 09 00158 g003
Figure 4. Gas–liquid flow classes in vertical pipes (from left to right); liquid/tiny bubbles, small bubbles, large bubbles, dense bubbles/Taylor bubbles, churn, annular, and mist/vapor. Source: Obtained from [34].
Fluids 09 00158 g004
Figure 5. Prism flowchart. Source: Adapted from [43].
Fluids 09 00158 g005
Figure 6. Bibliometric analysis diagram.
Fluids 09 00158 g006
Figure 7. Schematic diagram of ANN model. Source: Obtained from [52].
Fluids 09 00158 g007
Figure 8. Simulated geometry of the three-phase flowmeter for flow regimes: (a) annular, (b) stratified, (c) homogeneous, extended with ANN. Source: Obtained from [54].
Fluids 09 00158 g008
Figure 9. Schematic representation of an acquisition system. Source: Modified from [55].
Fluids 09 00158 g009
Figure 10. Schematic representation of a capacitive sensor. Source: Obtained from [62].
Fluids 09 00158 g010
Figure 11. Schematic representation of a Doppler ultrasonic sensor. Source: Obtained from [66].
Fluids 09 00158 g011
Figure 12. Non-invasive sensor for flow diagnosis.
Fluids 09 00158 g012
Figure 13. Word network obtained by bibliometric analysis with the open access program VOSviewer.
Fluids 09 00158 g013
Figure 14. Thematic groupings brought together by the proximity and repetition of the research keywords.
Fluids 09 00158 g014
Figure 15. Co-authorship network through bibliometric analysis with the free access program VOS viewer.
Fluids 09 00158 g015
Figure 16. Annual publication trends.
Fluids 09 00158 g016
Figure 17. Most relevant sources.
Fluids 09 00158 g017
Figure 18. Growth in the number of articles from more relevant sources.
Fluids 09 00158 g018
Figure 19. Collaboration between authors.
Fluids 09 00158 g019
Table 1. Search equation.
TopicSearch terms
Subject(“Artificial intelligence”) OR (“Machine learning”) OR (Neural network)
Approach((“Flow” AND “Liquid–gas”) OR (“Volume fraction” AND “Liquid–gas”) OR (“two-phase flow pattern classification”))
Context(“Pipes”) OR (“Gas pipeline”) OR (“Oil”)
Table 2. Inclusion and exclusion criteria.
CriteriaInclusionExclusion
Publication Year2019–2024Before 2019
LanguageEnglishOther languages
KeywordsArtificial intelligence, machine learning, two-phase flow, liquid–gas flow, volume fraction—two-phase flowMissing keywords
Database SourceScience Direct, Scopus, Google ScholarOther databases
Document TypePeer-reviewed journal articles, conference papersBooks, theses, non-peer-reviewed articles
Full-text availabilityAvailableUnavailable
Relevance to TopicDirectly related to the application of artificial intelligence techniques for the hydrodynamic characterization of two-phase liquid–gas flows in pipelinesIrrelevant to the topic
Title-Abs-Key(“artificial intelligence” OR “machine learning” OR “neural network”) AND ((“flow” AND “liquid–gas”) OR (“volume fraction” AND “liquid–gas”) OR (“two-phase flow pattern classification”)) AND (“pipe” OR “gas pipeline” OR “oil”).
Table 3. Flow regime identification using the SVM Method.
ReferenceYearCharacteristicsMeasuring InstrumentPrecision
[47]2021Horizontal pipeline, multi-domain feature processing.Conductance ring sensor<95%
[48]2022Standpipe uses time series of void fraction (from a wire mesh sensor), signal processing, and machine learning.Wire mesh sensor (WMS)<0.94
[49]2022S-shaped riser pipe 1687 m long.Regulating valves, flow meters, and differential pressure sensors are arranged along the pipeline.<90%
[48]2023Two-phase upward flow in large-diameter vertical pipes.A dimensional analysis was conducted, considering the pipe’s vertical geometry and the fluids’ thermophysical properties.General of 81.75%.
Table 4. Commonly topology used in ANNs.
ANNTopologyFunction
MLPMLPattern recognition, function approximation, modeling and control, classification
BRFTLFunction approximation, classification
WNNTLForecast, classification, function approximation
ELMTLFunction approximation, classification
ElmanRecurrentTime-series forecast, pattern recognition
HoplfieldRecurrentPattern recognition, associative memory, optimization, image processing
KohonenSLPattern recognition, associative memory, classification
PNNFLPattern recognition, classification
CNNMLOptimization, classification
ARTRecurrentOptimization, classification
CMACMLFunction approximation, modelling and control
CMMultiple NNsPattern recognition, function approximation, modeling and control, classification
MLPML (13/2)Predicting the weight percent of conversion and coke yield
SOC-CNNML (28/16)Modeling and Operational Optimization
MLPTL (3/5)Study the effect of thermal and catalytic cracking under high-severity operating conditions
BP-NNML (3/5)Product yield prediction
DNNML (3/5)Product yield prediction
Table 5. Works found on using gamma-ray sensors to characterize flow patterns and volumetric fractions.
ReferenceYearArtificial TechniqueMeasuring InstrumentPrecisionCharacteristic
[51]2022Multilayer perceptron neural networkGamma-ray sensor, horizontal pipeAverage relative error of less than 3%Gas volume fraction and the identification of five flow regimes; the bubble, dispersed, plugged, annular, and slug regimes
[56]2022Multilayer perceptron neural networkSimulation of electrical capacitance and gamma-ray sensorsError less than 0.006Volume fraction of two-phase flow (air–oil)
[57]2021Multilayer perceptron with the Levenberg–Marquardt algorithmSimulation of gamma energy sensors, composed of barium-133 and cesium-137 radioisotopes and two sodium iodidesAverage relative error is less than 2.82Flow pattern and gas volume percentage
[58]2023Multilayer perceptron neural networkA 137 Cs gamma-ray source and a 3-inch NaI(Tl) sensor, commonly used as a scintillation detectorAverage relative error less than 0.00012Predictions of gas volume fraction (GVF) in two-phase flow independent of changes in the flow regime
[59]2022Multilayer perceptron (MLP) neural networksSimulation of 137 Cs source sensors and two NaI detectors to record the photons that passed through the pipe with an inner diameter of 95 mm and a thickness of 2.5 mmLow root means a square error of 1.1%Volume fraction predictions, through simulation of three homogeneous, annular, and stratified regimes using the Monte Carlo N-Particle Code (MCNP)
[60]2020Neural networksSensor simulation of a gamma-ray source and a NaI(Tl) detectorRelative errors less than 1.1%Volume fraction predictions in stratified flow and annular flow
[61]2021Deep rectifier neural network (DRNN)Gamma-ray densitometryRoot mean square error less than 0.8Prediction of volume fractions
Disclaimer/Publisher’s Note: The statements, opinions and data contained in all publications are solely those of the individual author(s) and contributor(s) and not of MDPI and/or the editor(s). MDPI and/or the editor(s) disclaim responsibility for any injury to people or property resulting from any ideas, methods, instructions or products referred to in the content.

