Article

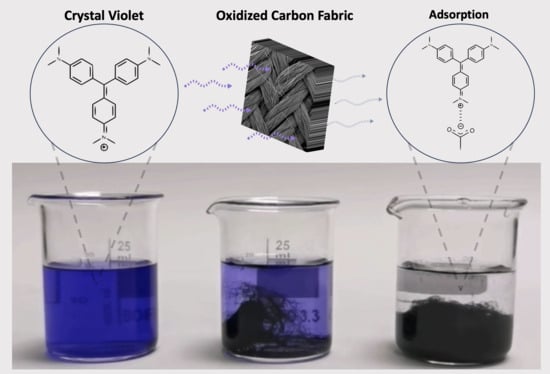
Removal of Crystal Violet Dye from Aqueous Solutions through Adsorption onto Activated Carbon Fabrics

1
Department of Mechanical and Manufacturing Engineering, University of Cyprus, 2109 Nicosia, Cyprus
2
Department of Chemistry, University of Cyprus, 2109 Nicosia, Cyprus
3
Department of Mechanical and Materials Science and Engineering, Cyprus University of Technology, 3036 Lemesos, Cyprus
4
Department of Mechanical Engineering Sciences, University of Surrey, Guildford GU27XH, UK
5
Department of Materials Science, Montanuniversität Leoben, 8700 Leoben, Austria
*
Authors to whom correspondence should be addressed.
Submission received: 18 January 2024 / Revised: 14 February 2024 / Accepted: 18 February 2024 / Published: 20 February 2024
(This article belongs to the Section Carbon Materials and Carbon Allotropes)

Abstract

:
The removal of contaminants from aqueous solutions by adsorption onto carbonaceous materials has attracted increasing interest in recent years. In this study, pristine and oxidized activated carbon (AC) fabrics with different surface textures and porosity characteristics were used for the removal of crystal violet (CV) dye from aqueous solutions. Batch adsorption experiments were performed to investigate the CV adsorption performance of the AC fabrics in terms of contact time, temperature, adsorbate concentration and adsorbent amount. Evaluation of the thermodynamic parameters and the adsorption performance of the AC fabrics in ground water and sea water solutions were also carried out. Langmuir isotherm model, pseudo first and pseudo second order kinetics models were utilized to analyze and fit the adsorption data. The introduction of oxygen-based functional groups on the surface of AC fabrics was carried out through a nitric acid treatment. This oxidation process resulted in a significant reduction in the surface area and pore volume, along with a small increase in the average pore size and a significant enhancement in the CV adsorption capacity, indicating that the dye molecules are mainly adsorbed on the external surface of the carbon fabrics. The herein evaluated 428 mg/g adsorption capacity at 55 °C for the oxidized non-woven AC fabric is one of the highest adsorption capacity values reported in the literature for CV removal using AC materials. Thermodynamic studies showed that the adsorption occurs spontaneously and is an endothermic and entropy-driven reaction. Furthermore, pristine and oxidized non-woven AC fabrics displayed more than 90% CV uptake from sea water samples, underlining the great potential these fabrics possess for the removal of dyes from natural/multicomponent waters.

Graphical Abstract

1. Introduction

Synthetic dyes, which are used as cheaper alternatives to natural dyes, are widely utilized in industries including textile, printing, leather, food and cosmetics [1]. The dyes pose serious environmental concerns as pollutants, and the release of industrial dye effluents into water systems leads to pollution and contamination of ground and underground water sources [2]. These dyes are non-biodegradable and carcinogenic, and exhibit high toxicity, which could result in harmful effects on vegetation, humans and animals, even when present in small quantities [3,4]. Synthetic dyes, which are being released by these industries into the environment in concentrations ranging from 10 to 200 mg/L, can be categorized as cationic, anionic and non-ionic dyes [5,6]. Cationic dyes, posing a greater hazard compared to other types, find extensive application and significantly contribute to environmental contamination, with 12% of their yearly output being disposed of into industrial water streams [7].
Crystal violet (CV), alternatively methyl violet 10B, basic violet 3 or gentian violet, is a cationic dye belonging to the triphenylmethane structure [8,9]. It finds wide applications in the textile industry and for biological investigations [10]. However, the excessive accumulation of CV in the human body can lead to health problems including increased heart rate, eye irritation and damage, paralysis and kidney diseases [11]. Therefore, the removal of CV from contaminated wastewater is crucial. Several methods have been reported in the literature for removing crystal violet dye, including chemical precipitation, membrane filtration, biological treatment, photodegradation and adsorption [12,13,14,15,16,17,18]. Among these techniques, adsorption is often preferred as a simple, low-cost and effective method for treating polluted waters [19].
The effectiveness of the adsorption process is mainly dependent on the adsorbate properties (e.g., solubility, polarity, charge), adsorbent characteristics (e.g., surface area, porosity, surface functional groups) and experimental conditions that can affect the interaction between the adsorbate and the adsorbent (e.g., contact time, pH, ionic strength, presence of competing species and temperature). Therefore, by employing a suitable adsorbent material, such as activated carbons, pollutants can be effectively removed. Activated carbon (AC) materials, which are known for their significantly high specific surface area and pore volume, can be utilized in adsorption processes (as adsorbent materials) for effectively treating contaminated waters. There are various types of activated carbons, such as biochar, granular AC, powdered AC and AC fibers, that have been widely investigated regarding the decontamination of polluted water systems from heavy metals [20], pharmaceuticals [21], radionuclides [22] and dyes [23,24,25].
AC fibers derived from pitch-based fibers, cellulose-based precursors and polymeric precursors exemplify a form of activated carbon that possesses a fibrous structure [26,27]. AC materials produced in the form of cloths, fabrics or felts using fiber-based precursors (e.g., viscose rayon cloth) show unique advantages in terms of handling and processing, as they possess flexible, self-standing and binder-free structures that allow them to be used as practical components in energy and environmental applications (e.g., filters, electrodes, membranes) [28,29]. In comparison to other activated carbon types, activated carbon cloth (ACC) materials have unique characteristics such as large surface area, which leads to high contact surface, higher adsorbing capacity, low ash content, shorter desorption time and higher regeneration ability. In addition, light weight and higher mechanical flexibility provide easier handling [30]. Moreover, by modifying the ACC materials, the surface morphology, chemistry and nanopore structure can be improved for more effective interaction between adsorbate and adsorbent, which may lead to efficient elimination of pollutants from aqueous solutions.
Decontamination of CV dye from water through adsorption has been extensively studied before [31,32,33,34]. Abbas et al. [35] prepared AC to remove CV dye from solutions. Their study showed that their AC can adsorb up to ~32.3 mg/g of CV from water at 40 °C. Gohr et al. [36] have studied chemically modified AC adsorption of cationic dyes from water, reporting a maximum uptake of 120 mg/g for CV. Goswami et al. [37] utilized modified AC with a surface area of ~202 m2/g for the elimination of CV and mentioned a maximum CV uptake capacity of 235.7 mg/g. In addition, ACC-type materials are also being used for the removal of contaminants from aqueous solutions. For example, Duman et al. [38] have utilized commercial ACC with a surface area of 1870 m2/g to remove cationic surfactants from aqueous solutions by adsorption, while Kumari al. [39] have prepared AC fibers for wastewater treatment.
In this work, three commercial activated carbon fabrics, with different surface textures and porosity characteristics, have been used for the removal of CV dye from aqueous solutions. The activated fabrics were controllably oxidized with nitric acid to enhance the affinity of the carbon fabrics towards CV molecules by introducing carboxylic functional groups on their surface and thus improving their adsorption capacities. Both the pristine and oxidized carbon fabrics were studied in detail for their nanopore structure, surface morphology, surface chemistry and elemental composition using advanced characterization methods, including gas sorption analysis (GSA), scanning electron microscopy (SEM), Fourier-transform infrared spectroscopy (FTIR) and X-ray photoelectron spectroscopy (XPS), respectively. In addition, the adsorption performance of the AC fabrics was analyzed in terms of the contact time, temperature, adsorbate and adsorbent dosage. Moreover, removal efficiencies in ground and sea water solutions were also assessed. CV was selected as the most suitable cationic dye for this study because it offers advantages in terms of symmetry and color stability, especially above pH 2, which is critical for accurate and consistent photometric measurements.

2. Materials and Methods

2.1. Materials

The AC fabrics used in this study, ACF1200 (felt type), TCBACC1100140 (woven type) and ACFNW1520-100P (non-woven type), were provided by Evertech Envisafe Ecology Co., Ltd. (Keelung City, Taiwan). The fabrics were named according to their surface textures, i.e., AC-F, AC-W and AC-NW for the felt-, woven- and non-woven type fabrics, respectively. The oxidation treatment of the pristine AC fabrics was carried out using HNO3 (8 M), which was purchased from Sigma–Aldrich (St. Louis, MO, USA).
CV (MW = 407.979 g/mol; λmax = 590 nm) dye was purchased from Sigma–Aldrich. Initially, a 1000 ppm stock solution of CV was prepared by dissolving 1 g of CV powder in 1 L of deionized water for single-component adsorption experiments. All required experimental solution concentrations were prepared by dilutions from the stock solution.

2.2. Carbon Fabric Treatment

The surface treatment of raw AC fabrics was carried out with 8 M concentrated HNO3 under reflux at controlled temperature for 1 h. During the oxidation process, the temperature was kept in the range of 85 °C to 95 °C, and continuous stirring was applied. After completion of the oxidation, the fabrics were carefully washed with distilled water, filtered and then dried in an oven under vacuum at 70 °C overnight. The oxidized samples are named AC-FO, AC-WO and AC-NWO.

2.3. Characterization Methods

For surface area and nanopore structure analysis, N2 adsorption/desorption tests were conducted at −195.8 °C using a manometric gas sorption analyzer (Anton Paar QuantaTec Autosorb iQ3, Boynton Beach, FL, USA). Ultra-high-purity He and N2 gases (99.999%) were utilized for void volume calculations and gas sorption analysis, respectively. Before the tests, approximately 40 mg of each sample was subjected to high vacuum degassing at 250 °C for 24 h to improve surface/pore accessibility. Specific surface area (SSA) was determined using the multi-point Brunauer–Emmett–Teller (BET method) in accordance with the BET consistency criteria outlined by the International Standard Organization [40]. Specific pore volume (SPV) was calculated using the single-point Gurvich rule at relative pressures near unity. The average pore width (W) was estimated using the ratio of 2·SPV/SSA, assuming an infinitely extended slit-like pore geometry. The pore size distribution analysis was carried out using the quenched solid density functional theory (QSDFT) method based on the N2–carbon adsorption kernel at −195.8 °C for slit- and cylindrical-shaped pores.
Surface morphology was studied by means of scanning electron microscopy (SEM) using a FEI Quanta 200 microscope (Hillsboro, OR, USA) with an acceleration voltage of 20 kV and a working distance of 10 mm. To ensure proper conductivity and prevent charging effects during imaging, the samples underwent sputter-coating with gold before SEM analysis.
X-ray photoelectron spectroscopy (XPS) investigations were conducted using a Thermo Scientific Theta Probe spectrometer (Waltham, MA, USA) equipped with a monochromatic Al Kα radiation source (hv = 1486.6 eV) with an X-ray spot radius of approximately 400 mm. Survey spectra were acquired with a pass energy of 300 eV, while a high-resolution core level spectrum for the C1s component was obtained using a pass energy of 50 eV. All spectra were charge-referenced against the C1s peak at 284.5 eV (representing sp2 hybridized carbon) to compensate for charging effects during data acquisition. Quantitative chemical analysis was determined based on the high-resolution core level spectra, incorporating instrument-modified Wagner sensitivity factors and the removal of a non-linear Shirley background.
Identification of the possible surface functional groups was performed with Fourier-transform infrared spectroscopy (FTIR) using a Shimadzu IR Prestige spectrometer (Tokyo, Japan). Samples were prepared by mixing KBr with the fabrics, and the prepared mixture was then subjected to high-pressure compaction to form a translucent disc. The analyses were performed within the wavenumber range of 500–4000 cm−1.
A UV–Visible spectrophotometer (Shimadzu UV-2401PC; Columbia, MD, USA) was employed to measure the maximum absorption peak of CV at 590 nm and following the dye concentration using 1 cm plastic cuvettes. The spectral analysis was carried out between 400 nm and 700 nm with a sampling interval of 0.2 nm.

2.4. Batch Adsorption Experiments

The adsorption experiments were carried out in batch mode at room temperature by using 10 mg of oxidized and non-oxidized AC samples placed in a beaker containing 25 mL of CV solutions. The prepared adsorbent and adsorbate mixtures were then placed onto a shaker with an agitation speed of 100 rpm for 24 h under room temperature (23 ± 2 °C), which was assigned to attain equilibrium. After 24 h, the CV concentration remaining in the solutions was analyzed by placing the solutions into the UV–Visible spectrophotometer. The effects of experimental variables (effect of dye concentration, contact time, adsorbent dosage and temperature) on the CV adsorption were separately evaluated.
The effect of the initial concentration on the adsorption was carried out with CV concentrations ranging from 1 ppm to 200 ppm. The experiments were conducted by using 10 mg from each AC sample. The effect of adsorbent dosage was investigated by altering the dosage of activated carbons (5, 10, 50 and 100 mg), while the concentration of the solutions was kept at 100 ppm.
The impact of temperature on the adsorption of CV dye on the AC-NWO material was also examined for 45 °C and 55 °C. Experiments were carried out for 20, 50, 100, 150 and 200 ppm of CV concentrations. The solutions were placed in an oven at the desired temperature and measurements were obtained after 24 h. AC-NWO was selected as it provides much greater adsorption performance compared to other cloths.
For examining the effect of time, 50 mg of carbon cloths were mixed with 20 ppm of the CV solution, and kinetics experiments were conducted by measuring the concentration left in the solution after 1, 5, 10, 20, 30, 40 and 60 min.
Multicomponent solutions were obtained by dissolving the desired amount of CV powder in ground water and sea water solutions instead of preparing the solutions with deionized water. Dye solutions of 50 ppm were used for this part of the experiment. The prepared solutions were then brought in contact with each of the AC fabrics separately and left for 24 h on a shaker with an agitation speed of 100 rpm. During the analysis of a specific parameter, the other variables were kept constant at the optimum values.
The amount of CV dye adsorbed per unit mass (qe) and the percentage of the dye removed can be calculated by using Equations (1) and (2), respectively:
q e = C 0 C e q V m
%   r e m o v e d = C 0 C e q C 0 × 100
There, C0 and Ceq are the initial and equilibrium dye concentration of the solution, V symbolizes the volume of the solution and m represents the mass of adsorbent.

2.5. Adsorption Isotherms

Adsorption isotherm analysis is a significant factor in elucidating the interaction between the adsorbent and the adsorbate. In addition, this is crucial not only for explaining the adsorption mechanism but also for determining the maximum adsorption capacity. Adsorption equilibrium studies for CV dye on all six AC fabrics (in pristine and oxidized form) were performed. The Langmuir adsorption model is given by [38]:
q e = q m a x K L C e q 1 + K L C e q
where qmax represents the maximum adsorption capacity in mg/g and KL is the Langmuir constant in L/mg. The Langmuir model assumes a single layer and homogeneous adsorption of molecules onto the adsorbate [41].

2.6. Thermodynamic Studies

Thermodynamic parameters of adsorption were evaluated by using Equations (4)–(6) for Gibbs free energy change (ΔG°), enthalpy change (ΔH°) and entropy change (ΔS°), respectively:
Δ G ° = R T l n K c
Δ H ° = R ( T 2 T 1 T 2 T 1 ) l n ( K T 2 K T 1 )
Δ G ° = Δ H ° T Δ S °
Here, R is the universal gas constant (R = 8.314 J/mol∙K), T represents the studied temperature and Ks, Kc, KT1 and KT2 are the dimensionless Langmuir constants at temperatures T, T1 (318 K) and T2 (328 K), respectively.

3. Results and Discussion

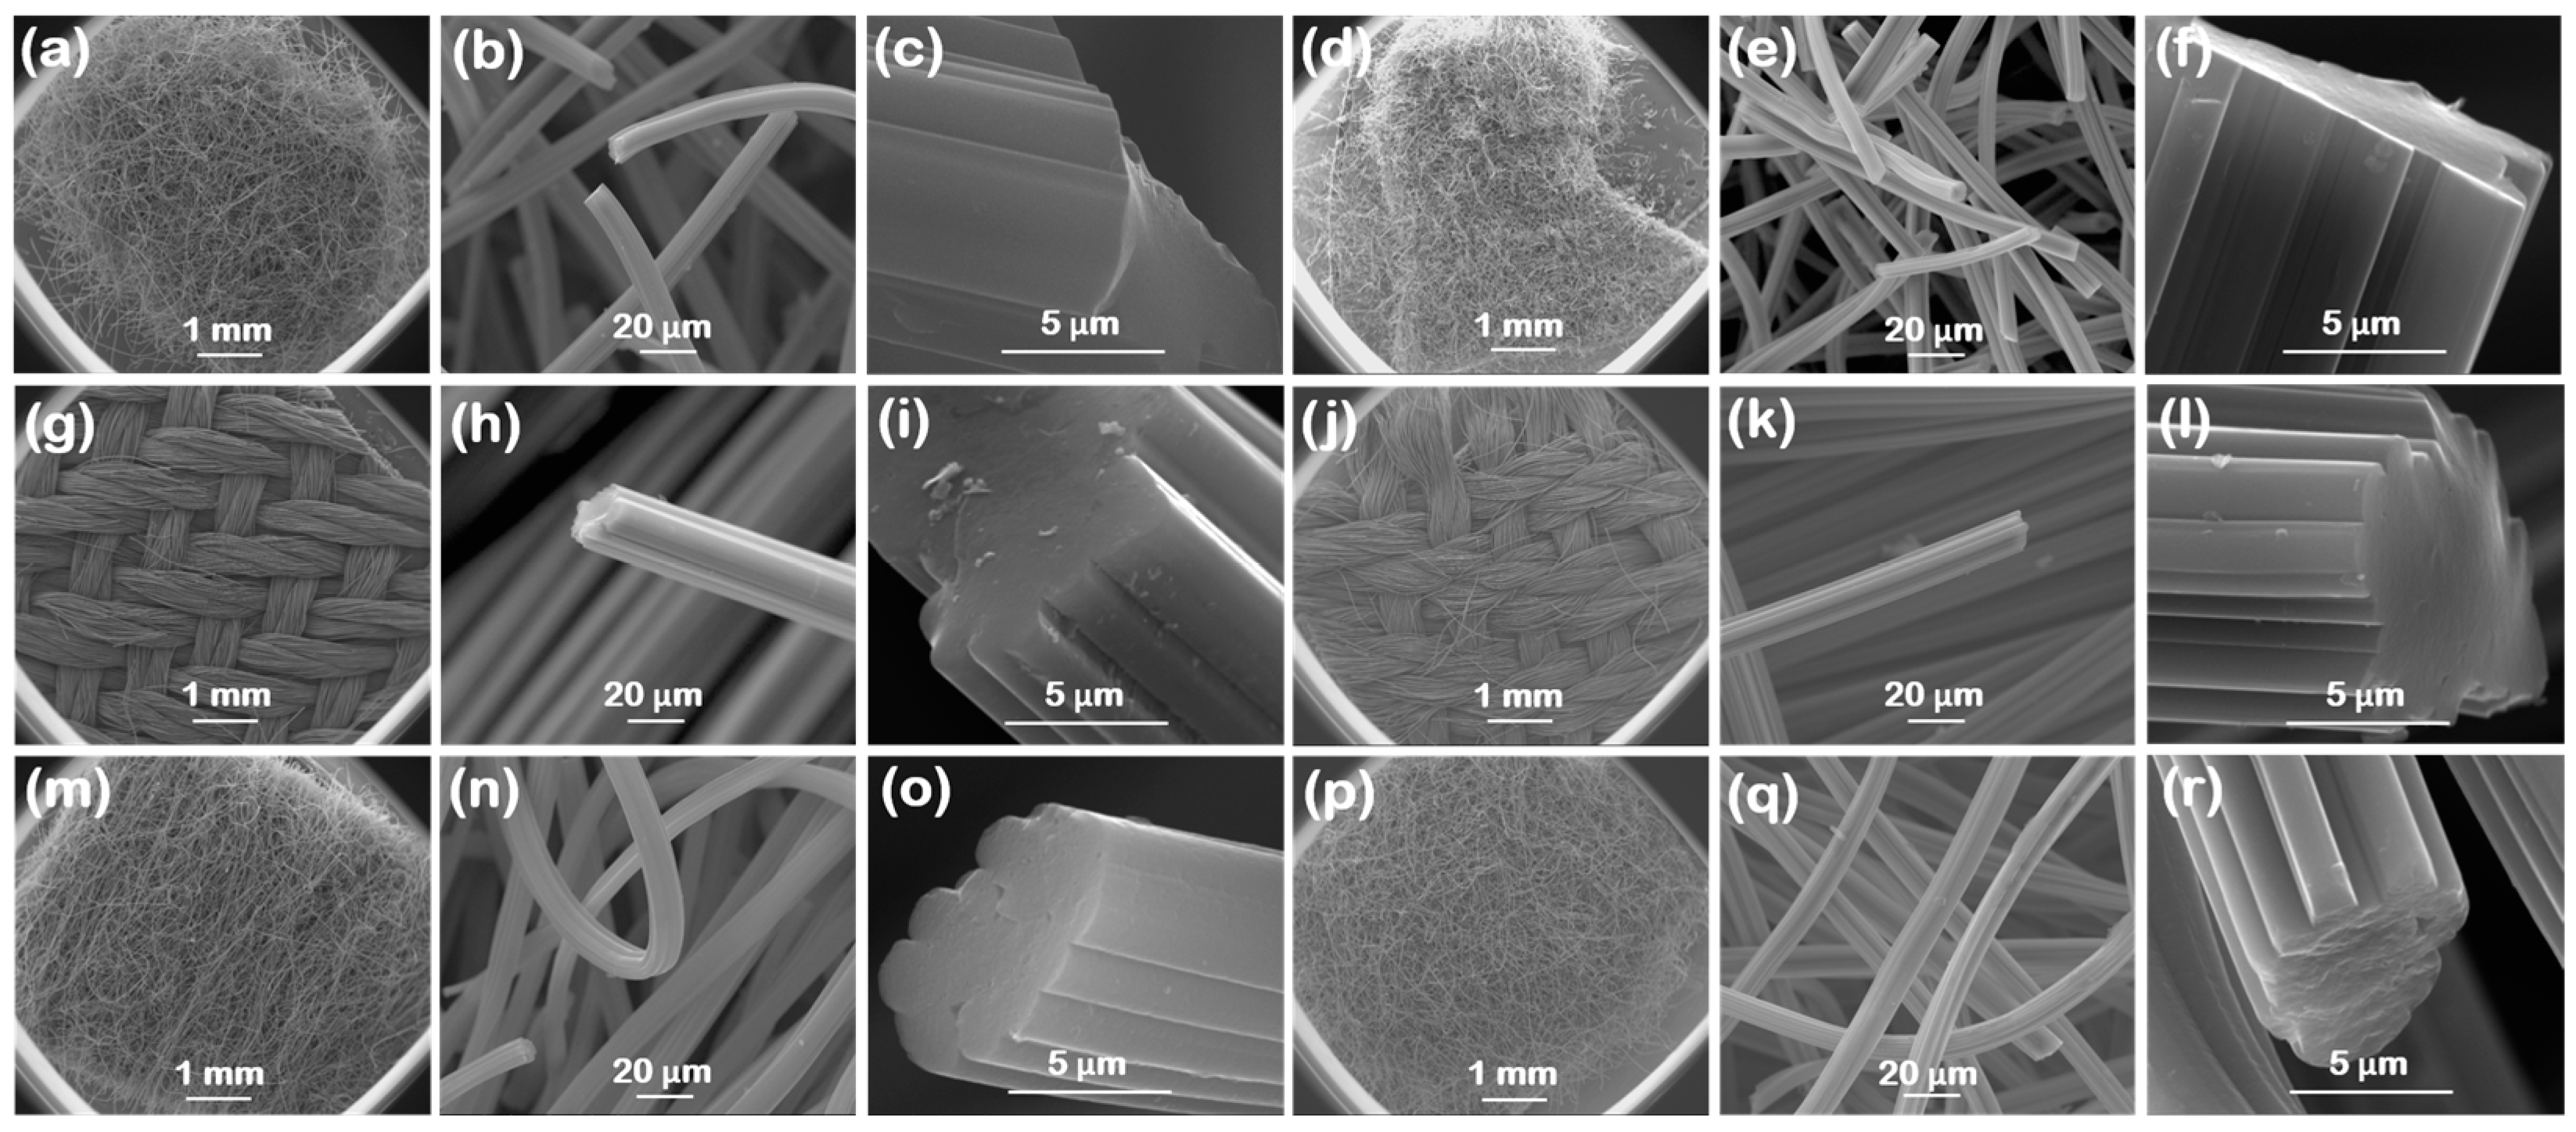
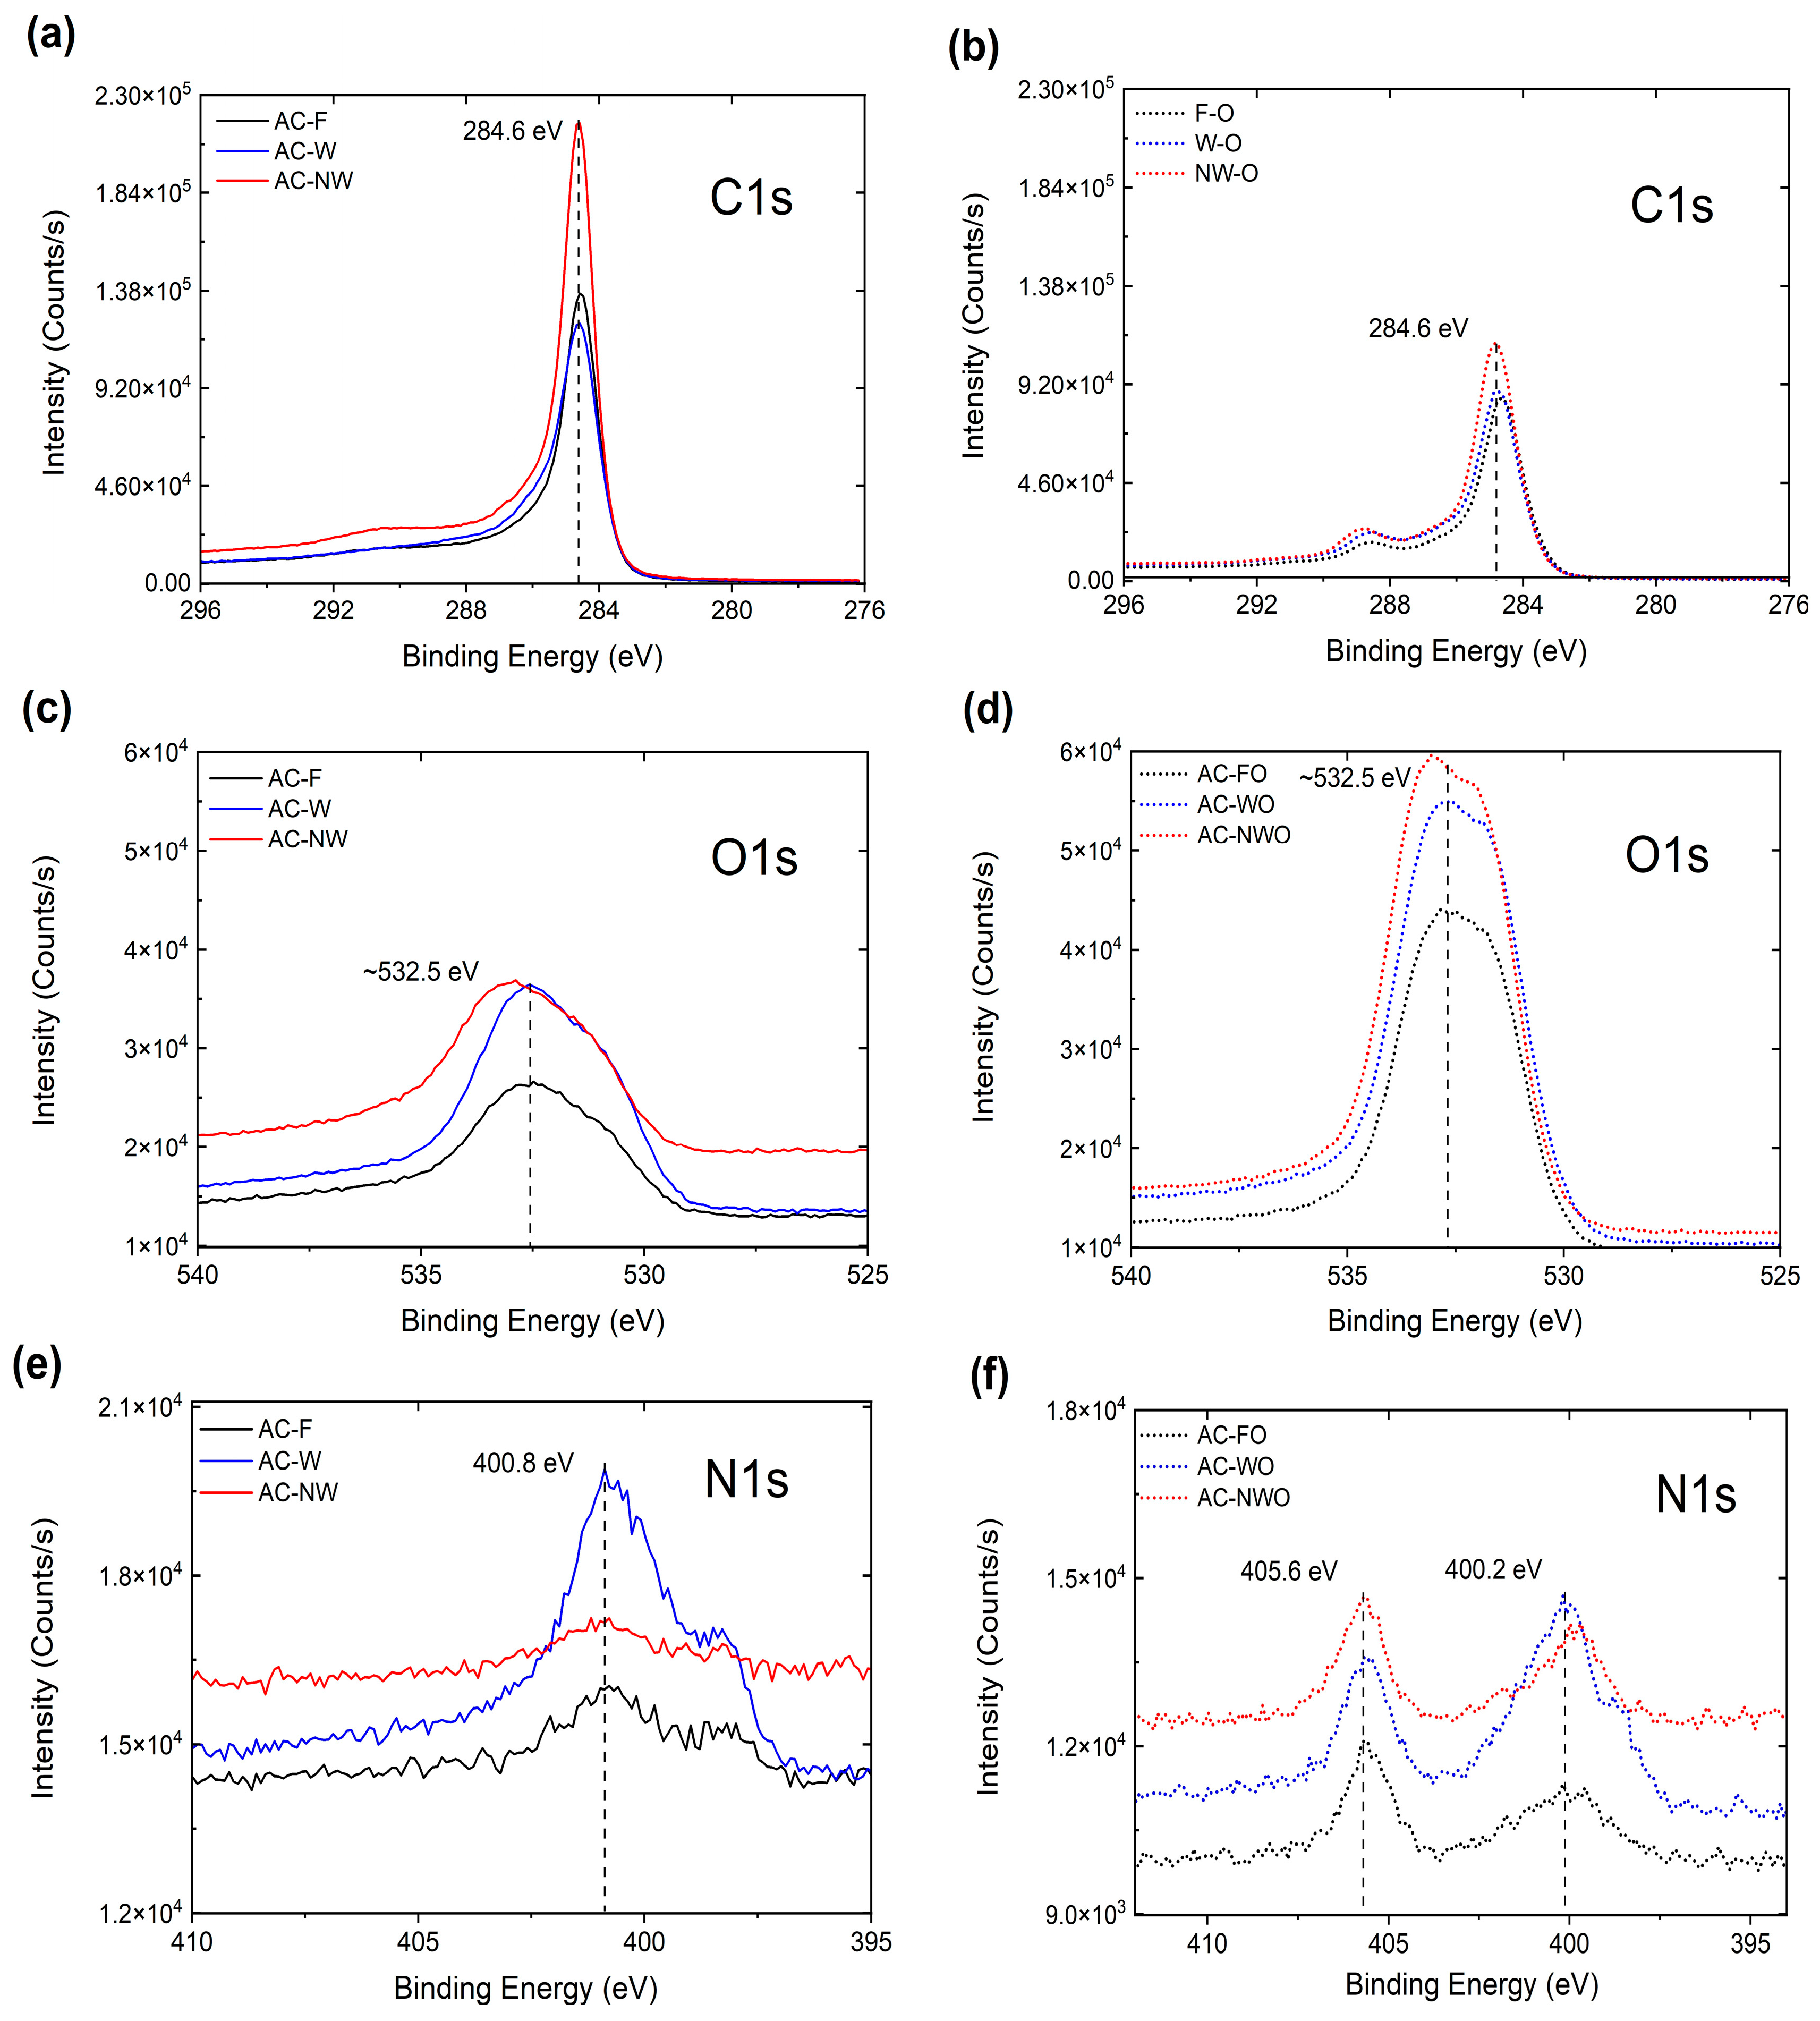
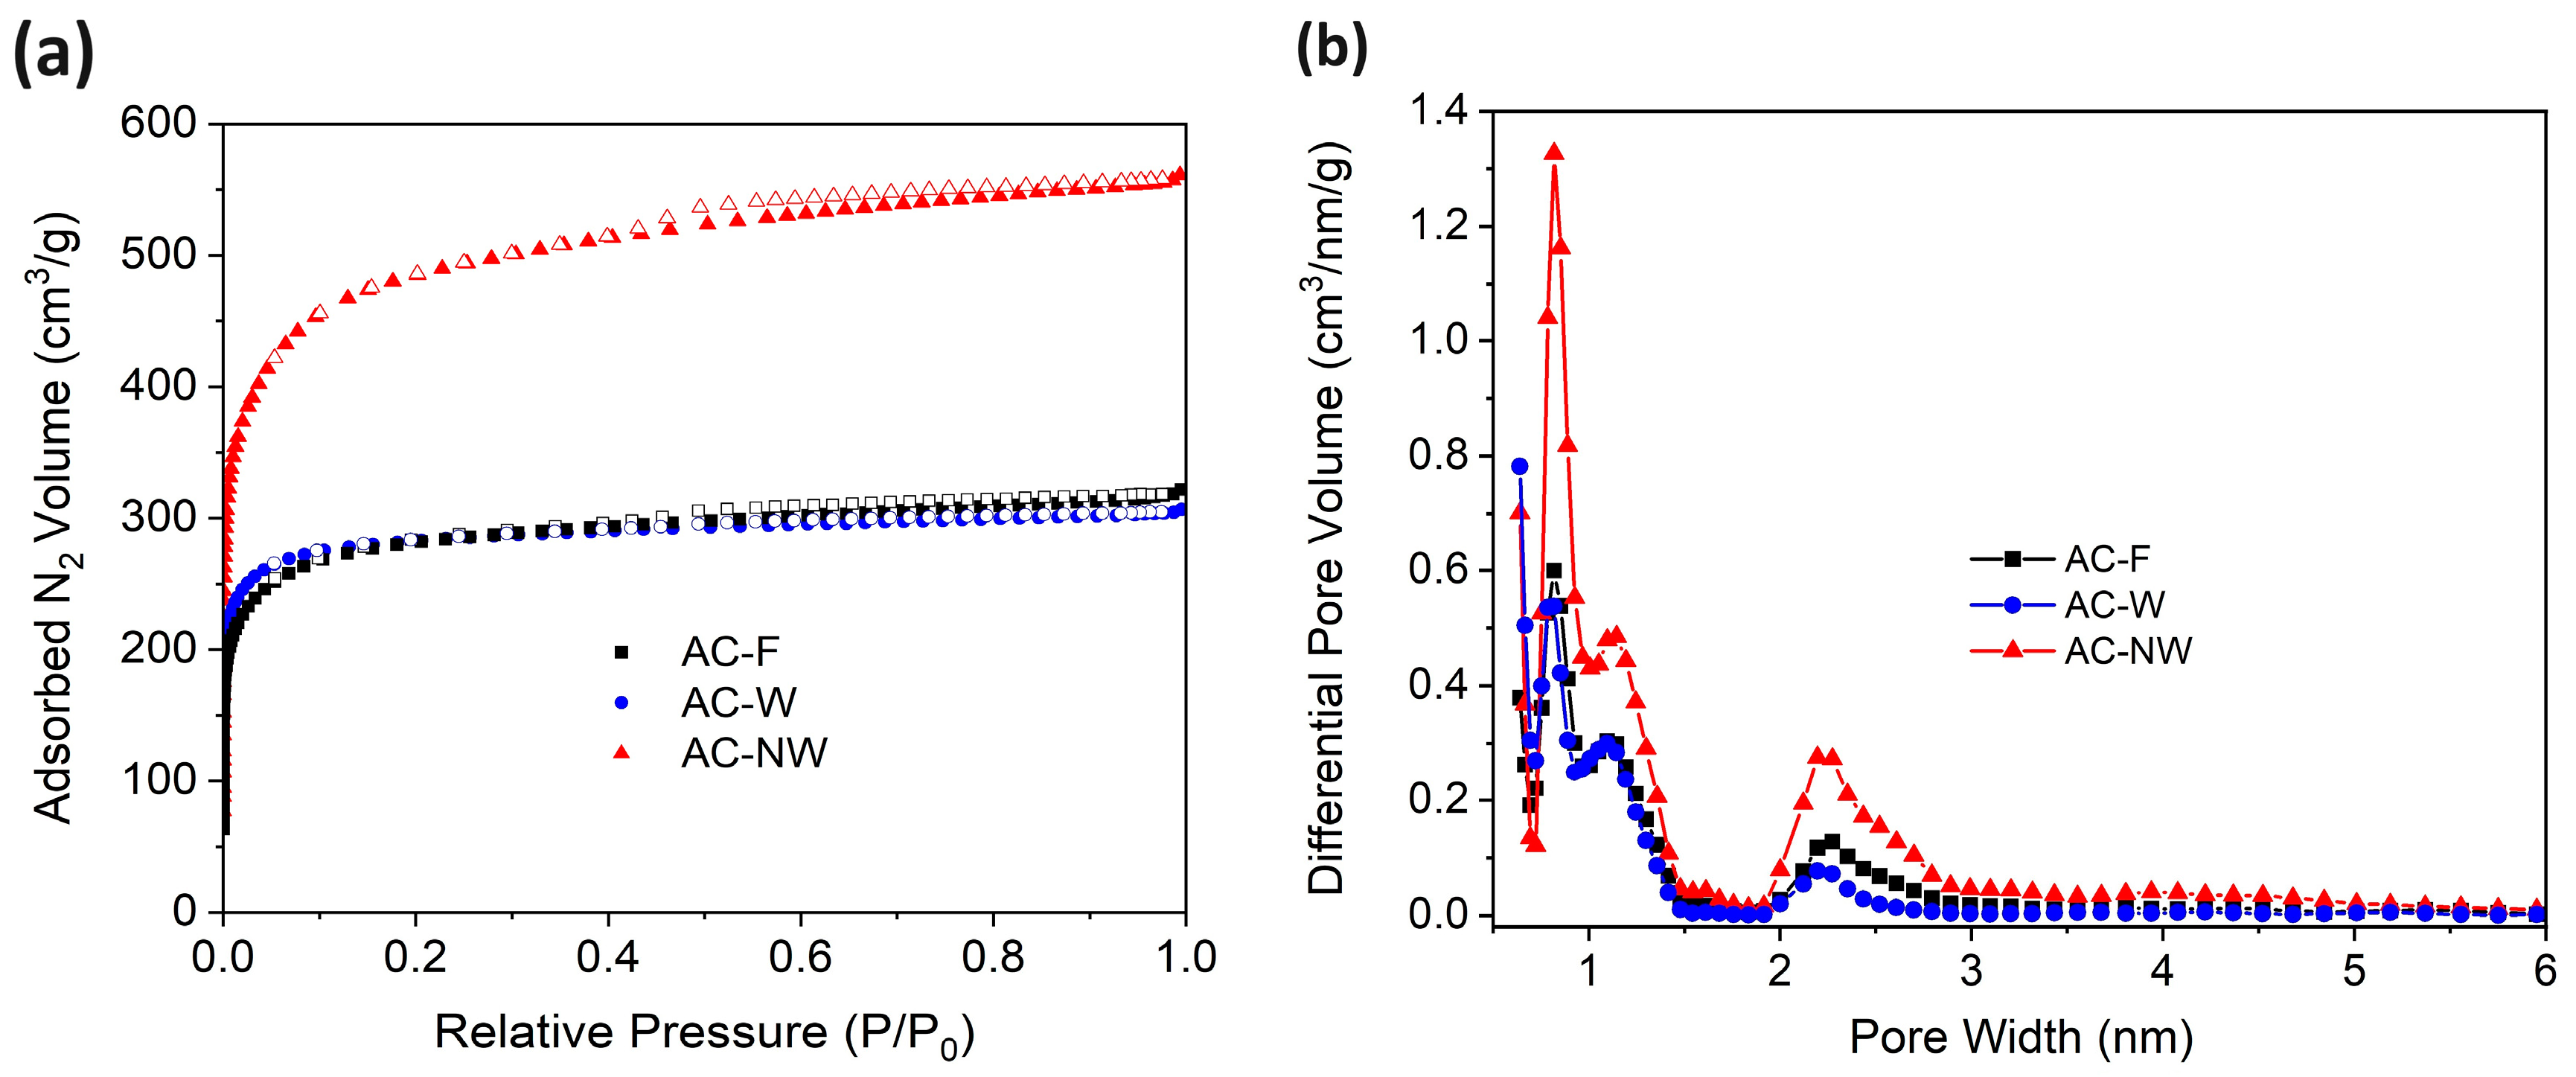
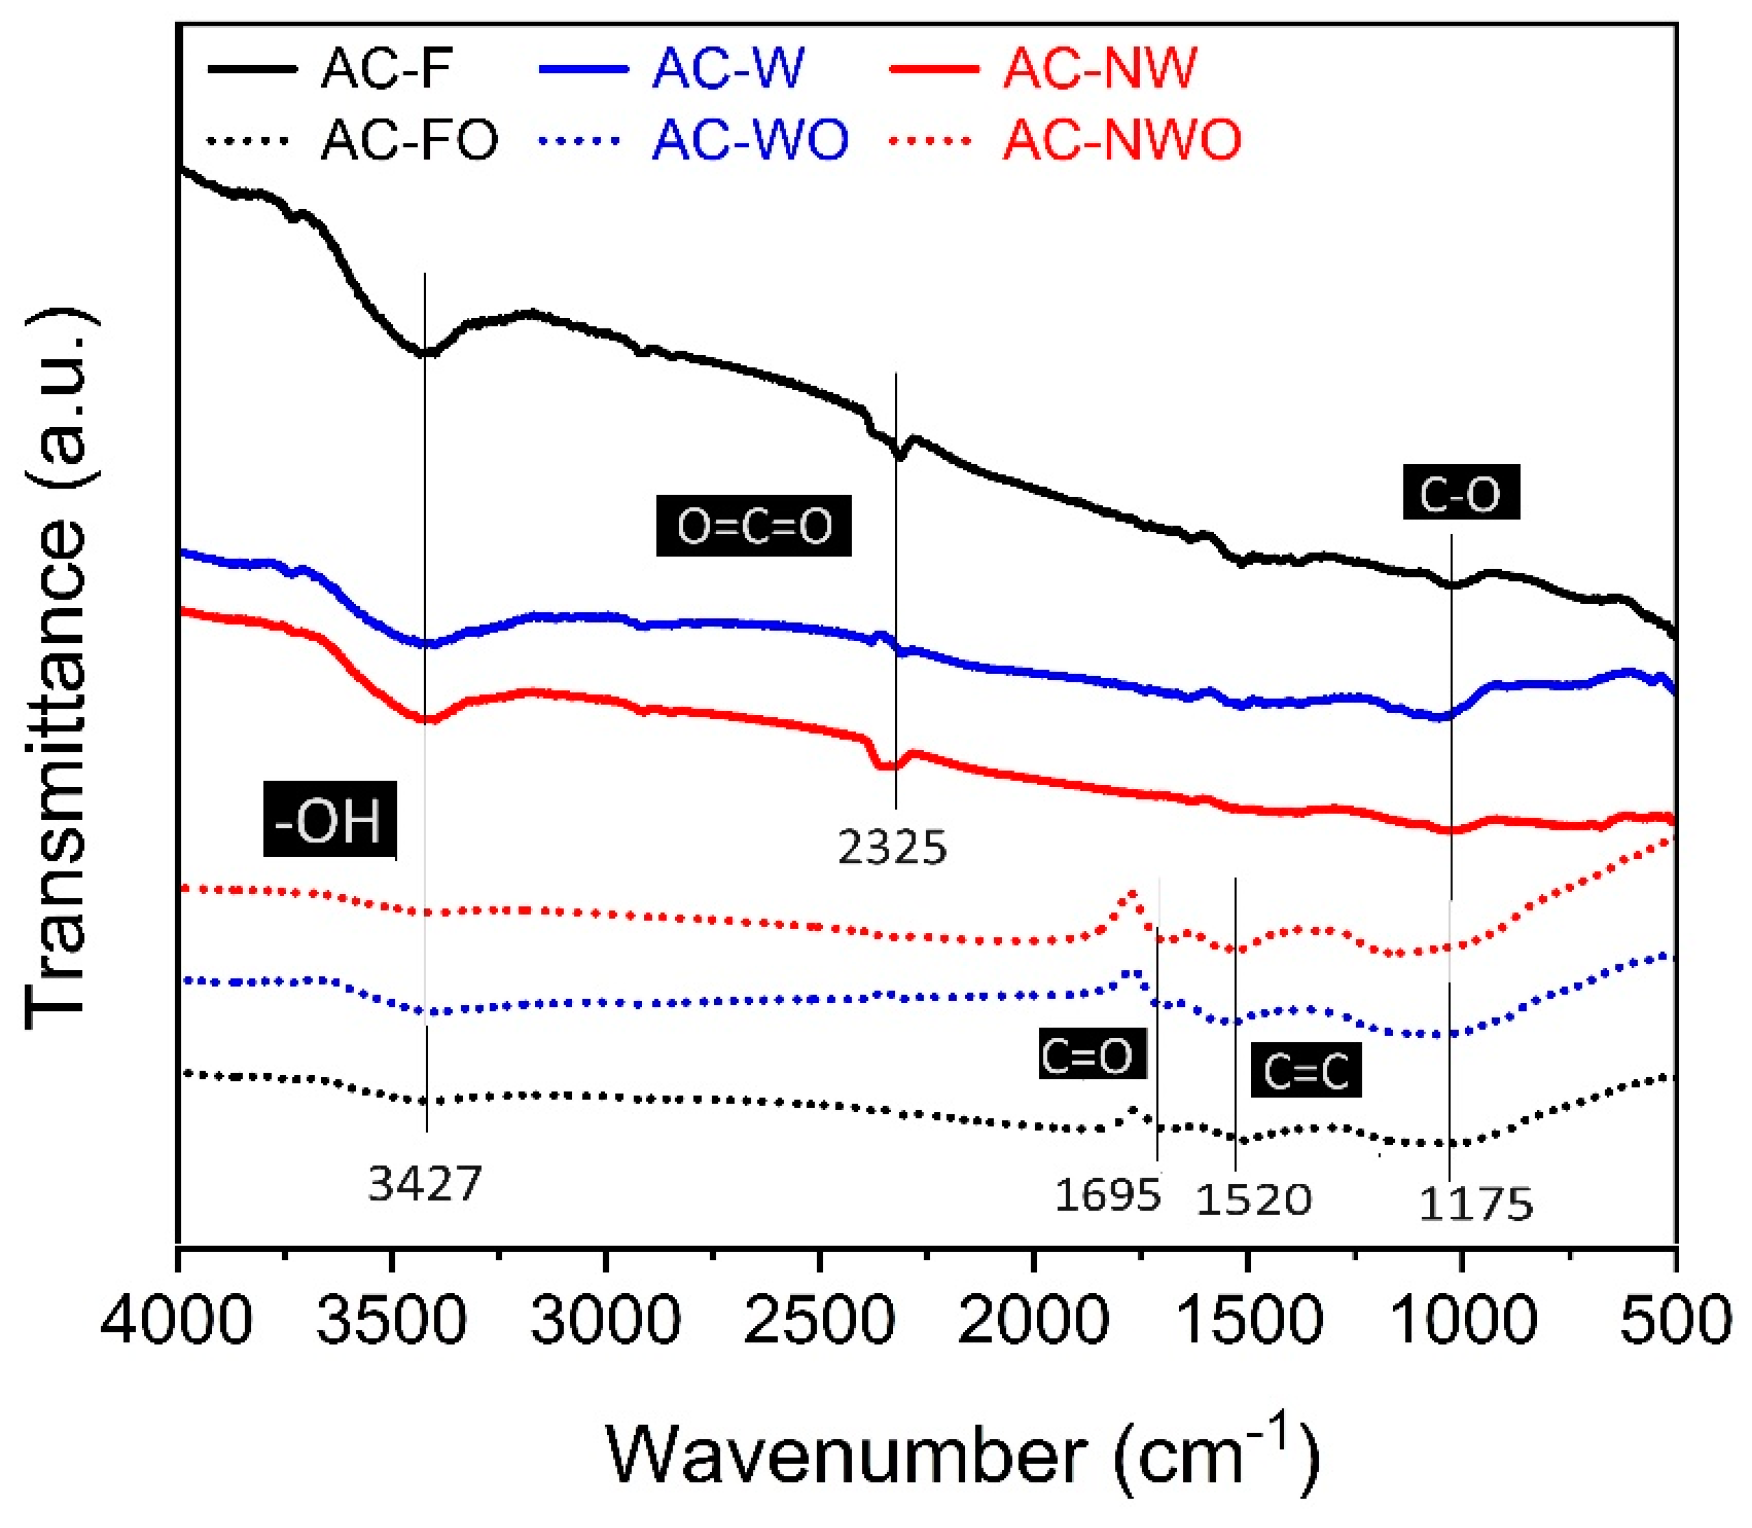
3.1. Carbon Fabric Characterization

The N2 adsorption and desorption isotherms collected at −195.8 °C for the non-oxidized carbon cloths are shown in Figure 1a. The samples exhibited a Type I isotherm according to the classification of the International Union of Pure and Applied Chemistry, characteristic of microporous materials (i.e., pore widths < 2 nm) [42]. The adsorbed N2 amounts increase abruptly at the lower P/P0 values due to micropore filling and then reach a clear saturation plateau at the higher P/P0 values. The QSDFT-derived pore size distribution analysis (Figure 2b) indicated four peak maxima at ~0.6, ~0.8, ~1.1 and ~2.3 nm, thus also highlighting the dominant microporous nature of these materials. It should be noted that due to kinetics limitations it was not possible to collect complete and well-equilibrated isotherms for the oxidized carbon cloths. Instead, only a limited number of adsorption points were collected for these samples within specific P/P0 regions towards estimating the BET surface area (at P/P0 = 0.01–0.3) and the total pore volume (at P/P0 ~0.99).
The surface area (SBET), total pore volume (VGurvich) and average pore width (W) values for treated and non-treated activated carbon cloths, as derived by N2 adsorption data, are presented in Table 1. The gas sorption results show that the HNO3 treatment played an important role in the nanopore structure characteristics of the fabrics. The treatment mainly resulted in a significant reduction in SBET (>50%) and VGurvich (>38%) and a small increase in W. These changes can be explained by the collapse and/or combination of some of the micropores (i.e., pores below 2 nm in width) after oxidation. Hence, the micropores became fewer and wider, and this concluded with the decrease in SBET and VGurvich and the shift of W to higher values. The most significant reduction in SBET and VGurvich can be observed for the AC-NW material, where the numbers decreased by 71% and 63%, respectively.
In addition to the gas sorption analysis, the surface morphology of the six AC fabrics was analyzed by SEM at different magnifications. The SEM images are displayed in Figure 2. The SEM images indicate that the AC-W material (Figure 2g) has a different macroscopic surface morphology than the AC-NW (Figure 2m) and AC-F fabrics (Figure 2a). Although the surface textures of AC-F and AC-NW are similar, they have notable differences in their surface areas. Moreover, AC-F and AC-W have similar porosity characteristics, but their surface textures are different. However, the high-magnification images of the pristine AC fabrics (Figure 2c,i,o) show that all samples are composed of carbon fibers with diameters between 10 and 15 μm. No significant changes in the surface texture can be observed after oxidation, when comparing Figure 2a,g,m with Figure 2d,j,p for AC-F, AC-W and AC-NW, respectively.
The FTIR results for before and after acid treatment are presented in Figure 3. The solid lines represent the spectra of the pristine AC fabrics and the dashed lines the spectra after the acid treatment. Spectral differences before and after oxidation can be easily observed. The peak that only exists in the oxidized samples at 1695 cm−1 can be associated with the C=O stretching vibrations, while the peak at around 1520 cm−1 can be related to the C=C vibrations [43]. Based on these findings, it can be concluded that the oxidation resulted in the presence of oxygen-containing groups on the acid-treated fabrics. In addition, the broad peak that exists at around 3427 cm−1 in all samples can be explained by the -OH stretching vibration.
XPS data of the AC fabrics before and after oxidation are given in Figure 4 for C1s, O1s and N1s orbitals. The C1s peak appears at ~284.6 eV for all oxidized and non-oxidized samples, which can be attributed to the sp2 hybridization (Figure 4a,b) [44]. In addition, the appearance of the peaks at 289 eV in the spectra of the oxidized counterparts proves the formation of oxidized carbon moieties (e.g., carboxylic groups) [45]. For the O1s orbital of the untreated samples (Figure 4c), the binding energy is ~532.5 eV. The peaks that appear at these points can be associated to the C–O bond. As can be observed from Figure 4b, the oxygen content of all samples significantly increased after the treatment. The increase in the oxygen content and decrease in the carbon content for the oxidized samples is also consistent with the FTIR results. For N1s, although a single peak is observed for non-oxidized samples at ~400 eV (Figure 4e), double peaks are observed for the oxidized fabrics (Figure 4f). These two peaks are obtained for binding energies of 400.2 eV and 405.6 eV. The peaks at ~400 eV can be attributed to C–NH2, while the peaks at binding energies greater than 405 eV are associated with nitrate [46].

3.2. Adsorption Isotherms

The experimental data were fitted with a non-linear Langmuir adsorption isotherm model (Equation (3)) and are presented in Figure 5. Langmuir isotherm parameters as well as the goodness of fit are also presented in Table 2. The solid lines in Figure 5 show the Langmuir isotherm fitting for the untreated samples (AC-F, AC-W and AC-NW), whereas the dashed lines show the fitting for the oxidized samples (AC-FO, AC-WO and AC-NWO). As can be seen from Figure 5 and Table 2, the Langmuir model has a very good fit with the experimental data. Among all the fabrics, AC-NWO shows the best CV adsorption performance in terms of its maximum adsorption capacity. In contrast to the surface area and pore volume reduction, the adsorption capacities of the fabrics increased after oxidation. This can be linked to the surface oxygen-based functional groups gained by the carbon cloths after oxidation, which promote the electrostatic interactions for cationic dye adsorption [47]. Although for all the fabrics an enhancement in their adsorption performance was obtained after oxidation, a significant enhancement was realized for AC-F. The maximum adsorption capacity (qm) for AC-FO becomes almost four times larger than the maximum adsorption capacity of the AC-F.
The CV dye is predominantly in the cationic form under the investigated pH conditions (pH = 4), and the surface of the oxidized carbon fabrics is negatively charged due to the de-protonation of the carboxylic groups present on the adsorbent’s surface (average pKa ~ 3.5) [48]. Hence, the adsorption is expected to occur mainly through electrostatic interaction between the positively charged dye species and the negatively charged surface, as schematically presented in Figure 6 [49].

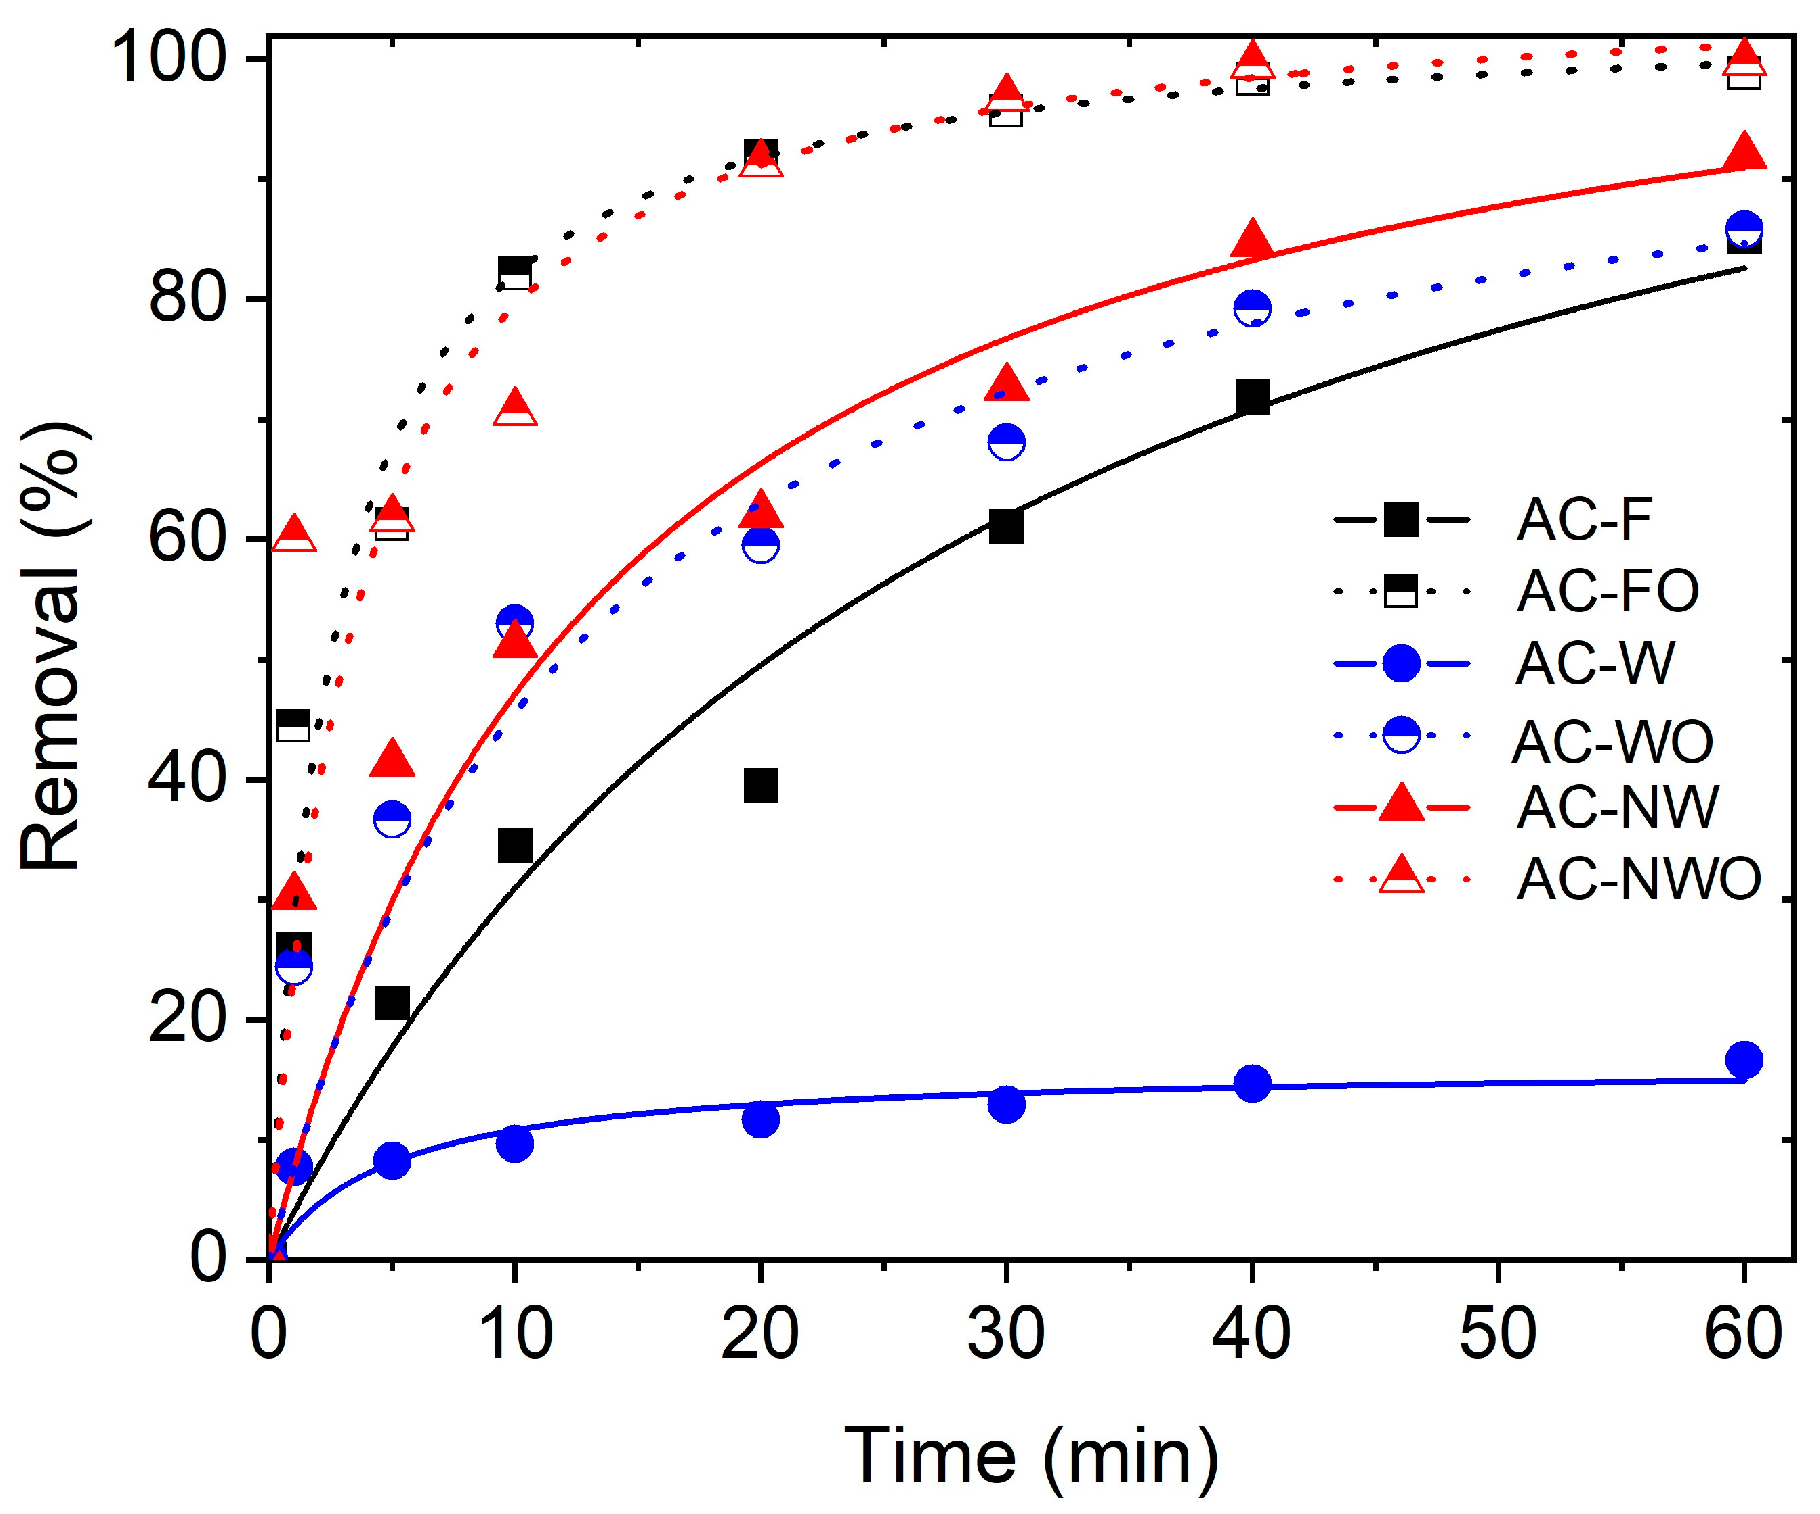
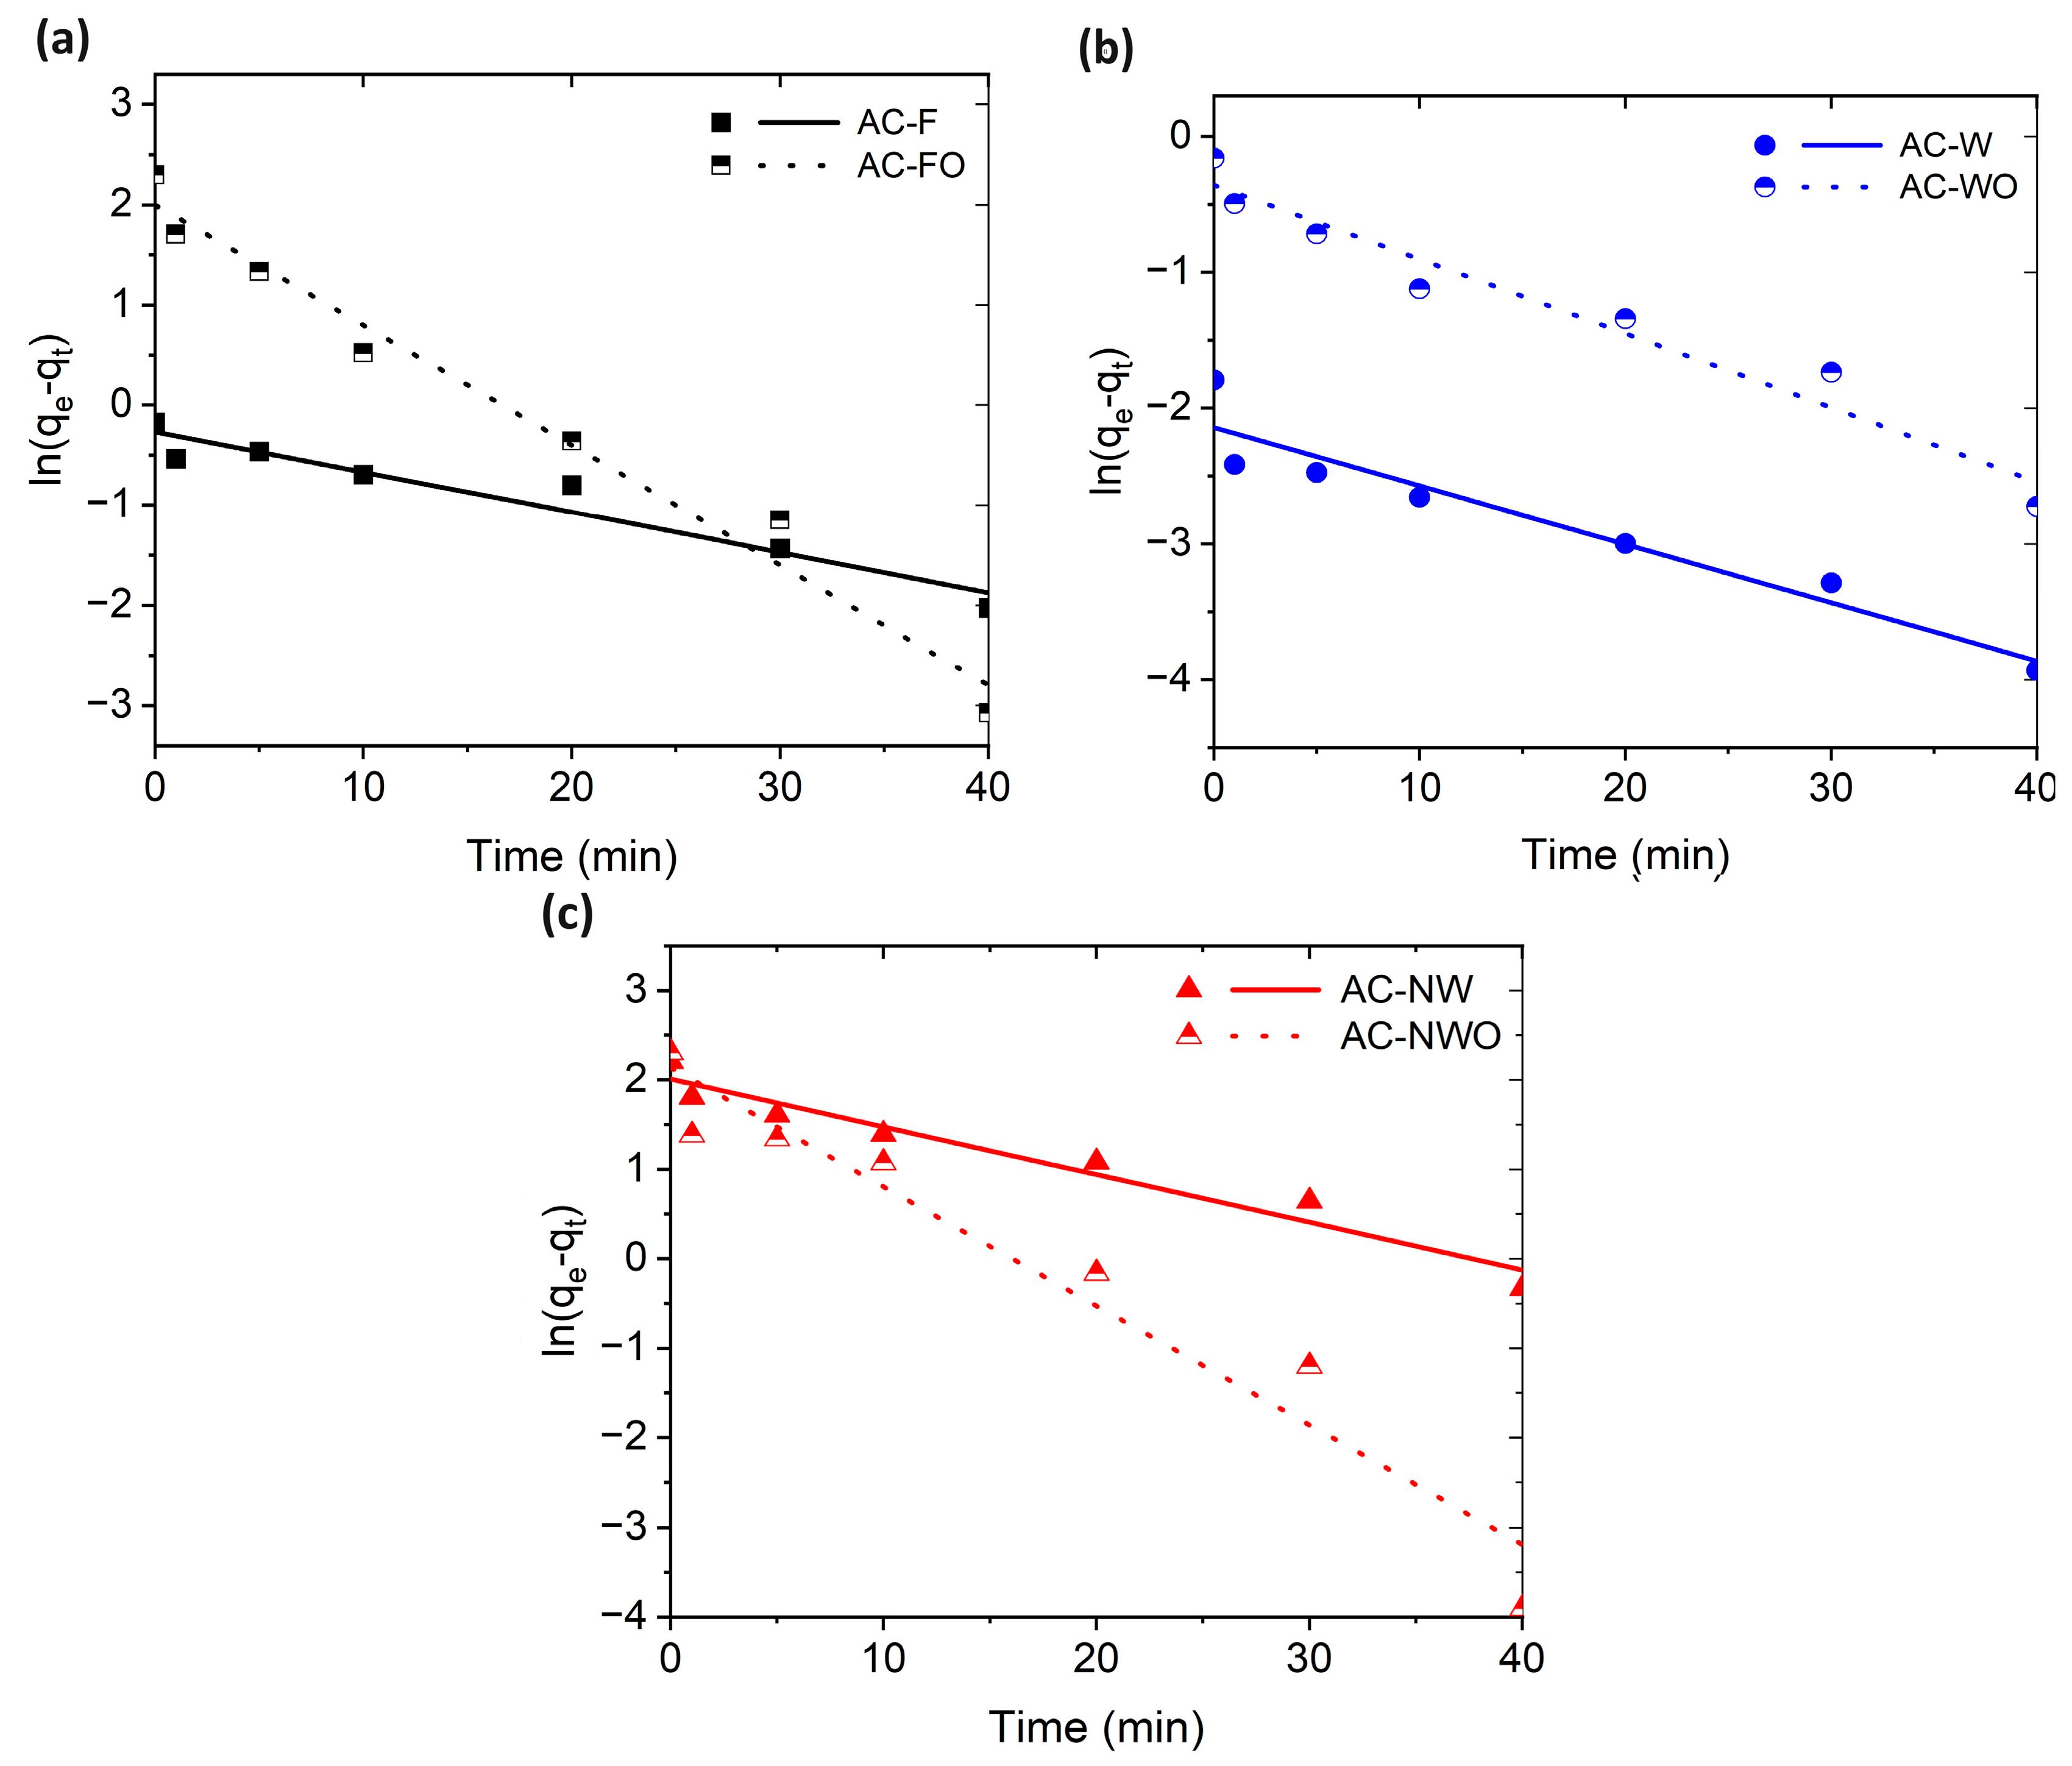
3.3. Adsorption Kinetics

The contact time between adsorbate and adsorbent is an important factor that helps to identify the rate-limiting step and gives information about the mass transfer mechanism. The investigation of kinetics experiments was carried out for 1 h in a 20 ppm dye solution for each of the six AC fabrics separately. The effect of time on the removal of cationic CV dye can be seen in Figure 7. In addition to the enhancement in the maximum uptake performance of the AC fabrics after acid treatment, the adsorption rates were also significantly enhanced for all samples. As can be extracted from Figure 7, more than half of the CV dye was removed from water in the first 10 min, except for the cases of AC-F and AC-W.
In addition, two different kinetics models (pseudo-first order and pseudo-second order) were used for better understanding the adsorption mechanism. Linear representation of the pseudo-first-order model and the pseudo-second-order model are given by Equations (7) and (8), respectively [50]:
l n q e q t = l n q e k 1 t
t q t = 1 K 2 q e 2 + 1 q e t
There, qe and qt represent the dye adsorbed per unit mass at equilibrium and at time t, respectively. In addition, k1 and k2 are the rate constant for first- and second-order models, respectively.
The linear plots for the pseudo-first-order and the pseudo-second-order models can be seen in Figure 8 and Figure 9, respectively. The calculation of the kinetics parameters was carried out by using the slopes and the intercepts of the plots given in Figure 8 and Figure 9. The calculated parameters as well as the goodness of fit for each model and carbon sample are summarized in Table 3. In addition, the experimentally obtained equilibrium uptake amount after 1 h is also presented for comparison with the theoretically calculated values for each model. As one can see from the data, the pseudo-second-order model fits better to the kinetics data for the AC fabrics (except AC-F), as the model provides higher correlation values compared to the first-order model. Moreover, experimentally obtained qe values are also closer to the ones calculated by the second-order model. However, in the case of AC-F, data suggest that the first-order model has a better fitting than the second-order model.
The data in Table 3 indicate that the adsorption in the case of the oxidized fabrics is based mainly on chemisorption, because the degree of correlation is significantly higher [51]. On the other hand, in the case of the non-oxidized fabrics, the degree of correlation between pseudo-first- and pseudo-second-order kinetics does not differ significantly assuming physisorption, such as weak pi–pi and pi–cation interactions between the graphitic fabric surface and the aromatic core and the positively charged moieties of the dye, respectively. The latter interactions are schematically shown in Figure 10.

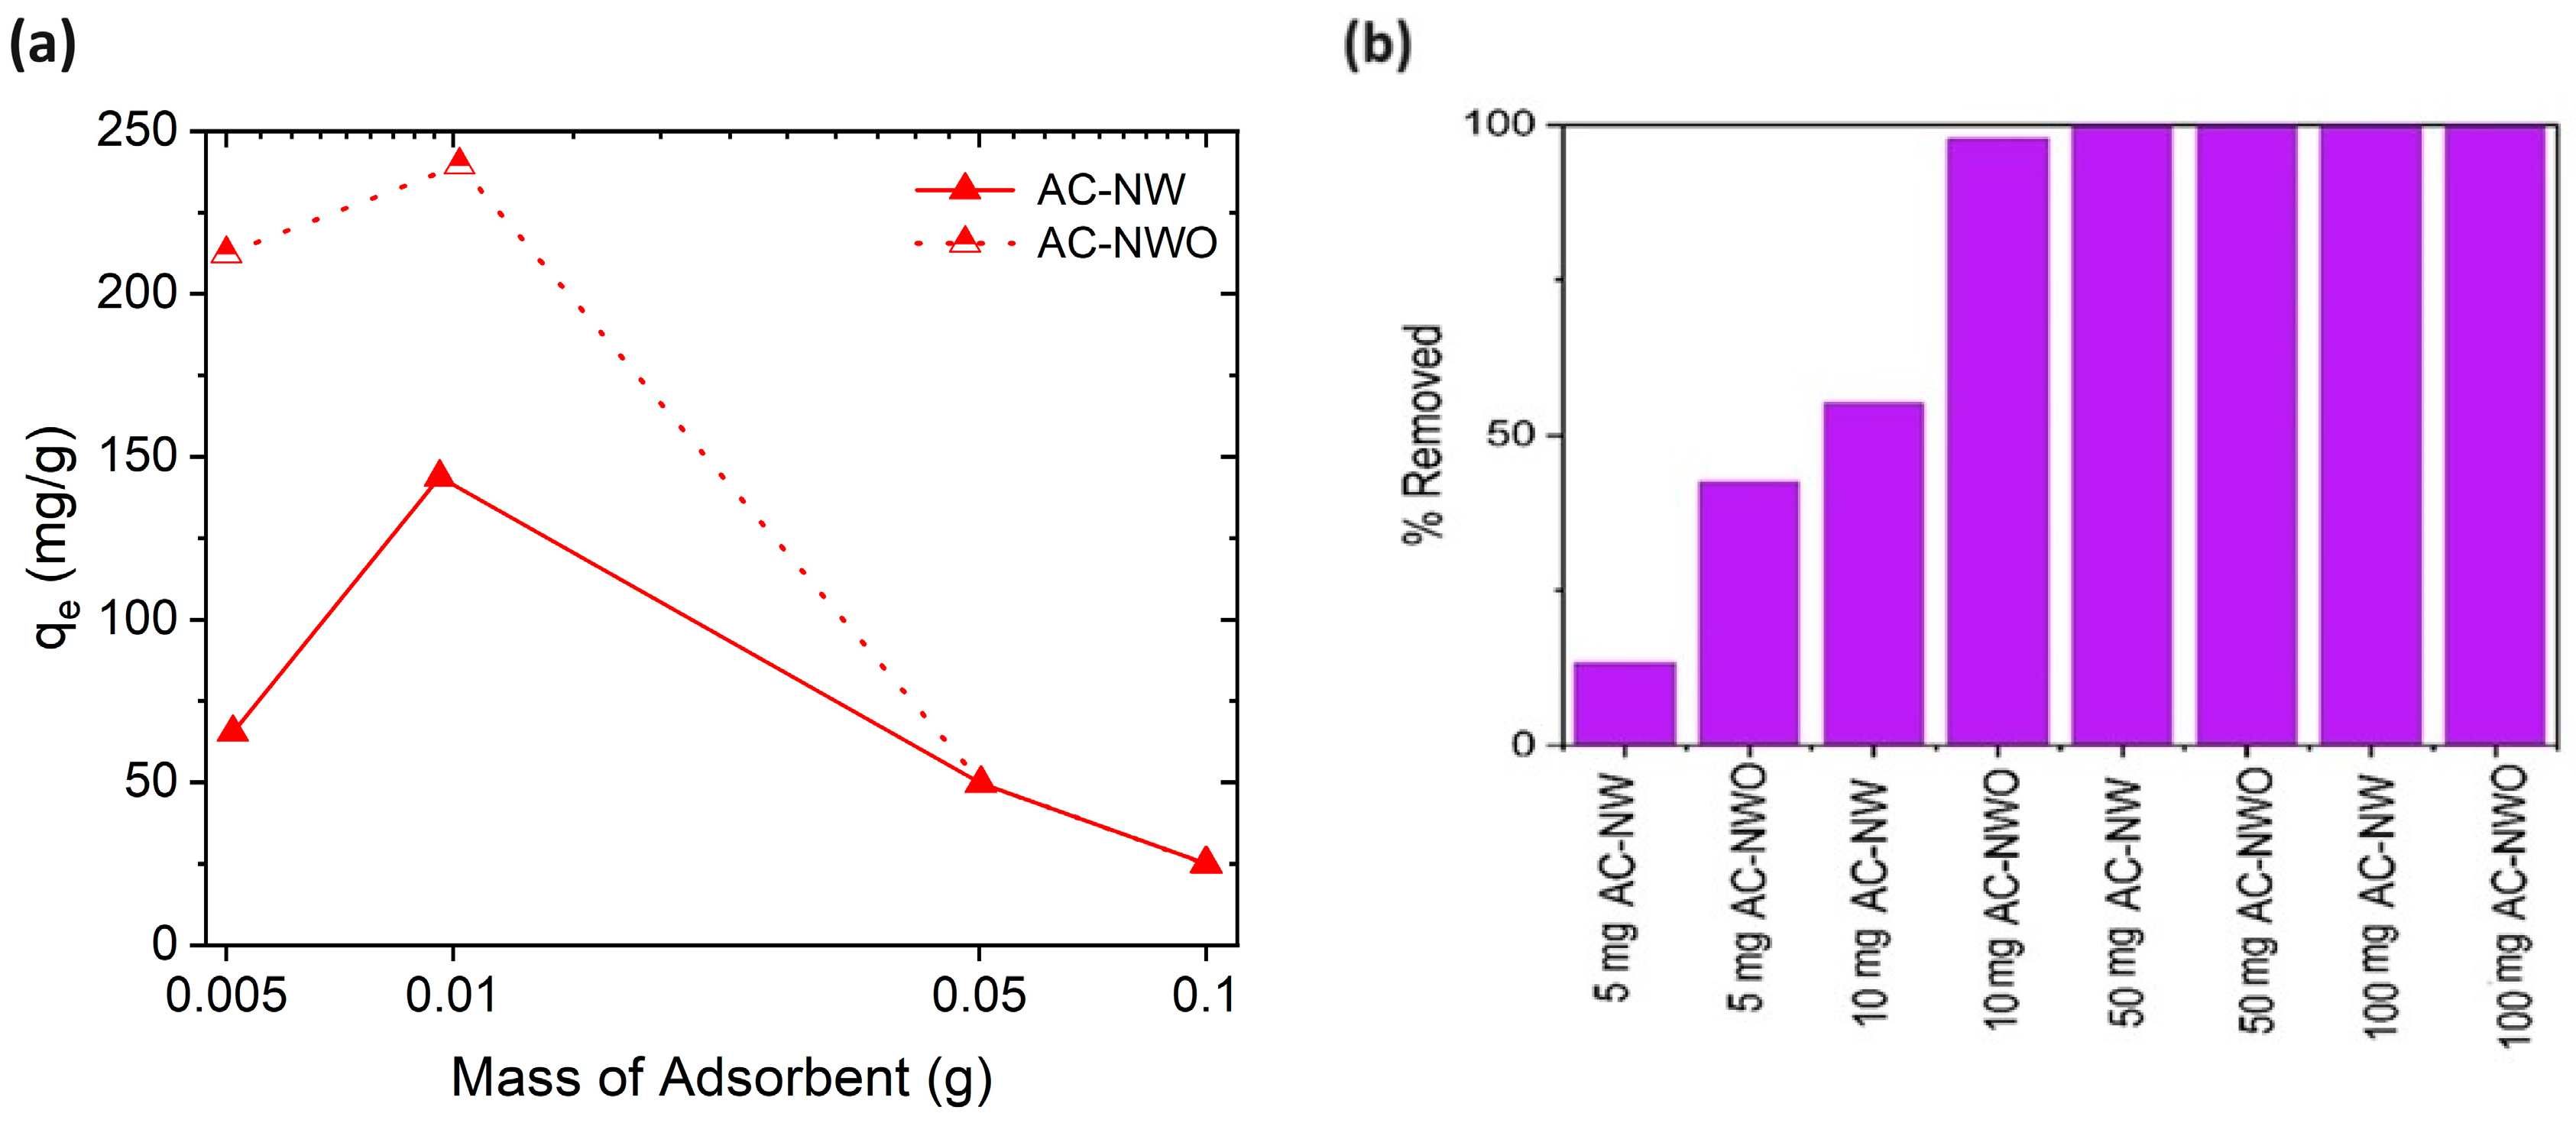
3.4. Effect of the Adsorbent Dosage

The amount of AC fabric has an important effect on the adsorption behavior. The oxidized (AC-NWO) and pristine (AC-NW) forms of the best-performing materials were used for this investigation. The variation of the equilibrium CV uptake value with respect to the adsorbent dosage variation is shown in Figure 11a, while Figure 11b represents the % removal of CV for the various dosages of AC-NW and AC-NWO fabrics. As shown in Figure 11a, once the mass of the AC fabrics is increased from 5 to 10 mg, the equilibrium uptake amount increases and reaches its maximum. However, the equilibrium uptake starts to decrease when the mass of the adsorbent is increased to 50 mg or even higher to 100 mg. This is mainly because at the level of 10 mg adsorbent mass, the adsorption reaches a saturation point. As can be seen from Figure 11b, almost 100% of the dye was removed with 10 mg of AC-NWO fabric. As there is not sufficient dye concentration left in the solution, this causes the fall in the capacity of the adsorbent per-unit mass when the adsorbent mass is further increased.

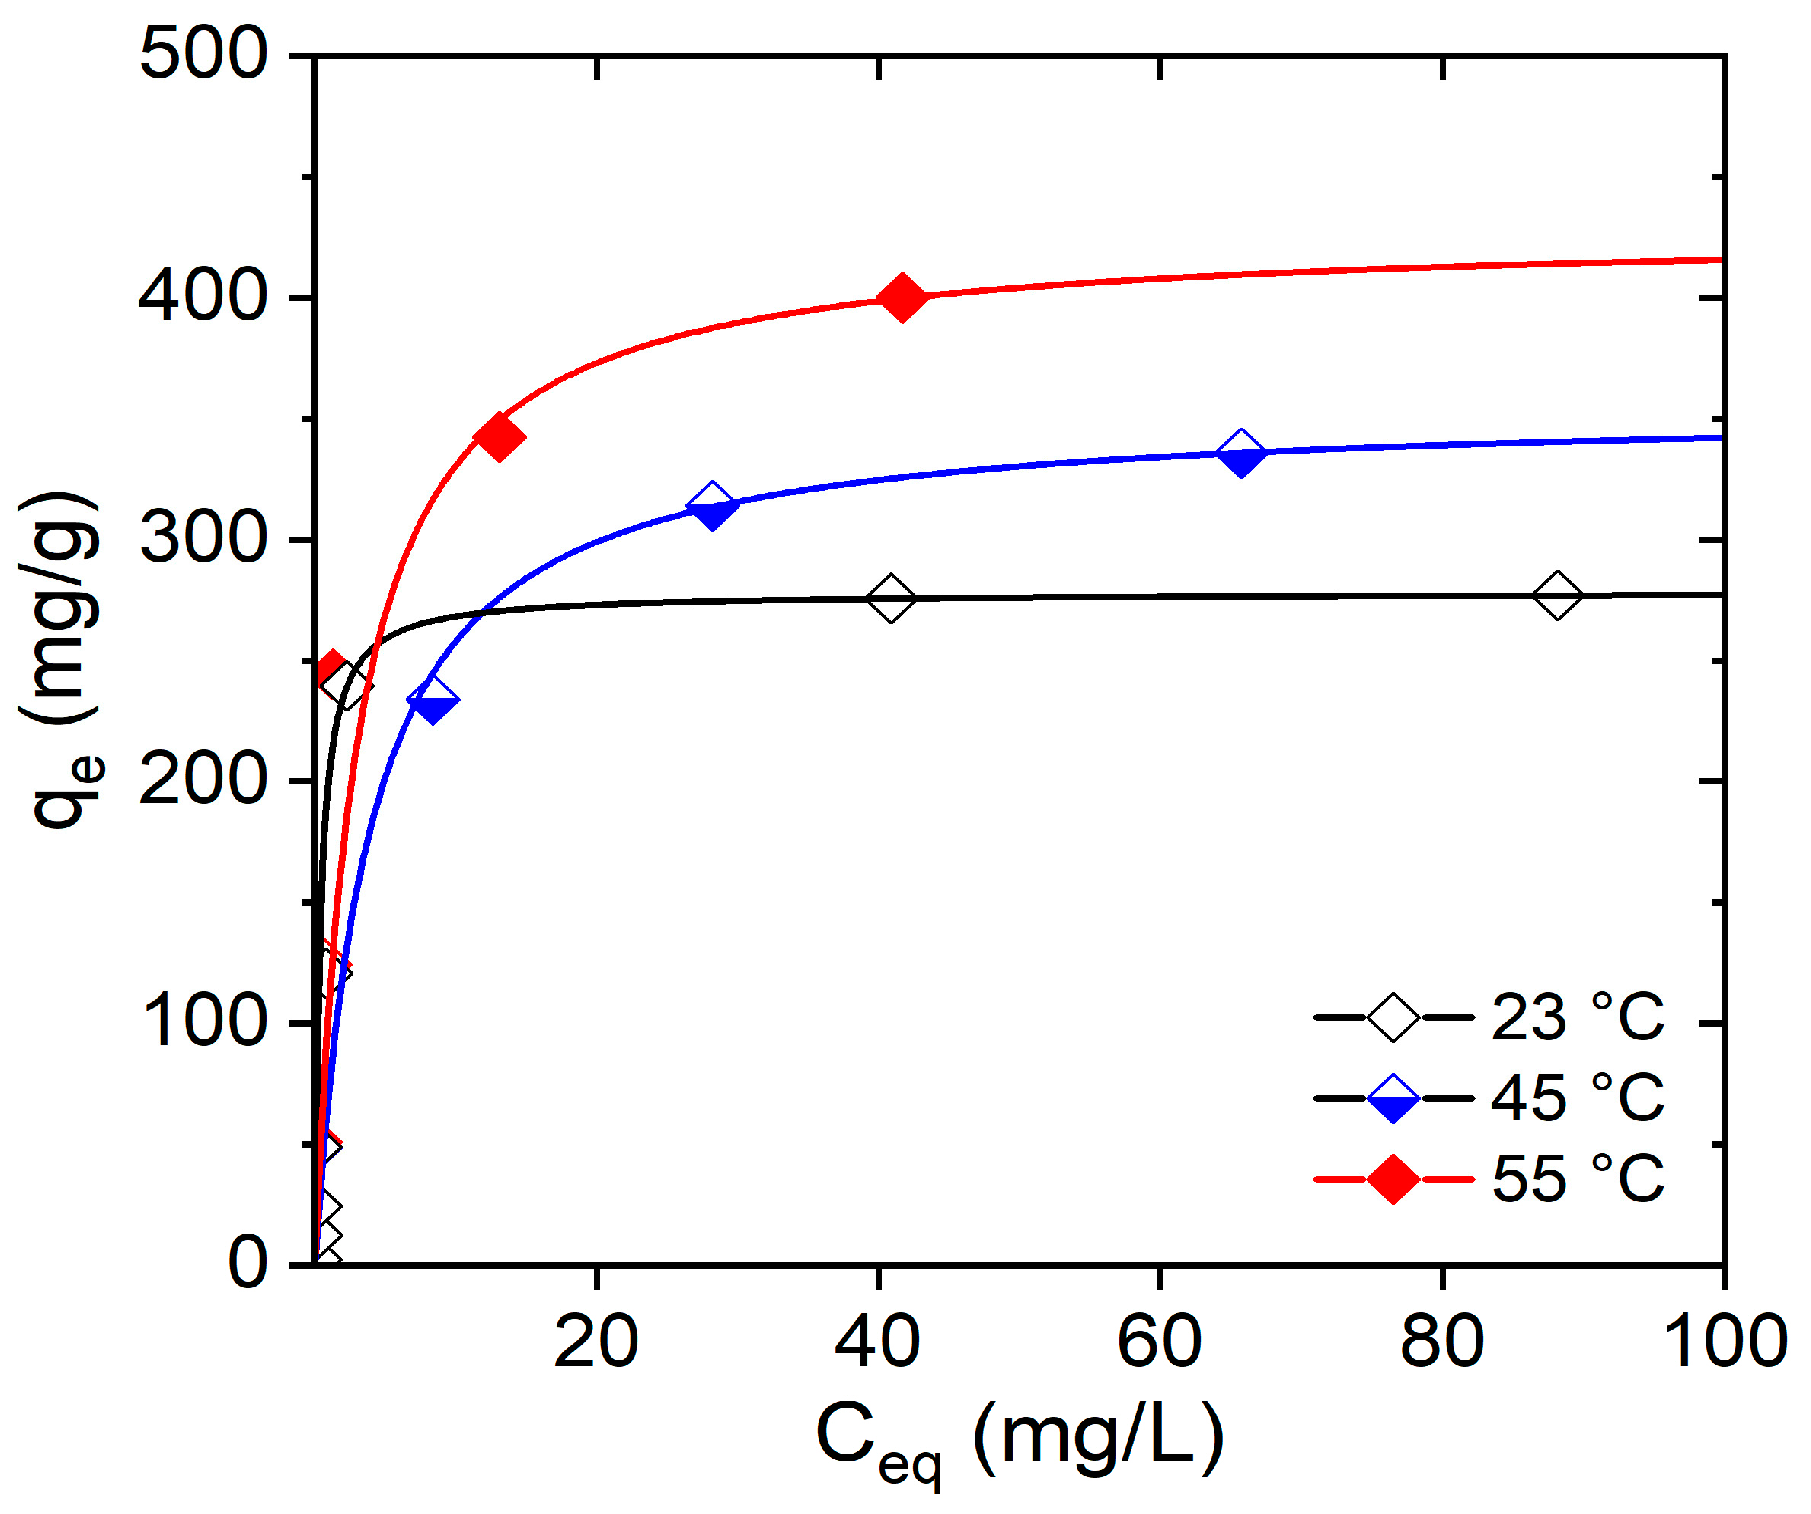
3.5. Effect of Temperature on the CV Adsorption

The effect of the temperature on the removal of CV dye for the AC-NWO cloth is given in Figure 12. As the AC-NWO material performs the best among the analyzed carbon cloths in terms of maximum and fastest uptake of CV dye, the temperature variation was only performed for this case. The experimental data were fitted to a non-linear Langmuir adsorption isotherm model as they provide a strong correlation with this model. Langmuir isotherm parameters and the goodness of fit are also presented in Table 4. According to the results, as the temperature increases, the adsorption performance also increases and the maximum dye uptake amount becomes 428 mg/g at 55 °C, which is one of the highest maximum CV uptake values on activated carbons reported in the literature [7,8,33].

3.6. Thermodynamic Studies

The calculated results for Gibbs free energy change (ΔG°), enthalpy change (ΔH°) and entropy change (ΔS°) at the two studied temperatures for the AC-NWO cloth are presented in Table 5. Based on the obtained results, a negative ΔG° value indicates that the adsorption is spontaneous. Moreover, the negativity of ΔG° increases at higher temperature, which shows that the adsorption is more effective at 318 K. In addition, positive ΔH° value suggests that the adsorption process is endothermic. The entropy change is also positive, which is associated with the enhancement in randomness at solid–solution interface while the adsorbent and adsorbate are in contact and indicates that the dye adsorption is an entropy-driven process [52].

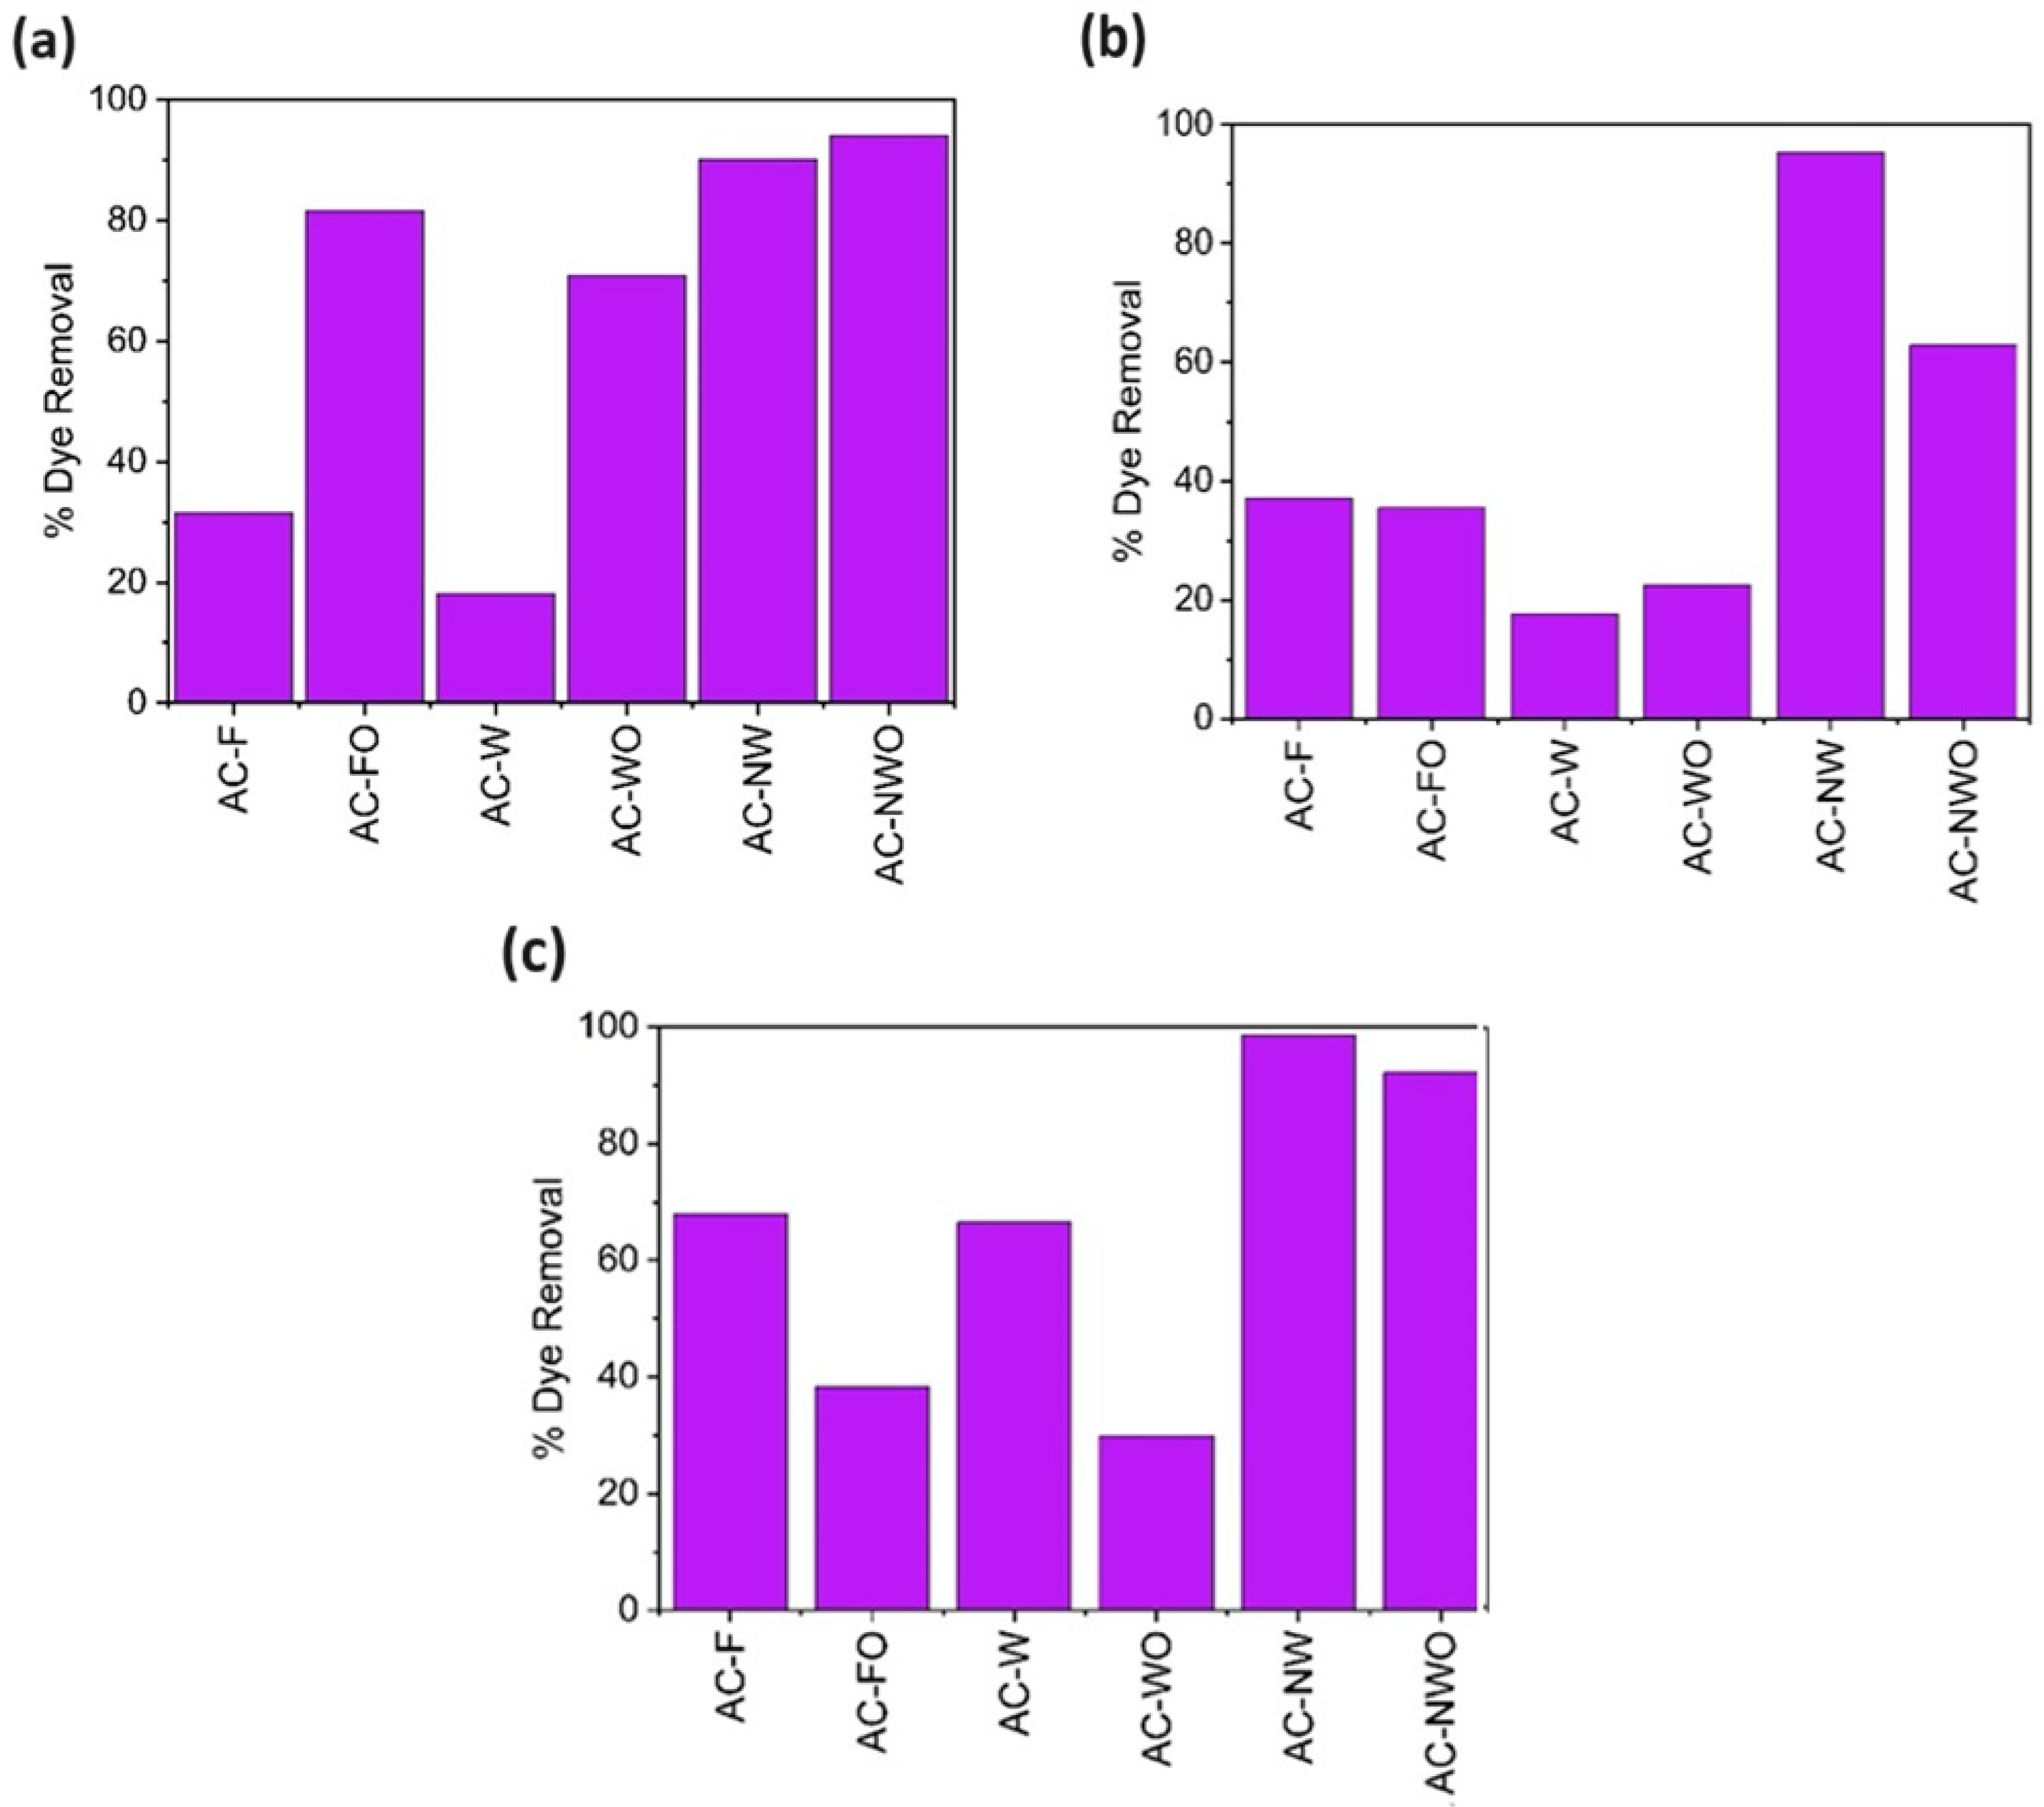
3.7. Adsorption in a Multicomponent System

The respective experiments were carried out to investigate the CV dye removal efficiencies of the AC fabrics when multicomponent solutions (ground water and sea water) were utilized instead of a single component solution (deionized water). The CV dye removal efficiencies of AC fabrics in deionized water, ground water and sea water can be seen in Figure 13a–c, respectively. The results show that the adsorption characteristics significantly depend on the nature of the solution, especially for some of the AC fabrics. According to these results, using ground water and sea water solutions has a negative impact on the adsorption performance of AC-FO and AC-WO fabrics. This may happen due to the presence of the other adsorbates in the corresponding water solutions, which might interact with the oxygen-based functional groups of the AC fabrics. Moreover, due to contaminant blocking, the pores of the adsorbent and therefore the internal pore structure become less accessible. Although the adsorption levels for AC-F and AC-W remain almost non-affected in ground water solution, they become better adsorbents when placed in the sea water solutions. In contrast, the relative dye adsorption of AC-NWO was lower in ground water. Nevertheless, the removal capacity of these fabrics for CV is more than 90% in sea water solutions. In addition, the AC-NW fabric provides almost the same adsorption levels for all solutions, which indicates that this material can be used independently of the nature of the solutions to efficiently adsorb the CV dye.

4. Conclusions

The use of activated carbon (AC) fabrics for the removal of toxic crystal violet (CV) dye was investigated. An enhancement in the adsorption performance of the AC fabrics was realized using nitric acid treatment, resulting in the introduction of oxygen-containing functional groups on their surface. Gas sorption analysis showed that the oxidation treatment significantly lowered the surface area and the pore volume of the AC fabrics and increased the CV adsorption capacity of the AC materials, which indicates dye adsorption on the external surface of the fabrics. The adsorption results showed that the Langmuir isotherm model can be used to better describe the experimental data associated with the adsorption of CV by the AC fabrics. In addition, the oxidized non-woven AC fabric provides 428 mg/g adsorption capacity at 55 °C, which is one of the highest CV uptake values reported in the literature for CV adsorption by AC materials. Thermodynamic studies showed that the adsorption process is endothermic and entropy-driven. Furthermore, investigation in a multicomponent system showed that pristine and oxidized non-woven AC fabrics provide more than 90% CV removal from sea water solutions. This study demonstrates that the adsorption performance of carbon fabrics over crystal violet can be improved through a simple surface modification method. Consequently, the application of this method makes carbon fabrics a suitable option for contributing to clean and safe water resources. Follow-up investigations will focus on the exploration of the regeneration potential of these carbon adsorbents through alcohol extraction and pH adjustment, among other suitable techniques, steps that promise to enhance their reuse and sustainability in environmental remediation applications.

Author Contributions

Conceptualization, I.P. and C.R.; methodology, B.M. and I.P.; validation, B.M., K.I., G.K. and N.K.; formal analysis, B.M., I.I., M.B., I.P. and N.K.; investigation, B.M., K.I., G.K., I.I., G.C., S.H. and N.K.; resources, C.M., I.P., N.K. and C.R.; writing—original draft preparation, B.M., I.P., N.K. and C.R.; writing—review and editing, B.M., C.M., I.P., N.K. and C.R.; visualization, B.M., I.P. and N.K.; supervision, I.P. and C.R.; project administration, I.P. and C.R.; funding acquisition, I.P. and C.R. All authors have read and agreed to the published version of the manuscript.

Funding

This research received no external funding.

Data Availability Statement

The data presented in this study are available on request from the corresponding authors.

Acknowledgments

N.K. would like to thank Oskar Paris from the Montanuniversität Leoben for providing access to the gas sorption analyzer.

Conflicts of Interest

The authors declare no conflicts of interest.

References

  1. Mittal, A.; Mittal, J.; Malviya, A.; Kaur, D.; Gupta, V.K. Adsorption of hazardous dye crystal violet from wastewater by waste materials. J. Colloid. Interface Sci. 2010, 343, 463–473. [Google Scholar] [CrossRef]
  2. Al-Tohamy, R.; Ali, S.S.; Li, F.; Okasha, K.M.; Mahmoud, Y.A.-G.; Elsamahy, T.; Jiao, H.; Fu, Y.; Sun, J. A critical review on the treatment of dye-containing wastewater: Ecotoxicological and health concerns of textile dyes and possible remediation approaches for environmental safety. Ecotoxicol. Environ. Saf. 2022, 231, 113160. [Google Scholar] [CrossRef] [PubMed]
  3. Boulahbal, M.; Malouki, M.A.; Canle, M.; Redouane-Salah, Z.; Devanesan, S.; AlSalhi, M.S.; Berkani, M. Removal of the industrial azo dye crystal violet using a natural clay: Characterization, kinetic modeling, and RSM optimization. Chemosphere 2022, 306, 135516. [Google Scholar] [CrossRef] [PubMed]
  4. Puri, C.; Sumana, G. Highly effective adsorption of crystal violet dye from contaminated water using graphene oxide intercalated montmorillonite nanocomposite. Appl. Clay Sci. 2018, 166, 102–112. [Google Scholar] [CrossRef]
  5. Li, Q.; Yue, Q.; Sun, H.; Su, Y.; Gao, B.A. Comparative study on the properties, mechanisms and process designs for the adsorption of non-ionic or anionic dyes onto cationic-polymer/bentonite. J. Environ. Manag. 2010, 91, 1601–1611. [Google Scholar] [CrossRef] [PubMed]
  6. Yaseen, D.A.; Scholz, M. Textile dye wastewater characteristics and constituents of synthetic effluents: A critical review. Int. J. Environ. Sci. Technol. 2019, 16, 1193–1226. [Google Scholar] [CrossRef]
  7. Omer, A.S.; Naeem, G.A.E.; Elhamid, A.I.A.; Farahat, O.O.M.; El-Bardan, A.A.; Soliman, H.M.A.; Nayl, A.A. Adsorption of crystal violet and methylene blue dyes using a cellulose-based adsorbent from sugercane bagasse: Characterization, kinetic and isotherm studies. J. Mater. Res. Technol. 2022, 19, 3241–3254. [Google Scholar] [CrossRef]
  8. Mani, S.; Bharagava, R.N. Exposure to Crystal Violet, Its Toxic, Genotoxic and Carcinogenic Effects on Environment and Its Degradation and Detoxification for Environmental Safety. In Reviews of Environmental Contamination and Toxicology; de Voogt, W.P., Ed.; Springer: Berlin/Heidelberg, Germany, 2016; p. 237. [Google Scholar] [CrossRef]
  9. Akdemir, M.; Isik, B.; Cakar, F.; Cankurtaran, O. Comparison of the adsorption efficiency of cationic (Crystal Violet) and anionic (Congo Red) dyes on Valeriana officinalis roots: Isotherms, kinetics, thermodynamic studies, and error functions. Mater. Chem. Phys. 2022, 291, 126763. [Google Scholar] [CrossRef]
  10. Adak, A.; Bandyopadhyay, M.; Pal, A. Removal of crystal violet dye from wastewater by surfactant-modified alumina. Sep. Purif. Technol. 2005, 44, 139–144. [Google Scholar] [CrossRef]
  11. Kumbhar, P.; Narale, D.; Bhosale, R.; Jambhale, C.; Kim, J.; Kolekar, S. Synthesis of tea waste/Fe3O4 magnetic composite (TWMC) for efficient adsorption of crystal violet dye: Isotherm, kinetic and thermodynamic studies. J. Environ. Chem. Eng. 2022, 10, 107893. [Google Scholar] [CrossRef]
  12. Falaki, Z.; Bashiri, H. Preparing an adsorbent from the unused solid waste of Rosewater extraction for high efficient removal of Crystal Violet. J. Iran. Chem. Soc. 2021, 18, 2689–2702. [Google Scholar] [CrossRef]
  13. Muthukumaran, C.; Sivakumar, V.M.; Thirumarimurugan, M. Adsorption isotherms and kinetic studies of crystal violet dye removal from aqueous solution using surfactant modified magnetic nanoadsorbent. J. Taiwan. Inst. Chem. Eng. 2016, 63, 354–362. [Google Scholar] [CrossRef]
  14. Mansor, E.S.; Abdallah, H.; Shaban, A.M. Fabrication of high selectivity blend membranes based on poly vinyl alcohol for crystal violet dye removal. J. Environ. Chem. Eng 2020, 8, 103706. [Google Scholar] [CrossRef]
  15. Pires, I.C.B.; Candido, I.C.M.; Oliveira, H.P. Adsorptive Removal of Crystal Violet from Water by Chemically Modified Coconut Shell. Water Conserv. Sci. Eng. 2020, 5, 159–168. [Google Scholar] [CrossRef]
  16. Ju, Y.; Fang, J.; Liu, X.; Xu, Z.; Ren, X.; Sun, C.; Yang, S.; Ren, Q.; Ding, Y.; Yu, K.; et al. Photodegradation of crystal violet in TiO 2 suspensions using UV–vis irradiation from two microwave-powered electrodeless discharge lamps (EDL-2): Products, mechanism and feasibility. J. Hazard. Mater. 2011, 185, 1489–1498. [Google Scholar] [CrossRef] [PubMed]
  17. Jana, S.; Prkait, M.K.; Mohanty, K. Removal of crystal violet by advanced oxidation and microfiltration. Appl. Clay Sci. 2010, 50, 337–341. [Google Scholar] [CrossRef]
  18. Chen, C.; Kuo, J.; Yang, H.; Chung, Y.A. coupled biological and photocatalysis pretreatment system for the removal of crystal violet from wastewater. Chemosphere 2013, 92, 695–701. [Google Scholar] [CrossRef] [PubMed]
  19. Cukierman, A.L.; Nunell, G.V.; Bonelli, P.R. Removal of emerging pollutants from water through adsorption onto carbon-based materials. In Emerging and Nanomaterial Contaminants in Wastewater; Mishra, A.K., Anawar, H.M.D., Drouiche, N., Eds.; Elsevier: Amsterdam, The Netherlands, 2013; pp. 159–213. [Google Scholar]
  20. Wang, Y.; Peng, C.; Padilla-Ortega, E.; Robledo-Cabrera, A.; López-Valdivieso, A. Cr(VI) adsorption on activated carbon: Mechanisms, modeling and limitations in water treatment. J. Environ. Chem. Eng. 2020, 8, 104031. [Google Scholar] [CrossRef]
  21. Streit, A.F.M.; Collazzo, G.C.; Druzian, S.P.; Verdi, R.S.; Foletto, E.L.; Oliveira, L.F.S.; Dotto, G.L. Adsorption of ibuprofen, ketoprofen, and paracetamol onto activated carbon prepared from effluent treatment plant sludge of the beverage industry. Chemosphere 2021, 262, 128322. [Google Scholar] [CrossRef]
  22. Ioannidis, I.; Pashalidis, I.; Mulla, B.; Kotanidis, G.; Ioannou, K.; Constantinides, G.; Kostoglou, N.; Rebholz, C. Radionuclide Removal from Aqueous Solutions Using Oxidized Carbon Fabrics. Materials 2023, 16, 7429. [Google Scholar] [CrossRef]
  23. Azam, K.; Shezad, N.; Shafiq, I.; Akhter, P.; Akhtar, F.; Jamil, F.; Shafique, S.; Park, Y.; Hussain, M.A. Review on activated carbon modifications for the treatment of wastewater containing anionic dyes. Chemosphere 2022, 306, 135566. [Google Scholar] [CrossRef]
  24. Lan, D.; Zhu, H.; Zhang, J.; Li, S.; Chen, Q.; Wang, C.; Wu, T.; Xu, M. Adsorptive removal of organic dyes via porous materials for wastewater treatment in recent decades: A review on species, mechanisms and perspectives. Chemosphere 2022, 293, 133464. [Google Scholar] [CrossRef]
  25. El Maguana, Y.; Elhadiri, N.; Benchanaa, M.; Chikri, R. Activated Carbon for Dyes Removal: Modeling and Understanding the Adsorption Process. J. Chem. 2020, 2020, 2096834. [Google Scholar] [CrossRef]
  26. Cukierman, A.L. Development and Environmental Applications of Activated Carbon Cloths. Int. Sch. Res. Not. 2013, 2013, 261523. [Google Scholar] [CrossRef]
  27. Marsh, H.; Rodríguez-Reinoso, F. Activated Carbon (Origins). In Activated Carbon; Marsh, H., Rodríguez-Reinoso, F., Eds.; Elsevier Science Ltd.: Amsterdam, The Netherlands, 2006; pp. 13–86. [Google Scholar]
  28. Zulfiqar, U.; Kostoglou, N.; Thomas, A.G.; Rebholz, C.; Matthews, A.; Lewis, D.J. Flexible nanoporous activated carbon for adsorption of organics from industrial effluents. Nanoscale 2021, 13, 15311–15323. [Google Scholar] [CrossRef]
  29. Kostoglou, N.; Koczwara, C.; Prehal, C.; Terziyska, V.; Babic, B.; Matovic, B.; Constantinides, G.; Tampaxis, C.; Charalambopoulou, G.; Steriotis, T.; et al. Nanoporous activated carbon cloth as a versatile material for hydrogen adsorption, selective gas separation and electrochemical energy storage. Nano Energy 2017, 40, 49–64. [Google Scholar] [CrossRef]
  30. Hassan, M.F.; Sabri, M.A.; Fazal, H.; Hafeez, A.; Shezad, N.; Hussain, M. Recent trends in activated carbon fibers production from various precursors and applications—A comparative review. J. Anal. Appl. Pyrolysis 2020, 145, 104715. [Google Scholar] [CrossRef]
  31. Ahsaine, H.A.; Anfar, Z.; Zbair, M.; Ezahri, M.; El Alem, N. Adsorptive Removal of Methylene Blue and Crystal Violet onto Micro-Mesoporous Zr 3 O/Activated Carbon Composite: A Joint Experimental and Statistical Modeling Considerations. J. Chem. 2018, 2018, 6982014. [Google Scholar] [CrossRef]
  32. Sultana, S.; Islam, K.; Hasan, M.A.; Khan, H.M.J.; Khan, M.A.R.; Deb, A.; Al Raihan, M.; Rahman, M.W. Adsorption of crystal violet dye by coconut husk powder: Isotherm, kinetics and thermodynamics perspectives. Environ. Nanotechnol. Monit. 2022, 17, 100651. [Google Scholar] [CrossRef]
  33. Porkodi, K.; Kumar, K.V. Equilibrium, kinetics and mechanism modeling and simulation of basic and acid dyes sorption onto jute fiber carbon: Eosin yellow, malachite green and crystal violet single component systems. J. Hazard. Mater. 2007, 143, 311–327. [Google Scholar] [CrossRef] [PubMed]
  34. Sarabadan, M.; Bashiri, H.; Mousavi, S.M. Removal of crystal violet dye by an efficient and low cost adsorbent: Modeling, kinetic, equilibrium and thermodynamic studies. Korean J. Chem. Eng. 2019, 36, 1575–1586. [Google Scholar] [CrossRef]
  35. Abbas, M.; Harrache, Z.; Trari, M. Removal of gentian violet in aqueous solution by activated carbon equilibrium, kinetics, and thermodynamic study. Adsorp Sci Technol. 2019, 37, 566. [Google Scholar] [CrossRef]
  36. Gohr, M.S.H.; Abd-Elhamid, A.I.; El-Shanshory, A.A.; Soliman, H.M.A. Adsorption of cationic dyes onto chemically modified activated carbon: Kinetics and thermodynamic study. J. Mol. Liq. 2022, 346, 118227. [Google Scholar] [CrossRef]
  37. Goswami, R.; Dey, A.K. Use of Anionic Surfactant-Modified Activated Carbon for Efficient Adsorptive Removal of Crystal Violet Dye. Adsorp. Sci. Technol. 2022, 2022, 2357242. [Google Scholar] [CrossRef]
  38. Duman, O.; Ayranci, E. Adsorptive removal of cationic surfactants from aqueous solutions onto high-area activated carbon cloth monitored by in situ UV spectroscopy. J. Hazard. Mater. 2010, 174, 359–367. [Google Scholar] [CrossRef]
  39. Kumari, M.; Chaudhary, G.R.; Chaudhary, S.; Umar, A. Transformation of solid plastic waste to activated carbon fibres for wastewater treatment. Chemosphere 2022, 294, 133692. [Google Scholar] [CrossRef]
  40. ISO 9277:2022—Determination of the Specific Surface Area of Solids by Gas Adsorption—BET Method. International Standard Organization. Available online: https://www.iso.org/standard/71014.html (accessed on 19 February 2023).
  41. Stevens, J.S.; Byard, S.J.; Seaton, C.C.; Sadiq, G.; Davey, R.J.; Schroeder, S.L.M. Proton transfer and hydrogen bonding in the organic solid state: A combined XRD/XPS/ssNMR study of 17 organic acid–base complexes. Phys. Chem. Chem. Phys. 2014, 16, 1150–1160. [Google Scholar] [CrossRef]
  42. Thommes, M.; Kaneko, K.; Neimark, A.V.; Olivier, J.P.; Rodriguez-Reinoso, F.; Rouquerol, J.; Sing, K.S.W. Physisorption of gases, with special reference to the evaluation of surface area and pore size distribution (IUPAC Technical Report). Pure Appl. Chem. 2015, 87, 1051. [Google Scholar] [CrossRef]
  43. Kumar, C.V.; Pattammattel, A. Chapter 3—Characterization techniques for graphene. In Introduction to Graphene; Elsevier: Amsterdam, The Netherlands, 2017; pp. 45–74. [Google Scholar]
  44. Foo, K.Y.; Hameed, B.H. Insights into the modeling of adsorption isotherm systems. Chem. Eng. J. 2010, 156, 2–10. [Google Scholar] [CrossRef]
  45. Liatsou, I.; Pashalidis, I.; Oezaslan, M.; Dosche, C. Surface characterization of oxidized biochar fibers derived from Luffa Cylindrica and lanthanide binding. J. Environ. Chem. Eng. 2017, 5, 4069. [Google Scholar] [CrossRef]
  46. Mahmud, N.A.; Osman, N.; Jani, A.M.M. Characterization of Acid Treated Activated Carbon From Oil Palm Empty Fruit Bunches (EFB). J. Phys. Conf. Ser. 2018, 1083, 12049. [Google Scholar] [CrossRef]
  47. Pereira, M.F.R.; Soares, S.F.; Órfão, J.J.M.; Figueiredo, J.L. Adsorption of dyes on activated carbons: Influence of surface chemical groups. Carbon 2003, 41, 811. [Google Scholar] [CrossRef]
  48. Hadjittofi, L.; Prodromou, M.; Pashalidis, I. Activated biochar derived from cactus fibres—Preparation, characterization and application on Cu(II) removal from aqueous solutions. Bioresour. Technol. 2014, 159, 460–464. [Google Scholar] [CrossRef]
  49. Anastopoulos, I.; Katsouromalli, A.; Pashalidis, I. Oxidized biochar obtained from pine needles as a novel adsorbent to remove caffeine from aqueous solutions. J. Mol. Liq. 2020, 304, 112661. [Google Scholar] [CrossRef]
  50. Ji, Q.; Li, H. High surface area activated carbon derived from chitin for efficient adsorption of Crystal Violet. Diam. Relat. Mater. 2021, 118, 108516. [Google Scholar] [CrossRef]
  51. Ho, Y.S.; McKay, G.A. Comparison of Chemisorption Kinetic Models Applied to Pollutant Removal on Various Sorbents. Process Saf. Environ. Prot. 1998, 76, 332–340. [Google Scholar] [CrossRef]
  52. Anastopoulos, I.; Kyzas, G.Z. Are the thermodynamic parameters correctly estimated in liquid-phase adsorption phenomena? J. Mol. Liq. 2016, 218, 174–185. [Google Scholar] [CrossRef]
Figure 1. (a) N2 adsorption and desorption isotherms recorded at −195.8 °C and (b) pore size distribution analysis based on the QSDFT method for the pristine carbon fabrics.
Carbon 10 00019 g001
Figure 2. SEM images at different magnifications for the pristine and oxidized fabrics: (ac) AC-F, (df) AC-FO, (gi) AC-W, (jl) AC-WO, (mo) AC-NW and (pr) AC-NWO.
Carbon 10 00019 g002
Figure 3. FTIR spectra of acid pristine and oxidized AC fabrics.
Carbon 10 00019 g003
Figure 4. High-resolution XPS data of the pristine and oxidized AC fabrics: (a) C1s, (c) O1s and (e) N1s spectra for AC-F, AC-W and AC-NW samples and (b) C1s, (d) O1s and (f) N1s spectra for AC-FO, AC-WO and AC-NWO samples.
Carbon 10 00019 g004
Figure 5. Langmuir adsorption isotherms of CV for the pristine and oxidized AC fabrics. The solid lines represent the fitting for untreated samples (AC-F, AC-W and AC-NW) and dashed lines represent the fitting for the oxidized samples (AC-FO, AC-WO and AC-NWO). Experimental conditions: 10 mg of each AC in 25 mL aqueous CV solution and ambient atmospheric conditions.
Carbon 10 00019 g005
Figure 6. Schematic illustration of positively charged CV dye molecule and the negatively charged surface.
Carbon 10 00019 g006
Figure 7. Effect of time on the removal of CV from pristine and oxidized AC fabrics. Experimental conditions: 50 mg of each AC in 25 mL 20 ppm aqueous CV solution and ambient atmospheric conditions.
Carbon 10 00019 g007
Figure 8. Pseudo-first-order model for CV adsorption on the (a) AC-F and AC-FO, (b) AC-W and AC-WO and (c) AC-NW and AC-NWO fabrics.
Carbon 10 00019 g008
Figure 9. Pseudo-second-order model for CV adsorption on the (a) AC-F and AC-FO, (b) AC-W and AC-WO and (c) AC-NW and AC-NWO fabrics.
Carbon 10 00019 g009
Figure 10. Schematic illustration of the pi–cation and pi–pi interactions between the graphitic fabric surface and the aromatic core and the positively charged moieties of the dye, respectively.
Carbon 10 00019 g010
Figure 11. Effect of adsorbent mass on the adsorption behavior; (a) comparison between the uptake values of AC-NW and AC-NOW fabrics (x-axis is given in log scale) and (b) comparison between the removal percentages for various mass values for the AC-NW and AC-NWO fabrics.
Carbon 10 00019 g011
Figure 12. Variation of adsorption isotherm under the effect of temperature for the AC-NWO fabric. Experimental conditions: 10 mg AC-NWO fabric in 25 mL aqueous CV solutions at varied temperatures (23, 45 and 55 °C).
Carbon 10 00019 g012
Figure 13. Dye removal efficiencies of pristine and oxidized AC fabrics in (a) deionized water, (b) ground water and (c) sea water. Experimental conditions: 10 mg of each AC in 25 mL 50 ppm aqueous CV solution and ambient atmospheric conditions.
Carbon 10 00019 g013
Table 1. Pore structure properties of pristine and oxidized AC fabrics.
MaterialSBET (m2/g)VGurvich (cm3/g)W (nm)
AC-F10800.490.90
AC-FO4750.251.05
AC-W11190.470.84
AC-WO5600.291.03
AC-NW18450.860.93
AC-NWO5320.321.20
SBET: Brunauer–Emmett–Teller (BET) surface area, VGurvich: total pore volume at P/P0 ~0.95 for pores smaller than 50 nm in width calculated by the single-point Gurvich rule, W: average pore width calculated by the ratio of 2·(VGurvich)/(SBET) assuming a slit pore model.
Table 2. Langmuir isotherm parameters for CV dye adsorbed onto the pristine and oxidized AC fabrics.
ParameterAC-FAC-FOAC-WAC-WOAC-NWAC-NWO
qm (mg/g)3413039114155278
KL (L/mg)0.250.460.020.110.382.72
R20.9990.9970.9960.9980.9991.000
qm: maximum CV uptake amount, KL: Langmuir constant, R2: coefficient of determination.
Table 3. Kinetic model parameters for CV adsorption on pristine and oxidized fabrics.
Carbon ClothPseudo 1st OrderPseudo 2nd Order
qt (mg/g)k1
(min−1)
R2qt
(mg/g)
k2
(min−1)
R2qt (Experimental)
(mg/g)
AC-F0.80.040.9341.00.060.8280.8
AC-FO7.40.120.97710.40.040.99910.0
AC-W0.10.040.9220.20.900.9690.2
AC-WO0.70.060.9520.90.150.9760.9
AC-NW7.50.050.9529.80.010.9699.1
AC-NWO8.50.130.94110.50.030.99610.0
qt: CV adsorbed per unit mass at time t, k1: rate constant for pseudo-first-order model, k2: rate constant for pseudo-second-order model, R2: coefficient of determination.
Table 4. Langmuir isotherm parameters for the AC-NWO fabrics at different temperatures.
ParameterTemperature (K)
318328
qm (mg/g)355428
KL (L/mg)0.260.34
R20.9990.999
qm: maximum CV uptake amount, KL: Langmuir constant, R2: coefficient of determination.
Table 5. Thermodynamic parameters of adsorption for the AC-NWO fabric.
Temperature (K)ΔG° (kJ/mol)ΔH° (kJ/mol)ΔS° (J/mol∙K)
318−41.223.5200
328−43.3
ΔG°: Gibbs free energy change, ΔH°: enthalpy change, ΔS°: entropy change.
Disclaimer/Publisher’s Note: The statements, opinions and data contained in all publications are solely those of the individual author(s) and contributor(s) and not of MDPI and/or the editor(s). MDPI and/or the editor(s) disclaim responsibility for any injury to people or property resulting from any ideas, methods, instructions or products referred to in the content.

