

Date Palm Leaflet-Derived Carbon Microspheres Activated Using Phosphoric Acid for Efficient Lead (II) Adsorption

 , ,
, ,
Abstract
:
1. Introduction
2. Experimental
2.1. Raw Materials and Reagents
2.2. Preparation of Carbon Microspheres
2.3. Activation of the CMs
2.4. Characterization of CMs and Activated CMs
2.5. Adsorption Studies
2.6. Multistage Remove and Unregenerated Reuse of Adsorbent
3. Results and Discussions
3.1. Adsorption Studies
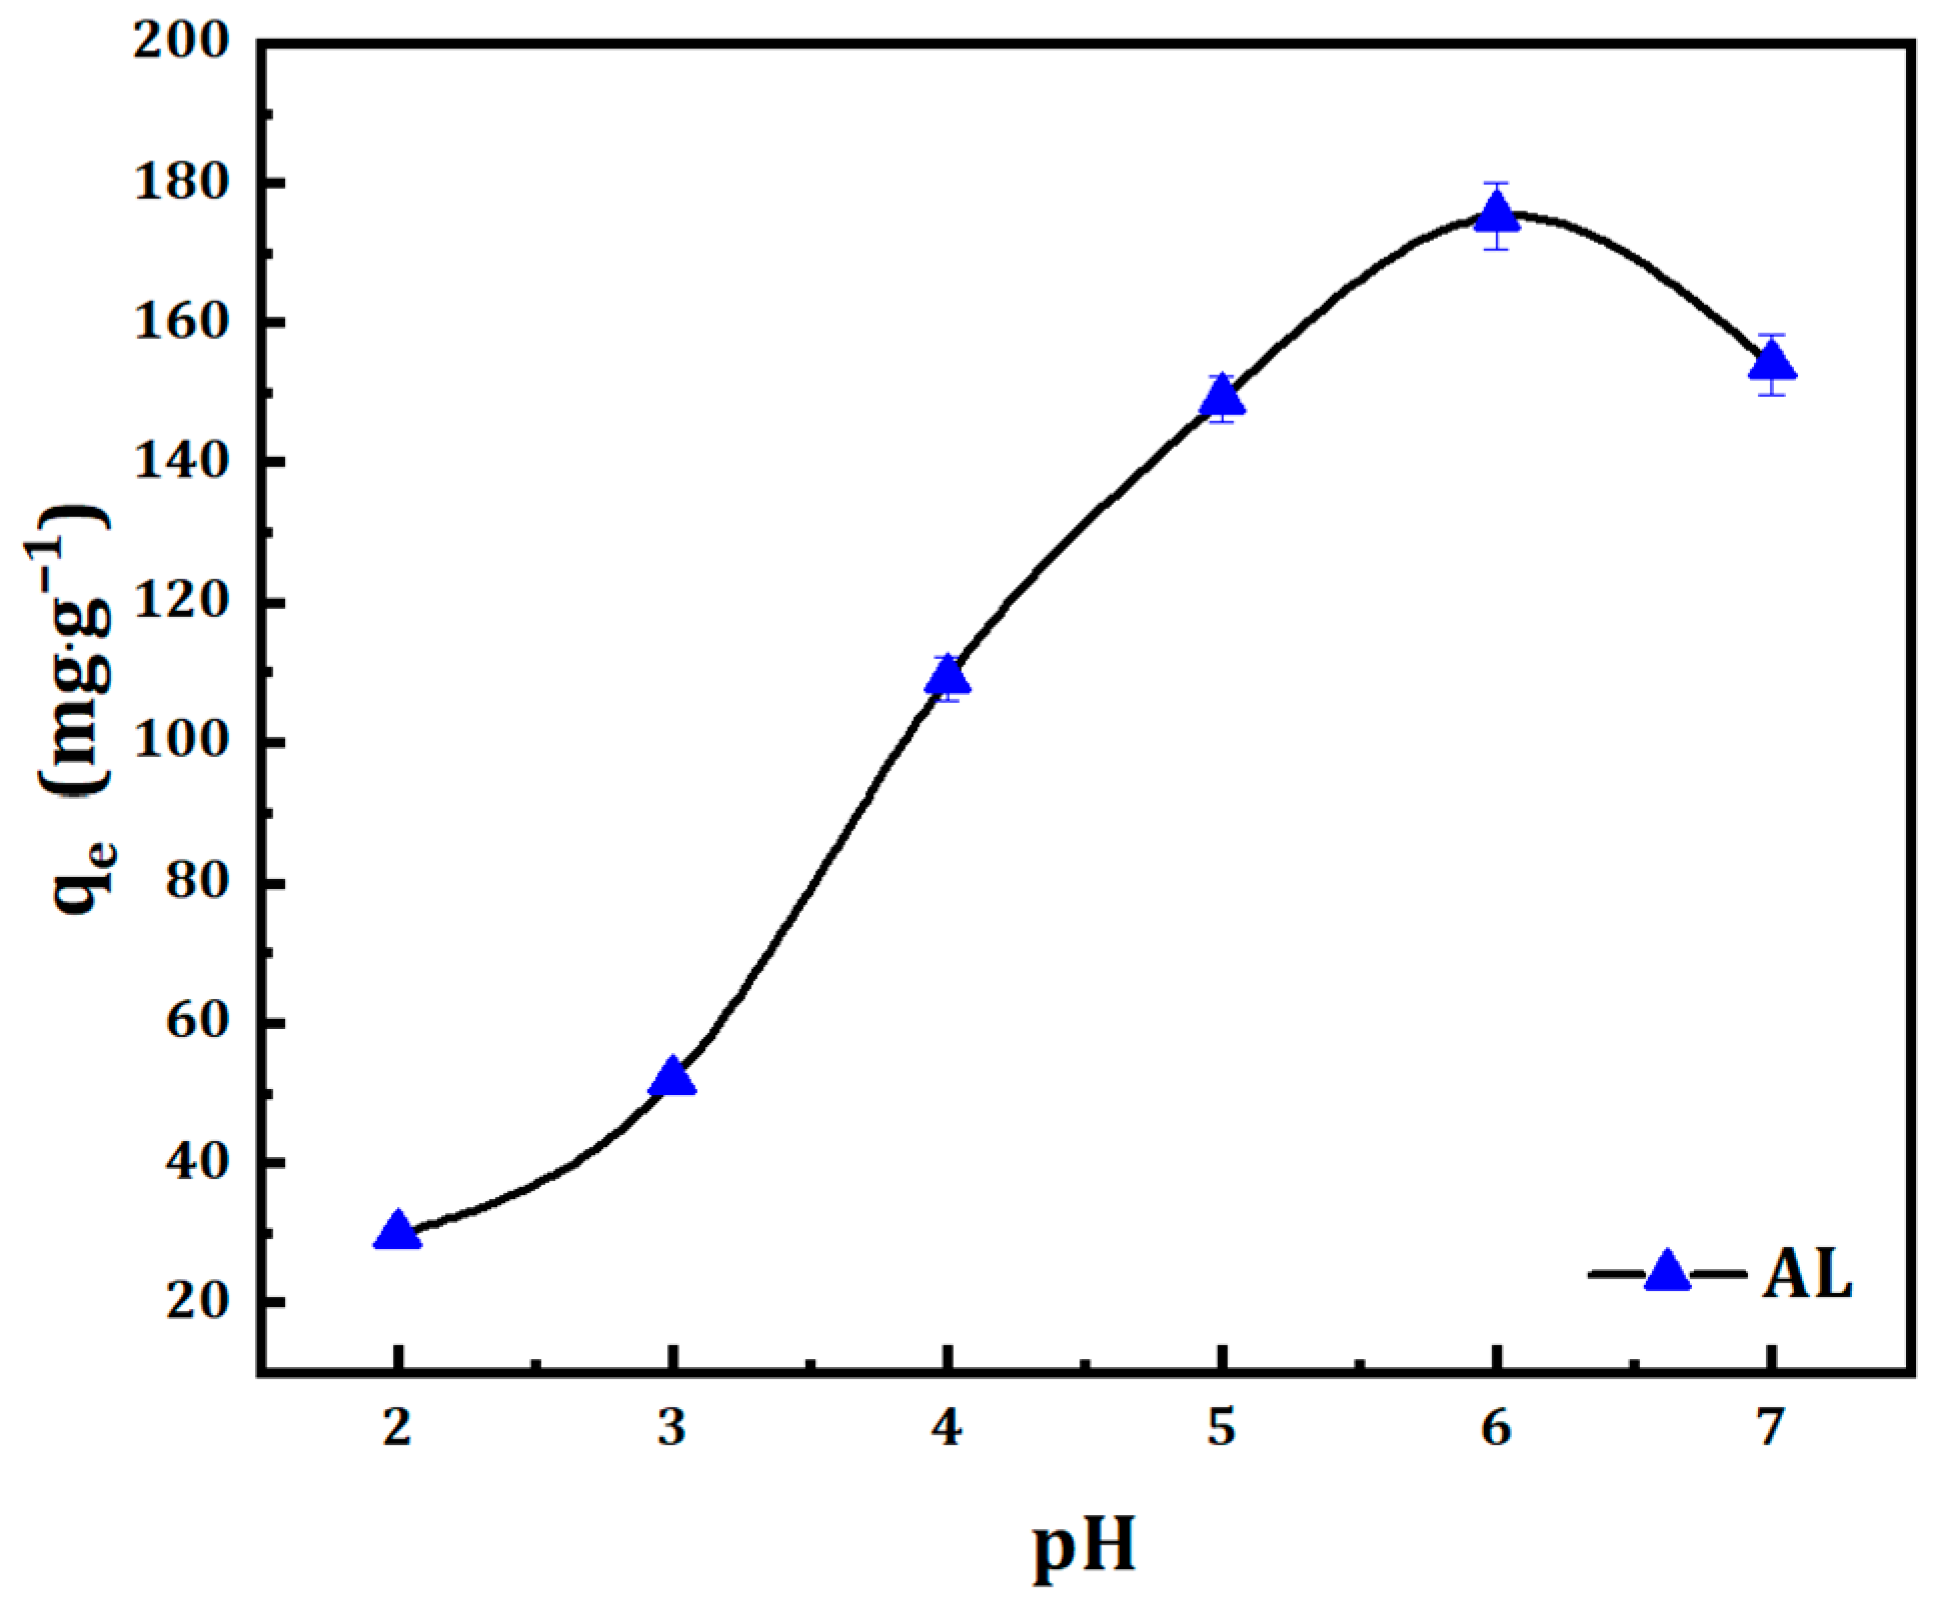
3.1.1. Effect of pH
3.1.2. Influence of Adsorbent Dose
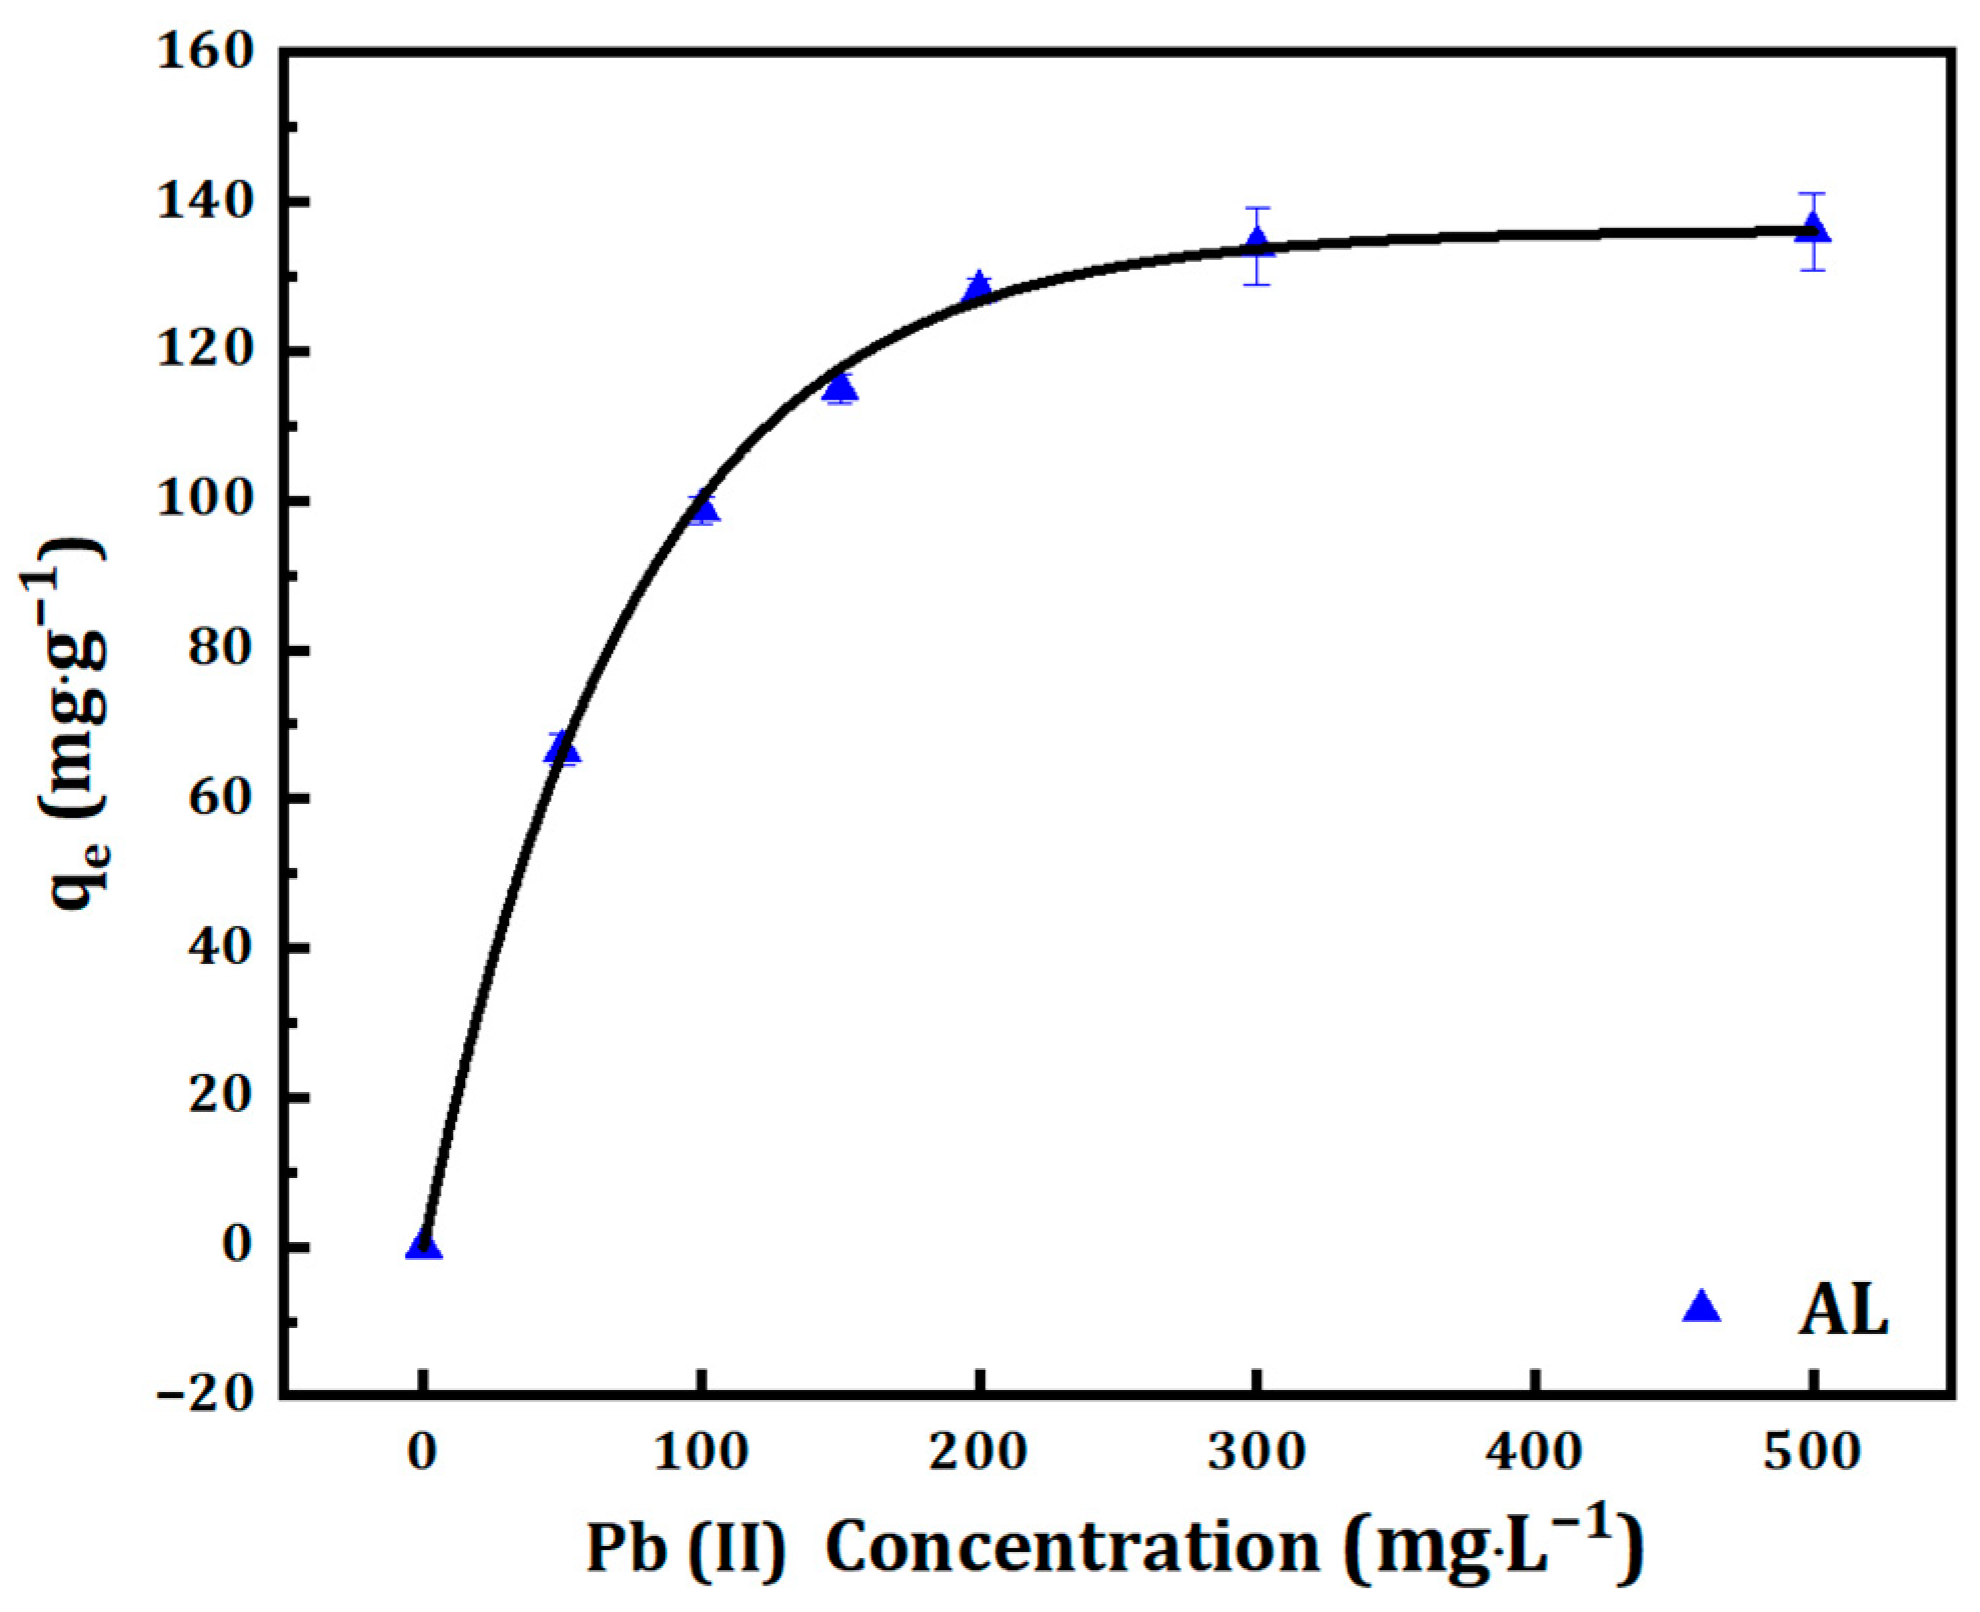
3.1.3. The Effect of Initial Concentration and Contact Duration
3.2. Adsorption Isotherm
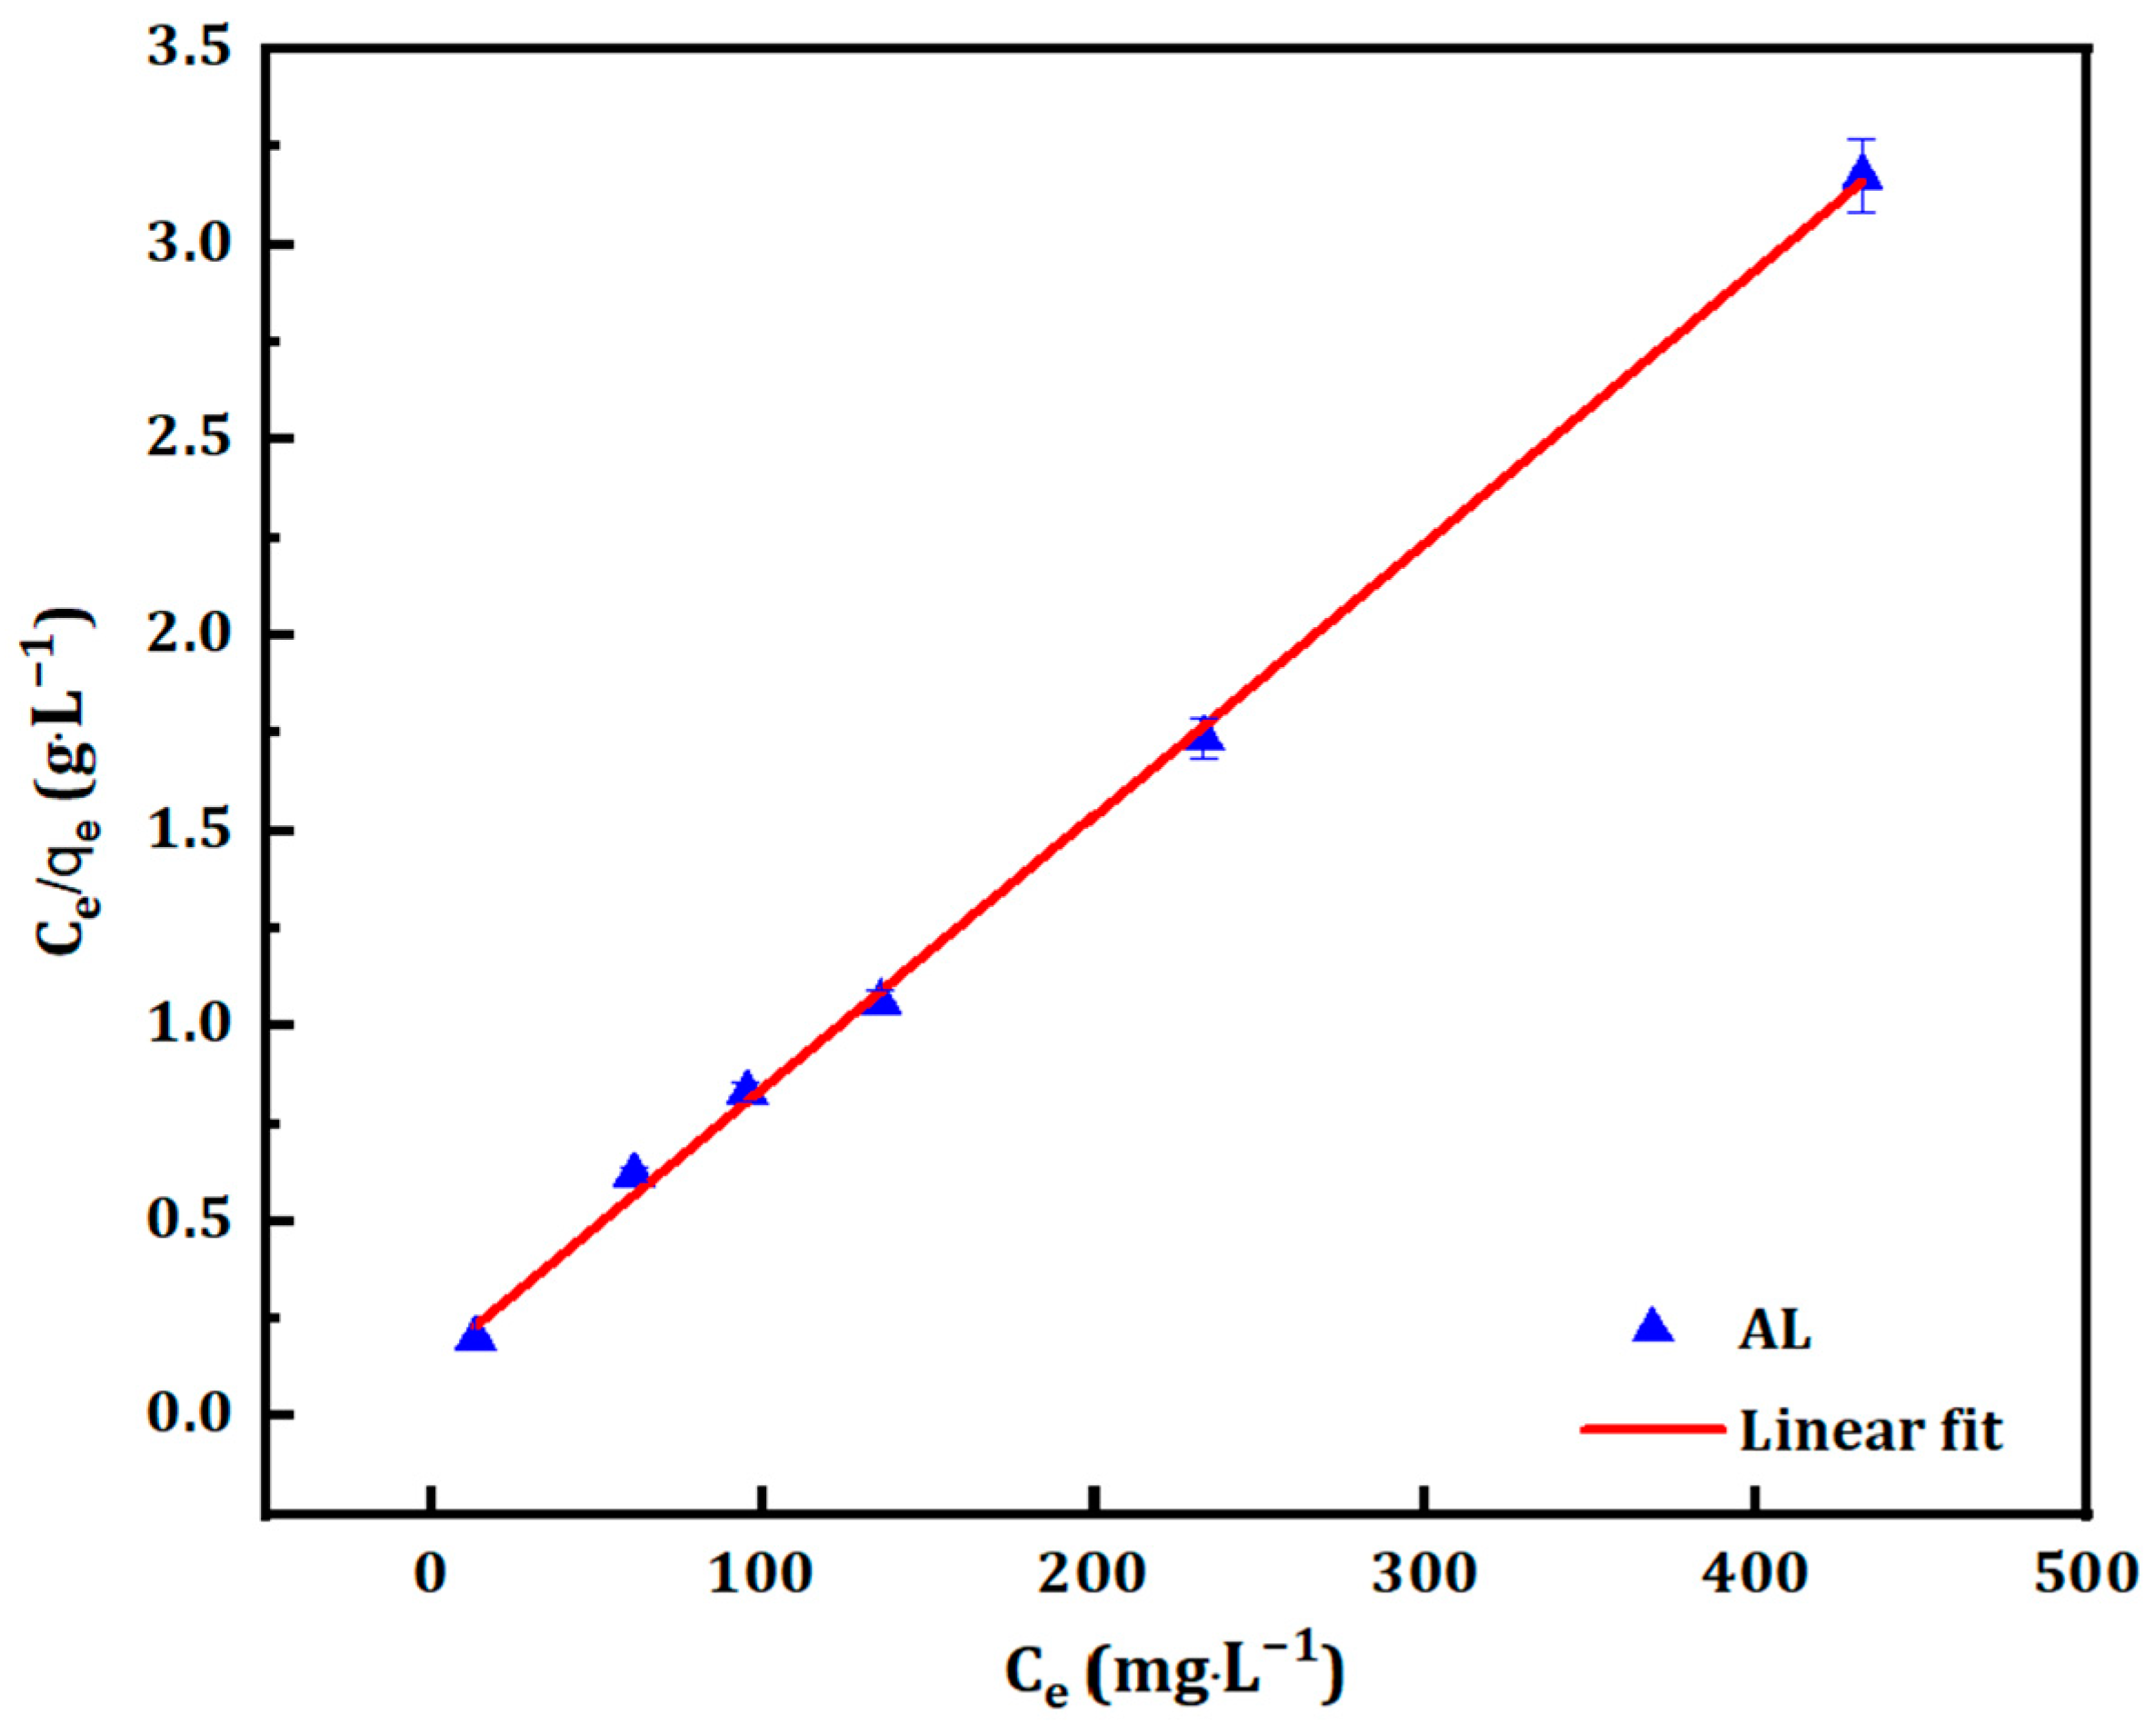
3.2.1. Langmuir Isotherm
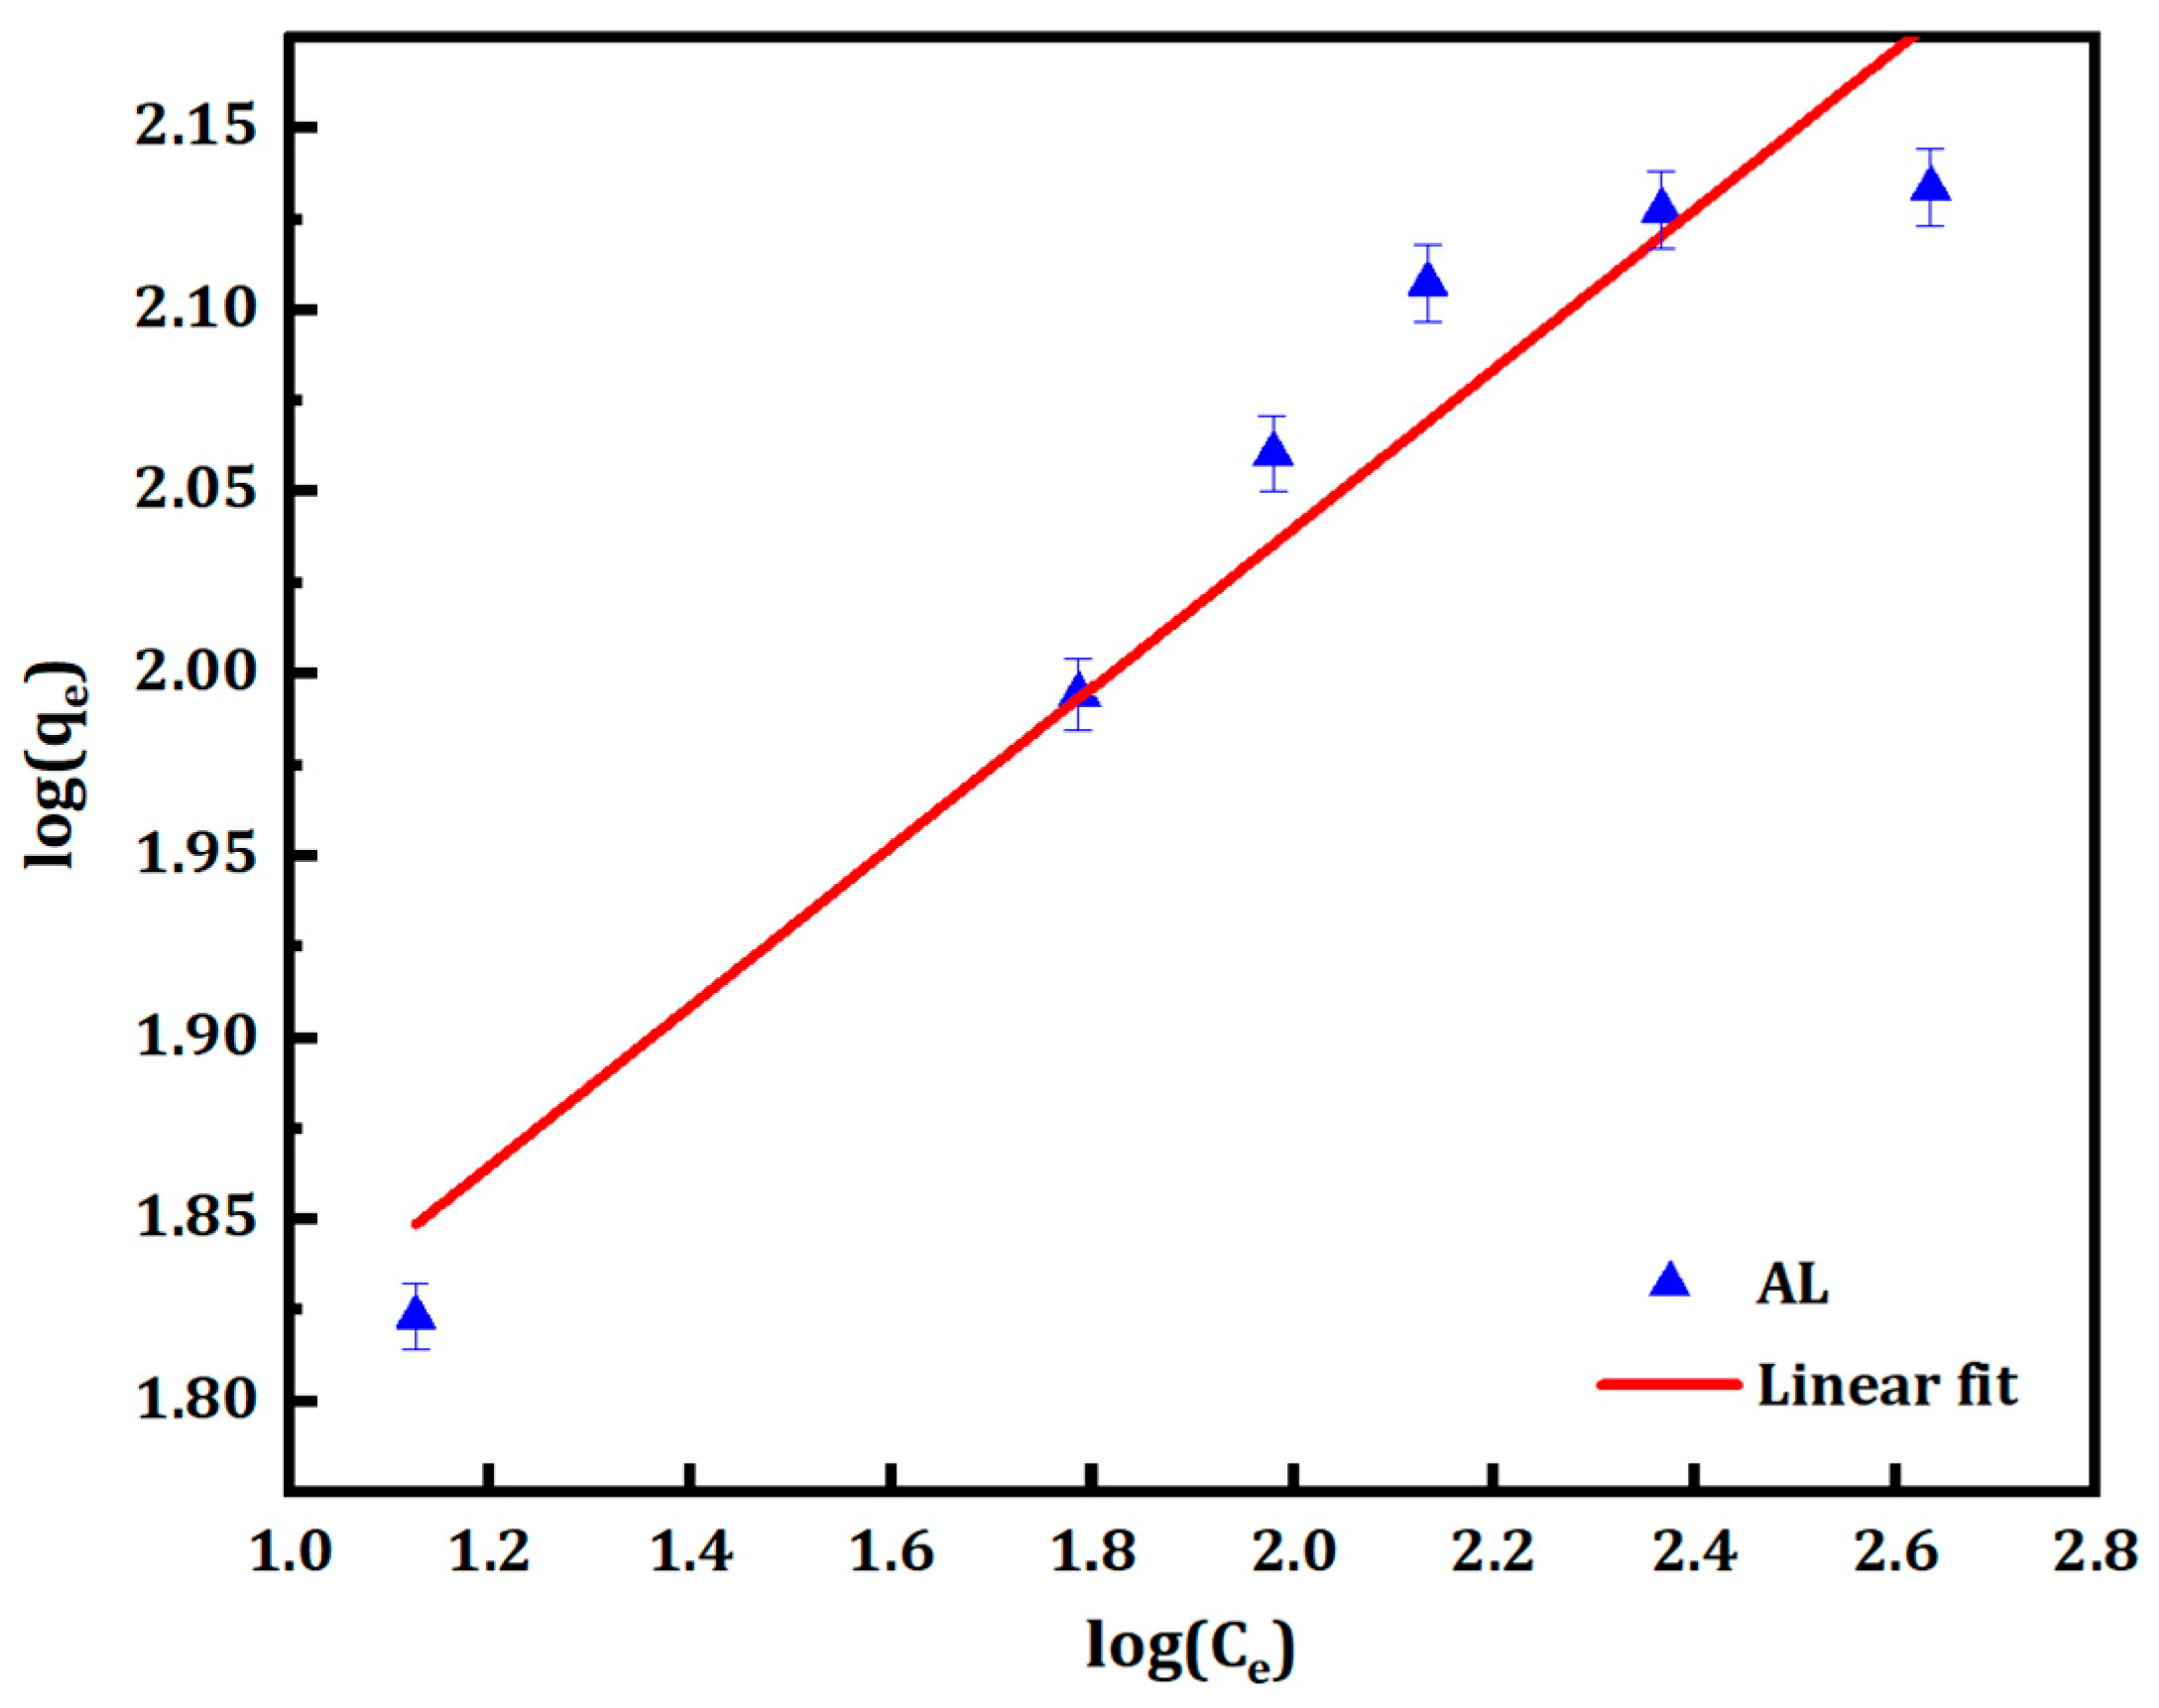
3.2.2. Freundlich Isotherm
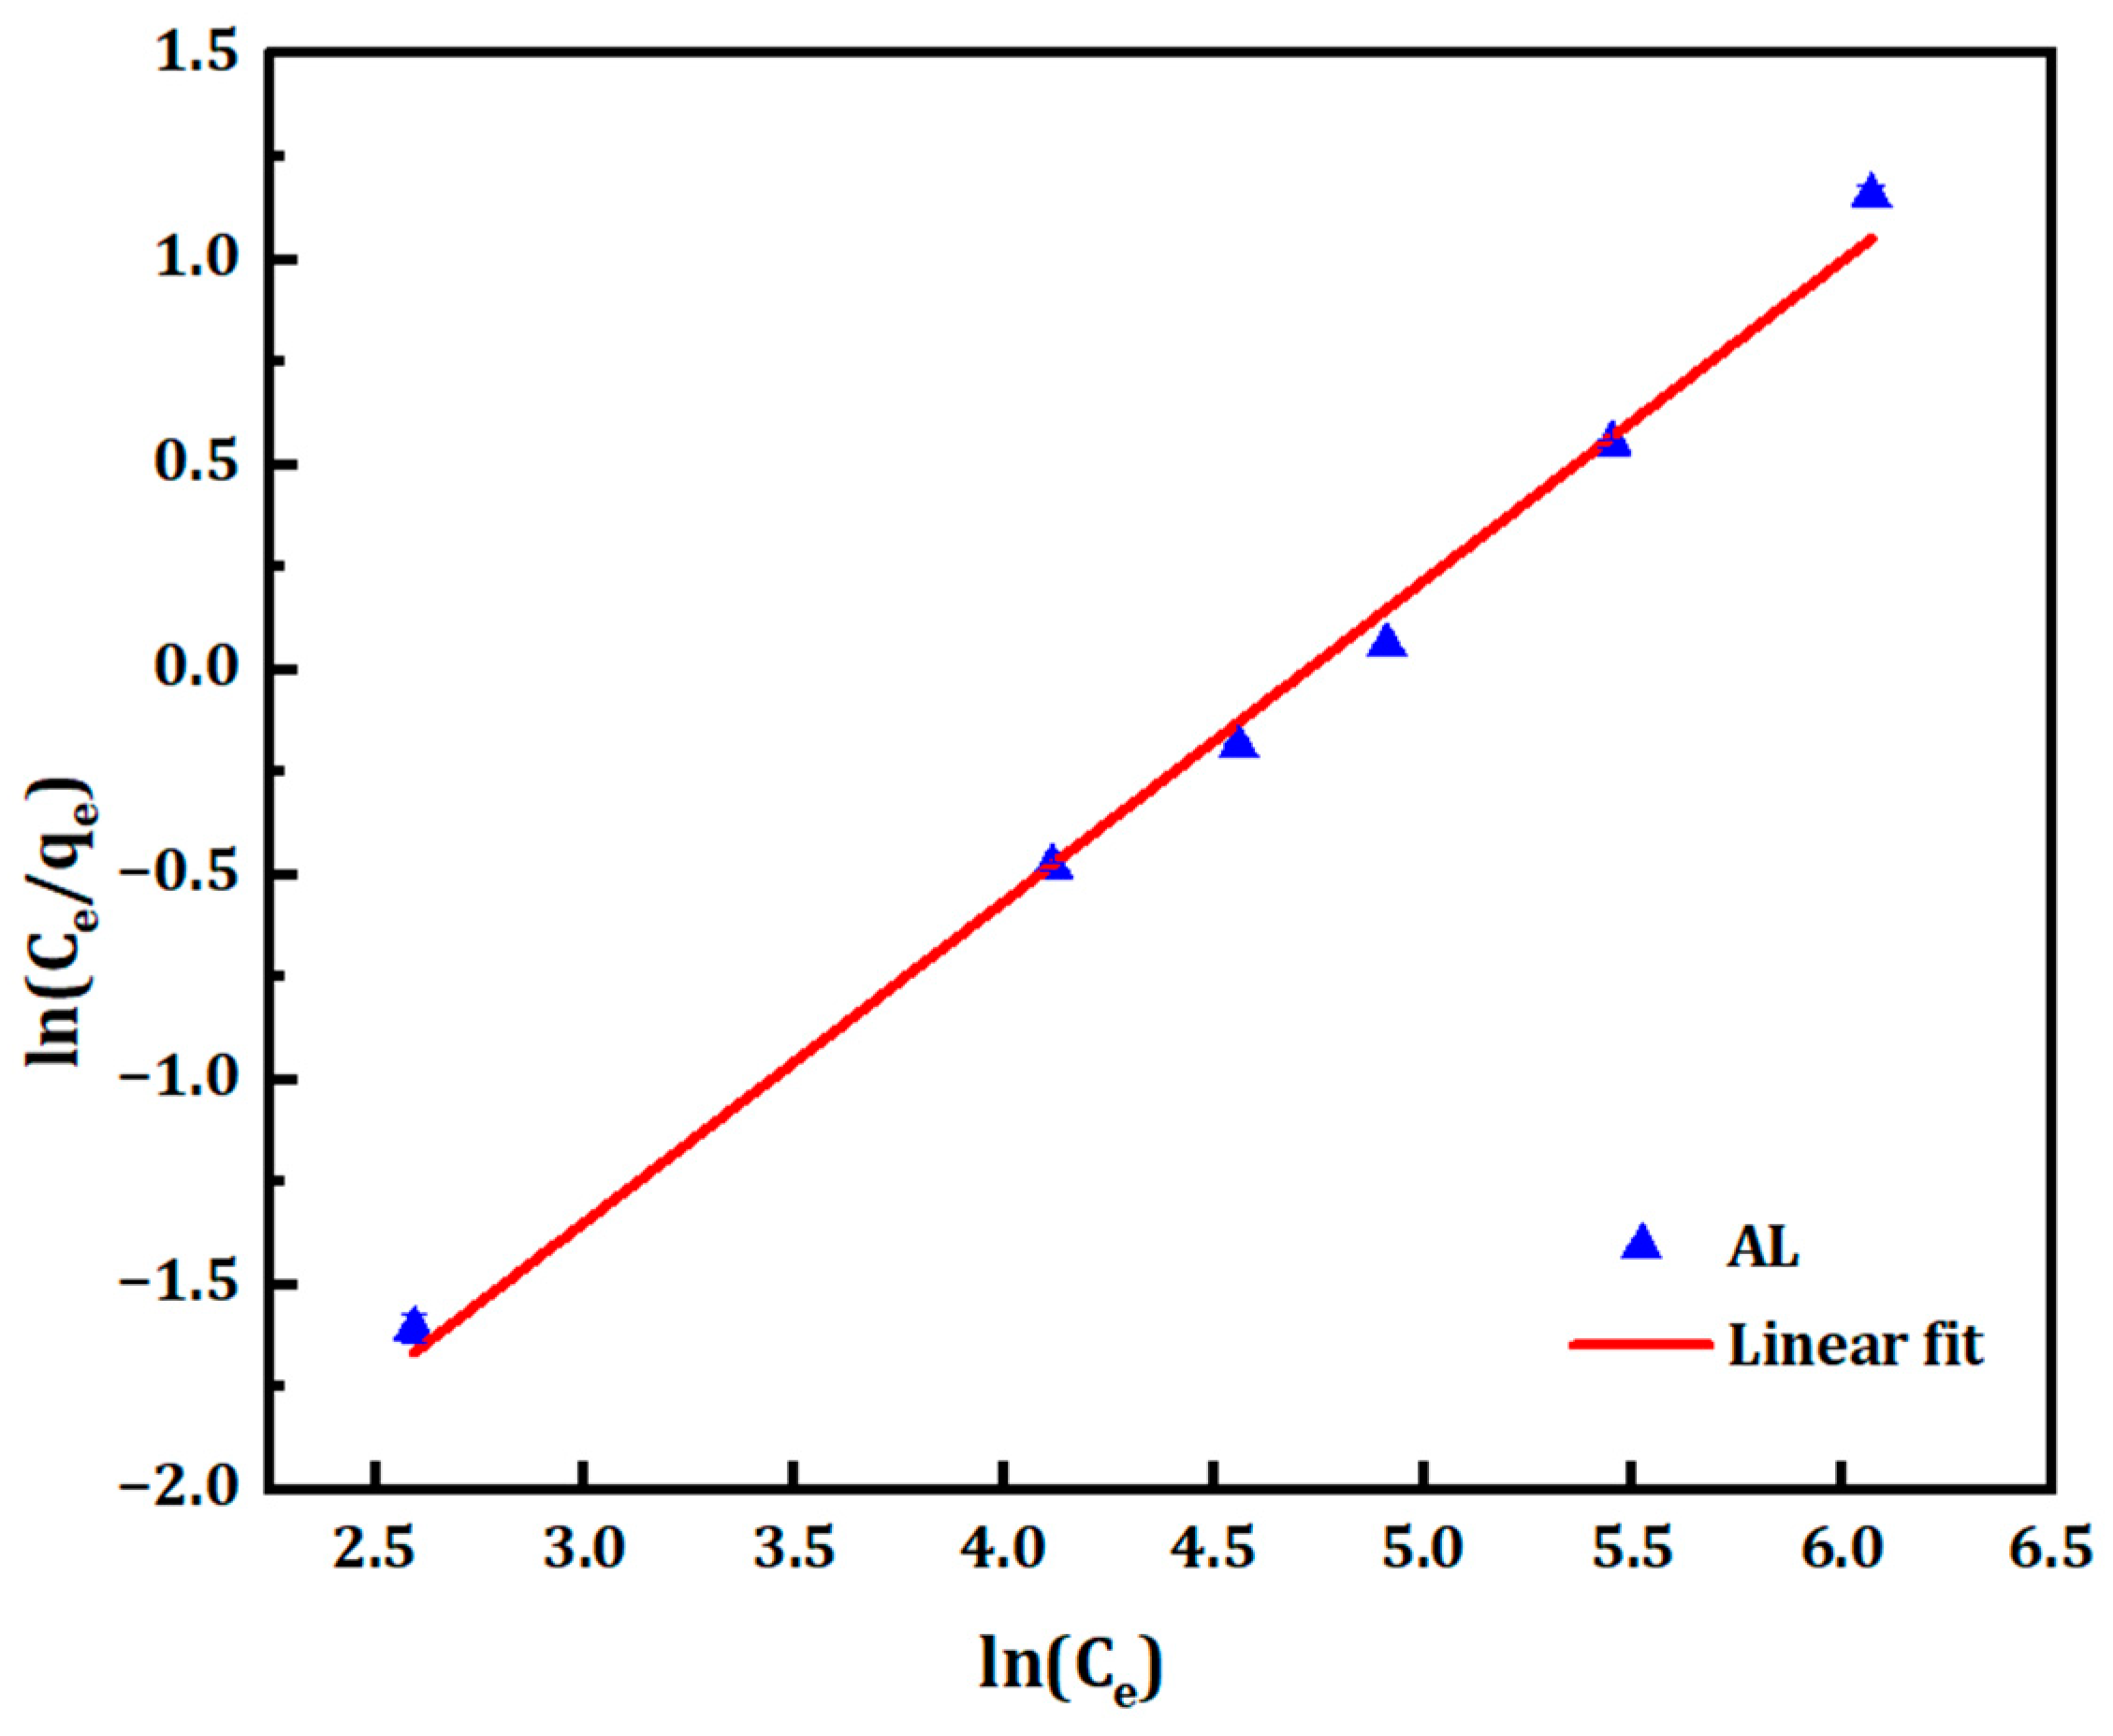
3.2.3. Redlich–Peterson Isotherm
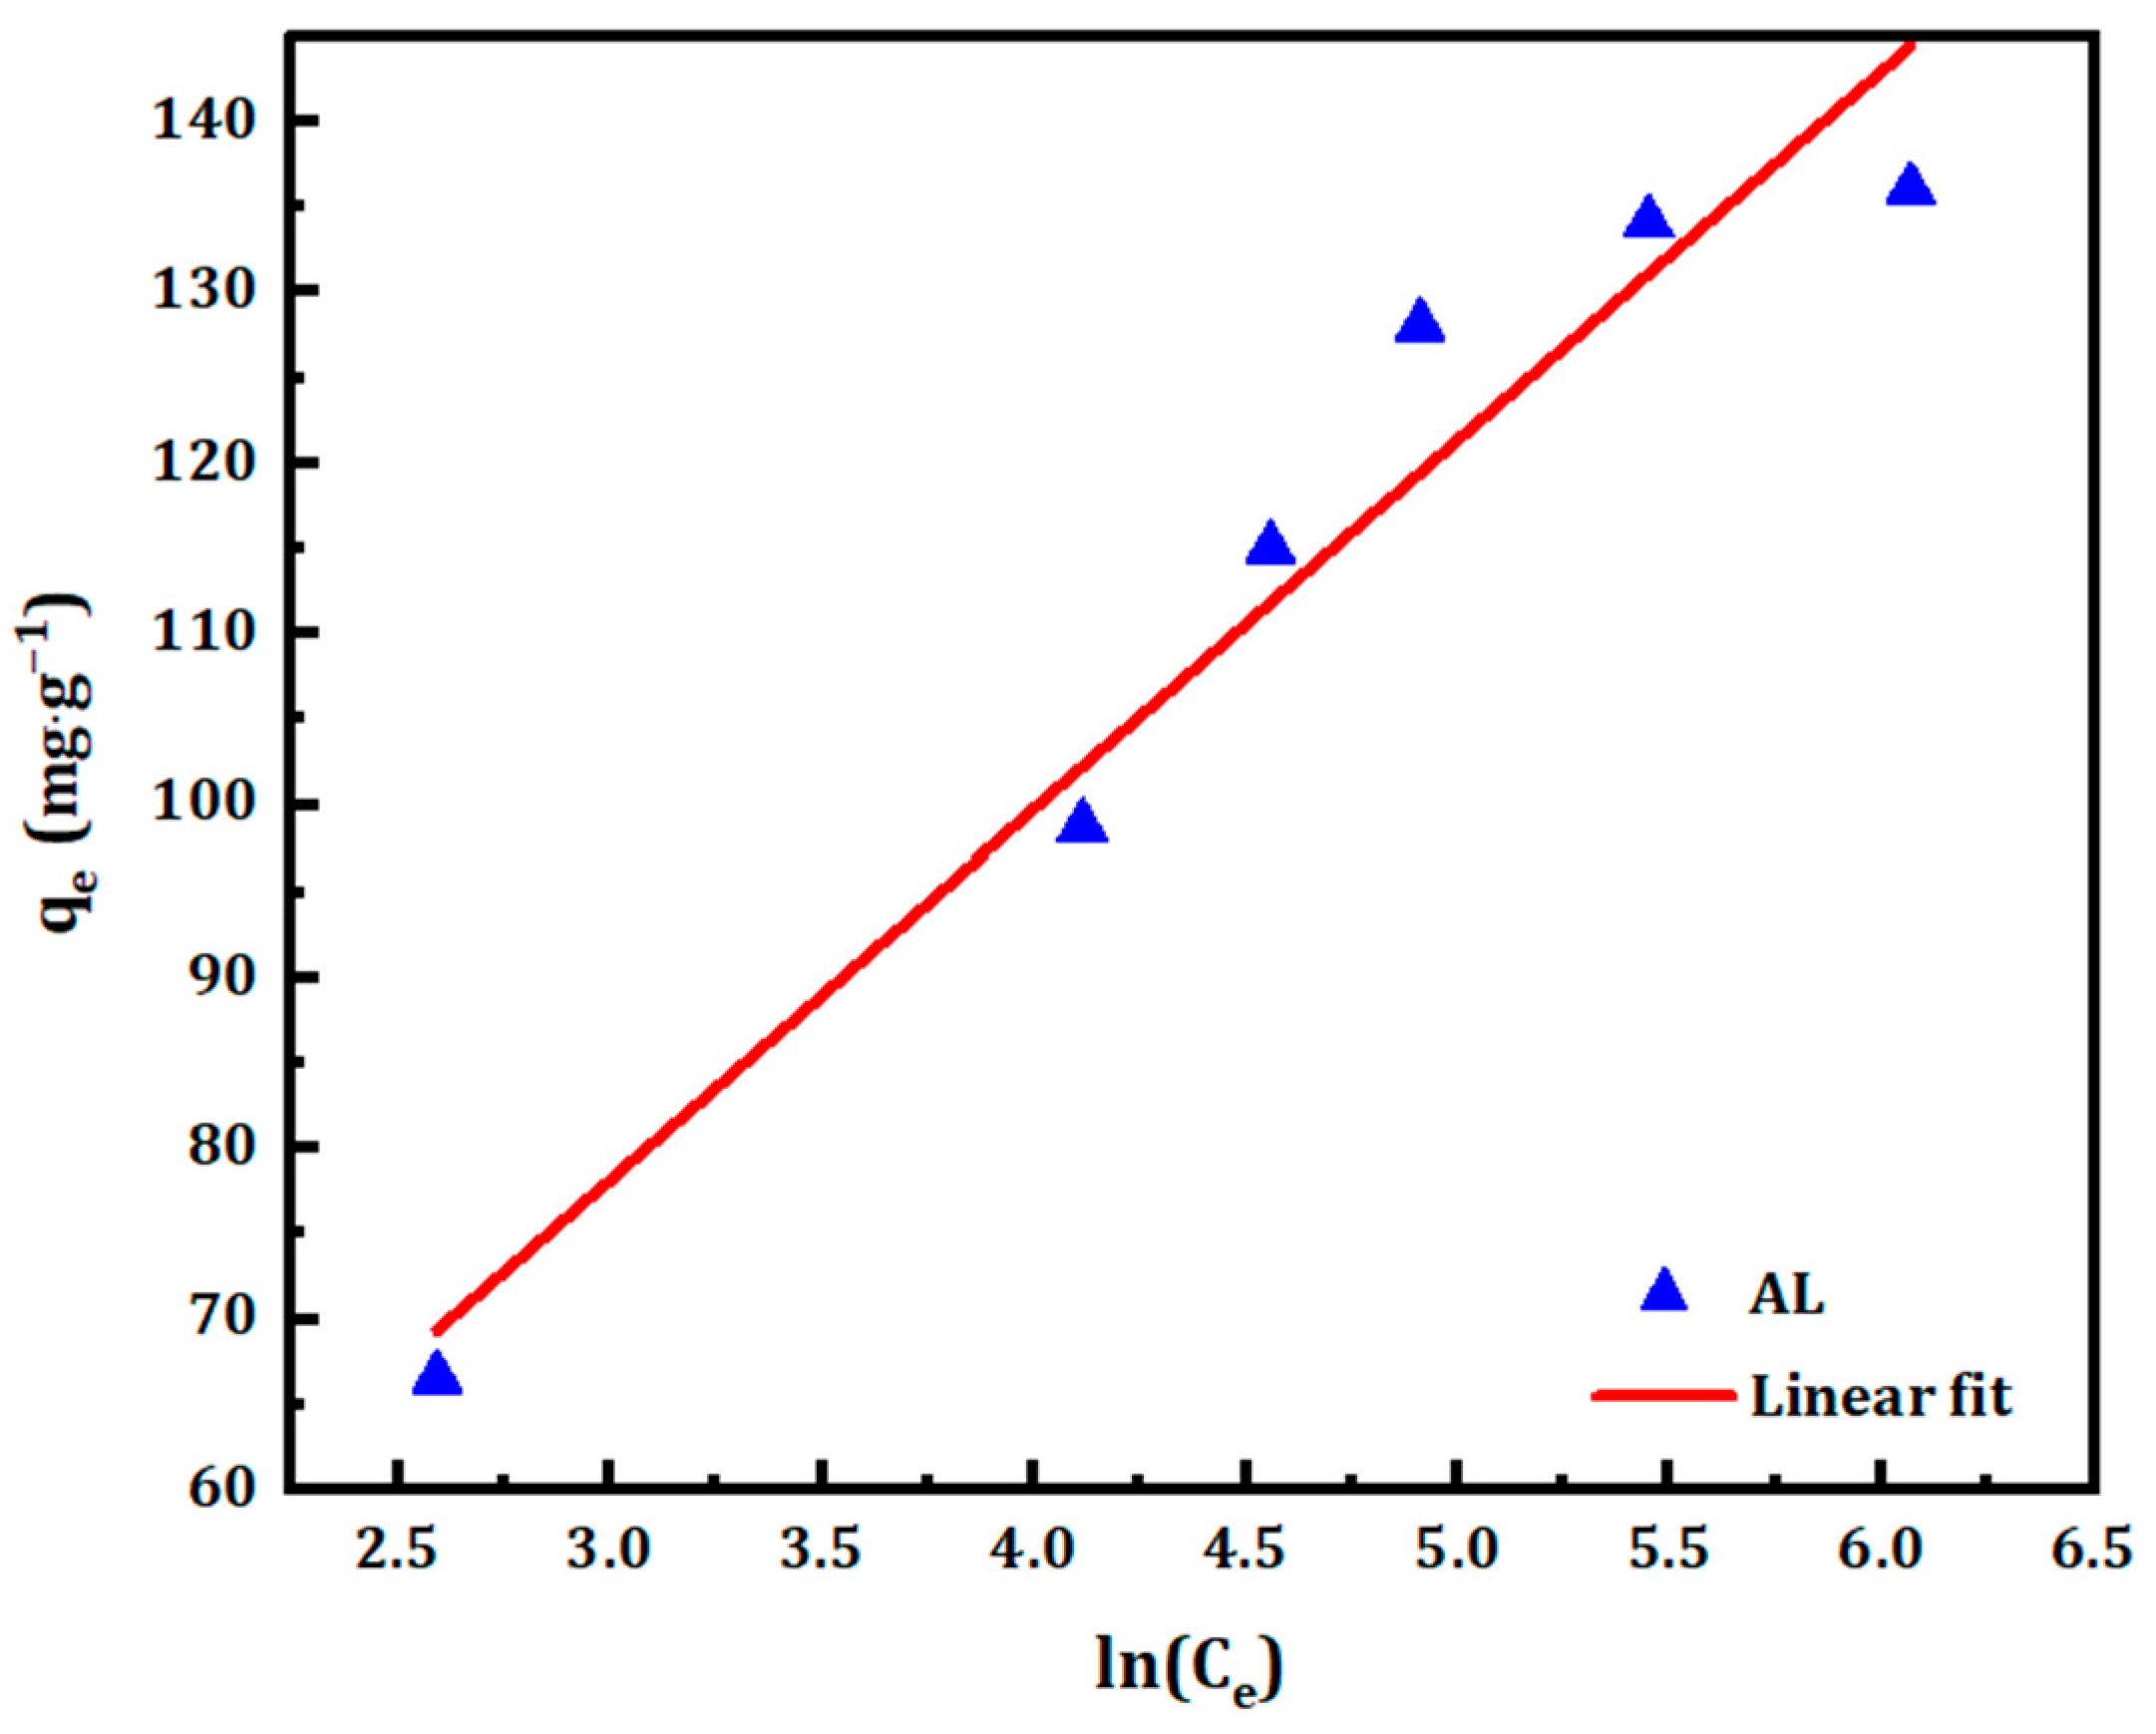
3.2.4. Temkin Isotherm
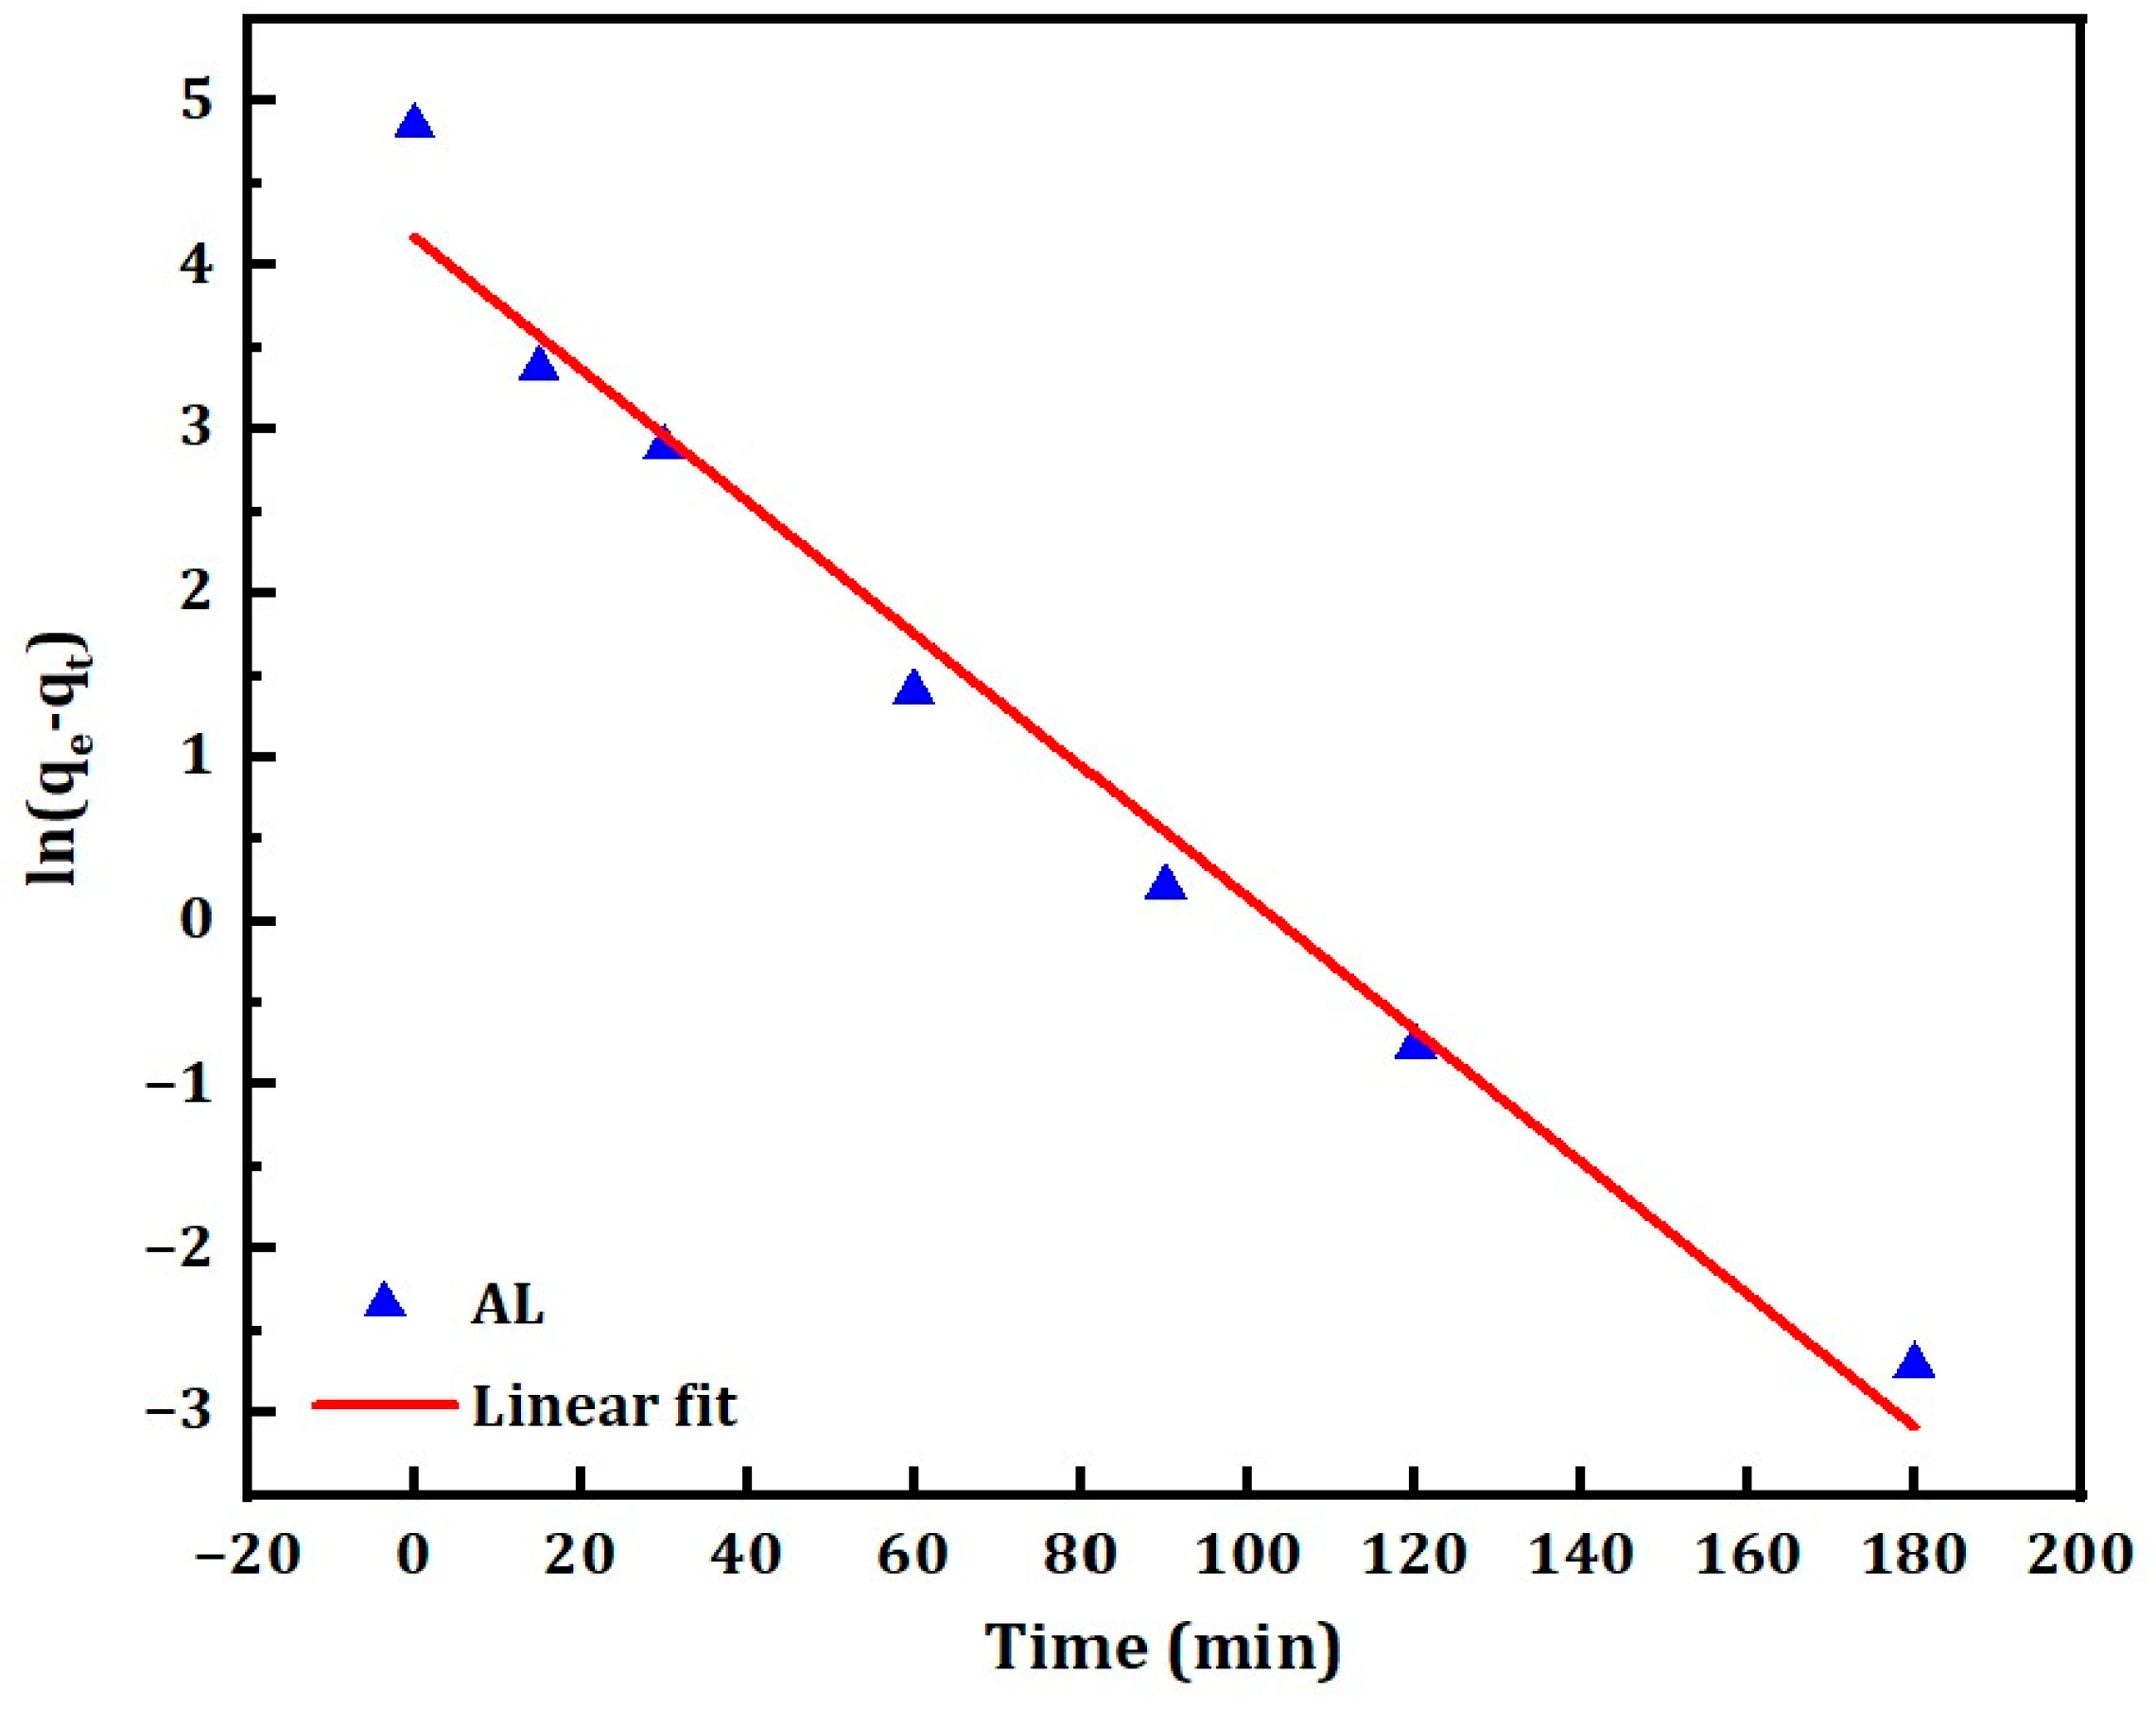
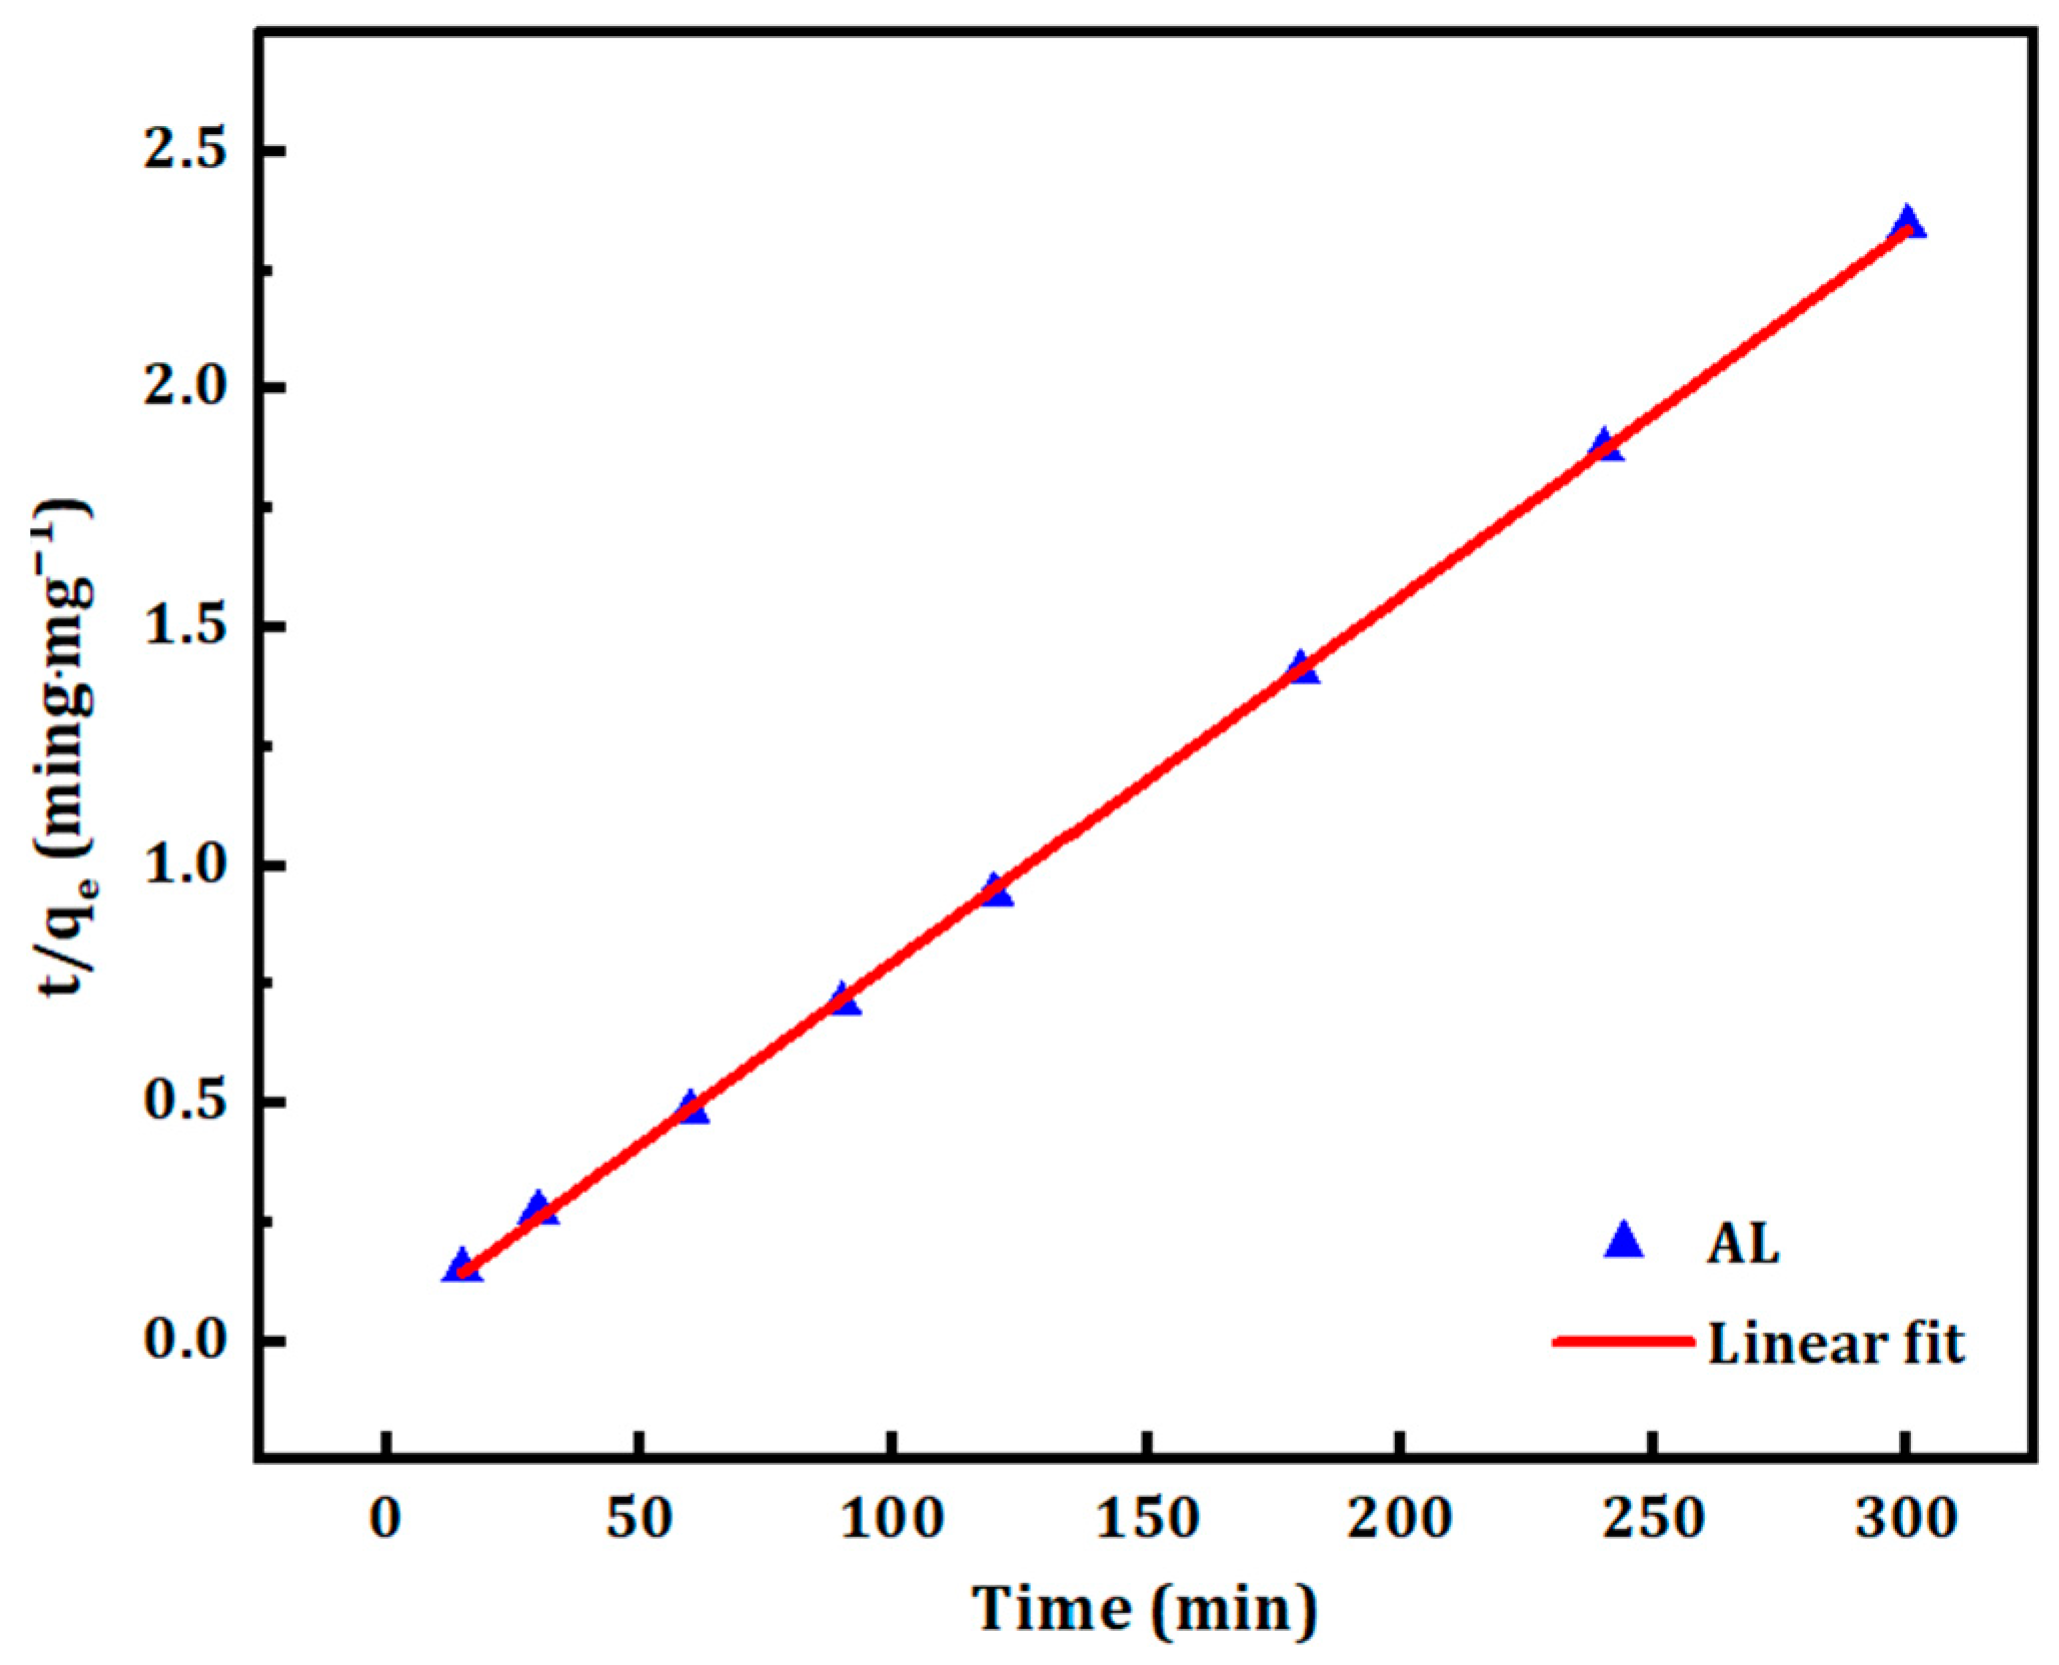
3.3. Adsorption Kinetics
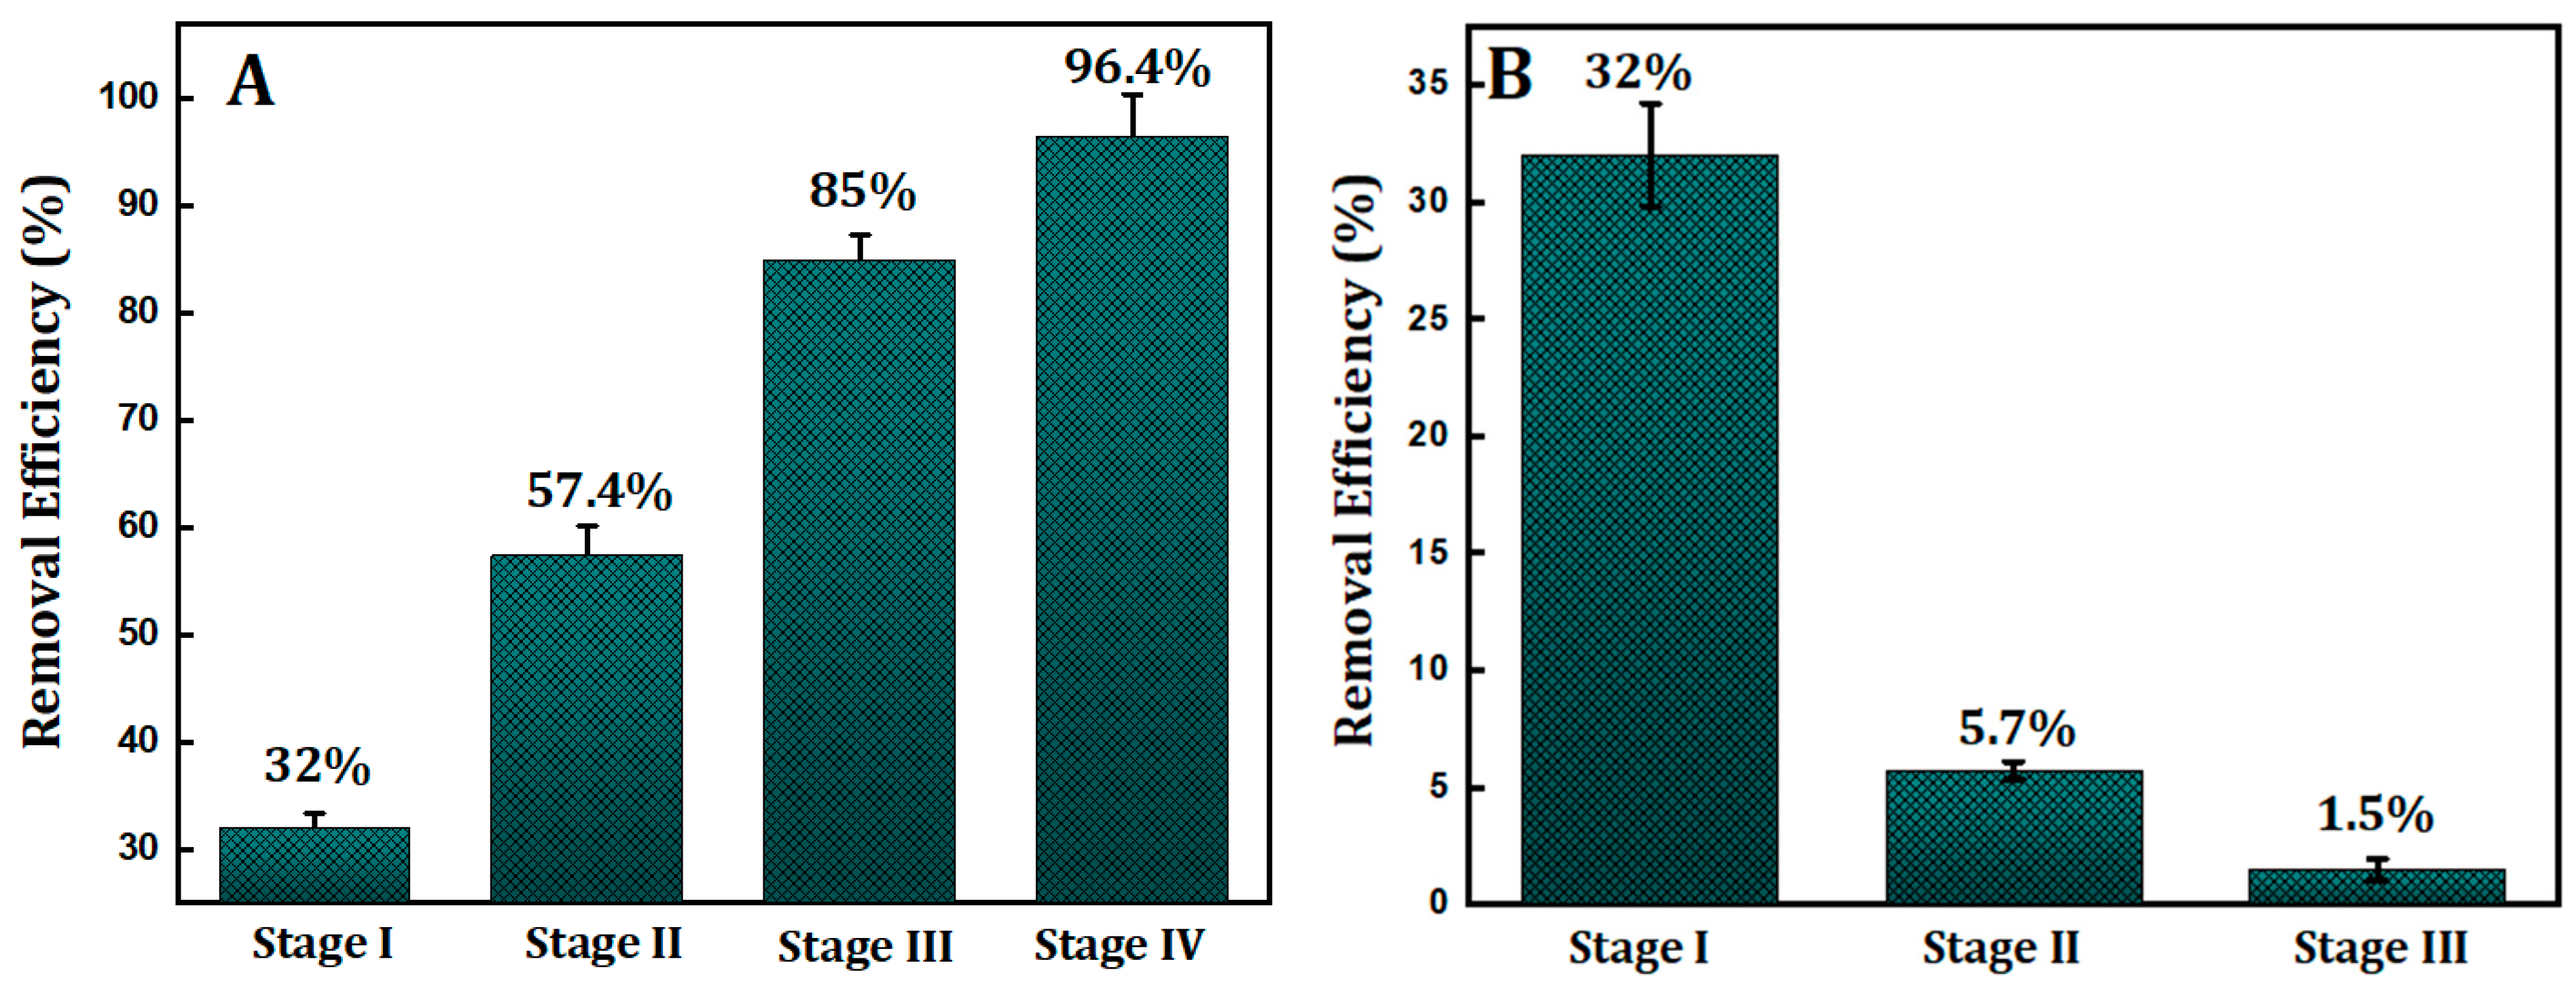
3.4. Multistage Removal and Unregenerated Reuse of Adsorbent
4. Environmental Implications
5. Conclusions
- Through a bespoke two-step hydrothermal carbonization–activation method, the authors created distinct and well-defined carbon microspheres from date palm biomass native to the Gulf region. Additionally, the authors described previously unreported findings on lead (II) ion adsorption onto carbon microspheres synthesized from date palm activated using phosphoric acid.
- A minimal quantity of 0.5 g·L−1 of activated carbon microspheres was sufficient to achieve a peak removal rate of 31.4% for lead (II). The findings imply that chemisorption might exert a more influence than physisorption in determining the absorption rate for the investigated lead adsorption process.
- This study’s significance lies in its threefold impact: promoting the sustainable utilization of resources (i.e., biomass), producing valuable industrial microparticles, and offering direct use in metal-bearing wastewater purification. This data could potentially be instrumental in upscaling bench-scale adsorption systems to larger, more practical systems for water decontamination applications.
Supplementary Materials
Author Contributions
Funding
Data Availability Statement
Conflicts of Interest
Correction Statement
References
- Karkra, R.; Kumar, P.; Bansod, B.K.; Bagchi, S.; Sharma, P.; Krishna, C.R. Classification of heavy metal ions present in multi-frequency multi-electrode potable water data using evolutionary algorithm. Appl. Water Sci. 2017, 7, 3679–3689. [Google Scholar] [CrossRef]
- Elbasiouny, H.; Darwesh, M.; Elbeltagy, H.; Abo-Alhamd, F.G.; Amer, A.A.; Elsegaiy, M.A.; Khattab, I.A.; Elsharawy, E.A.; Ebehiry, F.; El-Ramady, H.; et al. Ecofriendly remediation technologies for wastewater contaminated with heavy metals with special focus on using water hyacinth and black tea wastes: A review. Environ. Monit. Assess. 2021, 193, 449. [Google Scholar] [CrossRef]
- Kamarudzaman, A.N.; Adan, S.N.A.C.; Hassan, Z.; Wahab, M.A.; Makhtar, S.M.Z.; Seman, N.A.A.; Jalil, M.F.A.; Handayani, D.; Syafiuddin, A. Biosorption of copper (II) and Iron (II) using spent mushroom compost as biosorbent. Biointerface Res. Appl. Chem. 2022, 12, 7775–7786. [Google Scholar] [CrossRef]
- Salami, B.A.; Oyehan, T.A.; Gambo, Y.; Badmus, S.O.; Tanimu, G.; Adamu, S.; Lateef, S.A.; Saleh, T.A. Technological trends in nanosilica synthesis and utilization in advanced treatment of water and wastewater. Environ. Sci. Pollut. Res. 2022, 29, 42560–42600. [Google Scholar] [CrossRef]
- Eccles, H. Treatment of metal-contaminated wastes: Why select a biological process? Trends Biotechnol. 1999, 17, 462–465. [Google Scholar] [CrossRef] [PubMed]
- Crini, G.; Lichtfouse, E. Advantages and disadvantages of techniques used for wastewater treatment. Environ. Chem. Lett. 2019, 17, 145–155. [Google Scholar] [CrossRef]
- Da’ana, D.A.; Zouari, N.; Ashfaq, M.Y.; Abu-Dieyeh, M.; Khraisheh, M.; Hijji, Y.M.; Al-Ghouti, M.A. Removal of toxic elements and microbial contaminants from groundwater using low-cost treatment options. Curr. Pollut. Rep. 2021, 7, 300–324. [Google Scholar] [CrossRef]
- Dutta, S.; Bhaumik, A.; Wu, K.C.W. Hierarchically porous carbon derived from polymers and biomass: Effect of interconnected pores on energy applications. Energy Environ. Sci. 2014, 7, 3574–3592. [Google Scholar] [CrossRef]
- Wei, X.; Jiang, X.P.; Liu, X.; Zhou, W.M.; Garba, Z.N.; Lawan, L.; Wang, L.W.; Yuan, Z.H. Adsorption of organic dyes from wastewater by metal-doped porous carbon materials. J. Clean. Prod. 2021, 284, 124773. [Google Scholar] [CrossRef]
- Hayoun, B.; Escudero-Curiel, S.; Bourouina, M.; Bourouina-Bacha, S.; Sanromán, M.A.; Pazos, M. Preparation and characterization of high performance hydrochar for efficient adsorption of drugs mixture. J. Mol. Liq. 2022, 353, 118797. [Google Scholar] [CrossRef]
- Diaz, E.; Manzano, F.J.; Villamil, J.; Rodriguez, J.J.; Mohedano, A.F. Low-cost activated grape seed-derived hydrochar through hydrothermal carbonization and chemical activation for sulfamethoxazole adsorption. Appl. Sci. 2019, 9, 5127. [Google Scholar] [CrossRef]
- Diaz, E.; Sanchis, I.; Coronella, C.J.; Mohedano, A.F. Activated carbons from hydrothermal carbonization and chemical activation of olive stones: Application in sulfamethoxazole adsorption. Resources 2022, 11, 43. [Google Scholar] [CrossRef]
- Adebisi, G.A.; Chowdhury, Z.Z.; Abd Hamid, S.B.; Ali, E. Hydrothermally treated banana empty fruit bunch fiber activated carbon for Pb (II) and Zn (II) removal. BioResources 2016, 11, 9686–9709. [Google Scholar] [CrossRef]
- Shi, J.; Cui, H.; Xu, J.; Yan, N. Carbon spheres synthesized from KHCO3 activation of glucose derived hydrochar with excellent CO2 capture capabilities at both low and high pressures. Sep. Purif. Technol. 2022, 294, 121193. [Google Scholar] [CrossRef]
- Congsomjit, D.; Areeprasert, C. Hydrochar-derived activated carbon from sugar cane bagasse employing hydrothermal carbonization and steam activation for syrup decolorization. Biomass Convers. Biorefinery 2021, 11, 2569–2584. [Google Scholar] [CrossRef]
- Koprivica, M.; Simić, M.; Petrović, J.; Ercegović, M.; Dimitrijević, J. Evaluation of adsorption efficiency on Pb (II) ions removal using alkali-modified hydrochar from paulownia leaves. Processes 2023, 11, 1327. [Google Scholar] [CrossRef]
- Zhang, Y.; Wan, Y.; Zheng, Y.; Yang, Y.; Huang, J.; Chen, H.; Quan, G.; Gao, B. Potassium permanganate modification of hydrochar enhances sorption of Pb (II), Cu (II), and Cd (II). Bioresource Technol. 2023, 386, 129482. [Google Scholar] [CrossRef]
- Acharya, S. Lead between the lines. Nat. Chem. 2013, 5, 894. [Google Scholar] [CrossRef]
- Chowdhury, I.R.; Chowdhury, S.; Mazumder, M.A.J.; Al-Ahmed, A. Removal of lead ions (Pb2+) from water and wastewater: A review on the low-cost adsorbents. Appl. Water Sci. 2022, 12, 185. [Google Scholar] [CrossRef]
- Kumar, A.; Kumar, A.; Cabral-Pinto, M.M.S.; Chaturvedi, A.K.; Shabnam, A.A.; Subrahmanyam, G.; Mondal, R.; Gupta, D.K.; Malyan, S.K.; Kumar, S.S.; et al. Lead toxicity: Health hazards, influence on food chain, and sustainable remediation approaches. Int. J. Environ. Res. Public Health 2020, 17, 2179. [Google Scholar] [CrossRef]
- Rasmey, A.H.; Aboseidah, A.A.; Youssef, A.K. Application of Langmuir and Freundlich isotherm models on biosorption of Pb2+ by freeze-dried biomass of Pseudomonas aeruginosa. Egypt. J. Microbiol. 2018, 53, 37–48. [Google Scholar] [CrossRef]
- Nzediegwu, C.; Naeth, M.A.; Chang, S.X. Lead (II) adsorption on microwave-pyrolyzed biochars and hydrochars depends on feedstock type and production temperature. J. Hazard. Mater. 2021, 412, 125255. [Google Scholar] [CrossRef]
- Rasam, S.; Moraveji, M.K.; Soria-Verdugo, A.; Salimi, A. Synthesis, characterization and absorbability of Crocus sativus petals hydrothermal carbonized hydrochar and activated hydrochar. Chem. Eng. Process. Process Intensif. 2021, 159, 108236. [Google Scholar] [CrossRef]
- Petrović, J.T.; Stojanović, M.D.; Milojković, J.V.; Petrović, M.S.; Šoštarić, T.D.; Laušević, M.D.; Mihajlović, M.L. Alkali modified hydrochar of grape pomace as a perspective adsorbent of Pb2+ from aqueous solution. J. Environ. Manag. 2016, 182, 292–300. [Google Scholar] [CrossRef] [PubMed]
- Zhou, N.; Chen, H.; Feng, Q.; Yao, D.; Chen, H.; Wang, H.; Zhou, Z.; Li, H.; Tian, Y.; Lu, X. Effect of phosphoric acid on the surface properties and Pb (II) adsorption mechanisms of hydrochars prepared from fresh banana peels. J. Clean. Prod. 2017, 165, 221–230. [Google Scholar] [CrossRef]
- Ge, Q.; Tian, Q.; Wang, S.; Zhang, J.; Hou, R. Highly efficient removal of lead/cadmium by phosphoric acid-modified hydrochar prepared from fresh banana peels: Adsorption mechanisms and environmental application. Langmuir 2022, 38, 15394–15403. [Google Scholar] [CrossRef]
- Al-Awadi, A.S.; El-Harbawi, M.; Algarawi, A.; Alalawi, A.; Alrashed, M.M.; Yin, C.Y. Synthesis of carbon microspheres via hydrothermal carbonization of Sabal palms (Sabal palmetto) biomass for adsorption of methylene blue. Biomass Convers. Biorefin. 2022, 2022, 16943–16953. [Google Scholar] [CrossRef]
- El-Harbawi, M.; Alhawtali, S.; Al-Awadi, A.S.; El Blidi, L.; Alrashed, M.M.; Alzobidi, A.; Yin, C.Y. Synthesis of carbon microspheres from inedible crystallized date palm molasses: Influence of temperature and reaction time. Materials 2023, 16, 1672. [Google Scholar] [CrossRef]
- Alhawtali, S.; El-Harbawi, M.; Al-Awadi, A.S.; El Blidi, L.; Alrashed, M.M.; Yin, C.Y. Enhanced adsorption of methylene blue using phosphoric acid-activated hydrothermal carbon microspheres synthesized from a variety of palm-based biowastes. Coatings 2023, 13, 1287. [Google Scholar] [CrossRef]
- Romero-Anaya, A.J.; Lillo-Ro’denas, M.A.; Salinas-Martínez de Lecea, C.; Linares-Solano, A. Hydrothermal and conventional H3PO4 activation of two natural bio-fibers. Carbon 2012, 50, 3158–3169. [Google Scholar] [CrossRef]
- Romero-Anaya, A.J.; Ouzzine, M.; Lillo-Rodenas, M.A.; Linares-Solano, A. Spherical carbons: Synthesis, characterization and activation processes. Carbon 2014, 68, 296–307. [Google Scholar] [CrossRef]
- Rivera-Utrilla, J.; Bautista-Toledo, I.; Ferro-García, M.A.; Moreno-Castilla, C. Activated carbon surface modifications by adsorption of bacteria and their effect on aqueous lead adsorption. J. Chem. Technol. Biotechnol. 2001, 76, 1209–1215. [Google Scholar] [CrossRef]
- Órfão, J.J.M.; Silva, A.I.M.; Pereira, J.C.V.; Barata, S.A.; Fonseca, I.M.; Faria, P.C.C.; Pereira, M.F.R. Adsorption of a reactive dye on chemically modified activated carbons—Influence of pH. J. Colloid Interface Sci. 2006, 296, 480–489. [Google Scholar] [CrossRef]
- Baccile, N.; Weber, J.; Falco, C.; Titirici, M.M. Characterization of hydrothermal carbonization materials. In Sustainable Carbon Materials from Hydrothermal Processes; Titirici, M.-M., Ed.; John Wiley & Sons: Hoboken, NJ, USA, 2013; pp. 151–211. [Google Scholar] [CrossRef]
- Nasser, R.A.; Salem, M.Z.; Hiziroglu, S.; Al-Mefarrej, H.A.; Mohareb, A.S.; Alam, M.; Aref, I.M. Chemical analysis of different parts of date palm (Phoenix dactylifera L.) using ultimate, proximate and thermo-gravimetric techniques for energy production. Energies 2016, 9, 374. [Google Scholar] [CrossRef]
- Dong, X.; Guo, S.; Wang, H.; Wang, Z.; Gao, X. Physicochemical characteristics and FTIR-derived structural parameters of hydrochar produced by hydrothermal carbonisation of pea pod (Pisum sativum Linn.) waste. Biomass Convers. Biorefinery 2019, 9, 531–540. [Google Scholar] [CrossRef]
- Reza, M.T.; Wirth, B.; Lüder, U.; Werner, M. Behavior of selected hydrolyzed and dehydrated products during hydrothermal carbonization of biomass. Bioresource Technol. 2014, 169, 352–361. [Google Scholar] [CrossRef] [PubMed]
- Ameen, M.; Zamri, N.M.; May, S.T.; Azizan, M.T.; Aqsha, A.; Sabzoi, N.; Sher, F. Effect of acid catalysts on hydrothermal carbonization of Malaysian oil palm residues (leaves, fronds, and shells) for hydrochar production. Biomass Convers. Biorefinery 2022, 12, 103–114. [Google Scholar] [CrossRef]
- Sisuthog, W.; Attanatho, L.; Chaiya, C. Conversion of empty fruit bunches (EFBs) by hydrothermal carbonization towards hydrochar production. Energy Rep. 2022, 8, 242–248. [Google Scholar] [CrossRef]
- Garrido, J.A.; Härtl, A.; Kuch, S.; Stutzmann, M.; Williams, O.A.; Jackmann, R.B. pH sensors based on hydrogenated diamond surfaces. Appl. Phys. Lett. 2005, 86, 1866632. [Google Scholar] [CrossRef]
- Issabayeva, G.; Aroua, M.K.; Sulaiman, N.M.N. Removal of lead from aqueous solutions on palm shell activated carbon. Bioresour. Technol. 2006, 97, 2350–2355. [Google Scholar] [CrossRef]
- Mullet, M.; Fievet, P.; Szymczyk, A.; Foissy, A.; Reggiani, J.C.; Pagetti, J. A simple and accurate determination of the point of zero charge of ceramic membranes. Desalination 1999, 121, 41–48. [Google Scholar] [CrossRef]
- Saifuddin, M.N.; Kumaran, P. Removal of heavy metal from industrial wastewater using chitosan coated oil palm shell charcoal. Electron. J. Biotechnol. 2005, 8, 44–53. [Google Scholar]
- Tee, W.T.; Hiew, B.Y.Z.; Thangalazhy-Gopakumar, S.; Gan, S.; Lee, L.Y. Biochar as a remediation solution for pharmaceutical-contaminated wastewater. In BioChar: Applications for Bioremediation of Contaminated Systems; Walter de Gruyter: Berlin, Germany, 2022; p. 373. [Google Scholar]
- Lafi, R.; ben Fradj, A.; Hafiane, A.; Hameed, B.H. Coffee waste as potential adsorbent for the removal of basic dyes from aqueous solution. Korean J. Chem. Eng. 2014, 31, 2198–2206. [Google Scholar] [CrossRef]
- Langmuir, I. The constitution and fundamental properties of solids and liquids. Part I. Solids. J. Am. Chem. Soc. 1916, 38, 2221–2295. [Google Scholar] [CrossRef]
- Freundlich, H. Über die Adsorption in Lösungen [Adsorption in solution]. Z. Für Phys. Chem. J. Phys. Chem. 1907, 57, 385–470. [Google Scholar] [CrossRef]
- Fytianos, K.; Voudrias, E.; Kokkalis, E. Sorption-desorption behaviour of 2, 4-dichlorophenol by marine sediments. Chemosphere 2000, 40, 3–6. [Google Scholar] [CrossRef]
- Redlich, O.J.D.L.; Peterson, D.L. A useful adsorption isotherm. J. Phys. Chem. 1959, 63, 1024. [Google Scholar] [CrossRef]
- Temkin, M.I. Adsorption equilibrium and kinetics of processes on nonhomogeneous surfaces and at interaction between adsorbed molecules. Zhurnal Fiz. Khimii J. Phys. Chem. 1941, 15, 296–332. [Google Scholar]
- Demir-Cakan, R.; Baccile, N.; Antonietti, M.; Titirici, M.-M. Carboxylate-rich carbonaceous materials via one-step hydrothermal carbonization of glucose in the presence of acrylic acid. Chem. Mater. 2009, 21, 484–490. [Google Scholar] [CrossRef]
- Lagergren, S. Zur Theorie der Sogenannten Adsorption gelöster Stoffe [To the theory of the so-called adsorption of dissolved materials]. K. Sven. Vetenskapsakademiens Handl. 1898, 24, 1–39. [Google Scholar] [CrossRef]
- Gupta, V.K. and Suhas Application of Low-Cost Adsorbents for Dye Removal—A Review. J. Environ. Manag. 2009, 90, 2313–2342. [Google Scholar] [CrossRef]
- Ho, Y.S.; McKay, F.G. Kinetic models for the sorption of dye from aqueous solution by wood. Process Saf. Environ. Prot. 1998, 76, 183–191. [Google Scholar] [CrossRef]
- Zhang, X.; Zhao, J.; Cheng, L.; Lu, C.; Wang, Y.; He, X.; Zhang, W. Acrylic acid grafted and acrylic acid/sodium humate grafted bamboo cellulose nanofibers for Cu2+ adsorption. RSC Adv. 2014, 4, 55195–55201. [Google Scholar] [CrossRef]
- Hernández-Francisco, E.; Bonilla-Cruz, J.; Márquez-Lamas, U.; Suárez-Jacobo, Á.; Longoria-Rodríguez, F.; Rivera-Haro, J.; Russell, P.; Ali, Z.; Yin, C.Y.; Lara-Ceniceros, T.E. Entangled cellulose nanofibrils/nanosheets derived from native mexican agave for lead (II) ion removal. Cellulose 2020, 27, 8785–8798. [Google Scholar] [CrossRef]
- Niinipuu, M.; Latham, K.G.; Jansson, S. The influence of inorganic components and carbon-oxygen surface functionalities in activated hydrothermally carbonized waste materials for water treatment. Environ. Sci. Pollut. Res. 2020, 27, 38072–38083. [Google Scholar] [CrossRef]
- Ding, Z.; Zhang, L.; Mo, H.; Chen, Y.; Hu, X. Microwave-assisted catalytic hydrothermal carbonization of Laminaria japonica for hydrochars catalyzed and activated by potassium compounds. Bioresour. Technol. 2021, 341, 125835. [Google Scholar] [CrossRef]
- Xia, Y.; Yang, T.; Zhu, N.; Li, D.; Chen, Z.; Lang, Q.; Liu, Z.; Jiao, W. Enhanced adsorption of Pb (II) onto modified hydrochar: Modeling and mechanism analysis. Bioresour. Technol. 2019, 288, 121593. [Google Scholar] [CrossRef]
- Ahmad, S.; Zhu, X.; Luo, J.; Shen, M.; Zhou, S.; Zhang, S. Conversion of phosphorus and nitrogen in lincomycin residue during microwave-assisted hydrothermal liquefaction and its application for Pb2+ removal. Sci. Total Environ. 2019, 687, 1381–1388. [Google Scholar] [CrossRef]
- Ahmad, S.; Zhu, X.; Wang, Q.; Wei, X.; Zhang, S. Microwave-assisted hydrothermal treatment of soybean residue and chitosan: Characterization of hydrochars and role of N and P transformation for Pb (II) removal. J. Anal. Appl. Pyrolysis 2021, 160, 105330. [Google Scholar] [CrossRef]
- Jia, Y.; Zhang, Y.; Fu, J.; Yuan, L.; Li, Z.; Liu, C.; Zhao, D.; Wang, X. A novel magnetic biochar/MgFe-layered double hydroxides composite removing Pb2+ from aqueous solution: Isotherms, kinetics and thermodynamics. Colloids Surf. A Physicochem. Eng. Asp. 2019, 567, 278–287. [Google Scholar] [CrossRef]
- Guo, S.; Gao, Y.; Wang, Y.; Liu, Z.; Wei, X.; Peng, P.; Xiao, B.; Yang, Y. Urea/ZnCl2 in situ hydrothermal carbonization of Camellia sinensis waste to prepare N-doped biochar for heavy metal removal. Environ. Sci. Pollut. Res. 2019, 26, 30365–30373. [Google Scholar] [CrossRef]
- Guo, S.; Wang, Y.; Wei, X.; Gao, Y.; Xiao, B.; Yang, Y. Structural analysis and heavy metal adsorption of N-doped biochar from hydrothermal carbonization of Camellia sinensis waste. Environ. Sci. Pollut. Res. 2020, 27, 18866–18874. [Google Scholar] [CrossRef]
- Chen, Y.; Xu, F.; Li, H.; Li, Y.; Liu, Y.; Chen, Y.; Li, M.; Li, L.; Jiang, H.; Chen, L. Simple hydrothermal synthesis of magnetic MnFe2O4-sludge biochar composites for removal of aqueous Pb2+. J. Anal. Appl. Pyrolysis 2021, 156, 105173. [Google Scholar] [CrossRef]
- Luo, X.; Huang, Z.; Lin, J.; Li, X.; Qiu, J.; Liu, J.; Mao, X. Hydrothermal carbonization of sewage sludge and in-situ preparation of hydrochar/MgAl-layered double hydroxides composites for adsorption of Pb (II). J. Clean. Prod. 2020, 258, 120991. [Google Scholar] [CrossRef]
- Liu, D.; Tang, Y.; Li, J.; Hao, Z.; Zhu, J.; Wei, J.; Liu, C.; Dong, L.; Jia, B.; Chen, G. Eupatorium adenophorum derived adsorbent by hydrothermal-assisted HNO3 modification and application to Pb2+ adsorption. J. Environ. Chem. Eng. 2021, 9, 105972. [Google Scholar] [CrossRef]
- Wang, B.; Yu, J.; Liao, H.; Zhu, W.; Ding, P.; Zhou, J. Adsorption of lead (II) from aqueous solution with high efficiency by hydrothermal biochar derived from honey. Int. J. Environ. Res. Public Health 2020, 17, 3441. [Google Scholar] [CrossRef]
- Yang, W.; Wang, Z.; Song, S.; Han, J.; Chen, H.; Wang, X.; Sun, R.; Cheng, J. Adsorption of copper (II) and lead (II) from seawater using hydrothermal biochar derived from Enteromorpha. Mar. Pollut. Bull. 2019, 149, 110586. [Google Scholar] [CrossRef]
- Ramesh, S.; Sundararaju, P.; Banu, K.S.P.; Karthikeyan, S.; Doraiswamy, U.; Soundarapandian, K. Hydrothermal carbonization of arecanut husk biomass: Fuel properties and sorption of metals. Environ. Sci. Pollut. Res. 2019, 26, 3751–3761. [Google Scholar] [CrossRef]
- Chowdhury, Z.Z.; Krishnan, B.; Sagadevan, S.; Rafique, R.F.; Hamizi, N.A.B.; Abdul Wahab, Y.; Khan, A.A.; Johan, R.B.; Al-Douri, Y.; Kazi, S.N.; et al. Effect of temperature on the physical, electro-chemical and adsorption properties of carbon micro-spheres using hydrothermal carbonization process. Nanomaterials 2018, 8, 597. [Google Scholar] [CrossRef]
- Hammud, H.H.; Karnati, R.K.; Al Shafee, M.; Fawaz, Y.; Holail, H. Activated hydrochar from palm leaves as efficient lead adsorbent. Chem. Eng. Commun. 2021, 208, 197–209. [Google Scholar] [CrossRef]


| Sample | BET Surface Area (m2·g−1) | Pore Volume (mL·g−1) | Pore Size (nm) |
|---|---|---|---|
| UAL | 2.21 | 0.0086 | 18.04 |
| L-Cal | 268.71 | 0.119 | 8.46 |
| AL | 808 | 0.156 | 3.33 |
| Sample | Chemical Composition | O/C (Atomic) | H/C (Atomic) | ||||
|---|---|---|---|---|---|---|---|
| C (wt%) | H (wt%) | N (wt%) | S (wt%) | O (wt%) | |||
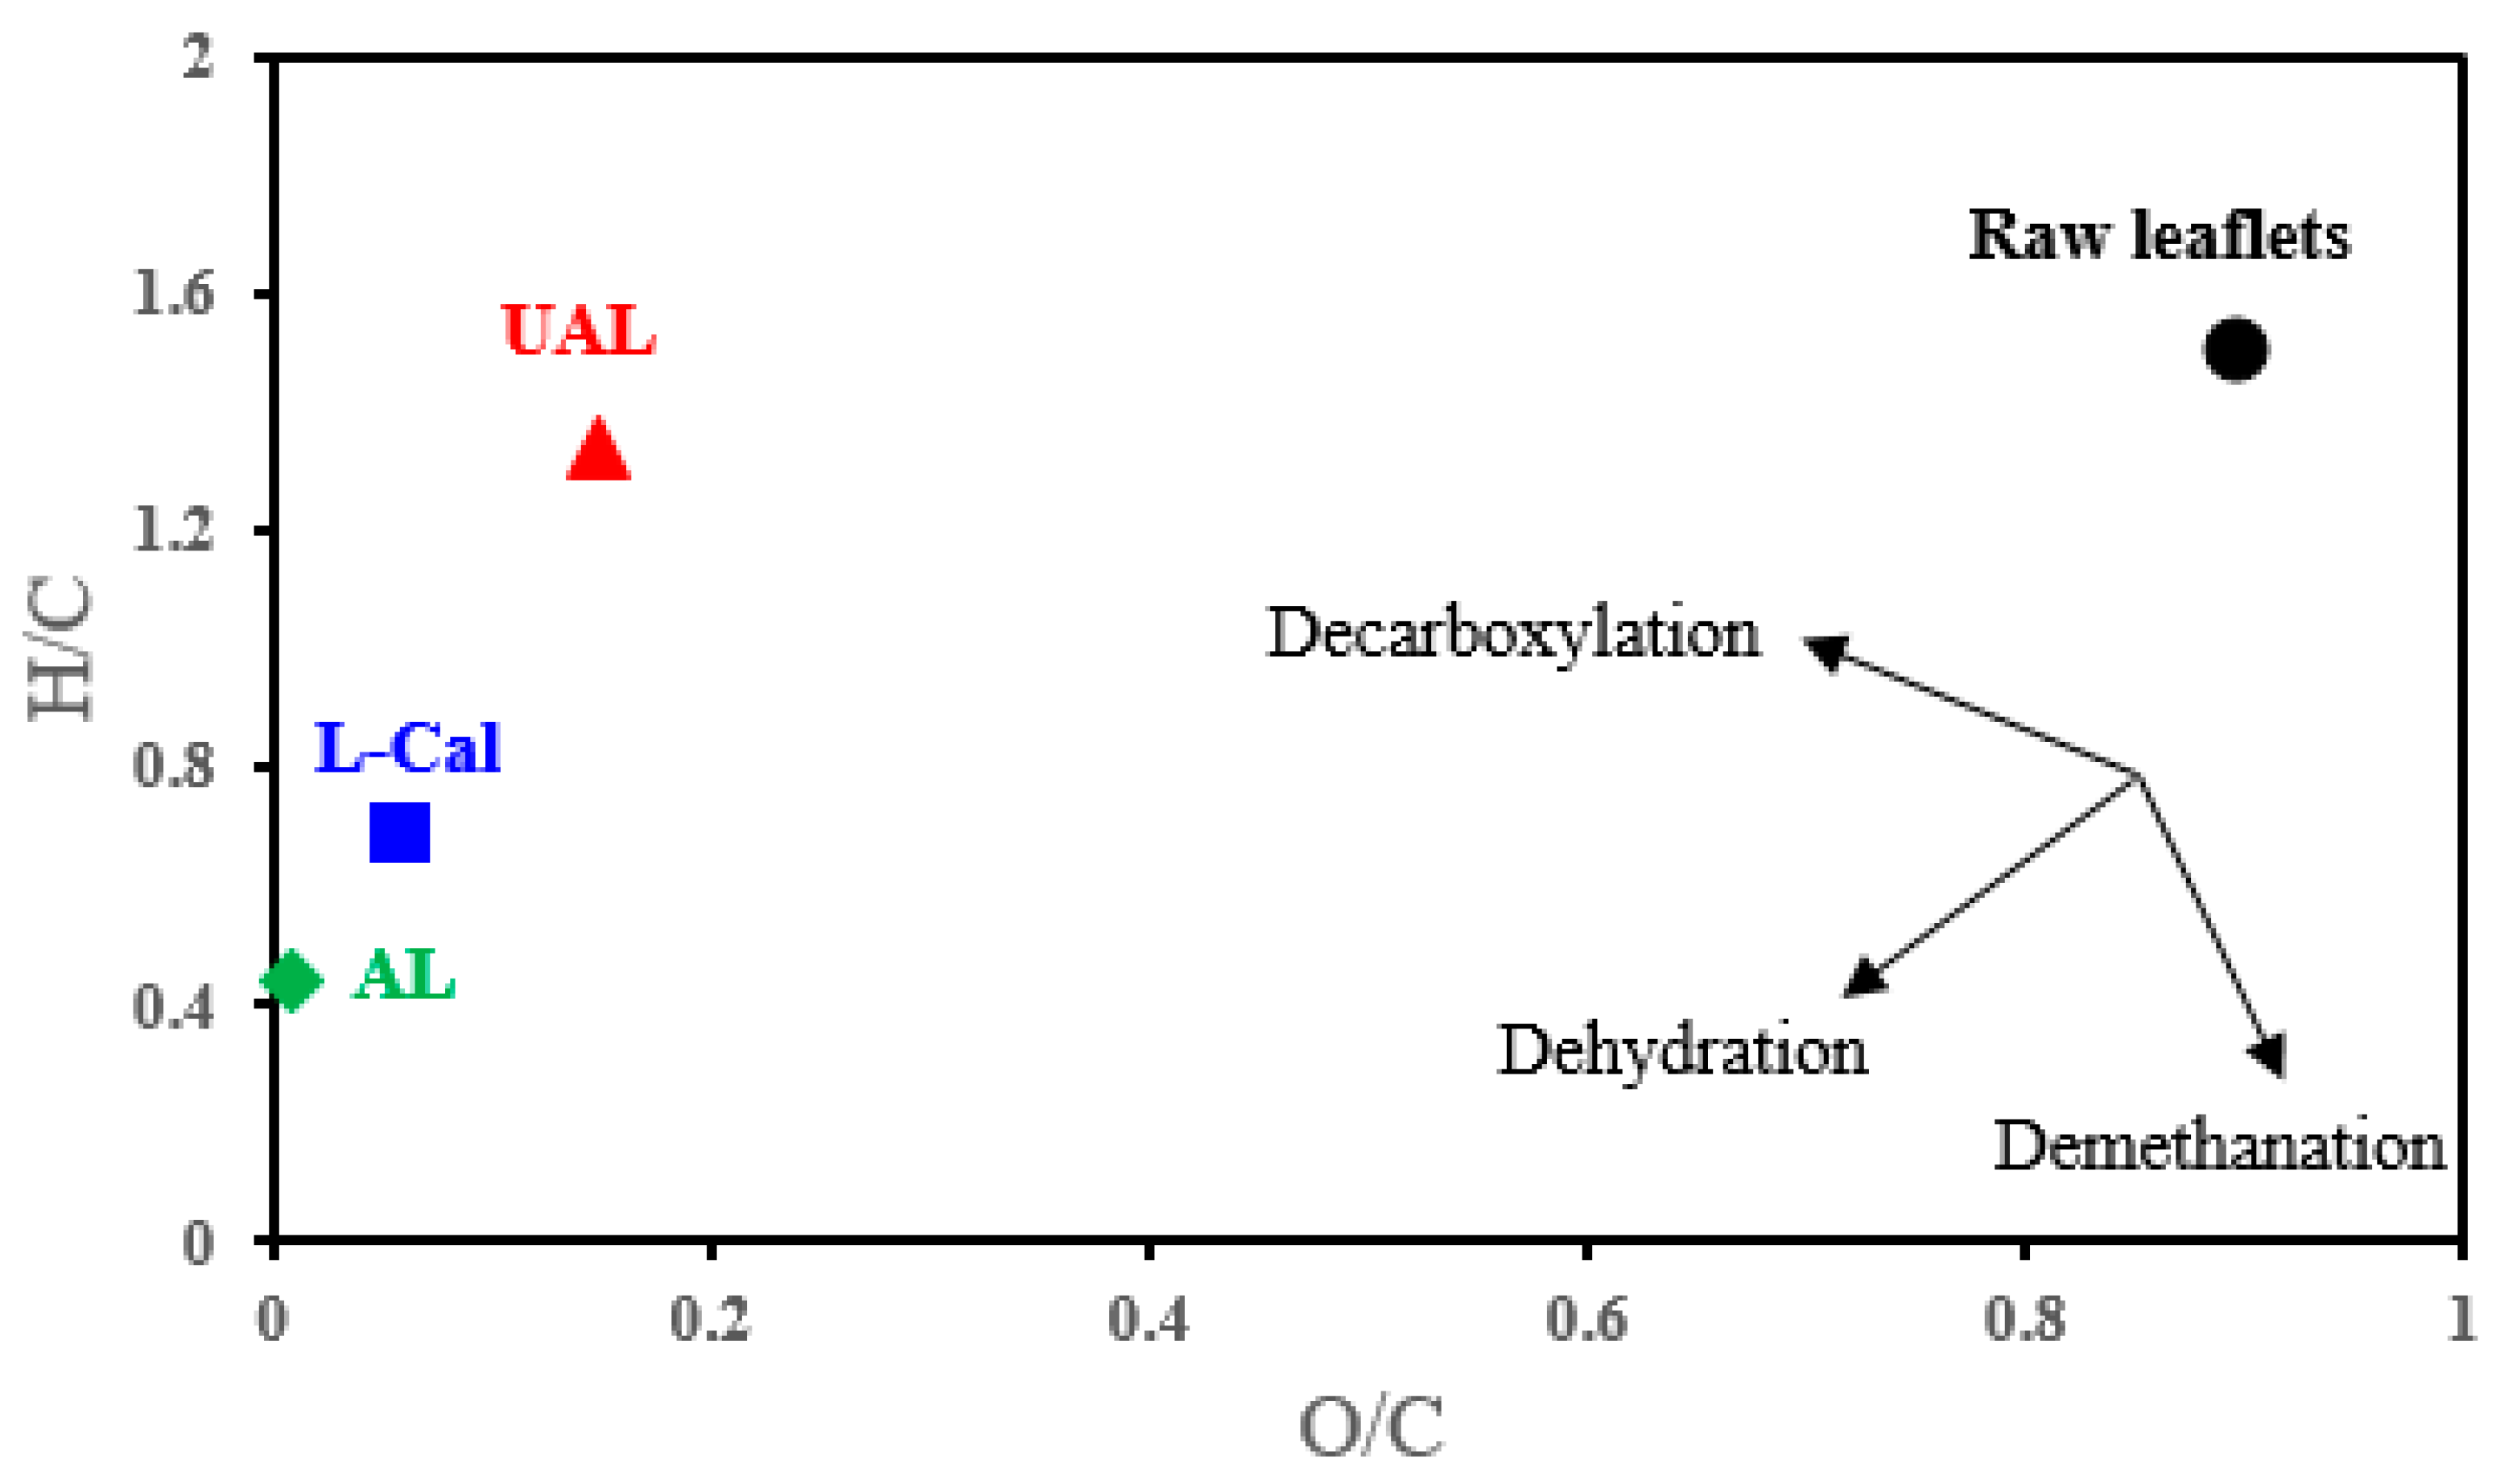
| Raw * | 46.50 | 5.69 | 0.66 | - | 47.15 | 0.90 | 1.50 |
| UAL | 58.99 ± 0.53 | 6.58 ± 0.13 | 21.65 ± 0.24 | 0.92 ± 0.007 | 11.86 ± 0.13 | 0.15 | 1.34 |
| AL | 70.12 ± 0.63 | 2.57 ± 0.05 | 25.35 ± 0.27 | 0.72 ± 0.006 | 1.24 ± 0.01 | 0.01 | 0.44 |
| L-Cal | 65.36 ± 0.74 | 3.74 ± 0.09 | 24.52 ± 0.31 | 0.78 ± 0.006 | 5.60 ± 0.08 | 0.06 | 0.69 |
| CM Samples | Langmuir Constants | Freundlich Constants | ||||
|---|---|---|---|---|---|---|
| Qmax (mg·g−1) | KL (L·mg−1) | R2 | 1/n | KF (mg1−1/n·L1/n·g−1) | R2 | |
| AL | 142.86 | 0.051 | 0.999 | 0.22 | 39.99 | 0.931 |
| Redlich–Peterson Constants | Temkin Constants | |||||
| B | A | R2 | B | A | R2 | |
| AL | 0.781 | 39.99 | 0.994 | 21.613 | 1.852 | 0.948 |
| Kinetics Model | Slope | Intercept | qtheo. | K | R2 |
|---|---|---|---|---|---|
| Pseudo-first-order | −0.04 | 4.18 | 65.11 | 0.4 | 0.978 |
| Pseudo-second-order | 0.008 | 0.028 | 130.21 | 0.002 | 0.999 |
Disclaimer/Publisher’s Note: The statements, opinions and data contained in all publications are solely those of the individual author(s) and contributor(s) and not of MDPI and/or the editor(s). MDPI and/or the editor(s) disclaim responsibility for any injury to people or property resulting from any ideas, methods, instructions or products referred to in the content. |
© 2024 by the authors. Licensee MDPI, Basel, Switzerland. This article is an open access article distributed under the terms and conditions of the Creative Commons Attribution (CC BY) license (https://creativecommons.org/licenses/by/4.0/).
Share and Cite
Alhawtali, S.; El-Harbawi, M.; El Blidi, L.; Alrashed, M.M.; Alzobidi, A.; Yin, C.-Y. Date Palm Leaflet-Derived Carbon Microspheres Activated Using Phosphoric Acid for Efficient Lead (II) Adsorption. C 2024, 10, 26. https://doi.org/10.3390/c10010026
Alhawtali S, El-Harbawi M, El Blidi L, Alrashed MM, Alzobidi A, Yin C-Y. Date Palm Leaflet-Derived Carbon Microspheres Activated Using Phosphoric Acid for Efficient Lead (II) Adsorption. C. 2024; 10(1):26. https://doi.org/10.3390/c10010026
Chicago/Turabian StyleAlhawtali, Saeed, Mohanad El-Harbawi, Lahssen El Blidi, Maher M. Alrashed, Abdulrahman Alzobidi, and Chun-Yang Yin. 2024. "Date Palm Leaflet-Derived Carbon Microspheres Activated Using Phosphoric Acid for Efficient Lead (II) Adsorption" C 10, no. 1: 26. https://doi.org/10.3390/c10010026
APA StyleAlhawtali, S., El-Harbawi, M., El Blidi, L., Alrashed, M. M., Alzobidi, A., & Yin, C.-Y. (2024). Date Palm Leaflet-Derived Carbon Microspheres Activated Using Phosphoric Acid for Efficient Lead (II) Adsorption. C, 10(1), 26. https://doi.org/10.3390/c10010026