Article

Thermodynamic Stability and Electronic Properties of Graphene Nanoflakes

Istituto di Scienze e Tecnologie Chimiche “Giulio Natta” (SCITEC), Consiglio Nazionale delle Ricerche (CNR), Via Golgi 19, I-20133 Milano, Italy
*
Authors to whom correspondence should be addressed.
Submission received: 15 November 2023 / Revised: 13 December 2023 / Accepted: 19 December 2023 / Published: 3 January 2024

Abstract

:
We conducted a large set of ab initio density functional theory computations to model a variety of hammer-terminated graphene nanoflakes—finite counterparts of armchair graphene nanoribbons. We focused on the relationships among the length and width of the nanoflakes, the stoichiometry and the conformation of the hydrogen saturation of the caps, and the resulting electronic structure. The energetics and the thermodynamic stability of the nanoflakes were investigated as well. Based on this study, we provide a recipe for determining the most stable saturation of the dangling bonds at the caps, which is generally disregarded in theoretical studies, and we prove that this step is crucial for a reliable description of the electronic structure of these systems. Data analysis proved that flakes far from the most stable C–H pattern exhibited electronic properties that were typical of an unsaturated bonding structure. Based on thermodynamics, we also proved that, for any given flake, there was a well-defined hydrogen content and a conformation of H atoms at the caps, which were favored across a wide range of environmental conditions.

1. Introduction

Graphene nanoribbons (GNRs)—characterized by a finite width n and an infinite length—have attracted much attention in recent decades due to their unique electronic properties, which range from metallic to semiconducting behavior, depending on their width [1,2,3]. GNRs show distinct electronic properties when compared with two-dimensional graphene, and they can be classified as armchair, zigzag, and chevron graphene nanoribbons based on the possible edge geometries. The edge morphology and its functionalization have been shown to have a great impact on the optical, electronic, and magnetic properties of these systems, as extensively discussed by several authors [4,5].
Rectangular graphene nanoflakes (GNFs) are the finite counterpart of infinite GNRs. They are characterized by a finite length m in addition to the finite width n, and they also vary in their patterns of atomistic termination at the caps (hammer, pencil, and cutter, among other possibilities—see Figure 1). In this study, we focused on the properties of hammer-terminated GNFs cut from armchair GNRs.
In recent years, the bottom-up approach to the chemical synthesis of GNFs, which makes use of chemical vapor deposition and ultra-high-vacuum methods through the polymerization and graphitization of monomers on a metal surface, has asserted itself as a precise synthetic route for obtaining GNFs of a desired shape and size [6,7,8,9]. The main advantage of this approach is that the structure of the molecular precursor strictly determines the C–C network of the resulting flake, which is a fundamental achievement. Indeed, experimental control over the atomistic structure of the flake, complemented by knowledge of the corresponding energetics and thermodynamic stability, is crucial when performing experiments relevant to technological applications at the nanoscale level [10,11].
Despite the relevance of the atomistic structure in these systems, in the large majority of theoretical investigations of GNFs, the stoichiometry of the CH n terminations ( n = 1 , 2, 3) at the caps and at the edges is de facto disregarded. Typically, all dangling bonds arising from the truncation of the infinite graphene network are saturated with a 1:1 carbon-to-hydrogen ratio. This has been proven to be neither the lowest-energy structure nor the most stable one as far as thermodynamics is concerned [12].
The main purpose of this study is to show that this approach fails to reliably mimic the electronic properties of GNFs. Based on a large variety of ab initio computations, we provide a recipe for the most stable saturation of caps in the case of hammer GNFs obtained through the truncation of armchair graphene ribbons (AGNRs). From the ongoing discussion, it will clearly emerge that this is a fundamental prerequisite for theoretical calculations to resemble and rationalize experimental data.
This study is organized as follows: The theoretical approach is detailed in Section 2. The data obtained for graphene, nanoribbons, and nanoflakes are discussed in Section 3. A summarized generalization of the main concepts is reported in Section 4, along with future perspectives on this topic.

2. Methods

First-principle calculations were performed within the framework of the pseudopotential, spin-polarized density functional theory (DFT), as implemented in the periodic SIESTA code [13]. We adopted the gradient-corrected exchange–correlation functional devised by Perdew, Burke, and Ernzerhof (PBE) [14] to describe the exchange and correlation effects. The Kohn–Sham orbitals for valence electrons (1s for H and 2 s 2 2 p 2 for C) were represented as linear combinations of numerical, atom-centered basis functions with the double- ζ -plus-polarization (DZP) quality, whereas core electrons were replaced with norm-conserving Troullier–Martins pseudopotentials [15], including nonlinear core corrections. The replica units of the systems under investigation—one- or two-dimensional—were separated via a large vacuum space of about 10 Å to avoid artificial interactions between periodic images. The cutoff for the real-space integrations amounted to 200 Ry. On the GNRs, we performed structural optimizations by relaxing the positions of all atoms until the forces were smaller than 0.04 eV/Å. Conversely, in the GNFs, we only relaxed the positions of the hydrogens, adopting the same threshold as that for nanoribbons, while the C–C network was a rigid truncation of an infinite graphene sheet.
We also investigated the dependence of our results on the choices of the exchange–correlation functional and of the basis set. We found that (i) the DZP basis adopted in this study performed similarly to the larger triple- ζ polarized one, and (ii) hybrid functionals such as B3LYP or M06 provided larger HOMO–LUMO gaps than the PBE functional did, and they were in better agreement with the experimental data. However, our choice was much less computationally demanding, and it still provided fully reliable trends in the estimation of the total energy differences among GNFs, which was the main target of the present study.
As stated above, the data presented in this study refer to flakes with C–C networks obtained through the rigid truncation of graphene, while the position of saturating hydrogens was optimized in all systems. An extensive series of tests strongly suggested that neglecting C–C relaxation does not alter the substance of the ongoing discussion. Geometry optimization results in an almost rigid shift in all the flakes’ energies, thus keeping intact the validity of all conclusions drawn in the next sections.
In the analysis of the energetics of GNRs and GNFs, the formation energies are obtained as follows:
E form = E A B ( E A + E B ) ,
where A B represents the interacting system, while A and B are the separated constituents.
In this study, we focused on linear nanoflakes with a T-shaped hammer termination, AGNF(n,m), derived from the truncation of armchair nanoribbons AGNR(n). The bonding pattern of carbon atoms is determined by using the width n and the length m, which are defined as follows: n represents the number of longitudinal rows of carbon atoms, while m is the number of C–C pairs along the armchair edges. We considered a large variety of widths, ranging from n = 4 to 32. The dependence of the electronic properties on the length m was considered as well, and this is discussed throughout the text. When n is odd, the zigzag caps of AGNF(n,m) are symmetric with respect to the longitudinal axis. On the contrary, the truncation of AGNR(n) with even values of n generates two pairs of different corners between the edges and caps, including two pending exocyclic carbon atoms (see Figure 1). The optimal termination for these systems is obtained by removing the exocyclic carbon atoms and saturating the smoothed corner with a single hydrogen atom.
The thermodynamic stability of different saturation patterns of AGNFs was evaluated by using the Gibbs free energy. Since we focus on the relative stability of flakes with different saturation stoichiometries, the reference energy terms adopted for a given AGNF(n,m) are the following: gas-phase molecular H 2 and a flake with width n, length m, and a 1:1 saturation between carbon and hydrogen at the caps—from now on, this is labeled as E flake 0 . Within this choice, the formation energy of a given flake AGNF(n,m) reads as
E form = E flake E flake 0 1 / 2 N H E H 2 ,
where E flake , E flake 0 , and E H 2 are the total energies, while N H is the number of excess hydrogen atoms with respect to the 1:1 carbon-to-hydrogen stoichiometry, i.e., N H is the number of CH 2 groups at the caps. The Gibbs free energy is, therefore, expressed as follows:
G = E form 1 / 2 N H μ H 2 ,
where the chemical potential of molecular hydrogen, μ H 2 , is evaluated as follows:
μ H 2 = H o ( T ) H o ( 0 ) T S o ( T ) + k B T ln ( p / p o ) .
Here, H o and S o are the enthalpy and the entropy of molecular hydrogen at the operating temperature T, p is the partial pressure of H 2 , and p o is the standard-state pressure, i.e., 0.1 MPa. The values of S o ( T ) and H o ( T ) H o ( 0 ) at p o were taken from the NIST-JANAF thermochemical tables [16]. According to this formulation, each saturation pattern of a given flake is likely to present a definite ( T , p ) range of stability, as is evidenced in the coming discussion.

3. Results

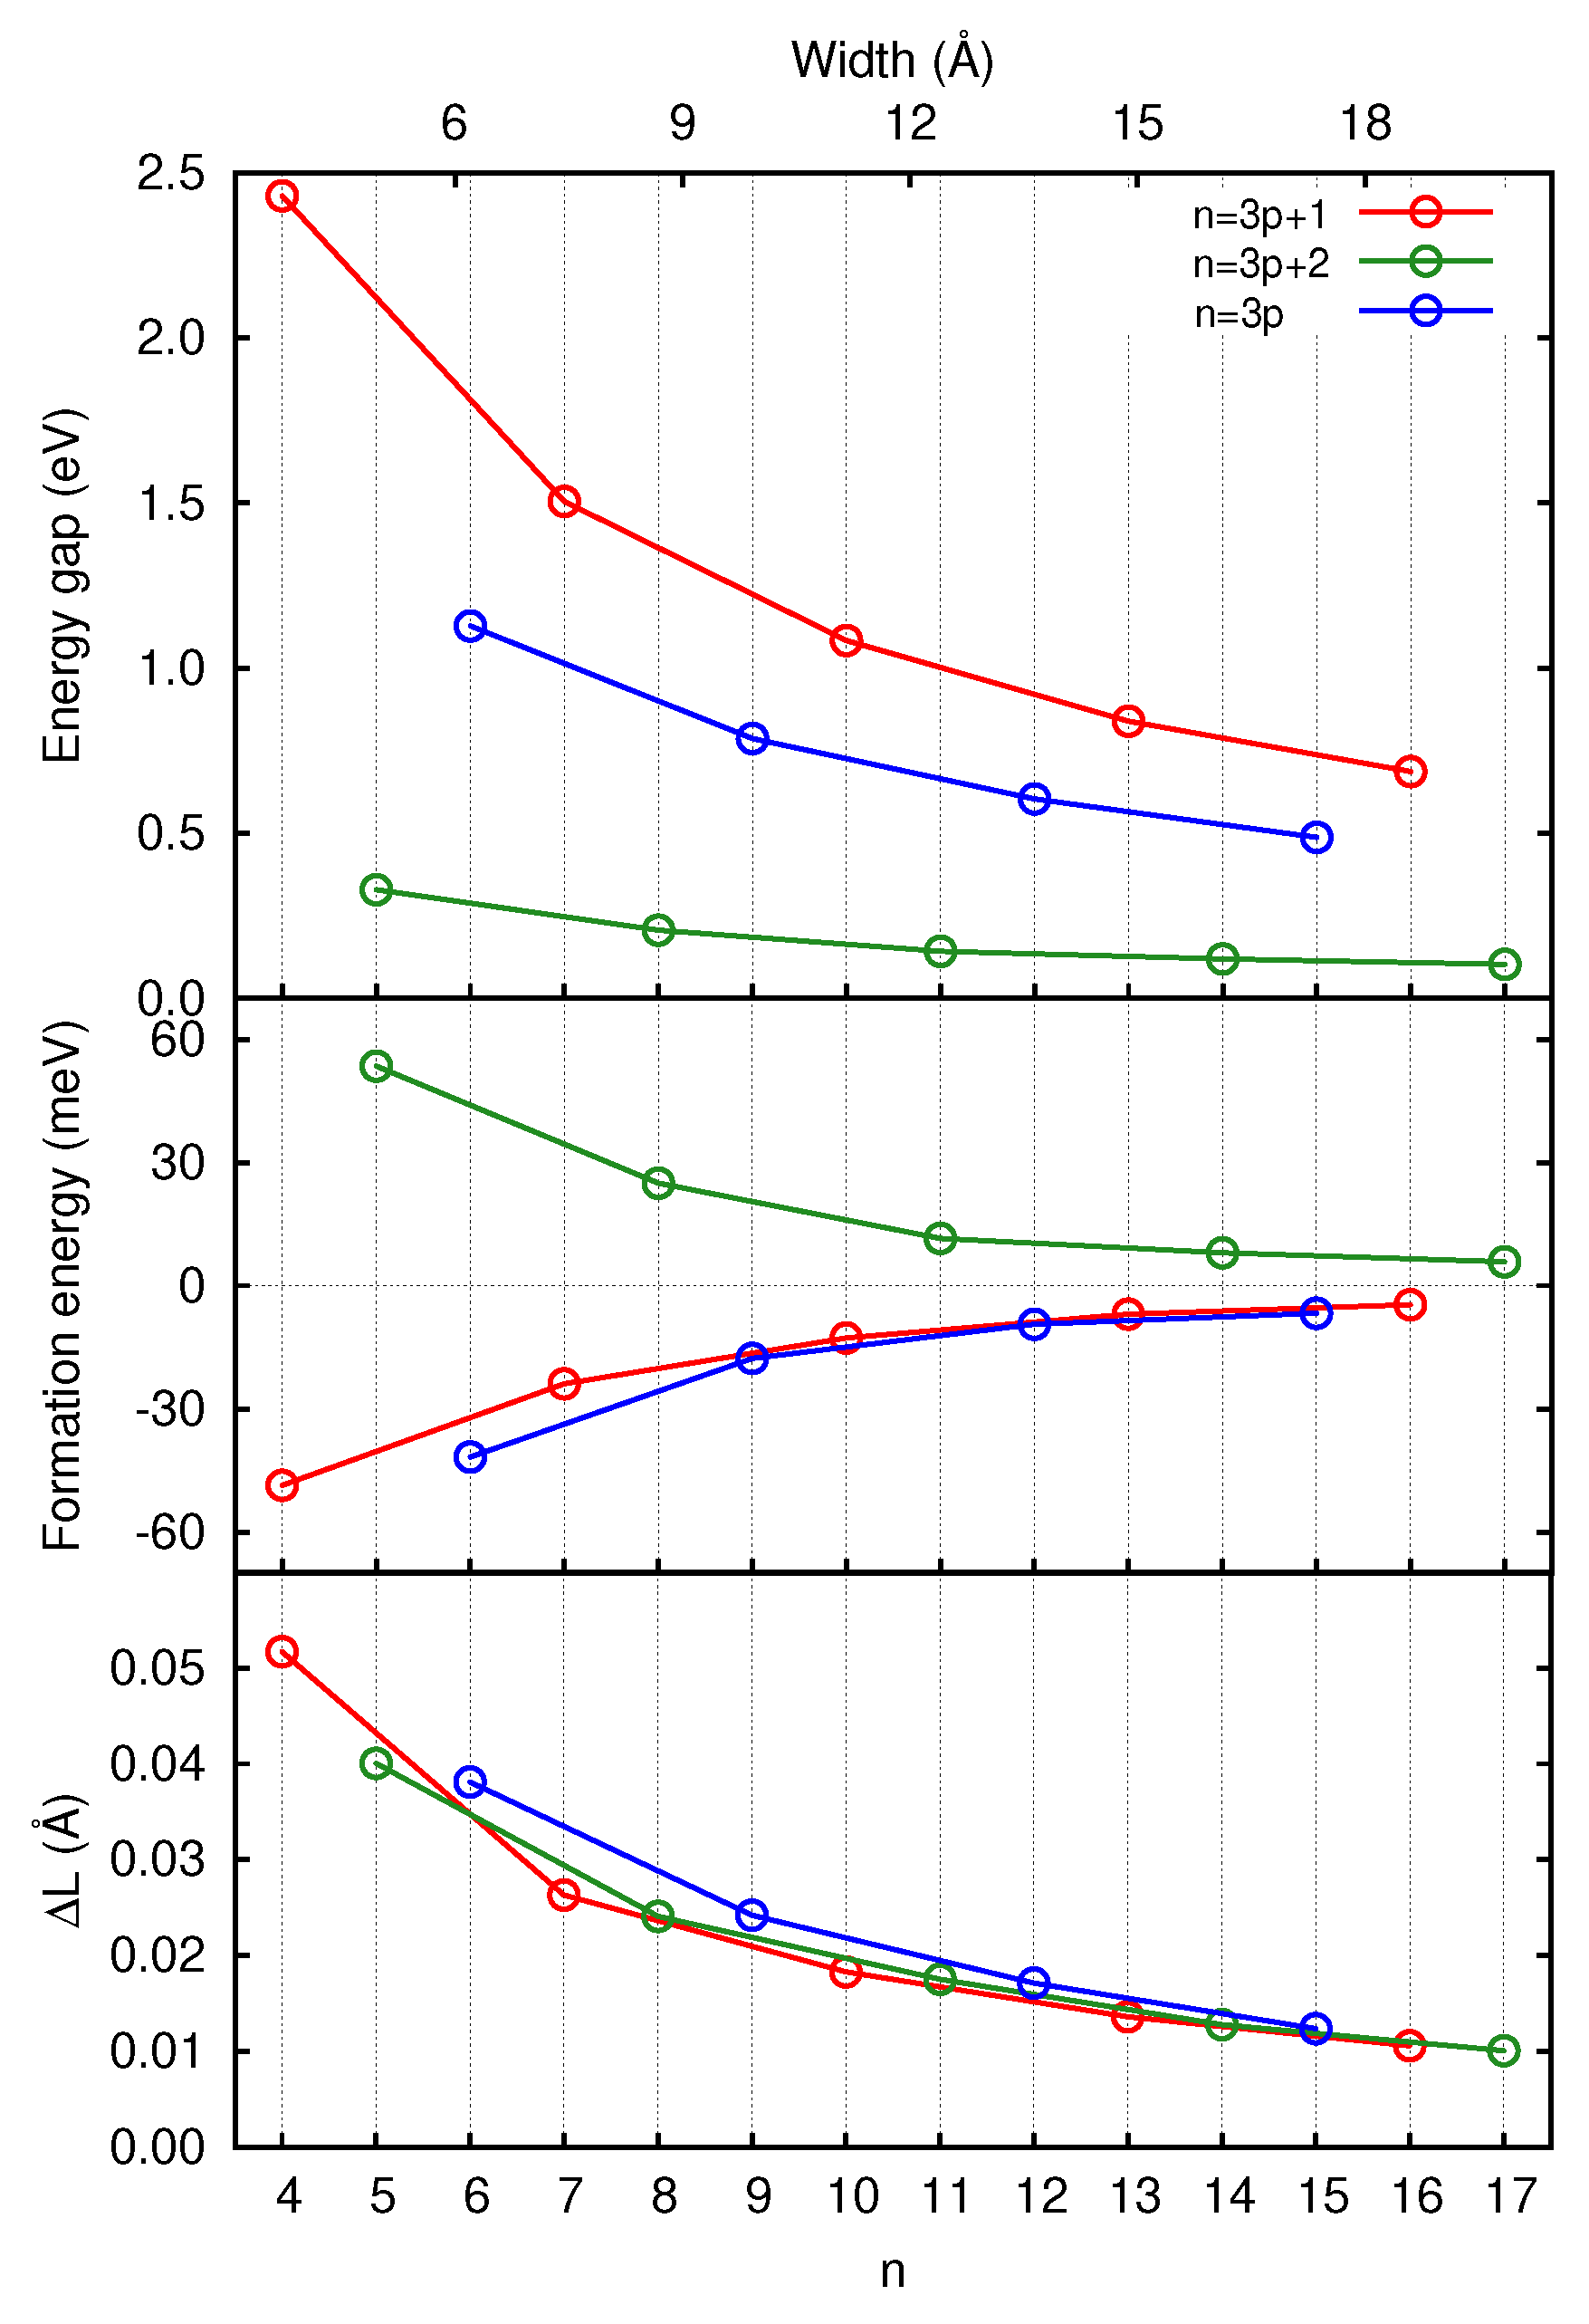
3.1. Graphene and Infinite Ribbons

Within the selected computational setup, the lattice parameter of graphene resulted in a = 2.48 Å, with an internuclear C–Ci distance of 1.43 Å ( a 3 / 3 ). This outcome compares well with the experimental value of the in-plane lattice constant of graphite, a = 2.46 Å (C–C bond distance equal to 1.42 Å [17,18]). The cohesion energy measured 7.6 eV per carbon atom, which was in agreement with previous theoretical results [19,20,21,22]. As concerns the H 2 molecule, we found a binding energy of 4.46 eV, which was obtained at the equilibrium internuclear distance of 0.778 Å. A previous theoretical estimate of these values conducted with a comparable approach predicted 4.58 eV at 0.750 Å [21,23], while the corresponding experimental data were 4.75 eV and 0.741 Å [24].
When considering infinite nanoribbons, we focused on specimens with armchair edges (AGNRs), as, in most applications for the realization of nanodevices [25,26,27,28], bottom-up synthesis produces nanoflakes with this bonding pattern [29,30,31,32,33,34,35]. Furthermore, the stability of the armchair edges of AGNRs upon varying hydrogen saturation is very simple and well-established [12]. In more detail, a single hydrogen on every carbon atom of the edge is sufficient to avoid the appearance of spin polarization in the ground-state wavefunctions, as well as metallicity, while preserving aromaticity.
The trend of the energy band gaps E g as a function of nanoribbon width n (reported in Figure 2) agreed very well with previous results [20,36,37]. In the figure, the existence of three families of infinite armchair ribbons characterized by their width n is clearly shown. Comparing the n = 3 p , n = 3 p + 1 , and n = 3 p + 2 series of data (where p is an integer), the well-known relation E g 3 p + 1 > E g 3 p > E g 3 p + 2 in the trend of the gaps is recovered.
This threefold behavior also manifests itself in the formation energy per unit cell with varying values of n (in this case, E form = E ribbon n E graphene 2 E H 2 , where E graphene is the energy of graphene per unit cell and E ribbon refers to the unit cell of AGNR(n), which consists of 2 n carbon atoms plus 4 hydrogens), as can be easily seen in the middle panel of Figure 2, and the same holds for the equilibrium lattice constant along the axis of the ribbon (bottom panel of Figure 2), among other properties. The optimized lattice constants reveal that all AGNRs(n) are stretched with respect to graphene and, as expected, this stress is reduced as n increases. Remarkably, the formation of AGNRs belonging to the n = 3 p + 2 class is unfavorable when referring to the graphene plus H 2 systems, while the n = 3 p and n = 3 p + 1 ribbons behave in the opposite way. The above features, which are well-known in the literature, confirm that our computational setup is appropriate for studying both AGNRs and AGNFs.

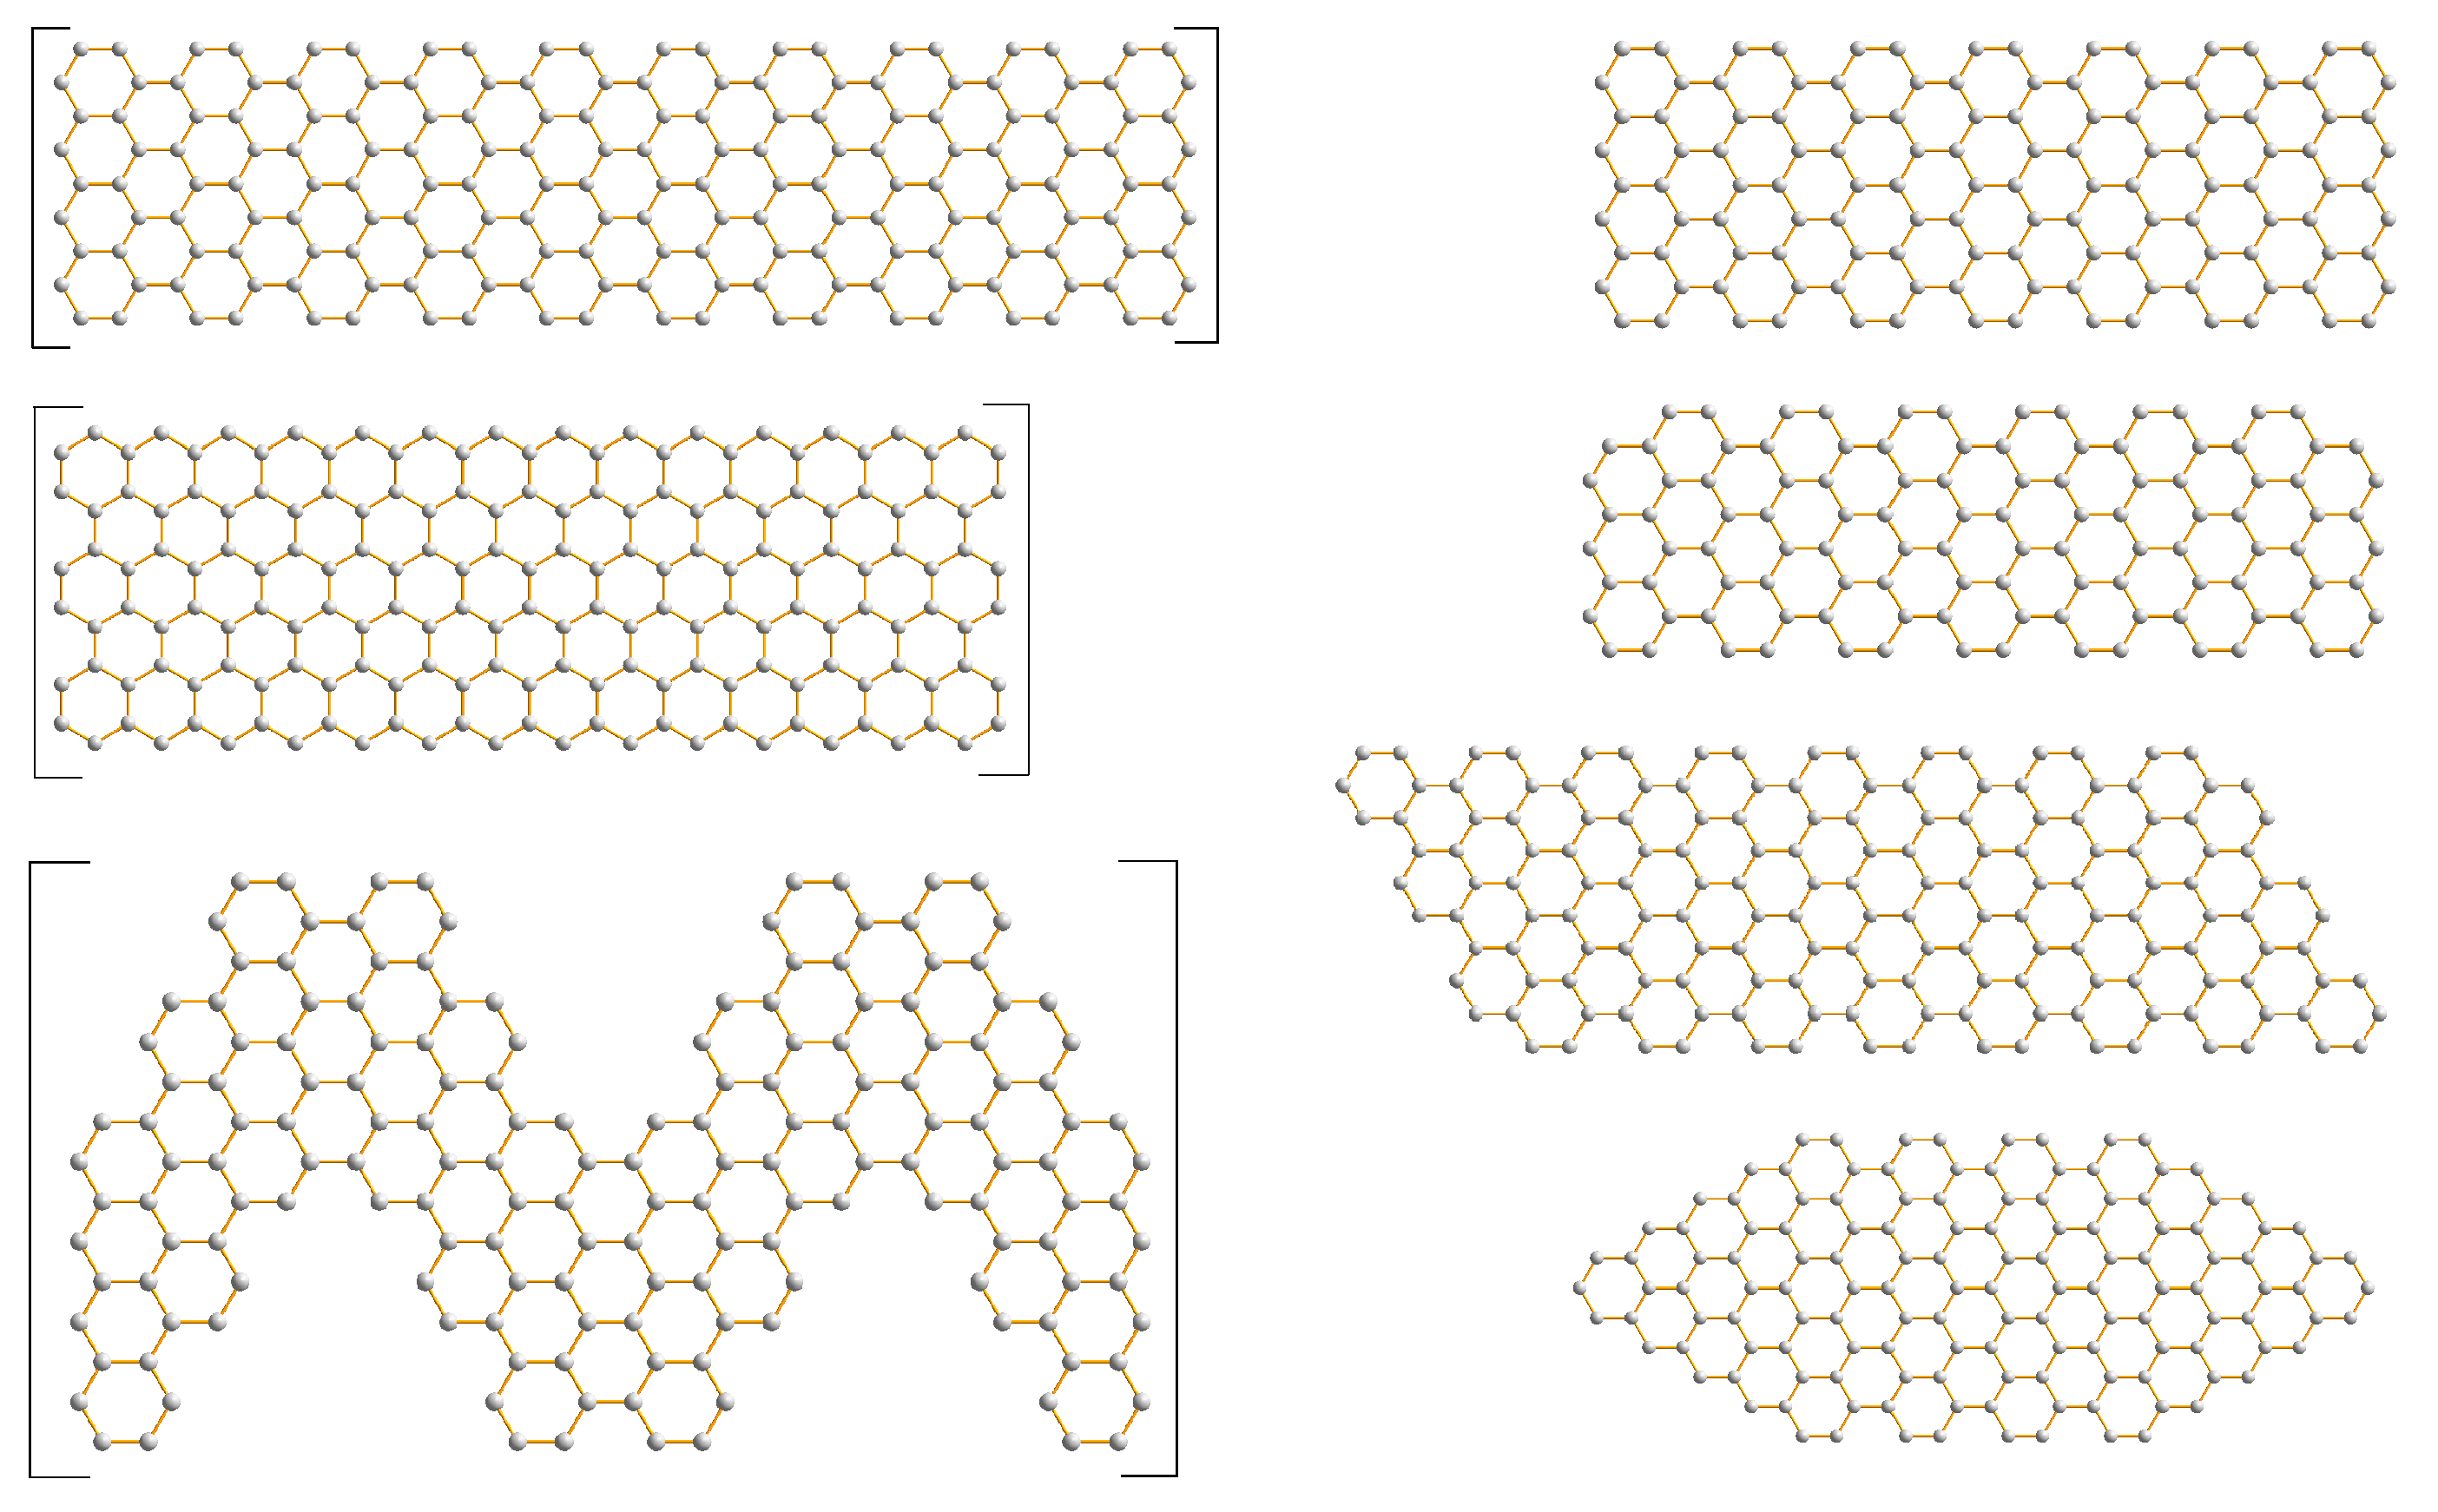
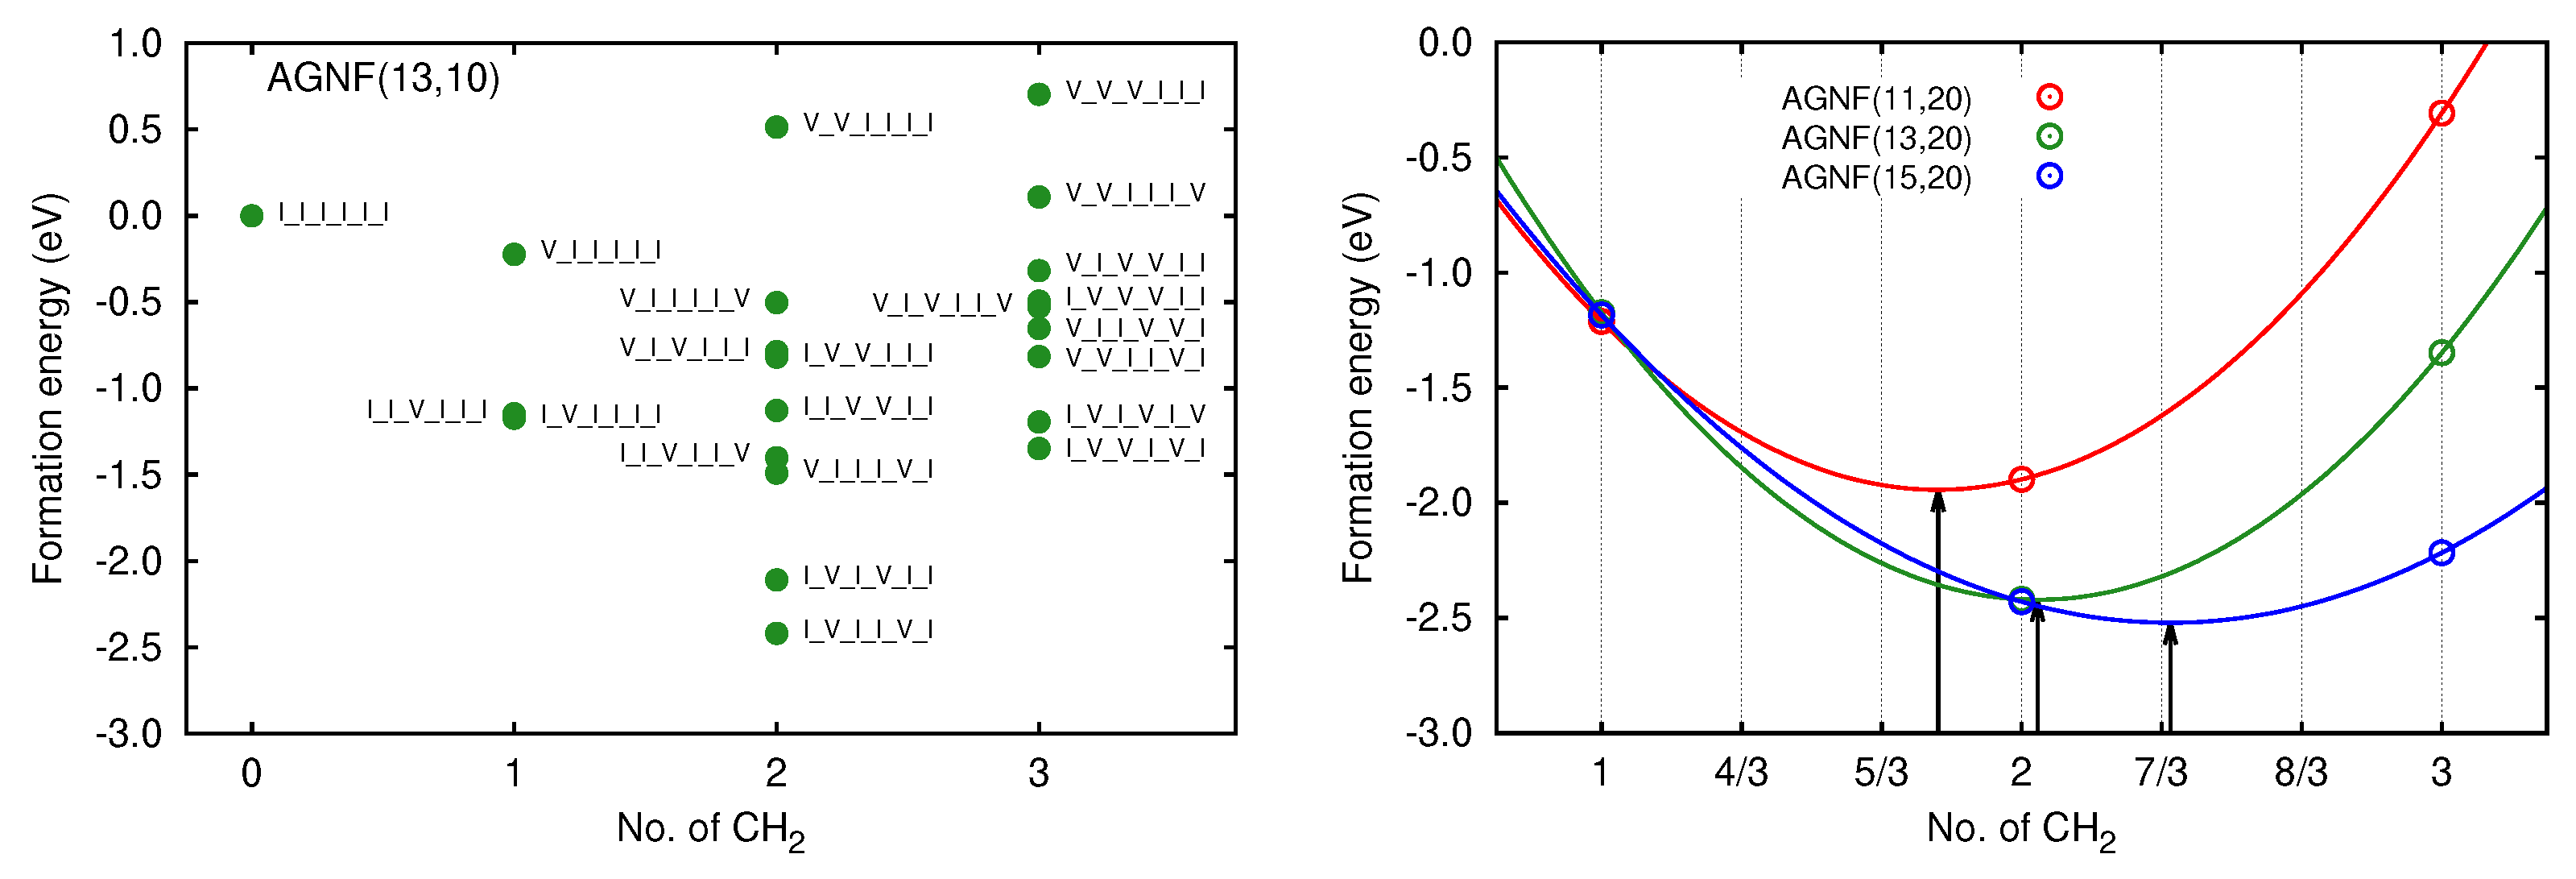
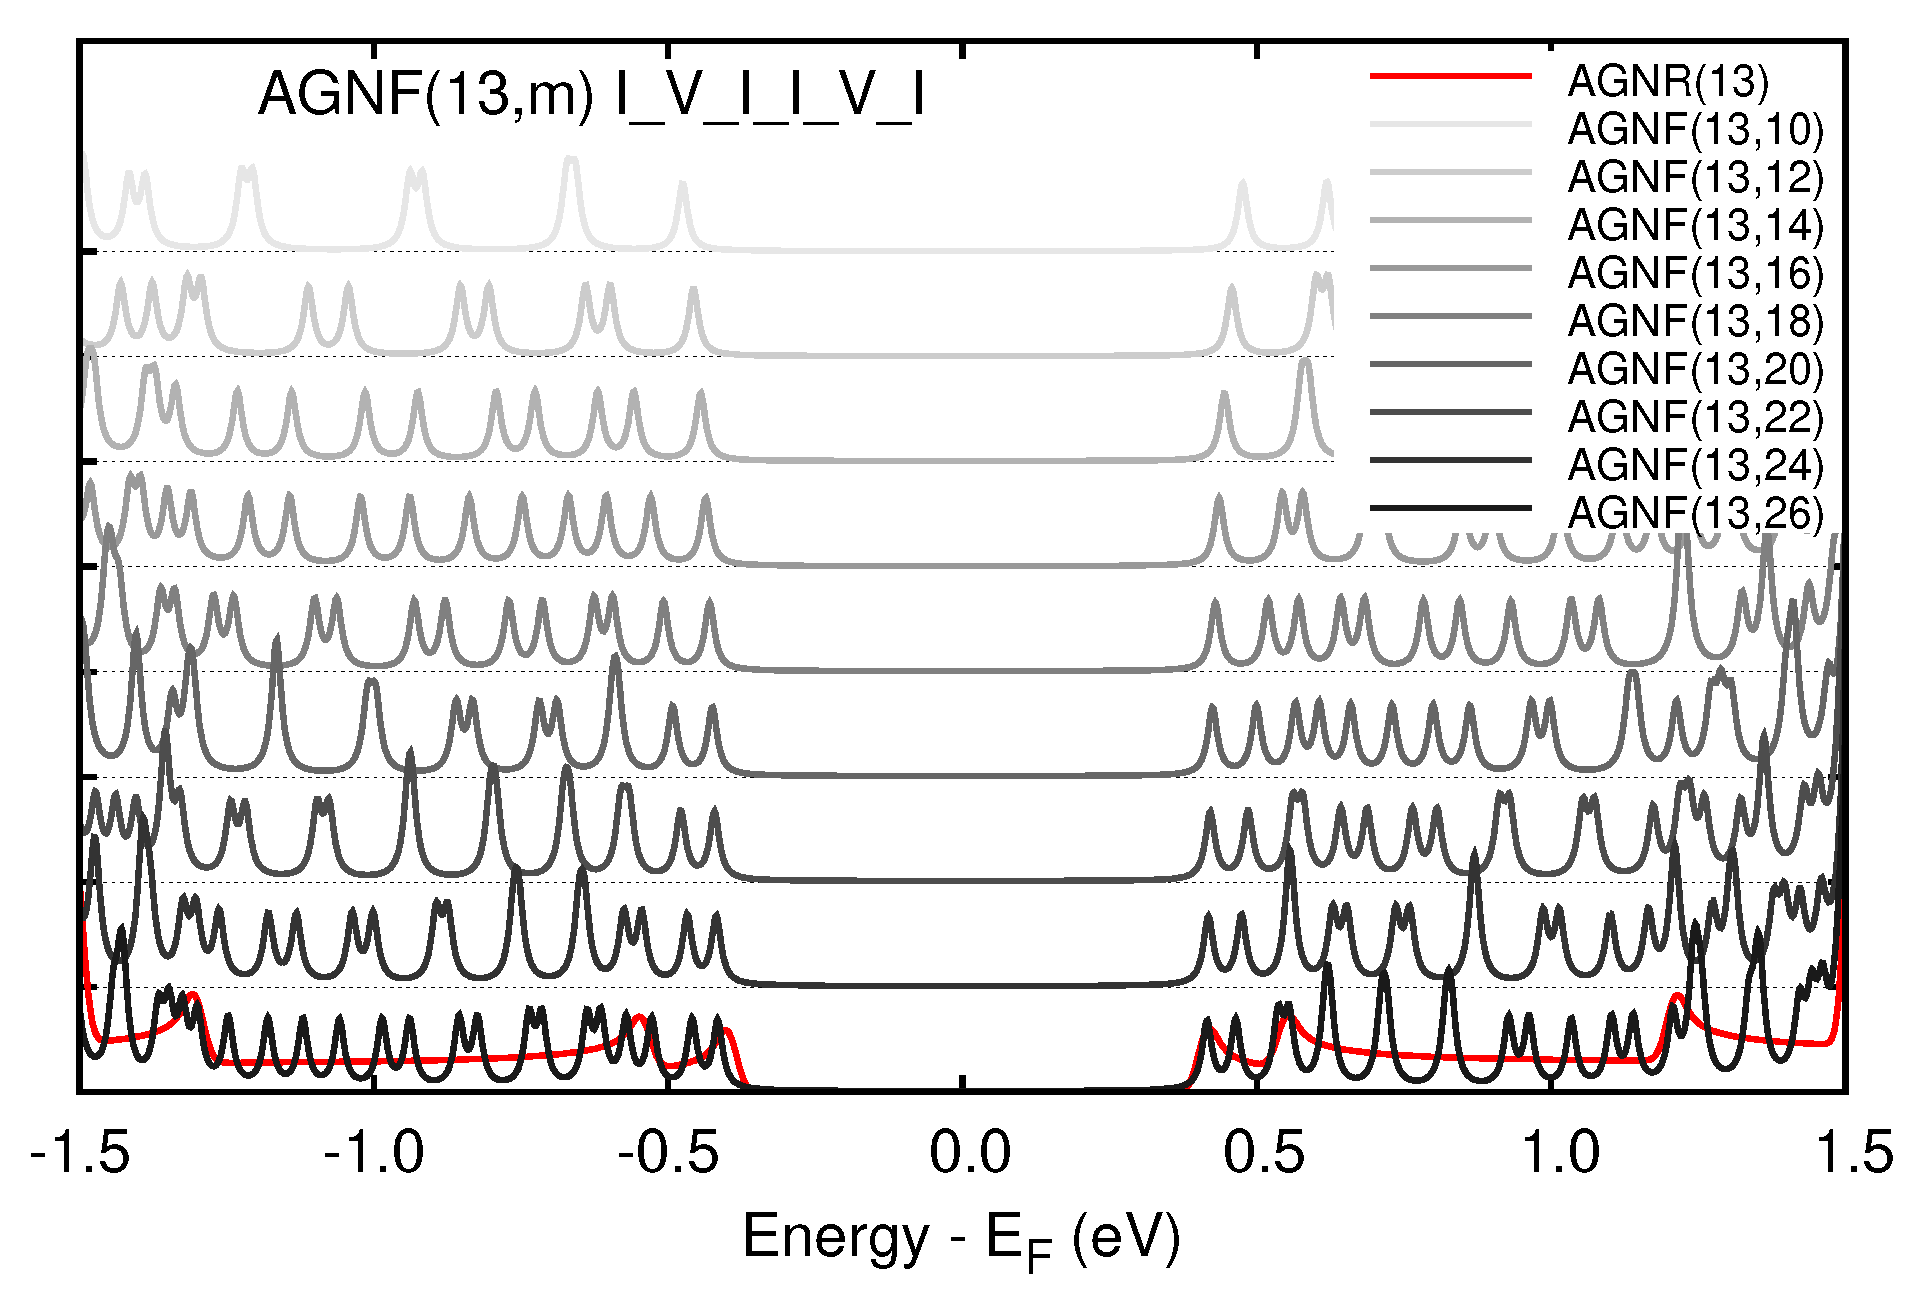
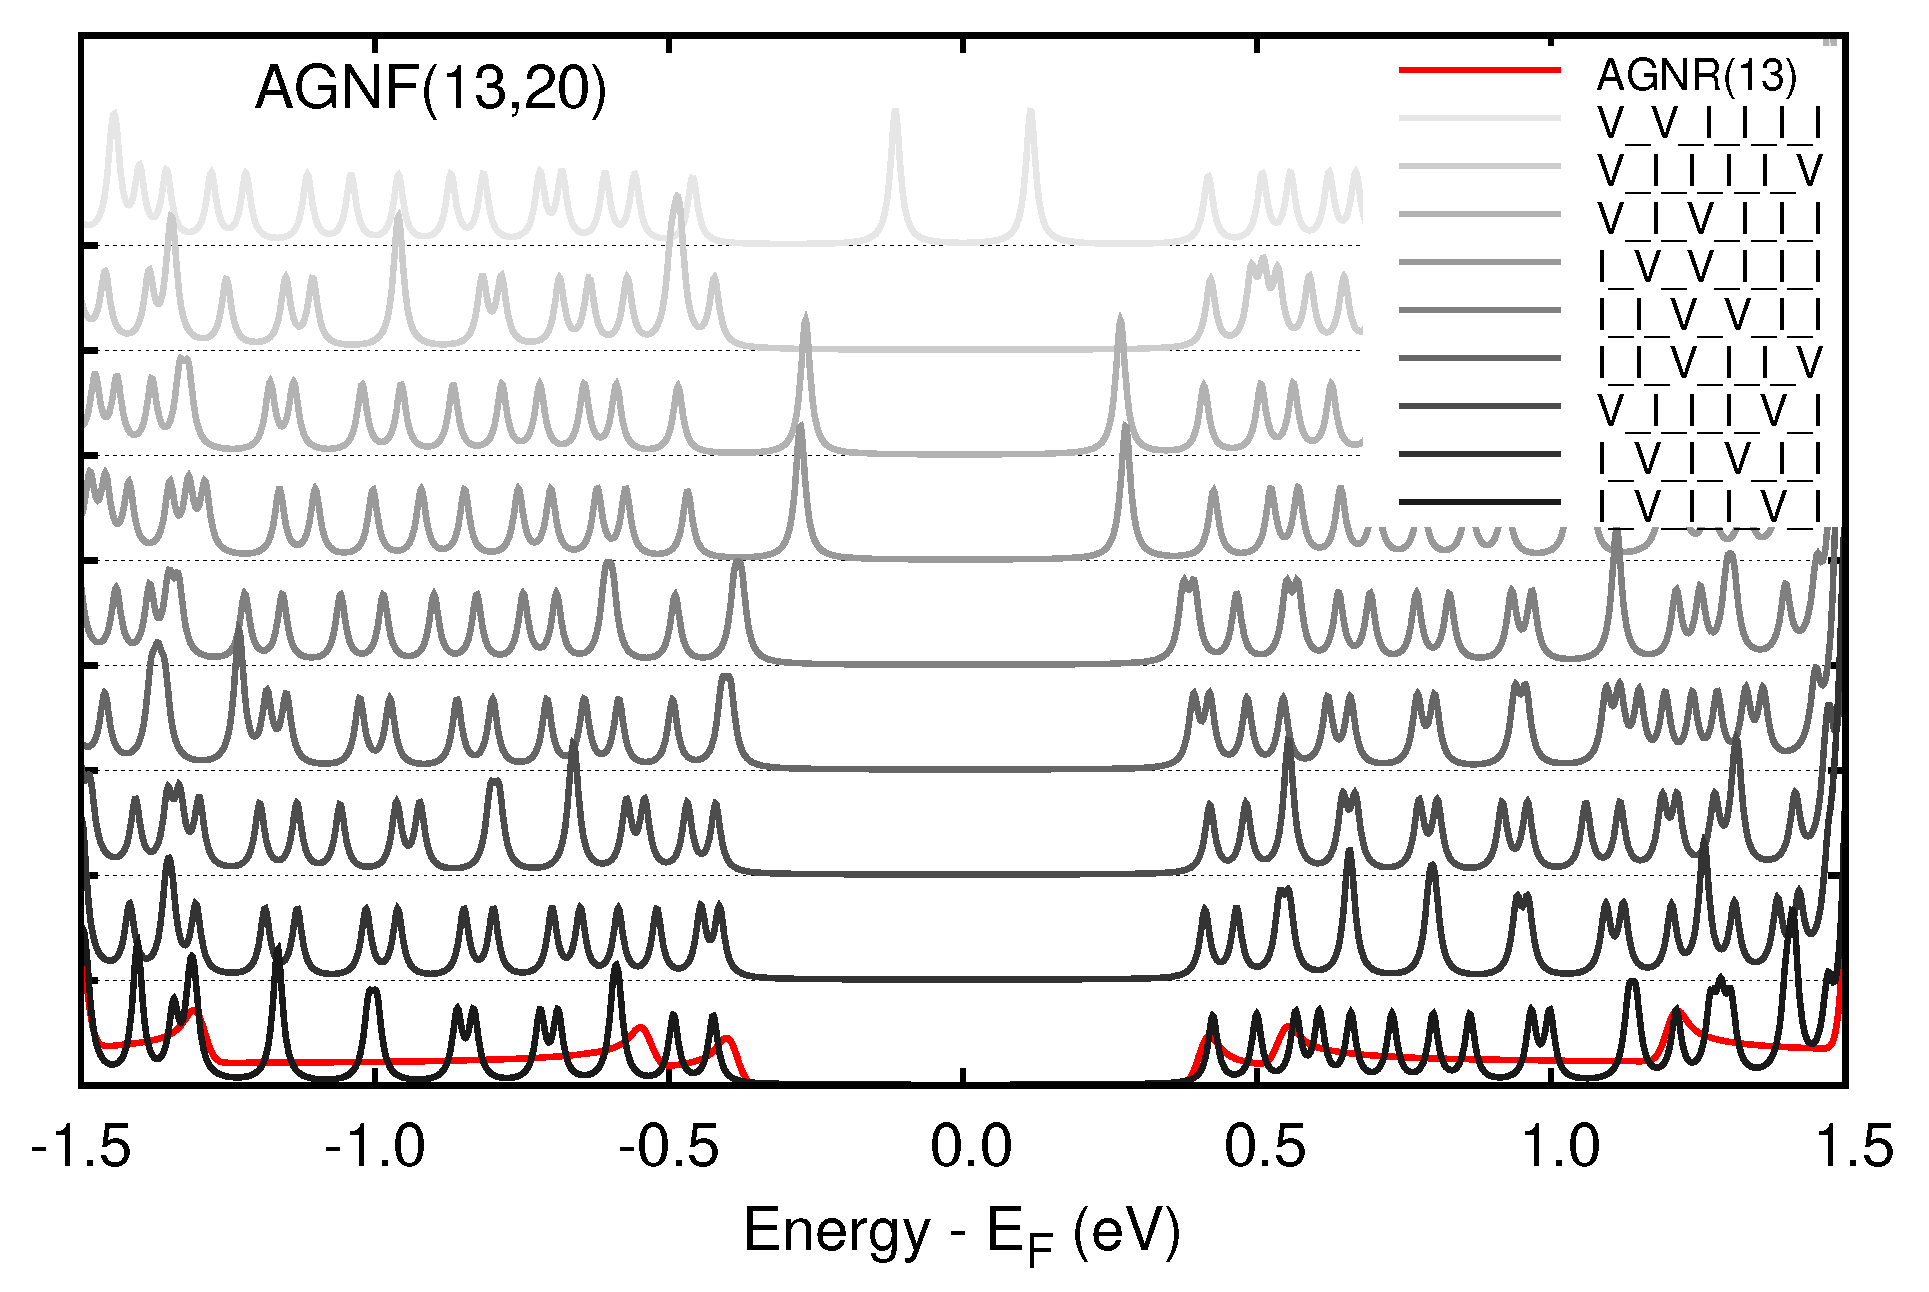
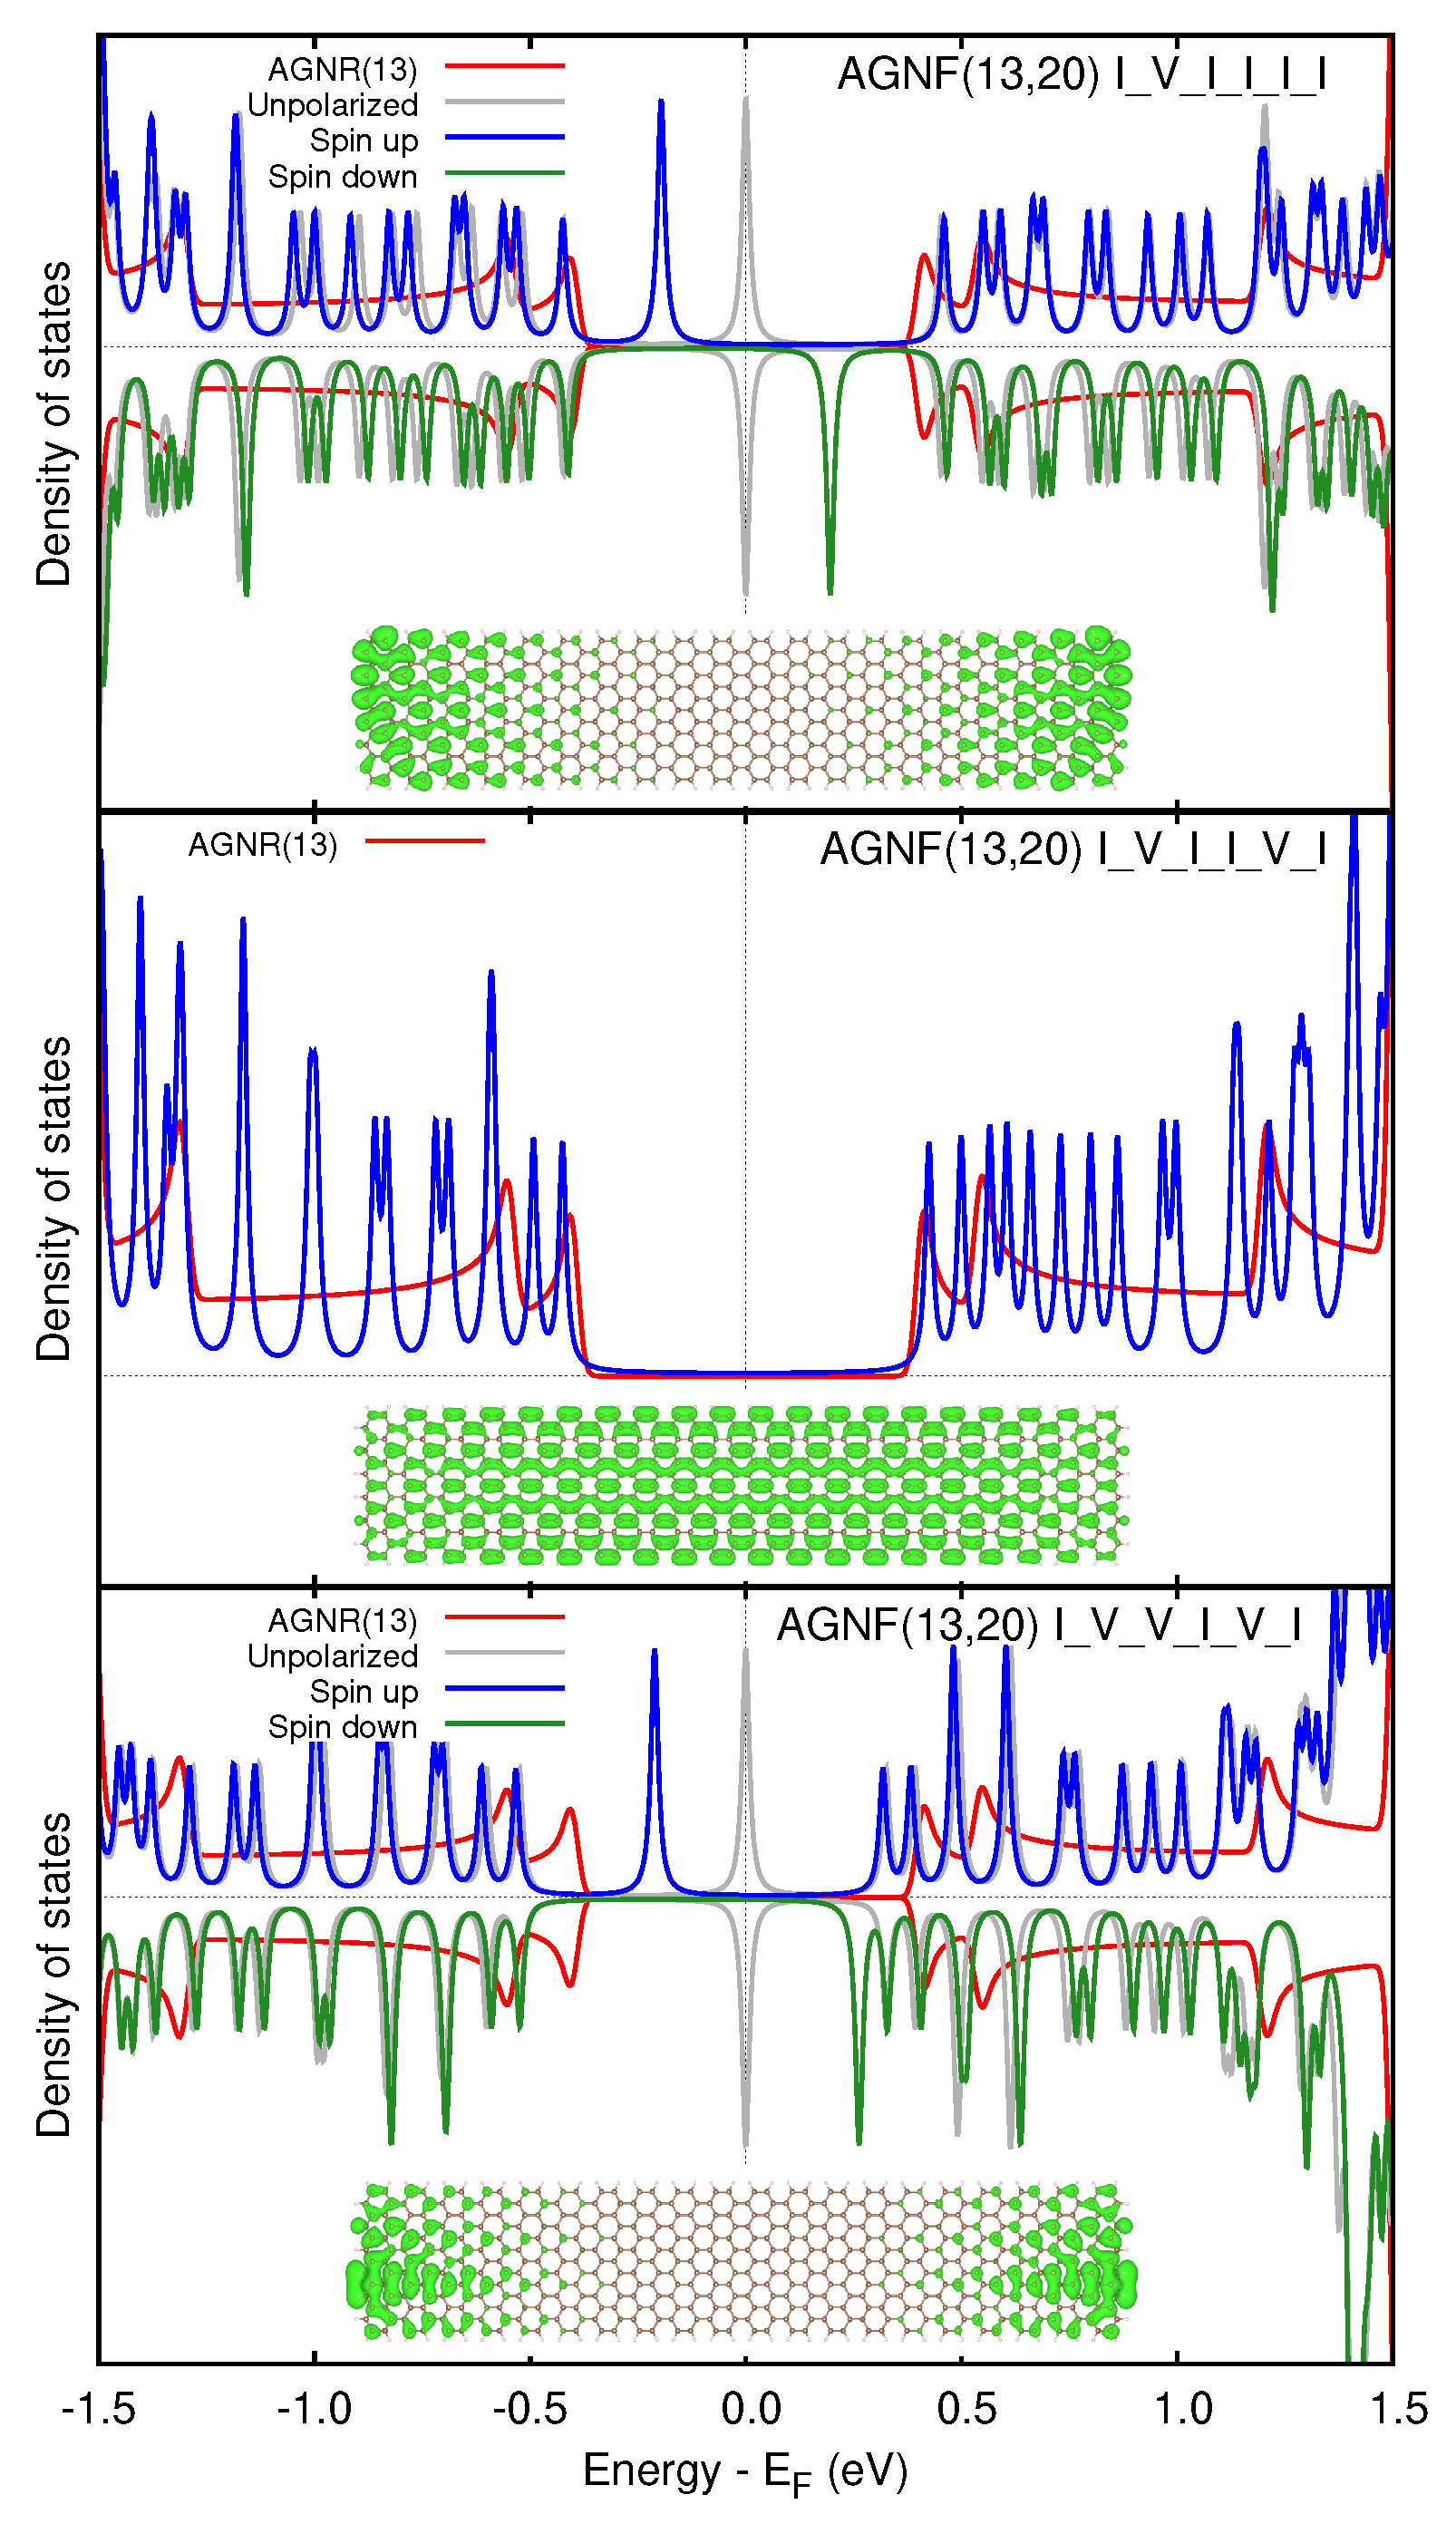
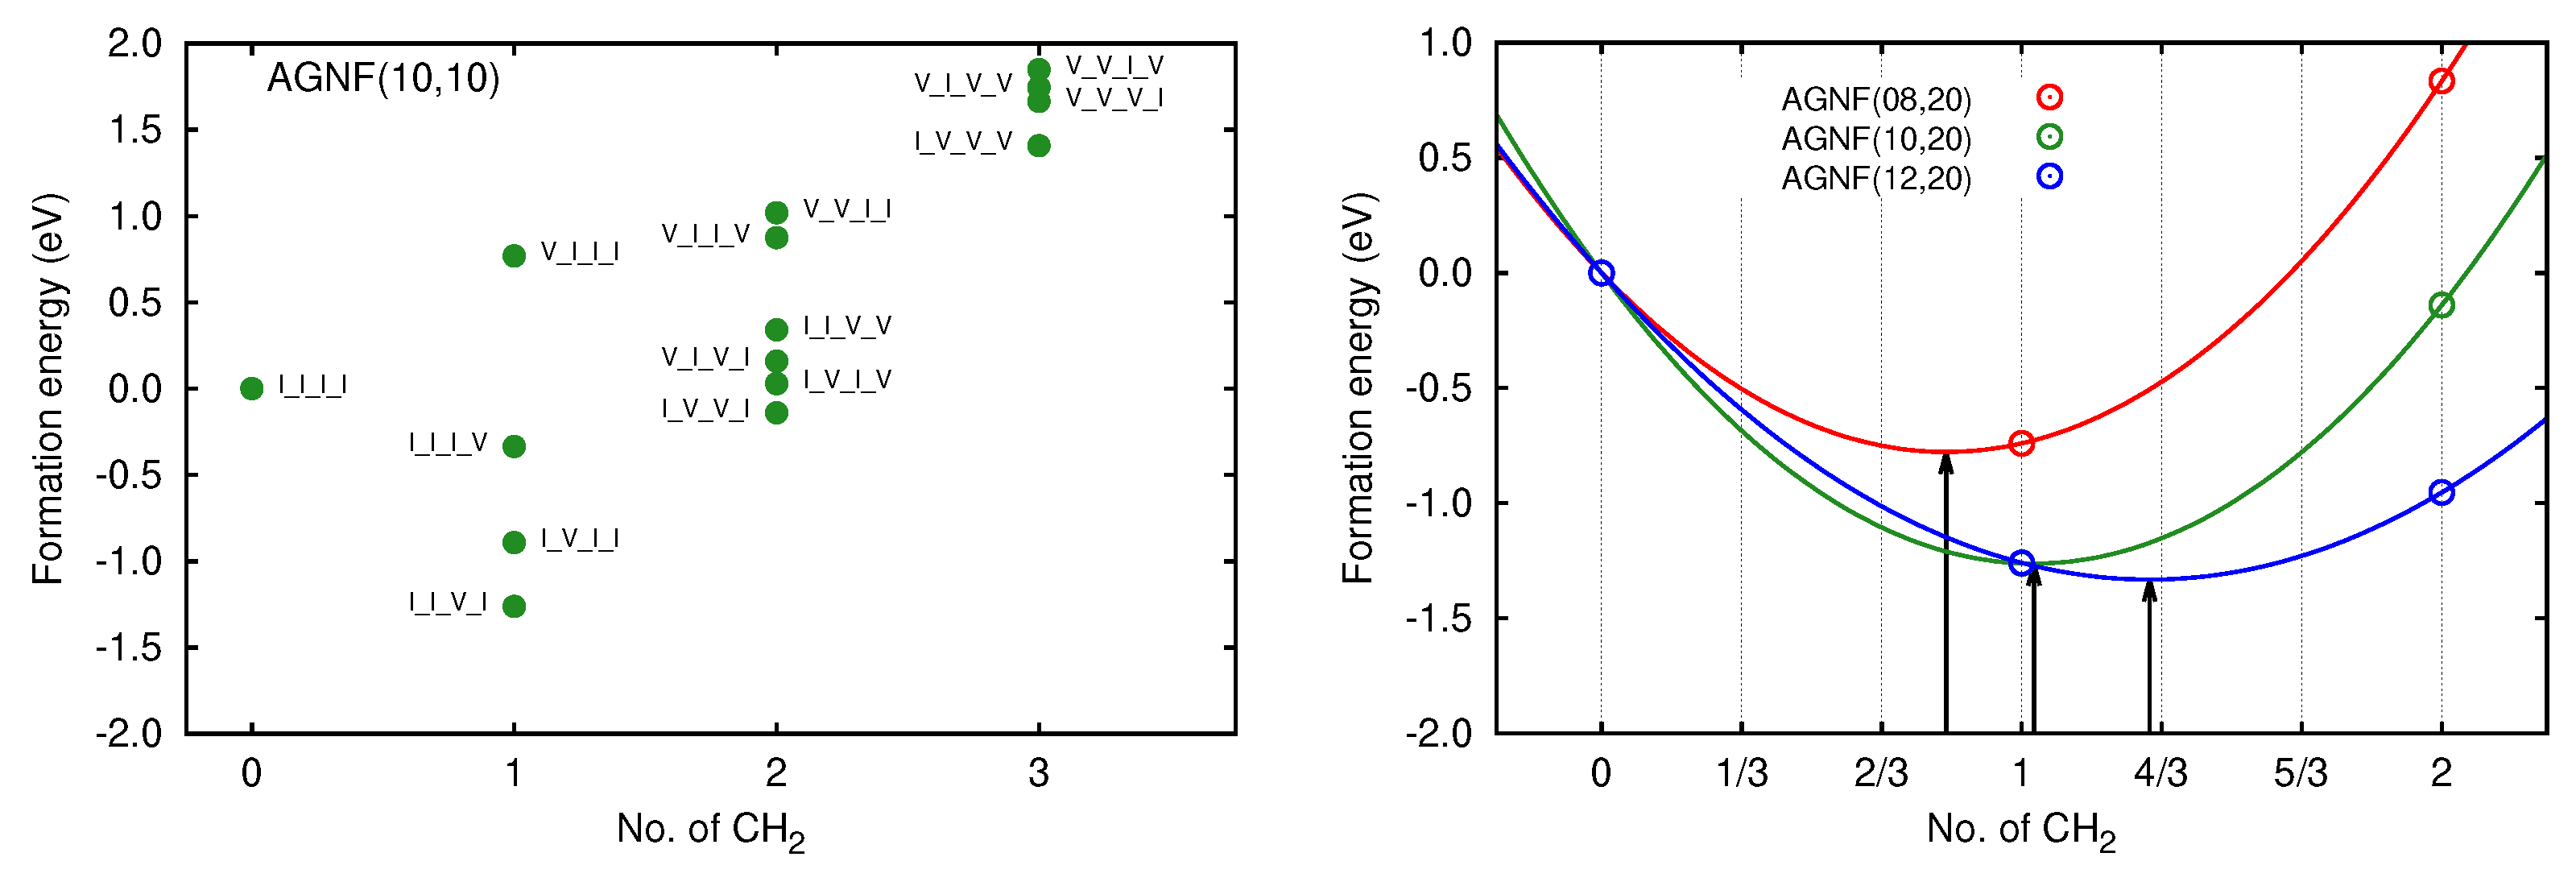
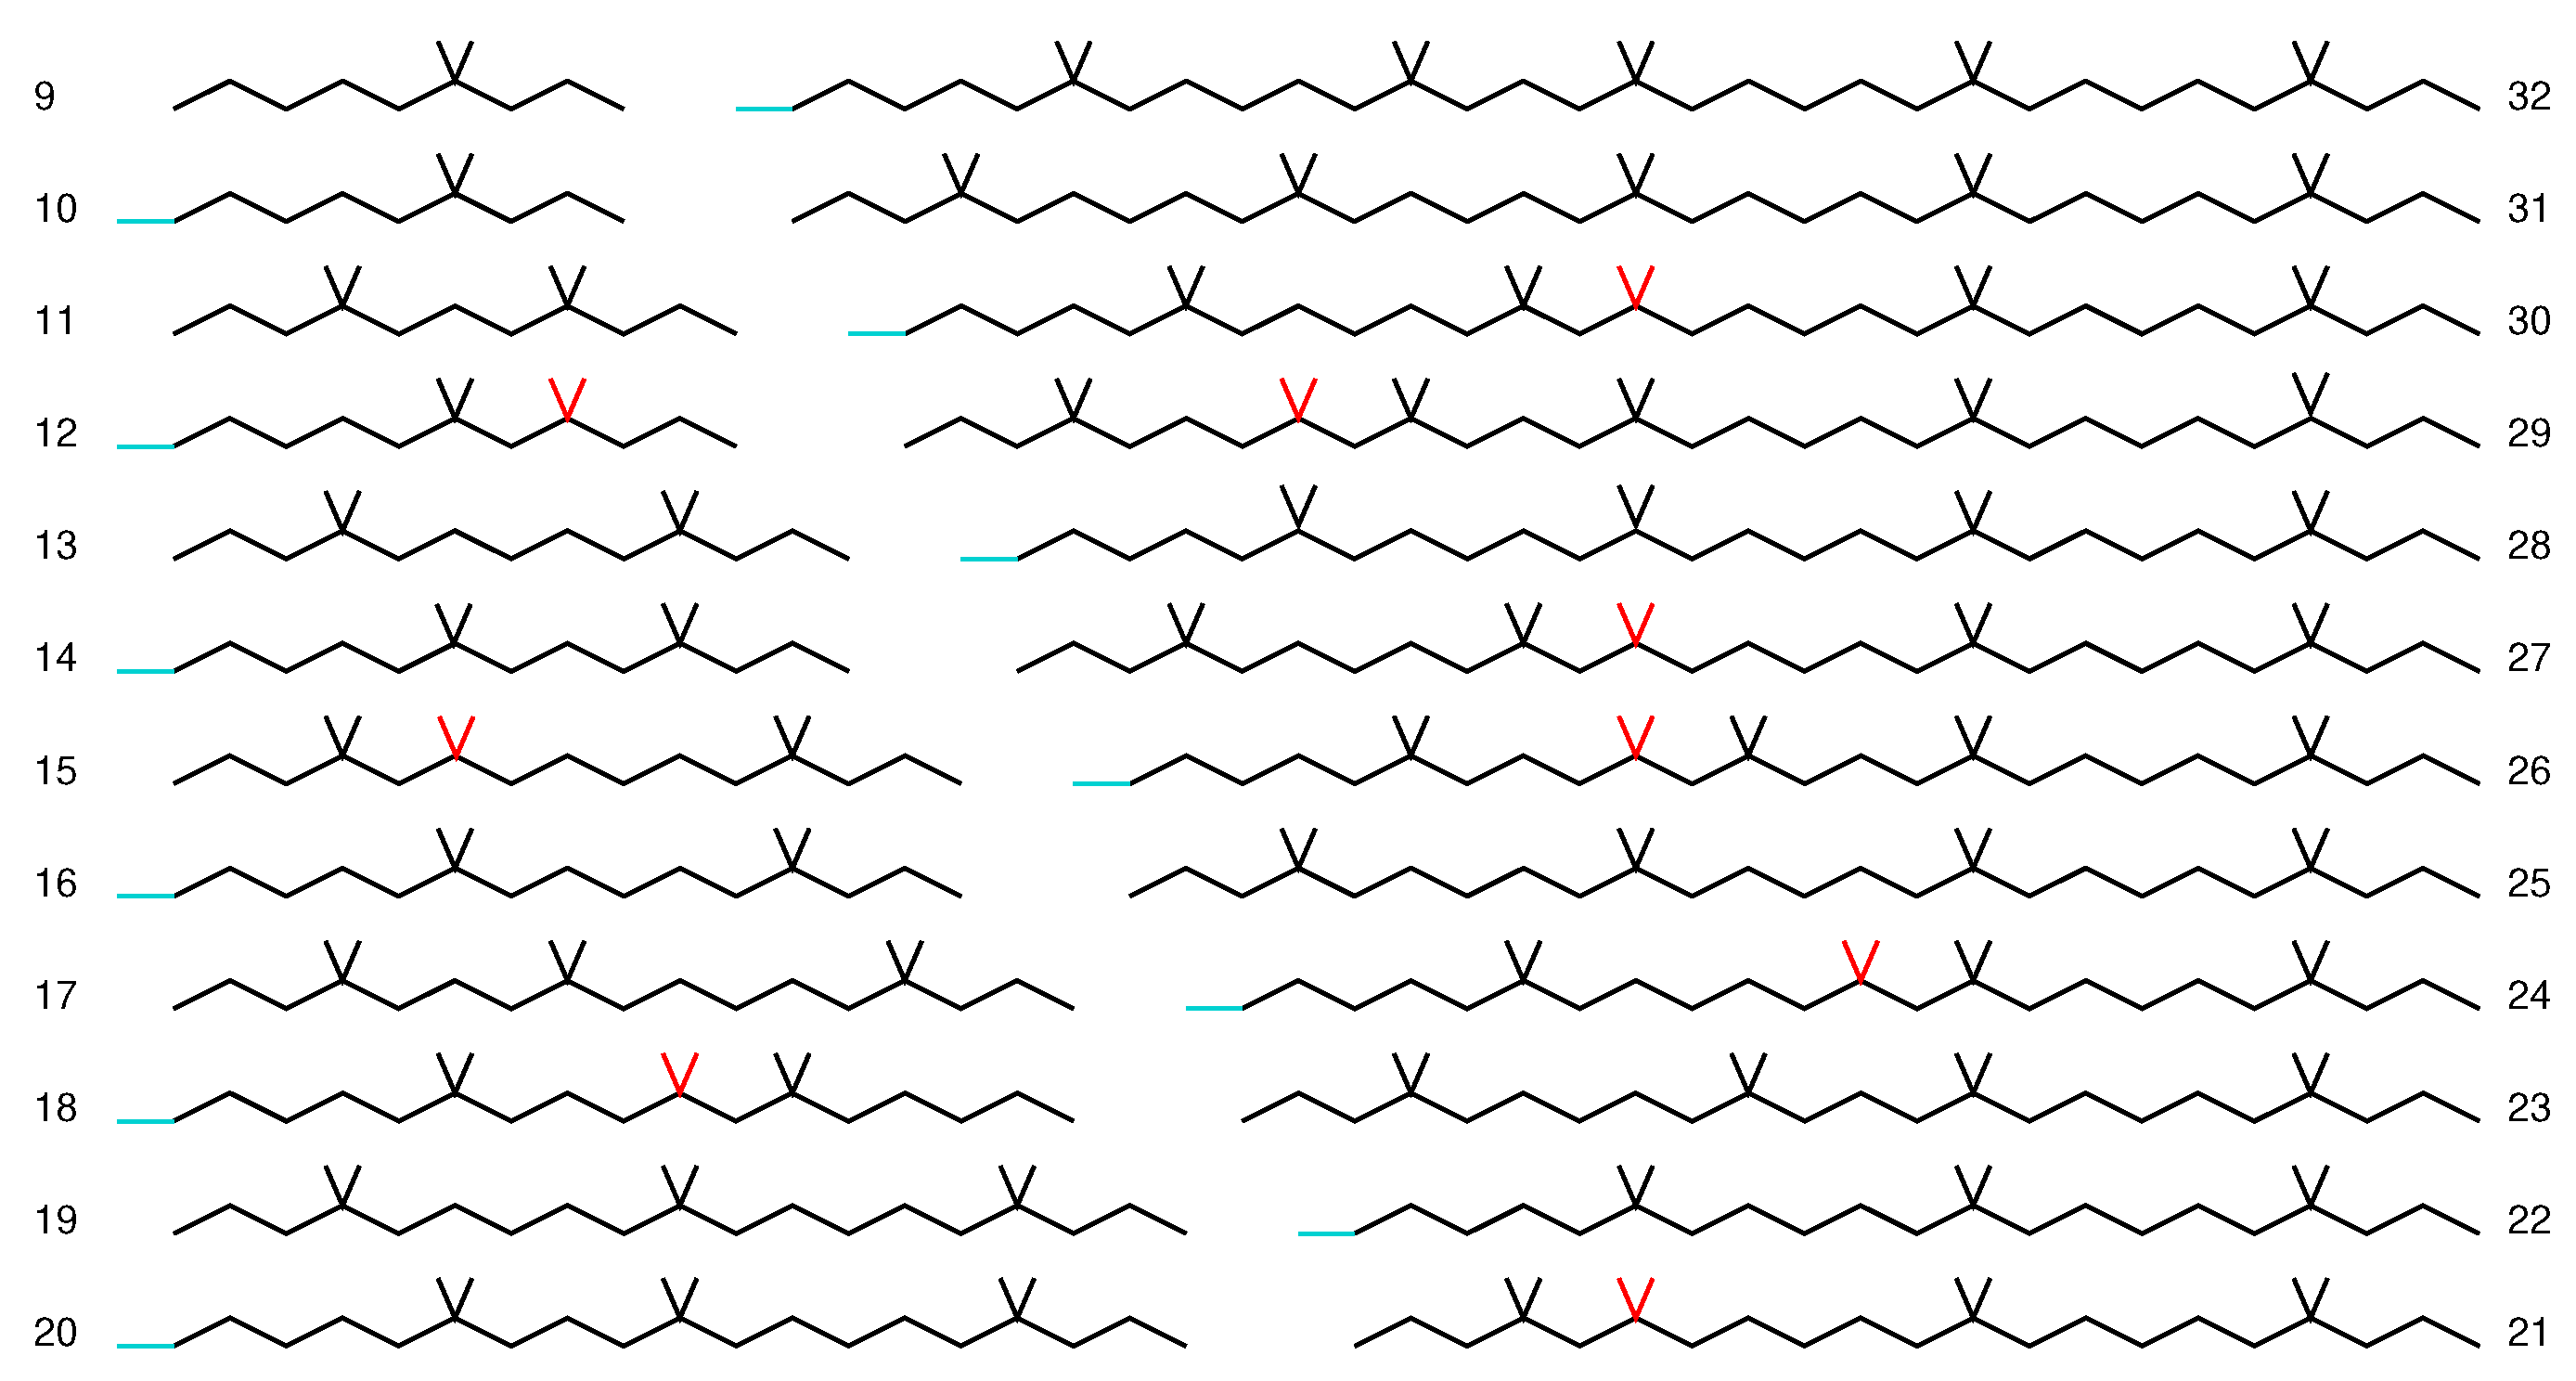
3.2. Graphene Nanoflakes

AGNFs(n,m) were obtained as nonrelaxed truncations of the C–C network of the corresponding AGNRs(n). Their armchair edges were saturated with a 1:1 C to H ratio. As for the saturation of the zigzag caps, we considered combinations of CH and CH 2 terminations. In most flakes, we tested all reliable possibilities by varying either the number of hydrogens, i.e., the C:H stoichiometry, or the position of the CH 2 groups along the caps, i.e., the flake’s conformation at a fixed composition. In selected flakes, in addition to the structural optimization of all hydrogens, we also performed a complete relaxation of the network of carbon atoms, and we can affirm that C–C relaxation does not alter the ongoing discussion. In the following, we report a selection of test cases that are representative of the large number of systems considered. General rules and trends, as well as a discussion based on thermodynamics, are presented at the end of the section.
In the left panel of Figure 3, we report the energetics of different H saturations of the caps in AGNF(13,10). Spin polarization was considered in all systems. The saturation is reported according to the following notation: Single vertical bars I stand for CH saturations, while V stands for CH 2 saturations. As an example, the label I_I_V_I_V refers to the following pattern at the cap: (CH)-(CH)-(CH 2 )-(CH)-(CH 2 ). The abscissas report the number of double saturations, i.e., of CH 2 groups. For any given stoichiometry, the possible structural conformations of CH and CH 2 groups were obtained by permuting their positions along the caps.
Based on our computations, we may affirm that the formation energies of AGNFs(13,10) with the same stoichiometry but different conformations of CH 2 groups at the caps spanned a relevant range, which was possibly on the order of eV. Second, all AGNFs(13,10) with a number of CH 2 groups other than 2 at each cap presented net spin polarization in the wavefunction. Third, it is quite evident that one structure was clearly more stable than the others, and it was characterized by a definite stoichiometry and a specific arrangement of hydrogens at the caps.
The data in the right panel of Figure 3 connect only the most stable conformations of hydrogens at the caps for a set of three stoichiometries in AGNF(11,20), AGNF(13,20), and AGNF(15,20). The plot shows that the optimal number of CH 2 for a (n,m) flake is ( n 1 ) / 6 when n is odd. When this ratio is not an integer, the optimal saturation requires a number of CH 2 groups equal to the closest integer. The sketch drawn so far also holds for the AGNF(5,20), AGNF(7,20), and AGNF(9,20) set, as well as for the AGNF(17,20), AGNF(19,20), and AGNF(21,20) set. Overall, this recipe grounds its validity in the analysis of the entire set of data related to odd AGNFs(n,m). Furthermore, it agrees well with the chemical intuition. Indeed, at each cap, the number of C atoms to be saturated is ( n 1 ) / 2 . The most stable saturation pattern requires one CH 2 group for every three carbon atoms along the cap, which fits well with the theoretical bond order of (1+1/3) assigned to C–C in graphene.
The saturation pattern of the caps is not merely a question of formation energy and, hence, of the thermodynamic stability of a given flake. As we demonstrate in the following, it has a deep impact on the electronic properties of the flake, which are likely to play a relevant role in the operating behavior of nanoelectronic devices based on AGNFs.
Let us first examine the role of the length of the flake, m, in determining its electronic properties. In Figure 4, we report the electronic structure of a series of AGNF(13,m) flakes, all of which had the most stable stoichiometry and hydrogen conformation at the caps, which was I_V_I_I_V_I. The bottom red line of the figure refers to AGNR(13), i.e., the infinite ribbon with no caps. As can be seen in Figure 4, the flakes presented a discrete set of localized states, which was consistent with their reduced dimensionality. As the length m increased, the distribution of eigenvalues became more dense and tended to reproduce the density of states (DOS) of the infinite ribbon. The HOMO–LUMO gap decreased with the increase in m, but it always remained larger than the band gap of AGNR(13).
We also investigated the relation between the electronic properties of the flakes and their conformation; for any given C-to-H stoichiometry, we sampled different locations of CH 2 groups at the caps. In the case of AGNF(13,20), which is reported in Figure 5, the most stable carbon-to-hydrogen stoichiometry required that two CH 2 groups were present at each cap, and their most stable arrangement was I_V_I_I_V_I. As we considered conformations with increasing energies, the HOMO–LUMO gap decreased almost regularly, with the exception of V_I_I_I_I_V. As a result, high-energy conformations might have had electronic states within the band gap of AGNR(13). Generally speaking, the data in Figure 5 suggest that when more CH 2 groups were present, they tended to keep far apart from one another while avoiding the corners between edges and caps at the same time.
The saturation of the caps of a given flake with carbon-to-hydrogen ratios that were larger or smaller than the most stable one had an even deeper impact on the flake’s electronic properties, as can be seen in Figure 6 for the case of AGNR(13,20). The wavefunctions of oversaturated and undersaturated flakes presented a net spin polarization, which was not the case when the most stable number of CH 2 groups was inserted. Even worse, an improper saturation induced the appearance of electronic states falling within the band gap of the corresponding ribbon, AGNR(13), which was a critical region for the simulation of electronic phenomena. The insets in the figure clarify the nature of states of AGNF(13,20) that fell in the gap of AGNR(13). Indeed, they were spatially localized on the caps, while all the other ones belonged to the extended π structure of the flake, which was delocalized over the entire molecule. From a chemical point of view, this behavior is typical of unsaturated bonds.
Analogously to Figure 3, in the left panel of Figure 7, we report the formation energy of a series of nanoflakes with m = 10 while considering all possible saturation stoichiometries and hydrogen arrangements at the caps. As already observed, the formation energies of AGNFs(10,10) with the same stoichiometry but different conformations of CH 2 groups at the caps spanned a relevant range. Furthermore, all AGNFs(10,10) with a number of CH 2 groups other than 1 at each cap presented net spin polarization in the wavefunction, and there was one structure that was clearly more stable than the others, which was characterized by a definite stoichiometry and a specific arrangement of hydrogens at the caps.
In the right panel of Figure 7, we collect the energies of the most stable conformations for a set of three stoichiometries in AGNF(8,20), AGNF(10,20), and AGNF(12,20). In this case, the optimal number of CH 2 groups was as close as possible to ( n 4 ) / 6 . Indeed, the removal of an exocyclic carbon atom from each even cap ensured that the nearest cap carbon would be perfectly saturated with just one hydrogen. We verified that, as happens for odd flakes when n was even, the deviation from the optimal number of CH 2 groups at the caps induced the presence of spin-polarized midgap electronic states that were localized at the cap. As expected, the above considerations were also valid when comparing the AGNF(14,20), AGNF(16,20), and AGNF(20,20) sets of flakes.
In general terms, from the above discussion, it is straightforward that simulating a nanodevice using AGNFs as electronic components requires a careful screening of their saturation stoichiometry. Indeed, the latter critically determines the flake’s electronic structure, which, in turn, is likely to affect the simulated properties of the device.
Figure 8 pictorially summarizes the rules and trends described so far for the saturation of caps of hammer nanoflakes. The number of optimal CH 2 groups was the closest integer to ( n 1 ) / 6 in the case of odd flakes and to ( n 4 ) / 6 in the case of even flakes. CH 2 groups tended to keep far apart from one another and to avoid the corners between edges and caps. In the case of even flakes, CH 2 groups avoided the smooth corners the most. With these rules, in some systems, there were more conformations within a very small energy range (5 meV).
As a further insight into the properties of graphene nanoflakes, we tested the robustness of the saturation rules given above with respect to the environmental conditions experienced by AGNFs during synthesis and in operando. We assumed here that the flakes were in thermodynamic equilibrium with molecular hydrogen, which is likely to happen during synthesis. The temperature was set to 300 kelvin. As representative systems, in Figure 9, we report the Gibbs free energies of AGNF(13,20) and AGNF(11,20) with various saturation stoichiometries. For any given C-to-H ratio, we just considered the most stable conformation of hydrogens at the caps. We remark that in both systems, the most stable stoichiometry required two CH 2 groups at each cap. However, in AGNF(13,20), the ( n 1 ) / 6 recipe predicted an integer value, while in AGNF(11,20), it measures 1 + 2/3, which means that this flake would require a noninteger number of CH 2 groups at each cap. This cannot be realized in practice, but 2 was the integer closest to the optimal value for AGNF(11,20). As concerns AGNF(13,20), the saturation pattern with the lowest formation energy (I_V_I_I_V_I) was the most favorable—as far as thermodynamics is concerned—in an extremely wide range of partial pressures of molecular gas-phase hydrogen. The I_I_I_I_I_I stoichiometry became favored at very low partial pressures of H 2 , while I_V_V_I_V_I became stable only at very high pressures. No range of stability was found for I_V_I_I_I_I. Considering AGNF(11,20), one might expect a quite different trend with respect to the previous case because, here, ( n 1 ) / 6 was between 1 and 2, i.e., there were two saturation stoichiometries close to the optimal value. However, this was not the case. The I_V_I_V_I pattern was stable from very low up to very high H 2 pressures. Severe undersaturation, I_I_I_I_I, was stable at very low pressures, while oversaturation, V_V_I_V_I, was stable at exceedingly high pressures. At variance with AGNF(13,20), the intermediate undersaturation stoichiometry, I_I_V_I_I, had a range of stability, though it was very small. Overall, we can affirm that—for any given flake—the saturation stoichiometry corresponding to the most stable structure was thermodynamically favored over a very wide range of partial pressures of H 2 . To allow for saturation stoichiometries other than the one with the lowest formation energy, extreme conditions that are far away from those typically experienced by AGNFs during their synthesis and utilization should be imposed. The stability of the flakes with the lowest formation energy was, therefore, quite robust, which is an aspect to be considered in theoretical simulations of AGNFs(n,m). Indeed, on the one hand, it is evident that flakes with H saturations other than the most stable one can be synthesized, and they might be stable—on a relevant time scale—against evolution towards the most stable stoichiometry. On the other hand, if the synthetic route takes into account that a thermodynamic equilibrium is established between molecular hydrogen and the carbon nanoflake, the latter will assume a single well-defined stoichiometry.

4. Conclusions

In this work, we showed that AGNFs(n,m) with even values of n are mostly stable when ( n 1 ) / 6 terminations of the CH 2 type are inserted at each cap (the other ones being CH), while flakes with odd values of n require ( n 4 ) / 6 distinct CH 2 groups. When these ratios assume noninteger values, the most stable saturation corresponds to a number of CH 2 groups of the closest integer. As concerns the conformation, i.e., the position of CH 2 groups at the caps, carbon atoms with two hydrogens tend to keep far apart from one another while avoiding being located at the corners between edges and caps at the same time. These tendencies are more marked in flakes with even values of n than in odd AGNFs. Furthermore, in even flakes, smoothed corners between edges and caps are avoided the most.
The wavefunctions of AGNFs(n,m) in conditions of undersaturation or oversaturation become spin-polarized. In these systems, the electronic structure presents states falling in the band gap of the corresponding ribbon, AGNR(n). The same occurs in flakes with the most stable stoichiometry and a very unfavorable conformational arrangement. The electron density of midgap states is localized on the caps of the flake; hence, they do not participate in its extended π -bonding structure. On the contrary, for the most stable stoichiometry and conformation, the wavefunction of the flake has no net spin polarization, there are no states falling in the gap of the corresponding ribbon, the HOMO–LUMO distance is a bit larger than the band gap, and occupied states build a π -bonding structure that is delocalized over the entire C–C network. Overall, either the stoichiometry of a given flake or the conformational arrangement of hydrogens at the caps profoundly affects its electronic structure. To attain reliable results—for example, in theoretical simulations of AGNFs as components of nanoelectronic devices—one should carefully assess the role of hydrogen saturation.
Another key element is to consider the thermodynamic stability of AGNFs at varying hydrogen contents. Based on our study, we can affirm that, for a given AGNF(n,m), there is a single stoichiometry that is favorable over a wide range of environmental conditions. The rules given in the present study represent quite strict guidance for theoretical simulations in both the choice of the appropriate hydrogen content in carbon nanoflakes and the selection of the most stable conformation of CH and CH 2 terminations at the caps.

Author Contributions

Conceptualization, M.I.T., F.C. and R.S.; methodology, M.I.T.; software, M.I.T.; validation, M.I.T., F.C. and R.S.; investigation, F.C.; data curation, M.I.T.; writing—original draft preparation, M.I.T.; writing—review and editing, M.I.T., F.C. and R.S.; visualization, R.S. All authors have read and agreed to the published version of the manuscript.

Funding

This research received no external funding.

Data Availability Statement

Data are contained within the article.

Acknowledgments

The authors would like to thank Andrea Candini for the fruitful discussions.

Conflicts of Interest

The authors declare no conflicts of interest.

References

  1. Dutta, S.; Pati, S.K. Novel properties of graphene nanoribbons: A review. J. Mater. Chem. 2010, 20, 8207–8223. [Google Scholar] [CrossRef]
  2. Wang, H.; Wang, H.S.; Ma, C.; Chen, L.; Jiang, C.; Chen, C.; Xie, X.; Li, A.P.; Wang, X. Graphene nanoribbons for quantum electronics. Nat. Rev. Phys. 2021, 3, 791–802. [Google Scholar] [CrossRef]
  3. Houtsma, R.S.K.; de la Rie, J.; Stohr, M. Atomically precise graphene nanoribbons: Interplay of structural and electronic properties. Chem. Soc. Rev. 2021, 50, 6541–6568. [Google Scholar] [CrossRef] [PubMed]
  4. Cocchi, C.; Prezzi, D.; Ruini, A.; Caldas, M.J.; Molinari, E. Electronics and Optics of Graphene Nanoflakes: Edge Functionalization and Structural Distortions. J. Phys. Chem. C 2012, 116, 17328–17335. [Google Scholar] [CrossRef]
  5. Gotz, A.; Wang, X.Y.; Ruini, A.; Zheng, W.; Soltani, P.; Graf, R.; Tries, A.; Li, J.; Palma, C.A.; Molinari, E.; et al. Band structure modulation by methoxy-functionalization of graphene nanoribbons. J. Mater. Chem. C 2022, 10, 4173–4181. [Google Scholar] [CrossRef]
  6. Martini, L.; Chen, Z.; Mishra, N.; Barin, G.B.; Fantuzzi, P.; Ruffieux, P.; Fasel, R.; Feng, X.; Narita, A.; Coletti, C.; et al. Structure-dependent electrical properties of graphene nanoribbon devices with graphene electrodes. Carbon 2019, 146, 36–43. [Google Scholar] [CrossRef]
  7. Gu, Y.; Qiu, Z.; Mullen, K. Nanographenes and Graphene Nanoribbons as Multitalents of Present and Future Materials Science. J. Am. Chem. Soc. 2022, 144, 11499–11524. [Google Scholar] [CrossRef]
  8. Fedotov, P.V.; Obraztsova, E.D. Near infrared photoluminescence of the bottom-up produced 7-armchair graphene nanoribbons. Appl. Phys. Lett. 2023, 122, 013101. [Google Scholar] [CrossRef]
  9. Liu, Z.; Fu, S.; Liu, X.; Narita, A.; Samorì, P.; Bonn, M.; Wang, H.I. Small Size, Big Impact: Recent Progress in Bottom-Up Synthesized Nanographenes for Optoelectronic and Energy Applications. Adv. Sci. 2022, 9, 2106055. [Google Scholar] [CrossRef]
  10. Tan, Y.Z.; Osella, S.; Liu, Y.; Yang, B.; Beljonne, D.; Feng, X.; Müllen, K. Sulfur-Annulated Hexa-peri-hexabenzocoronene Decorated with Phenylthio Groups at the Periphery. Angew. Chem. 2015, 127, 2970–2974. [Google Scholar] [CrossRef]
  11. Tan, Y.Z.; Yang, B.; Parvez, K.; Narita, A.; Osella, S.; Beljonne, D.; Feng, X.; Müllen, K. Atomically precise edge chlorination of nanographenes and its application in graphene nanoribbons. Nat. Commun. 2013, 4, 2646. [Google Scholar] [CrossRef] [PubMed]
  12. Wassmann, T.; Seitsonen, A.P.; Saitta, M.A.; Lazzeri, M.; Mauri, F. Structure, stability, edge states, and aromaticity of graphene ribbons. Phys. Rev. Lett. 2008, 101, 096402. [Google Scholar] [CrossRef] [PubMed]
  13. Soler, J.M.; Artacho, E.; Gale, J.D.; García, A.; Junquera, J.; Ordejón, P.; Sánchez-Portal, D. The SIESTA method for ab initio order-N materials simulation. J. Phys. Condens. Matter 2002, 14, 2745. [Google Scholar] [CrossRef]
  14. Perdew, J.P.; Burke, K.; Ernzerhof, M. Generalized Gradient Approximation Made Simple. Phys. Rev. Lett. 1996, 77, 3865. [Google Scholar] [CrossRef] [PubMed]
  15. Troullier, N.; Martins, J.L. Efficient pseudopotentials for plane-wave calculations. Phys. Rev. B 1991, 43, 1993. [Google Scholar] [CrossRef] [PubMed]
  16. Chase, M.W., Jr. NIST-JANAF Thermochemical Tables; American Chemical Society: Washington, DC, USA, 1998; Volume 9, pp. 1–1951. [Google Scholar]
  17. Lynch, R.W.; Drickamer, H.G. Effect of High Pressure on the Lattice Parameters of Diamond, Graphite, and Hexagonal Boron Nitride. J. Chem. Phys. 1966, 44, 181–184. [Google Scholar] [CrossRef]
  18. Hembacher, S.; Giessibl, F.J.; Mannhart, J.; Quate, C.F. Revealing the hidden atom in graphite by low-temperature atomic force microscopy. Proc. Natl. Acad. Sci. USA 2003, 22, 12539–12542. [Google Scholar] [CrossRef]
  19. Dappe, Y.J.; Oszwaldowski, R.; Pou, P.; Ortega, J.; Pérez, R.; Flores, F. Local-orbital occupancy formulation of density functional theory: Application to Si, C, and graphene. Phys. Rev. B 2006, 73, 235124. [Google Scholar] [CrossRef]
  20. Barone, V.; Hod, O.; Scuseria, G.E. Electronic Structure and Stability of Semiconducting Graphene Nanoribbons. Nano Lett. 2006, 6, 2748–2754. [Google Scholar] [CrossRef]
  21. Koskinen, P.; Malola, S.; Häkkinen, H. Self-Passivating Edge Reconstructions of Graphene. Phys. Rev. Lett. 2008, 101, 115502. [Google Scholar] [CrossRef]
  22. Shin, H.; Kang, S.; Koo, J.; Lee, H.; Kim, J.; Kwon, Y. Cohesion energetics of carbon allotropes: Quantum Monte Carlo study. J. Chem. Phys. 2014, 140, 114702. [Google Scholar] [CrossRef] [PubMed]
  23. Kresse, G.; Hafner, J. First-principles study of the adsorption of atomic H on Ni (111), (100) and (110). Surf. Sci. 2000, 459, 287. [Google Scholar] [CrossRef]
  24. Huber, K.P. American Institute of Physics Handbook; McGraw-Hill: New York, NY, USA, 1979. [Google Scholar]
  25. Abbas, A.N.; Liu, G.; Narita, A.; Orosco, M.; Feng, X.; Müllen, K.; Zhou, C. Deposition, Characterization, and Thin-Film-Based Chemical Sensing of Ultra-long Chemically Synthesized Graphene Nanoribbons. J. Am. Chem. Soc. 2014, 136, 7555–7558. [Google Scholar] [CrossRef] [PubMed]
  26. El Gemayel, M.; Narita, A.; Dössel, L.F.; Sundaram, R.S.; Kiersnowski, A.; Pisula, W.; Hansen, M.R.; Ferrari, C.; Orgiu, E.; Feng, X.; et al. Graphene nanoribbon blends with P3HT for organic electronics. Nanoscale 2014, 6, 6301–6314. [Google Scholar] [CrossRef] [PubMed]
  27. Candini, A.; Martini, L.; Chen, Z.; Mishra, N.; Convertino, D.; Coletti, C.; Narita, A.; Feng, X.; Müllen, K.; Affronte, M. High Photoresponsivity in Graphene Nanoribbon Field-Effect Transistor Devices Contacted with Graphene Electrodes. J. Phys. Chem. C 2017, 121, 10620–10625. [Google Scholar] [CrossRef]
  28. Ma, C.; Xiao, Z.; Puretzky, A.A.; Wang, H.; Mohsin, A.; Huang, J.; Liang, L.; Luo, Y.; Lawrie, B.J.; Gu, G.; et al. Engineering edge states of graphene nanoribbons for narrow-band photoluminescence. ACS Nano 2020, 14, 5090–5098. [Google Scholar] [CrossRef]
  29. Cai, J.; Ruffieux, P.; Jaafar, R.; Bieri, M.; Braun, T.; Blankenburg, S.; Muoth, M.; Seitsonen, A.P.; Saleh, M.; Feng, X.; et al. Atomically precise bottom-up fabrication of graphene nanoribbons. Nature 2010, 466, 470–473. [Google Scholar] [CrossRef]
  30. Huang, H.; Wei, D.; Sun, J.; Wong, S.L.; Feng, Y.P.; Neto, A.H.C.; Wee, A.T.S. Spatially Resolved Electronic Structures of Atomically Precise Armchair Graphene Nanoribbons. Sci. Rep. 2012, 2, 983. [Google Scholar] [CrossRef]
  31. Vo, T.H.; Shekhirev, M.; Kunkel, D.A.; Morton, M.D.; Berglund, E.; Kong, L.; Wilson, P.M.; Dowben, P.A.; Enders, A.; Sinitskii, A. Large-scale solution synthesis of narrow graphene nanoribbons. Nat. Commun. 2014, 5, 3189. [Google Scholar] [CrossRef]
  32. Narita, A.; Feng, X.; Müllen, K. Bottom-Up Synthesis of Chemically Precise Graphene Nanoribbons. Chem. Rec. 2015, 15, 295–309. [Google Scholar] [CrossRef]
  33. Abdurakhmanova, N.; Amsharov, N.; Stepanow, S.; Jansen, M.; Kern, K.; Amsharov, K. Synthesis of wide atomically precise graphene nanoribbons from para-oligophenylene based molecular precursor. Carbon 2014, 77, 1187–1190. [Google Scholar] [CrossRef]
  34. Basagni, A.; Sedona, F.; Pignedoli, C.A.; Cattelan, M.; Nicolas, L.; Casarin, M.; Sambi, M. Molecules–Oligomers–Nanowires–Graphene Nanoribbons: A Bottom-Up Stepwise On-Surface Covalent Synthesis Preserving Long-Range Order. J. Am. Chem. Soc. 2015, 137, 1802–1808. [Google Scholar] [CrossRef] [PubMed]
  35. Narita, A.; Wang, X.Y.; Feng, X.; Mullen, K. New Advances in Nanographene Chemistry. Chem. Soc. Rev. 2015, 44, 6616–6643. [Google Scholar] [CrossRef] [PubMed]
  36. Son, Y.W.; Cohen, M.L.; Louie, S.G. Energy gaps in graphene nanoribbons. Phys. Rev. Lett. 2006, 97, 216803. [Google Scholar] [CrossRef]
  37. Shemella, P.; Zhang, Y.; Mailman, M.; Ajayan, P.M.; Nayak, S.K. Energy gaps in zero-dimensional graphene nanoribbons. Appl. Phys. Lett. 2007, 91, 042101. [Google Scholar] [CrossRef]
Figure 1. Stick-and-ball representation of graphene nanoribbons and graphene nanoflakes. Left panels, from top to bottom: armchair, zigzag, and chevron nanoribbons. Right panels, from top to bottom: hammer (9,7), hammer (8,7), cutter, and pencil nanoflakes cut from armchair nanoribbons.
Carbon 10 00005 g001
Figure 2. Properties of graphene nanoribbons with different widths n. Data are reported in red, green, and blue for the n = 3 p + 1 , n = 3 p + 2 , and n = 3 p families, respectively. Top panel: energy gaps; middle panel: formation energies (also called edge energies); bottom panel: variation in the optimized unit cell length of AGNRs with respect to an orthorhombic supercell of graphene with L = 4.29 Å and hosting four C atoms per unit cell.
Carbon 10 00005 g002
Figure 3. Left panel: Formation energies (see Equation (2)) of a (13,10) nanoflake relative to the standard 1:1 carbon-to-hydrogen saturation. All of the possible H saturations of the caps were taken into account by varying either the number of CH 2 groups or their positions. The number of CH 2 groups at each cap is reported in the abscissas. Right panel: formation energies of the most stable conformations of AGNF(11,20), AGNF(13,20), and AGNF(15,20)—in red, green, and blue, respectively—with three different stoichiometries, where the number of CH 2 groups at each cap is reported in the abscissas. Data interpolation with parabolas is intended as a guide for the eye. The minima of the parabolas are evidenced with vertical arrows.
Carbon 10 00005 g003
Figure 4. Density of states of the AGNF(13,m) series ( m = 10 26 ) (in shades of gray), plus the DOS of the infinite AGNR(13) ribbon (depicted in red). The data are shifted according to the length of the flake; the smaller m is, the larger the vertical shift is and the lighter the curve is. In all systems, we adopted the most stable saturation stoichiometry with two CH 2 groups at each cap and the most stable conformation of hydrogens, i.e., I_V_I_I_V_I.
Carbon 10 00005 g004
Figure 5. Density of states of AGNF(13,20) with two CH 2 groups on each cap. All of the different positions of double H saturations are considered. The larger the vertical shift of the DOS, the less stable the corresponding conformation and the lighter the shade of gray. Note that in the most stable configuration, the HOMO–LUMO separation of the flake became slightly larger than the gap of AGNR(13), whose DOS is depicted in red.
Carbon 10 00005 g005
Figure 6. Density of states of AGNF(13,20) with one (top panel), two (middle panel), and three (bottom panel) CH 2 groups on each cap. For each stoichiometry, we report only the most stable conformation of hydrogens. In the top and bottom panels, the majority and minority spin components are reported in blue and green, respectively, while the DOS of the non-spin-polarized solution is reported in gray. In the middle panel, where the minimum energy solution presents no spin polarization, we report the total DOS in blue. The three insets show the electron density of the occupied state of the majority spin component with the highest energy.
Carbon 10 00005 g006
Figure 7. Left panel: formation energies (see Equation (2)) of a (10,10) nanoflake relative to the standard 1:1 carbon-to-hydrogen saturation. All of the possible H saturations of the caps are taken into account by varying either the number of CH 2 groups or their position. The number of CH 2 groups at each cap is reported in the abscissas. Right panel: formation energies of the most stable conformations of AGNF(8,20), AGNF(10,20), and AGNF(12,20)—in red, green, and blue, respectively—with three different stoichiometries, where the number of CH 2 groups at each cap is reported in the abscissas. Data interpolation with parabolas is intended as a guide for the eye. The minima of the parabolas are evidenced with vertical arrows.
Carbon 10 00005 g007
Figure 8. Schematic representation of the most stable C–H terminations at the caps in AGNF(n,m), where n is reported at the edges of the plot and ranges from 9 to 32. Saturation of the CH 2 type is evidenced by a V symbol; otherwise, the termination is CH. Red V symbols represent alternative positions of CH 2 groups within 5 meV from the lowest-energy conformation. Blue horizontal bars indicate single hydrogen atoms bonded to carbon at the smooth corners between edges and caps.
Carbon 10 00005 g008
Figure 9. Gibbs free energy of AGNF(13,20)—left panel—and AGNF(11,20)—right panel—at varying partial pressures of molecular hydrogen (top axes, in bar) at the temperature of 300 kelvin. Colored lines correspond to different saturation stoichiometries; each one was computed in the conformation with the lowest energy. Vertical bars separate the ranges of stability of different stoichiometries.
Carbon 10 00005 g009
Disclaimer/Publisher’s Note: The statements, opinions and data contained in all publications are solely those of the individual author(s) and contributor(s) and not of MDPI and/or the editor(s). MDPI and/or the editor(s) disclaim responsibility for any injury to people or property resulting from any ideas, methods, instructions or products referred to in the content.

