Abstract
With global climate challenges intensifying, the cement industry, as a major CO2 emitter, has attracted significant attention regarding its emission reduction potential and strategies. Advanced economies like the European Union use carbon pricing to spur innovation, while emerging countries focus on incremental solutions, such as fuel substitution. Combining LMDI decomposition and the LEAP model, this study examines Jiangsu Province as a test bed for China’s decarbonization strategy, a highly efficient region with carbon intensity 8% lower than the national average. Historical analysis identifies carbon intensity, energy mix, energy intensity, output scale, and economic effects as key drivers of emission changes. Specifically, the reduction in cement production, real estate contraction, lower housing construction, and reduced production capacity are the main factors curbing emissions. Under an integrated technology strategy—including energy efficiency, fuel and clinker substitution, and CCS—CO2 emissions from Jiangsu’s cement sector are projected to decrease to 17.28 million tons and 10.9 million tons by 2060 under high- and low-demand scenarios, respectively. Clinker substitution is the most significant CO2 reduction technology, contributing about 60%, while energy efficiency gains contribute only 3.4%. Despite the full deployment of existing reduction methods, Jiangsu’s cement industry is expected to face an emissions gap of approximately 10 million tons to achieve carbon neutrality by 2060, highlighting the need for innovative emission reduction technologies or carbon trading to meet carbon neutrality goals.
1. Introduction
The Sixth Assessment Report by the Intergovernmental Panel on Climate Change (IPCC) establishes a definitive link between escalating global temperatures and anthropogenic-induced extreme weather phenomena [1]. The ‘Paris Agreement’, ratified in 2015 by the international community, sets an ambitious target to cap the global temperature rise at 1.5–2 °C by the end of this century [2]. Achieving this goal requires carbon-intensive industrial sectors to significantly reduce their emissions [3]. The cement industry, which is responsible for approximately 8% of the world’s CO2 emissions, contributes roughly 4% to the global emissions from fossil fuel combustion [4,5]. Global carbon emissions in the cement sector exhibit significant geographical disparities. China, accounting for 57% of global emissions and 54% of production, has a carbon intensity of 0.64 t CO2/ton, better than India (0.78) but worse than the EU (0.61). Developed regions like the EU foster technological innovation via carbon pricing (EU ETS > 80 euros/ton), while emerging economies focus on fuel substitution for marginal emission reductions [6]. This gradient is exemplified by Jiangsu, China’s leading province in energy efficiency (with a carbon intensity 8% below the national average), whose emission reduction pathway offers valuable insights for developing countries.
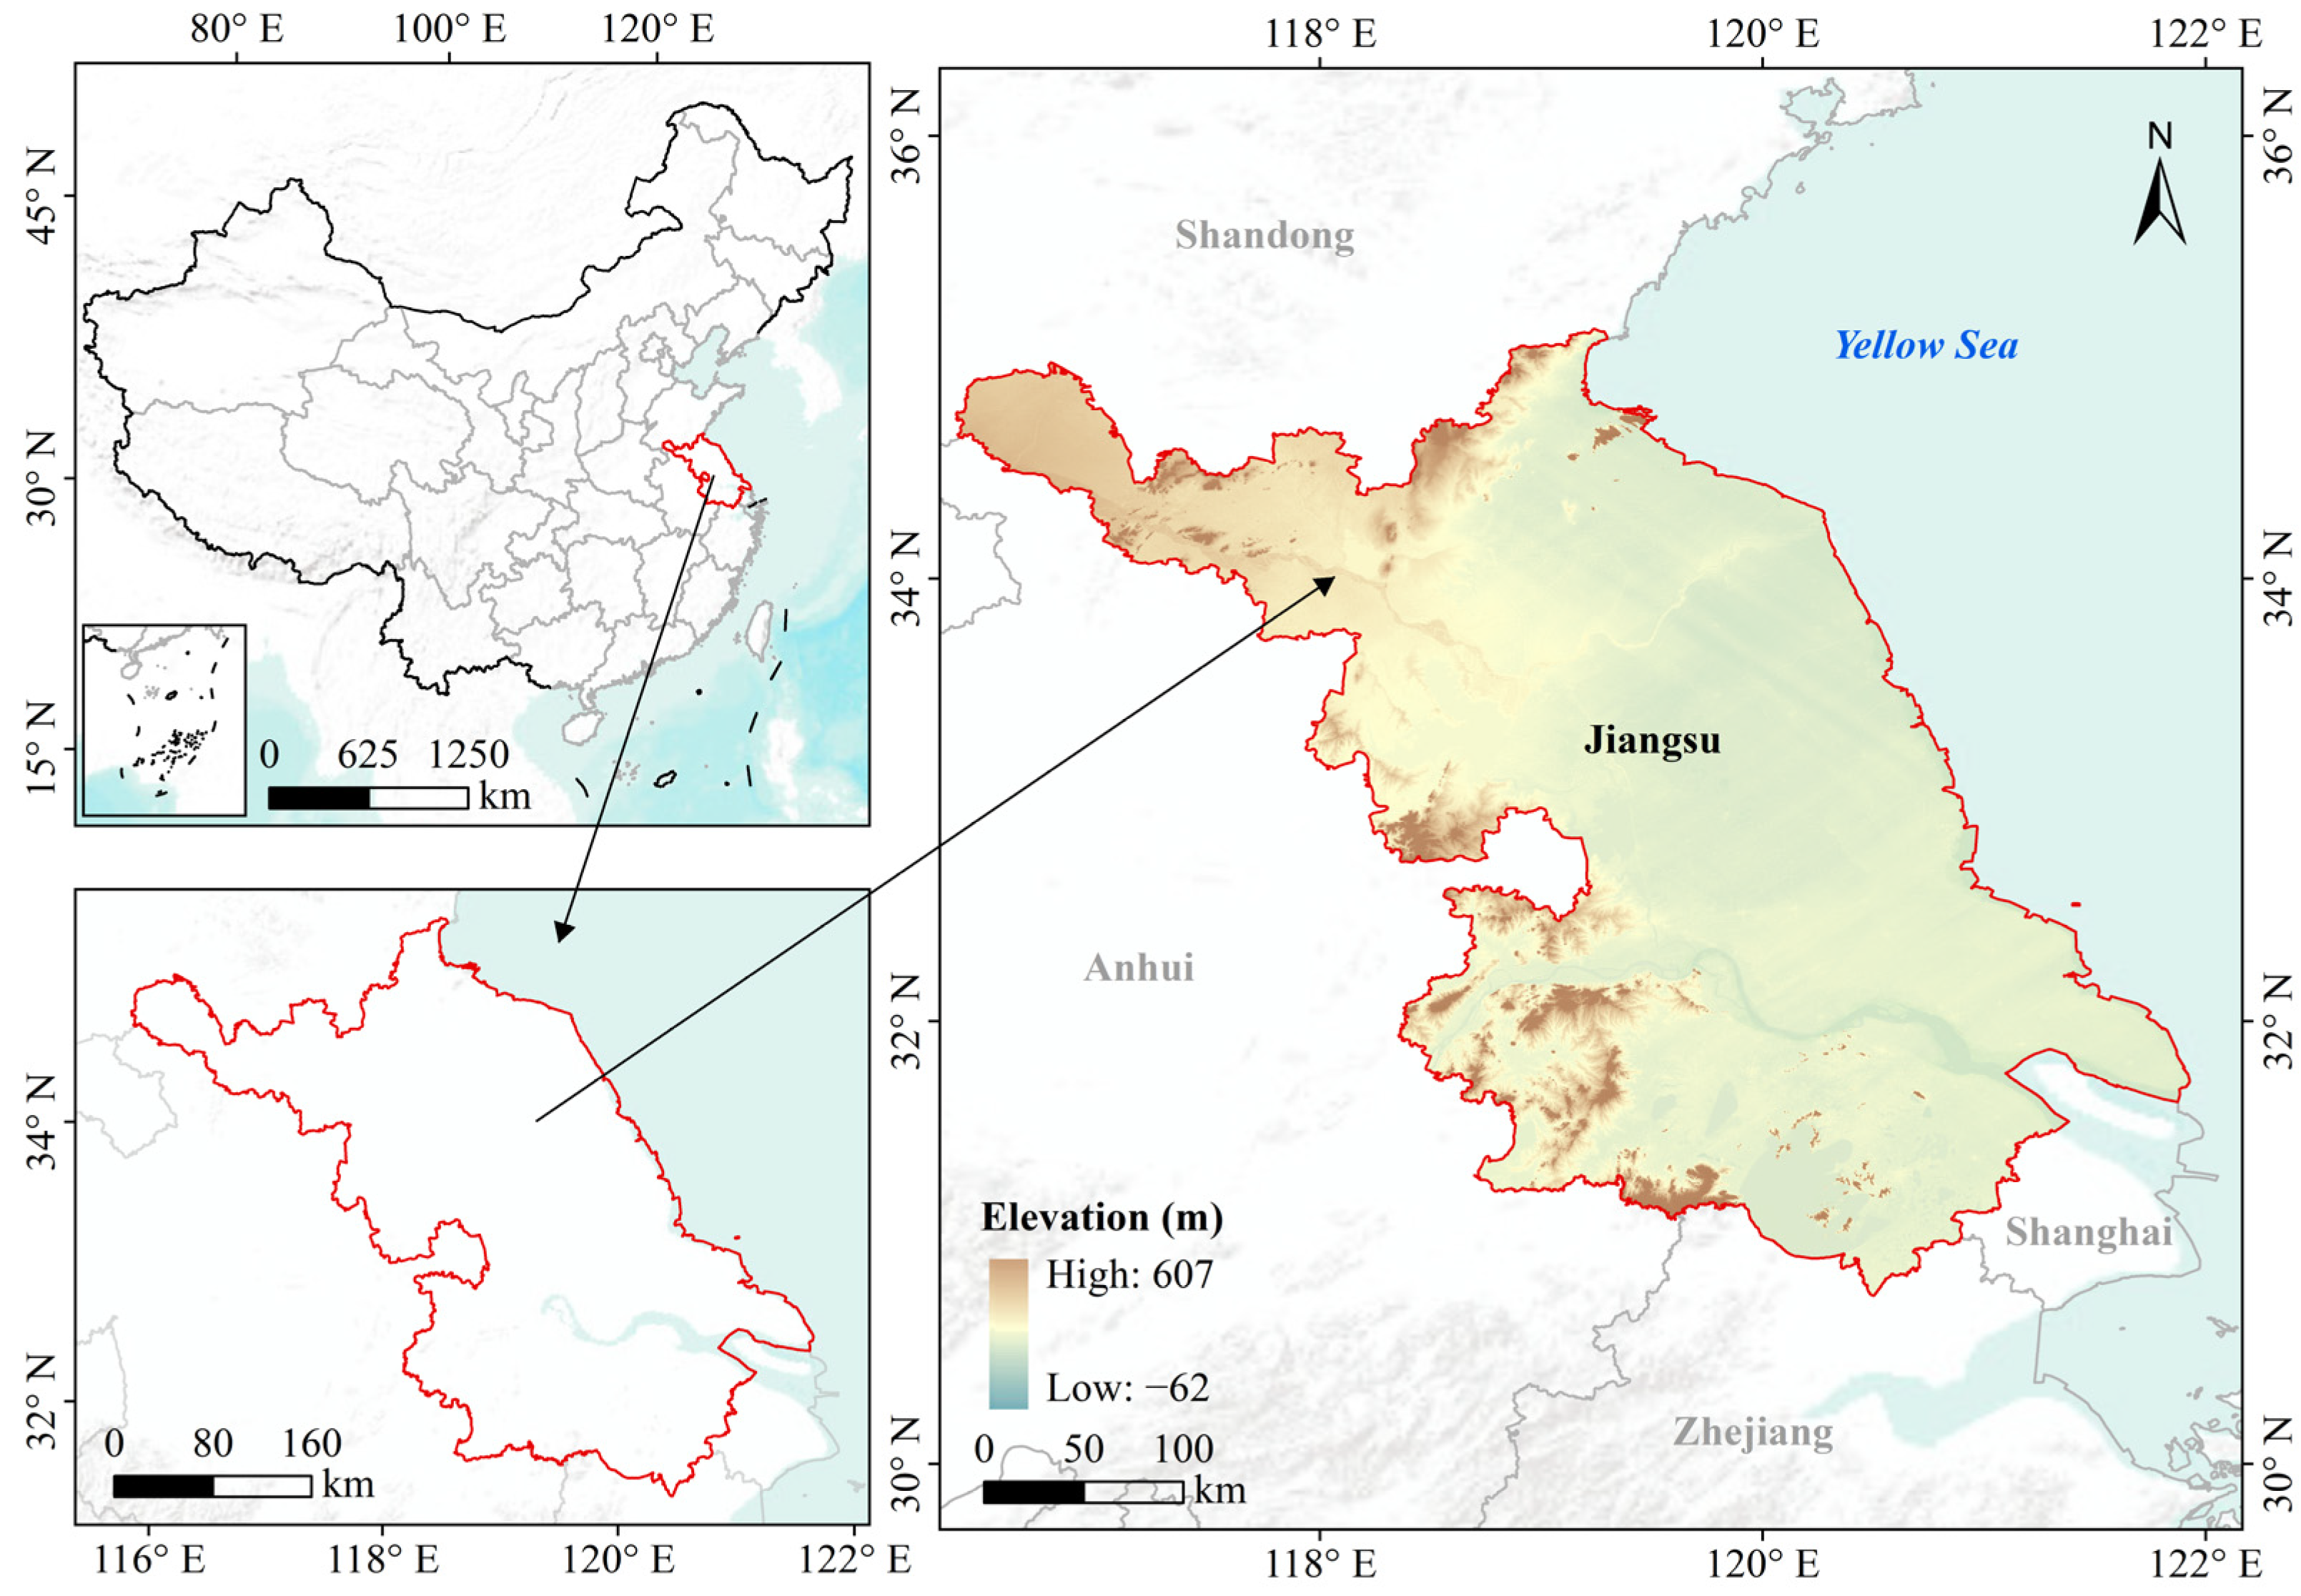
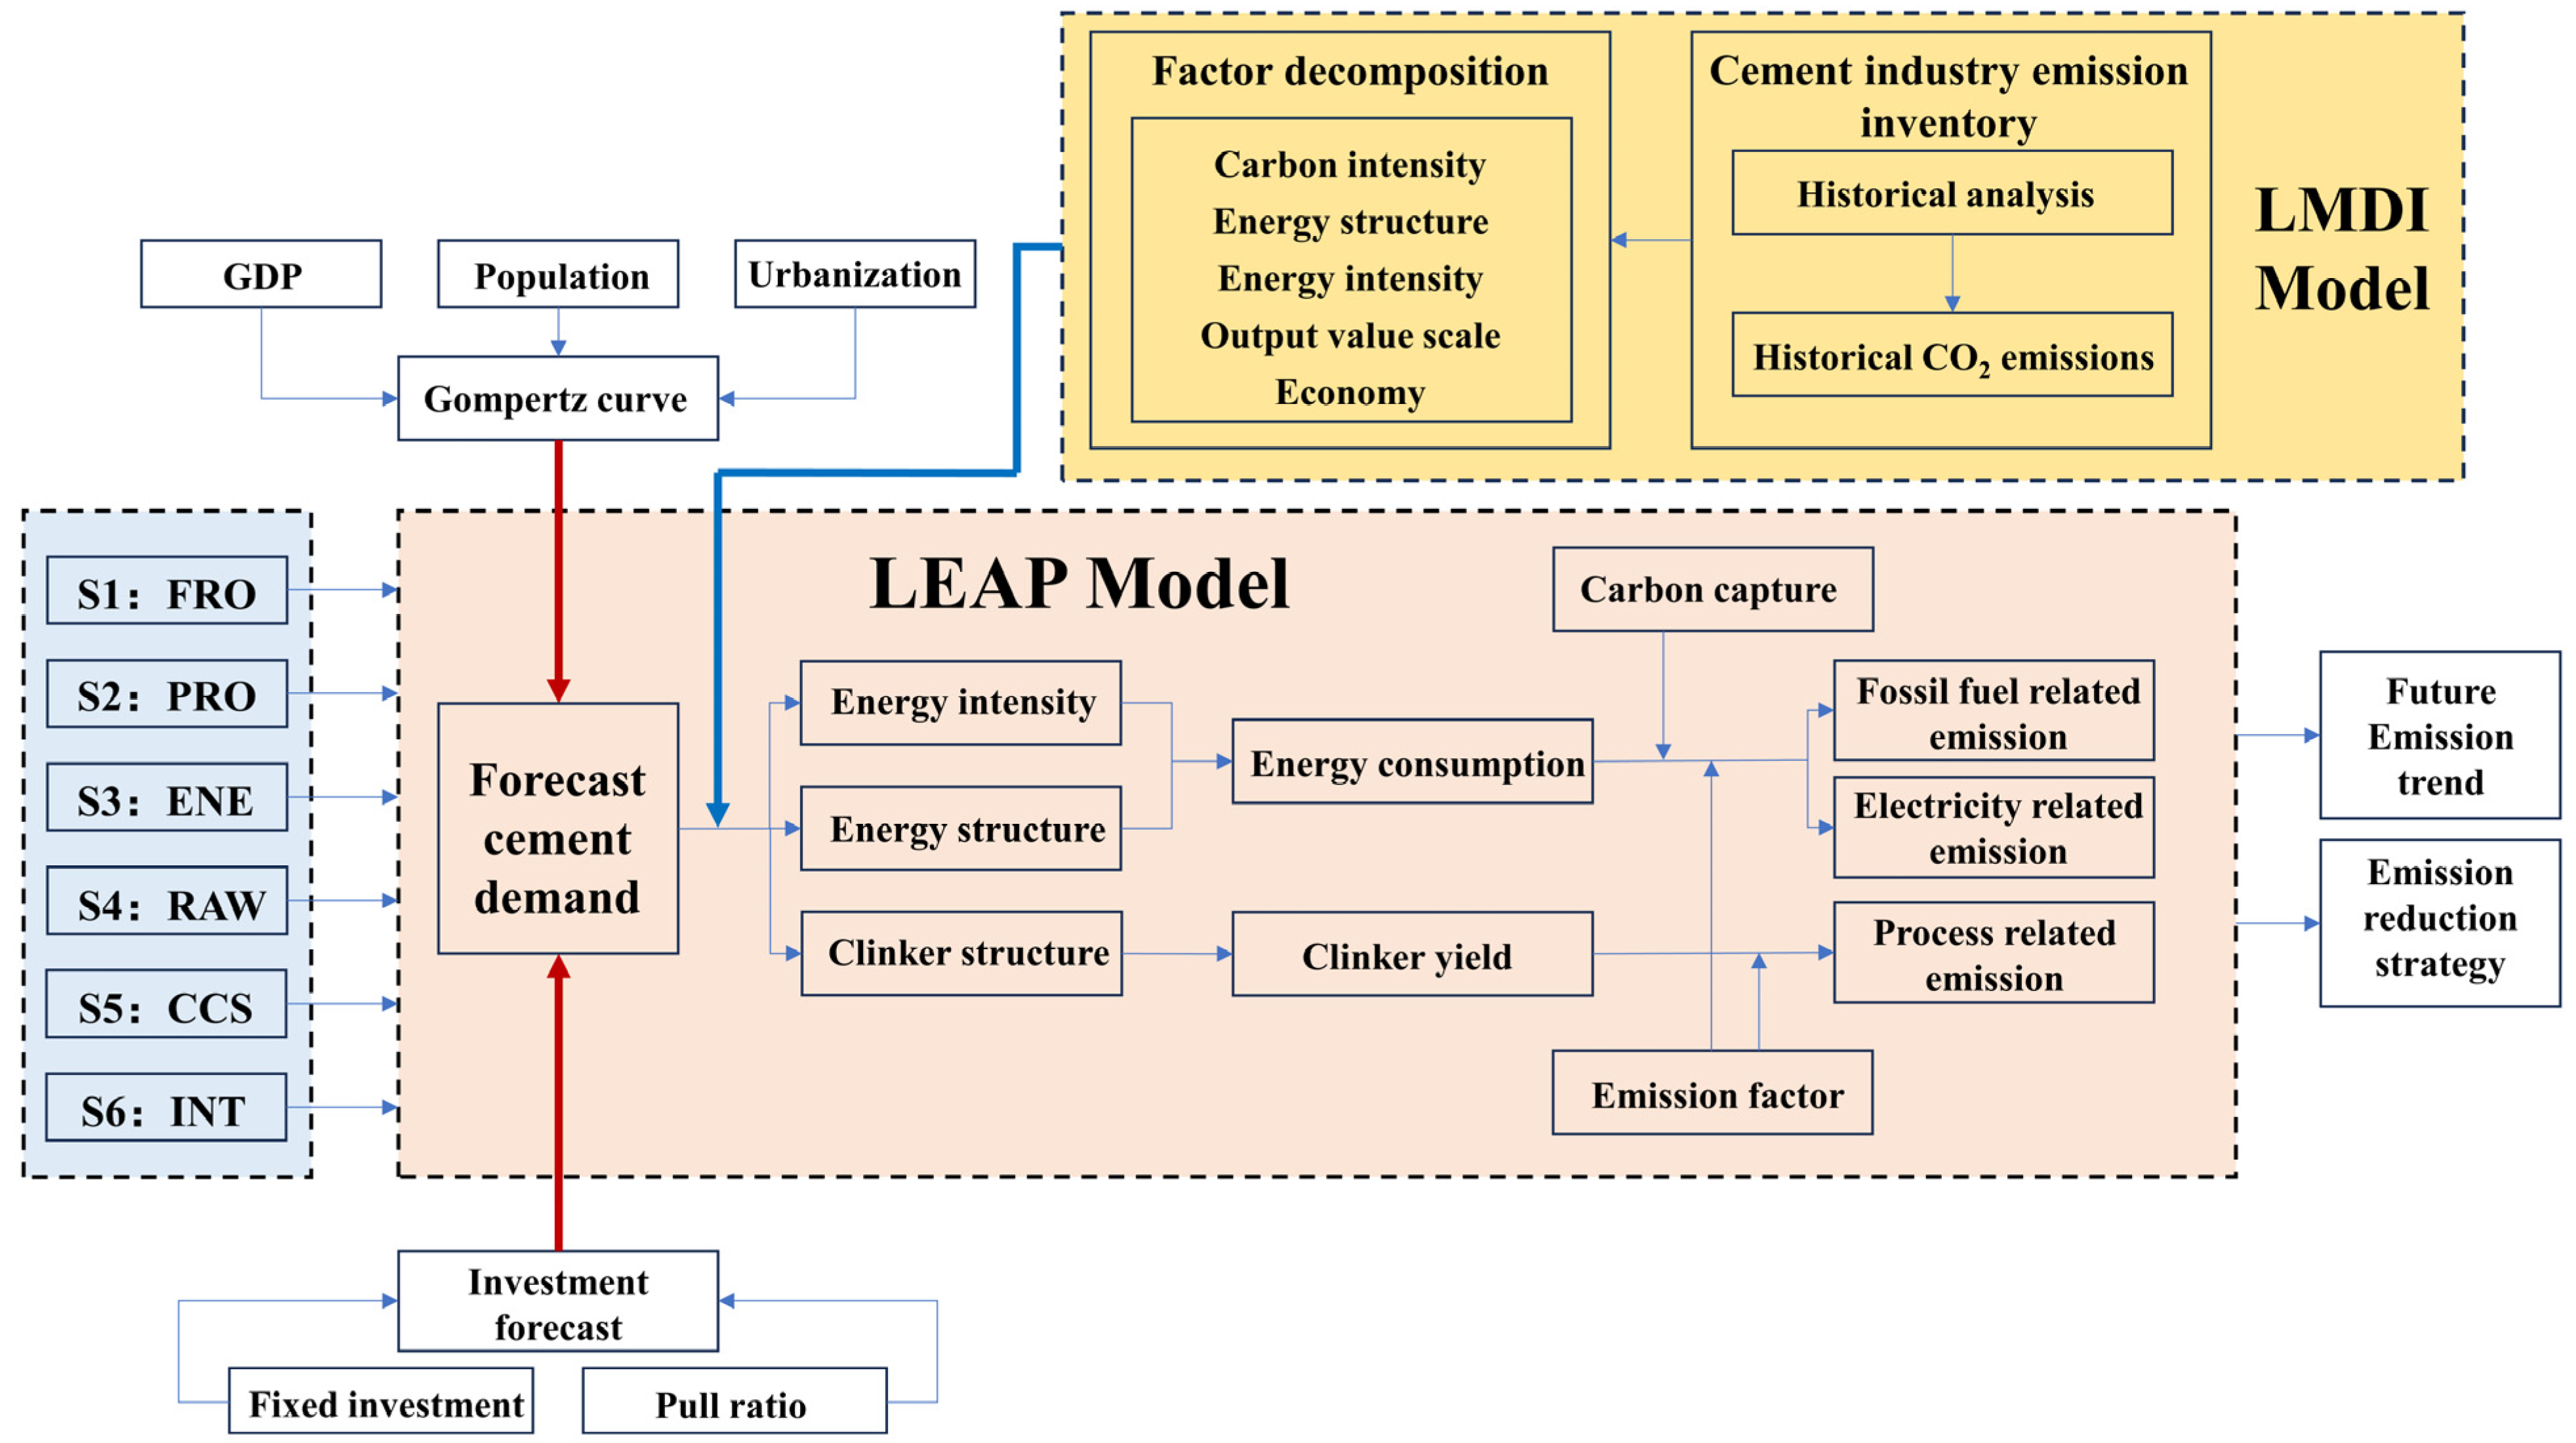
Recent studies on carbon emissions from the cement sector (Table 1) show significant regional differences. In the US and EU, research focuses on CCS technology and carbon-trading economics [7,8]. Brazil uses bagasse ash (SCBA) as a cement substitute, while India emphasizes demand-side management due to overcapacity [9,10]. In China, studies highlight the link between urbanization and infrastructure investment, analyzing emission drivers and reduction potential, with some incorporating uncertainty and cost analysis [11]. Among them, LMDI decomposition, TAPIO decoupling model, STIRPAT model, etc., [12,13,14,15] are used to analyze the driving factors of carbon dioxide emissions and their impact characteristics. Notably, Lin and Zhang [16] applied LMDI decomposition to analyze changes in CO2 emissions in China’s cement industry from 1991 to 2010, focusing on five determinants aligned with the five-year economic plans. Their findings indicated that labor productivity was the primary factor driving CO2 emission increase, whereas energy intensity served as the main contributor to emission reductions. Carbon emission forecasting in the cement industry predominantly relies on bottom–up scenario analysis models [17,18,19,20,21], with the LEAP model being the most frequently applied [22,23]. Tan et al. [24] developed a G-LEAP model to project future carbon emissions and evaluate emission reduction potential in China’s cement industry through combined technologies. The study revealed that enhanced energy efficiency and fuel substitution could yield approximately 10% and 20% reductions in the short term, respectively, while clinker substitution accounted for 30–39% of cumulative reductions, and carbon capture technologies contributed 28–44%. However, most studies on carbon emissions in the cement sector are limited to national-level analyses and rely on single-model approaches. Moreover, these studies often cover brief data periods, typically focusing either on historical factors or solely on future emission trends. Accurately predicting the cement industry’s future carbon emissions requires broadening the data period and analyzing historical emission factors. Cement production is constrained by raw material availability, economic conditions, and policies, with regional characteristics influenced by a limited transport radius of 200–300 km, highlighting the need for provincial and municipal analysis. In 2023, Jiangsu Province produced 142 million tons of cement, ranking second nationally. As China’s second-largest economic province, it contributed 10.2% to the national GDP (12.8 trillion RMB in 2023). With a population of 85.4 million and an urbanization rate of 74.6%, Jiangsu’s robust industrial sector drives significant infrastructure demand. Positioned as a key transportation hub in the Yangtze River Delta, the province hosts China’s high-emission industrial base and cement carbon capture pilot projects, providing a crucial platform for large-scale decarbonization (Figure 1). Furthermore, Jiangsu aims to peak emissions by 2029, five years ahead of the national target. Thus, research on CO2 emissions from Jiangsu’s cement industry will not only support the province’s low-carbon transition but also offer valuable insights for emission reduction strategies nationwide. Therefore, the integration of LMDI and LEAP models has been utilized in this research to estimate carbon emissions from Jiangsu Province’s cement industry, as shown in Figure 2. In the LMDI framework, the historical driving factors behind cement industry emissions in Jiangsu Province were quantitatively analyzed using the improved Kaya identity and LMDI method, with these data informing the LEAP model’s module construction. The initial analysis of the historical CO2 emissions driver in Jiangsu Province’s cement industry was conducted using the modified Kaya identity and LMDI method. In combination with existing research and current policy documents, the fixed-asset investment method and the Gompertz model are employed to forecast cement demand in Jiangsu Province from 2022 to 2060, forming high- and low-demand scenarios. Subsequently, The LEAP model is then used to establish energy efficiency improvement, fuel substitution, raw material substitution, carbon capture technology application, and technology integration scenarios under cement output projections from different demand scenarios. By adjusting parameters including energy intensity, energy mix, and raw material composition, this allows for the analysis of carbon emissions across different scenarios from 2022 to 2060, quantifying the CO2 reduction contributions of each technology and assessing their emission reduction potential. Ultimately, this study presents concrete strategy recommendations for the future low-carbon development of the cement industry, based on the composite model’s prediction outcomes.

Table 1.
Relevant literature.
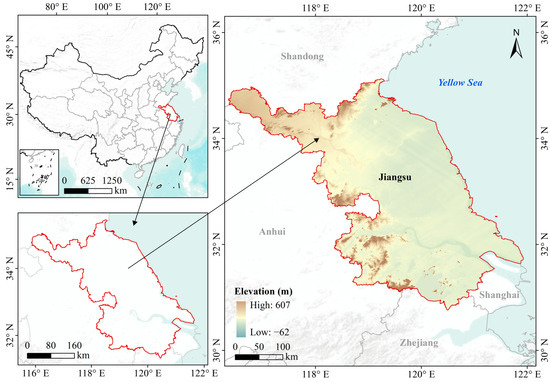
Figure 1.
Geographical area map of Jiangsu Province.
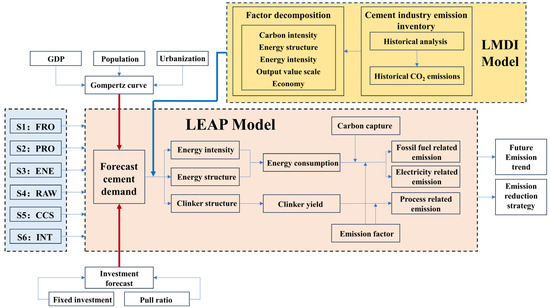
Figure 2.
LMDI-LEAP composite model logic diagram.
2. Methods and Data
2.1. CO2 Emissions Inventory of Cement Industry
CO2 emissions in the cement industry are broken down into three main components: those associated with fossil fuels, those tied to electricity consumption, and those linked to production processes [25]. The following formulae are applied to calculate the emissions for each component:
where stands for emissions linked to fossil fuels, for those linked to electricity, and links to the manufacturing process, respectively. The activity data is the consumption of fuel i, expressed as calorific value, denotes the production of cement clinker, indicates the electricity purchased for clinker production, and represents the electricity purchased for cement preparation. The combined emission factor for fossil fuel i is represented by the product of (Low calorific value), (Carbon content per unit calorific value), and (Carbon oxidation rate). Emission factors for electricity production are and , while is for clinker production.
is from Carbon Emission Accounts and Datasets [26,27]; and are from the “China Energy Statistical Yearbook 2022” [28]; is from the “Guidelines for the Preparation of Provincial Greenhouse Gas Inventories [29]. Cement production and building-materials industry GDP are from the “Statistical Yearbook of Jiangsu Province 2012–2022” [30]. For , data for 2012–2016 are from CEADs, and 2017–2022 data are from the cement clinker production line list issued by the Jiangsu Provincial Department of Industry and Information Technology [31]. Coal and electricity consumption per ton of cement production are from the “Nanjing Statistical Yearbook 2012–2022 [32].
2.2. LMDI Model Construction
The Kaya identity, initially presented at the IPCC, emphasized the influence of economic, policy, and demographic factors on environmental conditions [33]. It is expressed as follows:
In Equation (4), represents total CO2 emissions; E denotes total energy consumption; GDP stands for gross domestic product; and POP represents the total population.
The Kaya identity indicates that carbon emissions result from a variety of factors, including but not limited to energy consumption, economic activity, energy efficiency, and the energy mix [34]. Ang et al. [35,36] provided a comprehensive introduction to various decomposition methods and compared their respective advantages and disadvantages. Among these, the LMDI method is widely used due to its low data requirements, absence of residual error, and the strong correlation between the results of additive and multiplicative decomposition. To dissect the energy consumption and CO2 emissions in Jiangsu Province’s cement industry, a modified version of the Kaya identity that accounts for its sector-specific features was applied in this work, which is expressed as follows:
The definition of parameters in Equation (5) can refer to Table 2.
Table 2.
Definition of parameters in the modified Kaya identity.
Moreover, define as the CO2 emissions for the base period, as the CO2 emissions for the target year t, and as the total change in CO2 emissions. According to Ang’s LMDI additive decomposition model [35,36], can be decomposed into the sum of contributions of various factors, and , , , , can be calculated, respectively, as shown in Equations (6)–(11):
is the logarithmic mean, which is calculated as follows:
2.3. Cement Demand Forecast
The fundamental basis for efforts to reduce pollutants and carbon emissions lies in the scientific prediction of future cement demand. This study develops high-demand and low-demand forecast scenarios by integrating policy, population, GDP, and existing research, employing both the fixed-asset investment method and the per capita saturated cement consumption method.
2.3.1. Fixed-Asset Investment Method Forecast
The cement industry experiences a relatively stable downstream demand composition over the long term, stemming mainly from sectors like real estate, infrastructure construction, manufacturing fixed-asset investment (including plant construction), and rural fixed-asset investment. Although the composition of each sector varies from year to year, the real estate and infrastructure construction sectors together account for a larger portion of the market, approximately 80 to 85%. Some studies have predicted the cement demand through the cement consumption and cement proportion of real estate construction [22]. The cement industry demonstrates pronounced cyclicality, closely linked to policies, economic conditions, and market demand. Fixed-asset investment directly reflects policy-driven infrastructure budgets and private-sector construction activity. This approach has been validated in provincial cement demand forecasting, capturing both government-led initiatives (e.g., urban renewal) and market-driven housing demands [3]. Thus, the research selects the fixed-asset investment method to forecast cement demand in Jiangsu Province. The data for fixed asset investment and cement demand are derived from the “Statistical Yearbook of Jiangsu Province” [30].
Historical data on cement production and fixed-asset investment completion in Jiangsu Province from 2000 to 2022 were analyzed using linear regression. The ratio of these two variables was defined as the driving coefficient . Consequently, the formula for calculating per capita cement demand is as follows:
where represents the cement demand in year t; denotes the amount of investment in fixed assets completed during the same year t; is the pushing coefficient, which reflects the impact of other factors on cement demand; is the growth rate of fixed-asset investment in year t, indicating the change in investment from the previous year.
2.3.2. Per Capita Saturated Cement Consumption Method Forecast
The Gompertz model, a biostatistical model, is widely used to effectively describe the growth or decline of populations over time and is extensively applied in the fields of biology, demography, and economics. Studies show that China’s per capita cement consumption (CCPC) follows an S-shaped growth pattern [3,37], which is characterized by rapid expansion in its initial phase, followed by saturation during the middle phase, and ending with a slow decline in its final phase. The Gompertz model accounts for several factors, namely population growth rate, urbanization rate, and per capita GDP, in its analysis. It is assumed in this study that the saturation level for cement demand per capita is 2200 kg, and for the urbanization rate in Jiangsu Province, it is 85% [38]. The specific formula for the Gompertz model is presented in Equation (14):
According to the equation, is the per capita cement demand for year t; is the per capita cement consumption saturation level, which is 2200 kg; is the urbanization rate of Jiangsu Province in year t; is the urbanization saturation rate for Jiangsu Province, at 85%; is the per capita GDP level for year t; reflects the impact of the urbanization rate on per capita cement consumption; is the adjustment factor for the time series, showing how the previous year’s per capita cement consumption affects the next year’s; and capture the impact of per capita GDP on per capita cement consumption.
The projection of future per capita cement demand in Jiangsu Province for the period 2021 to 2060 was based on historical data from 1996 to 2021, with the population growth rate, urbanization rate, and GDP growth rate being considered, as listed in Table 3. Based on the “14th Five-Year New Urbanization Plan of Jiangsu Province”, it is anticipated that the urbanization rate for permanent residents in Jiangsu Province will exceed 75% by 2025 and is projected to reach approximately 80% by 2035 [39]. GDP growth and population expansion forecasts are consistent with the IEA’s “Technology Roadmap: Low-carbon transition in the cement industry”, as well as with pertinent academic sources and official records [40].
Table 3.
Forecast of population growth rate, urbanization rate, and GDP growth rate in Jiangsu Province from 2025 to 2060.
2.4. CO2 Emissions Prediction
2.4.1. Per Capita Saturated Cement Consumption Method
The LEAP model is a comprehensive tool for long-term energy policy analysis and climate change mitigation assessment [41], widely applied across industries such as transportation [42,43,44], construction [45,46], electric power [47,48,49,50], and cement [51,52]. The LEAP model’s versatility lies in its dual “bottom-up” and “top-down” modeling approach, enabling detailed analysis of the economy, energy, and environmental impacts [53]. It is structured as a four-tier hierarchical tree, encompassing sectors, subsectors, end-uses, and emissions. One of the key advantages of the LEAP model is its relatively low initial data requirements and user-friendly interface. Additionally, it includes a non-energy emissions module, which effectively reflects process-related emissions specific to the cement industry [24]. As such, based on historical emission drivers derived from LMDI decomposition, energy and output modules were established in the LEAP model. Combined with high- and low-demand cement output scenarios, this enabled prediction and analysis of CO2 emission trends in Jiangsu Province’s cement industry from 2022 to 2060. By designing various energy management and CO2 reduction scenarios, the model simulates future energy demand, conversion, and CO2 emission trajectories.
In this study, cement and clinker output were input as activity levels, and the energy consumption and CO2 emissions of the cement industry were obtained through the calculation built into the LEAP model, calculated as follows:
where is the energy consumption of cement industry sector i, tce; is the activity level of the j energy using equipment of the i department, t; is is the energy intensity corresponding to the activity level, tce/t.
CO2 emissions can be calculated according to Equation (16):
where is the emission factor of the i energy (t CO2/tce); is the cement industrial process emission (t CO2).
2.4.2. Emission Scenario and Parameter Setting
Improving energy efficiency, utilizing less carbon-intensive fuels, reducing clinker content in cement, and implementing carbon capture technologies are currently recognized as the four most effective strategies for emissions reduction, as detailed in the “Technology Roadmap: Low-carbon Transition in the Cement Industry” published by IEA [40]. By integrating the aforementioned high and low-demand cement outputs scenarios, six technology-related scenarios are set: the technology-frozen scenario (S1), the energy efficiency improvement scenario (S2), the fuel substitution scenario (S3), the feedstock substitution scenario (S4), the carbon capture technology application scenario (S5), and the technology integration scenario (S6). The S1 scenario posits that energy efficiency, energy mix, clinker ratio, and other factors will remain static from 2022 to 2060, with emission reductions progressing under existing policies. In the S2 scenario, the sole driver of carbon emission reduction is energy intensity, while other factors are constant. In the S3, S4, and S5 scenarios, only the fuel substitution ratio, clinker ratio, and carbon capture and storage (CCS) application ratio are varied, respectively. The S6 scenario combines all four CO2 emission reduction technologies. Parameter settings for each scenario are detailed in Table 4.
Table 4.
LEAP scenario parameter setting.
3. Results and Discussion
3.1. Historical CO2 Emissions Analysis of Cement Industry in Jiangsu Province
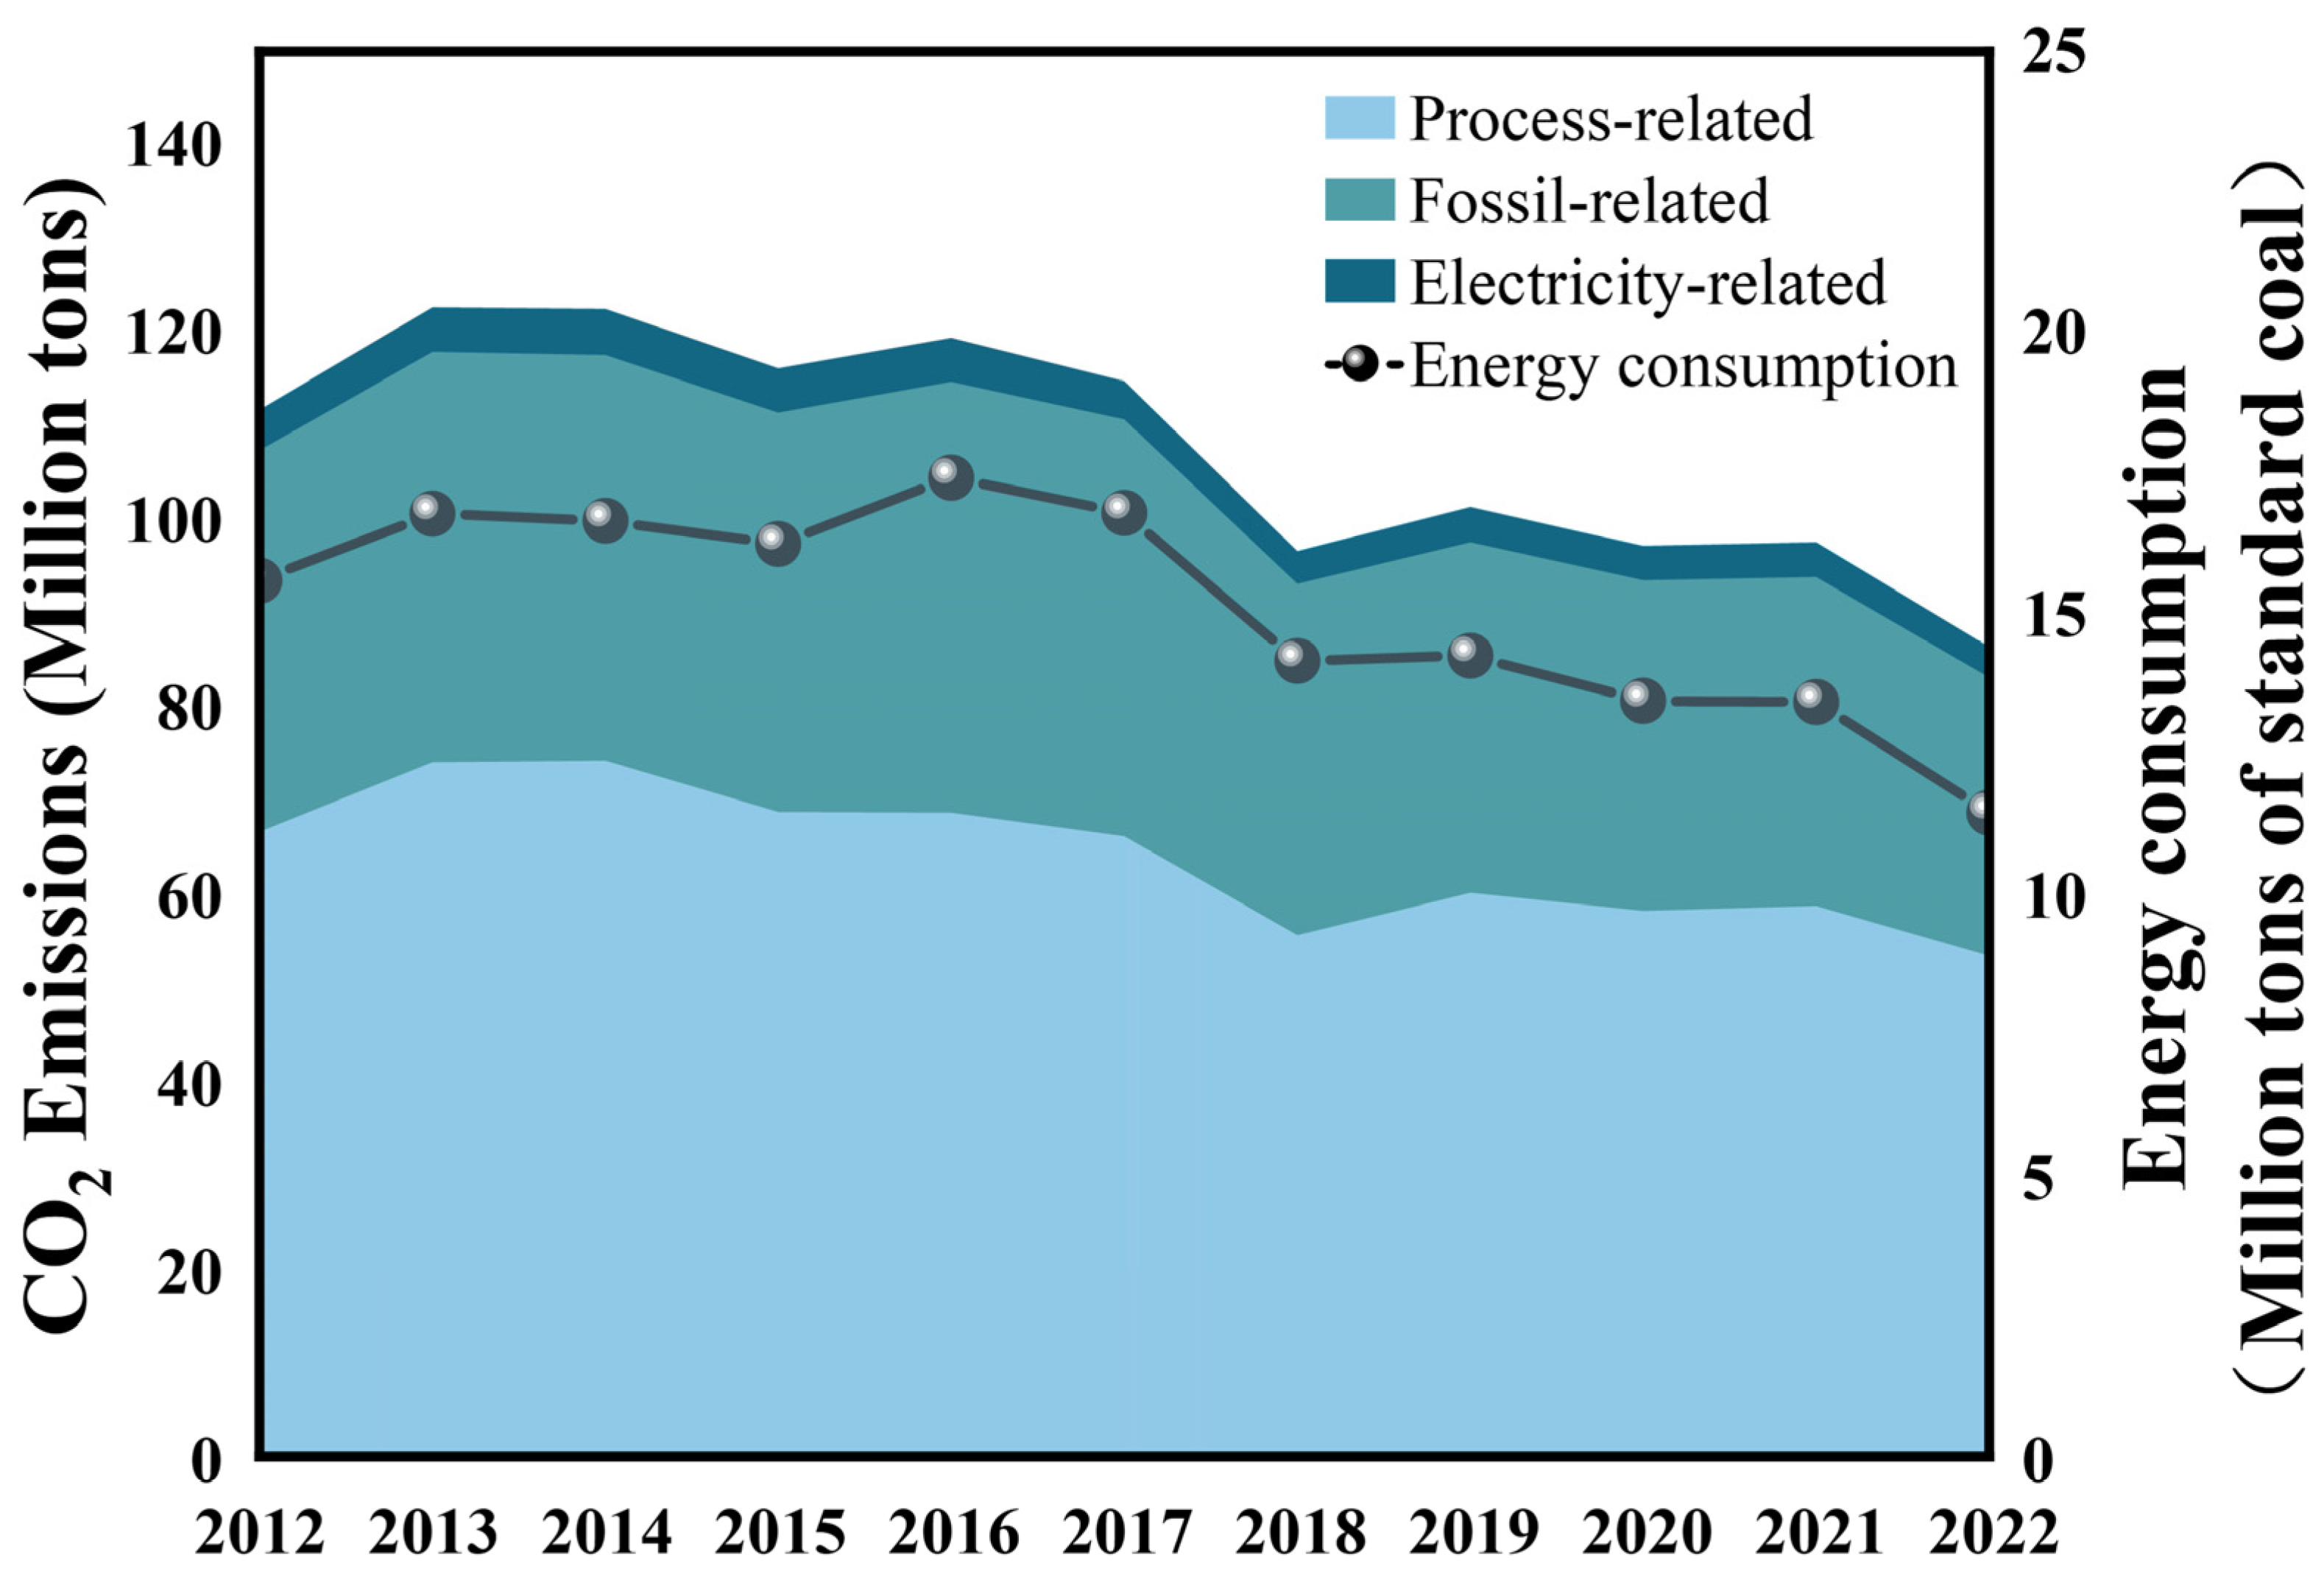
From 2012 to 2022, CO2 emissions and total energy consumption in Jiangsu Province’s cement industry initially increased before declining, peaking in 2014 and 2016, respectively (Figure 3). From 2012 to 2016, energy consumption and CO2 emissions grew at an average annual rate of 1% and 1.7%, respectively, driven by rapid urbanization and accelerated fixed-asset investment, which sustained high cement production levels. Between 2017 and 2022, these rates shifted to −4.5% and −4.9%, leading to a reduction in energy consumption by 5.34 Mtce, CO2 emissions by 28.37 Mt, and cement production by 31.24 Mt. This decline resulted from China’s transition to moderate economic growth, creating oversupply in the cement industry. Beginning in 2016, Jiangsu enforced stricter policies targeting high-energy industries, eliminating outdated production capacities and enhancing energy efficiency, achieving a 4.7% reduction in comprehensive energy consumption compared to 2012. During this period, energy consumption in the cement industry accounted for about 5–7% of Jiangsu’s total industrial energy consumption, lower than the national average of 11–12% [22]. It indicates that the “13th Five-Year Plan” intensified efforts in energy conservation, particularly targeting energy-intensive industries like cement, through stringent policies to further reduce unit energy consumption and enhance energy efficiency, yielding notable results in energy savings and emission reductions [31].
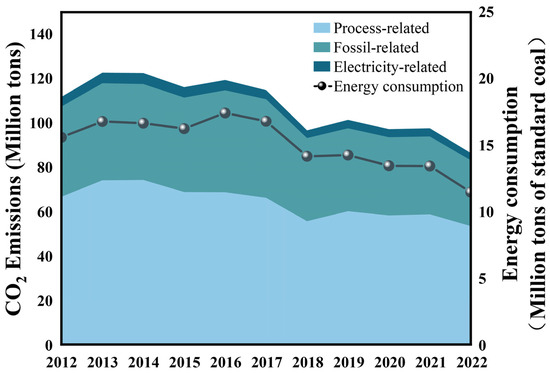
Figure 3.
The energy consumption and CO2 emissions of Jiangsu’s cement industry (2012–2022).
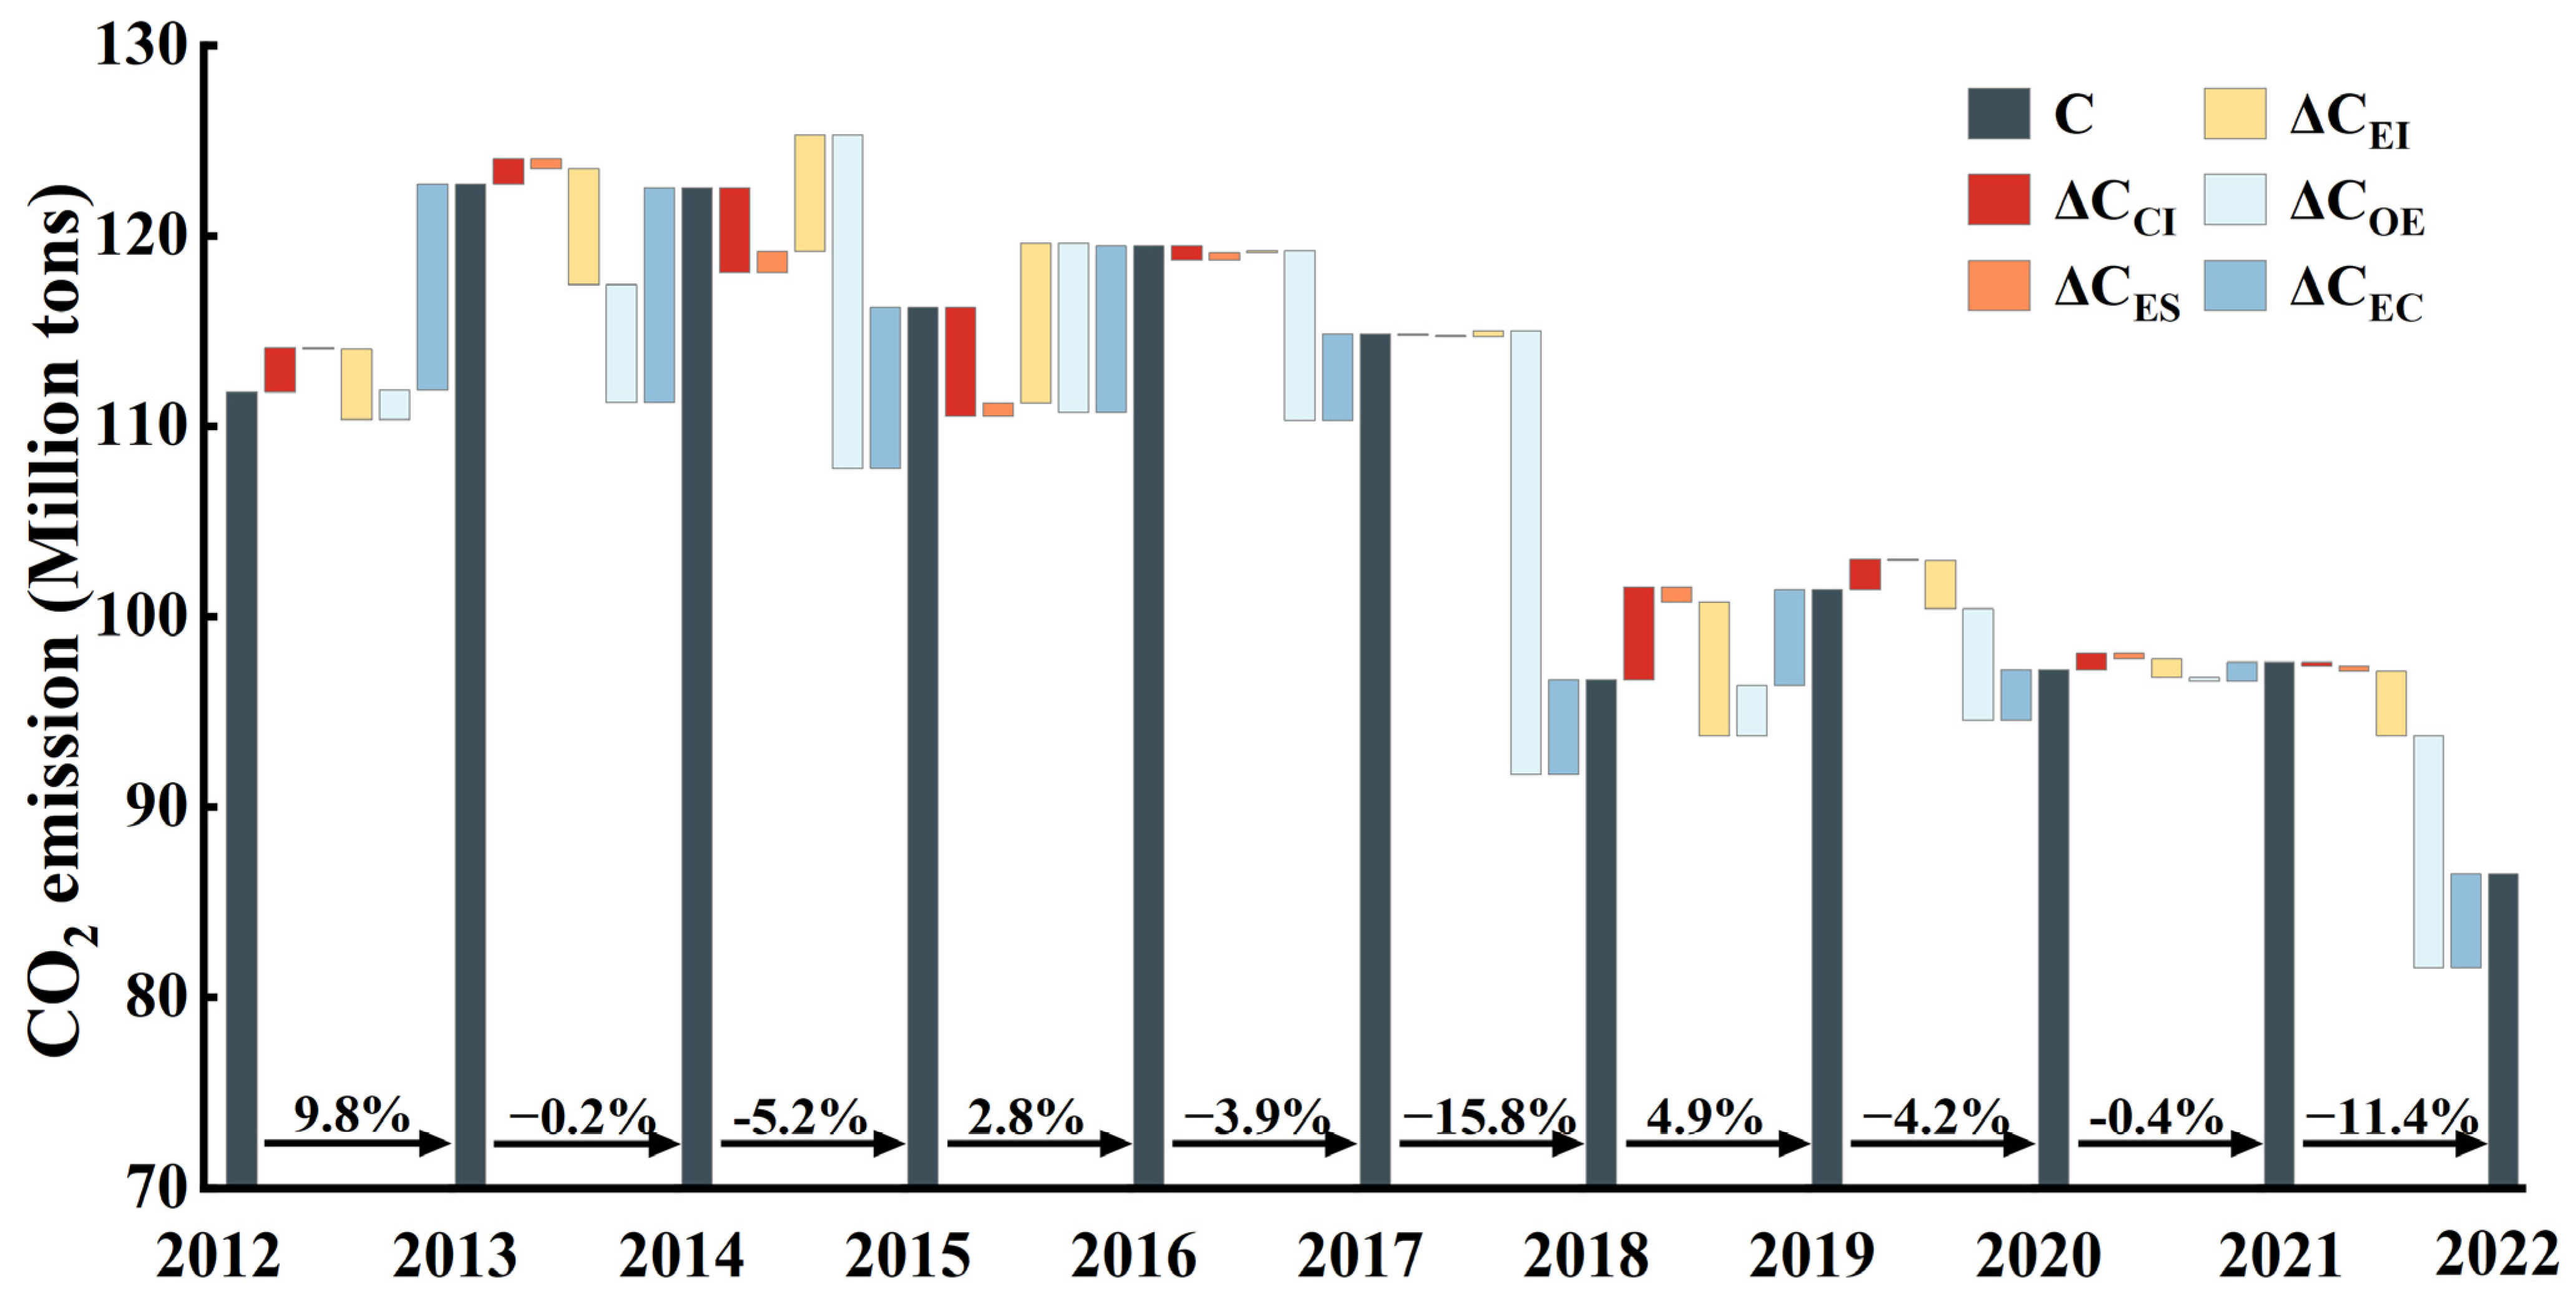
China’s cement industry is positively correlated with economic growth [17]. Since the reform and opening up, rapid economic expansion has driven an average annual growth rate of 10% in cement production, influenced by infrastructure development and real estate market reforms. However, as the infrastructure improved gradually, the cement industry’s high growth trend began to level off between 2015 and 2020 [14]. This study employs the LMDI method to analyze the driving factors influencing CO2 emissions in Jiangsu Province’s cement industry. The decomposition analysis reveals that carbon intensity, energy structure, energy intensity, output scale, and economic effect are the primary contributors to changes in carbon emissions. An in-depth analysis of each factor is presented below (Figure 4).
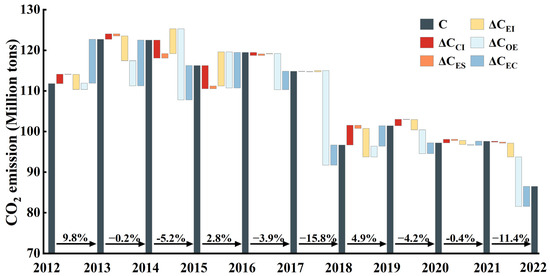
Figure 4.
Effects of driving forces for CO2 emissions increment in Jiangsu’s cement industry (the definition of the relevant parameters can be found in the nomenclature).
During the statistical period, trends towards a slight decline, cumulatively reducing emissions by 0.18 Mt. , conversely, is a significant contributor to emission growth, adding 62.46 Mt of CO2 from 2012 to 2022. The majority increase of (43.83 Mt) occurs between 2012 and 2017, fueled by the rapid pace of urbanization and an increase in fixed asset investment. acts as a primary emissions inhibitor, reducing CO2 by 78.87 Mt, particularly in 2014 and 2017, due to decreased cement production, real estate sector contraction, reduced housing construction, and capacity reductions. The expansion of the cement sector has coincided with an increase in carbon emissions, as the increase in production has not significantly changed the energy structure or intensity. results in a CO2 emissions promotion of 0.07 Mt, while initially contributes to emissions before transitioning to an inhibitory role, with a cumulative reduction of 8.8 Mt. Since the 18th National Congress of the Communist Party of China, Jiangsu has prioritized energy conservation and consumption reduction to transform its economic model, enhance energy efficiency, and eliminate outdated production capacity. Consequently, energy utilization efficiency improved, with comprehensive energy consumption in cement production decreasing by 4.7% in 2016 compared to 2012. Also, the cement industry advanced circular economy practices, utilizing waste heat and gas for power generation and increasing recycling, effectively conserving energy.
3.2. Forecast and Scenario Analysis
3.2.1. Analysis of Future Cement Output
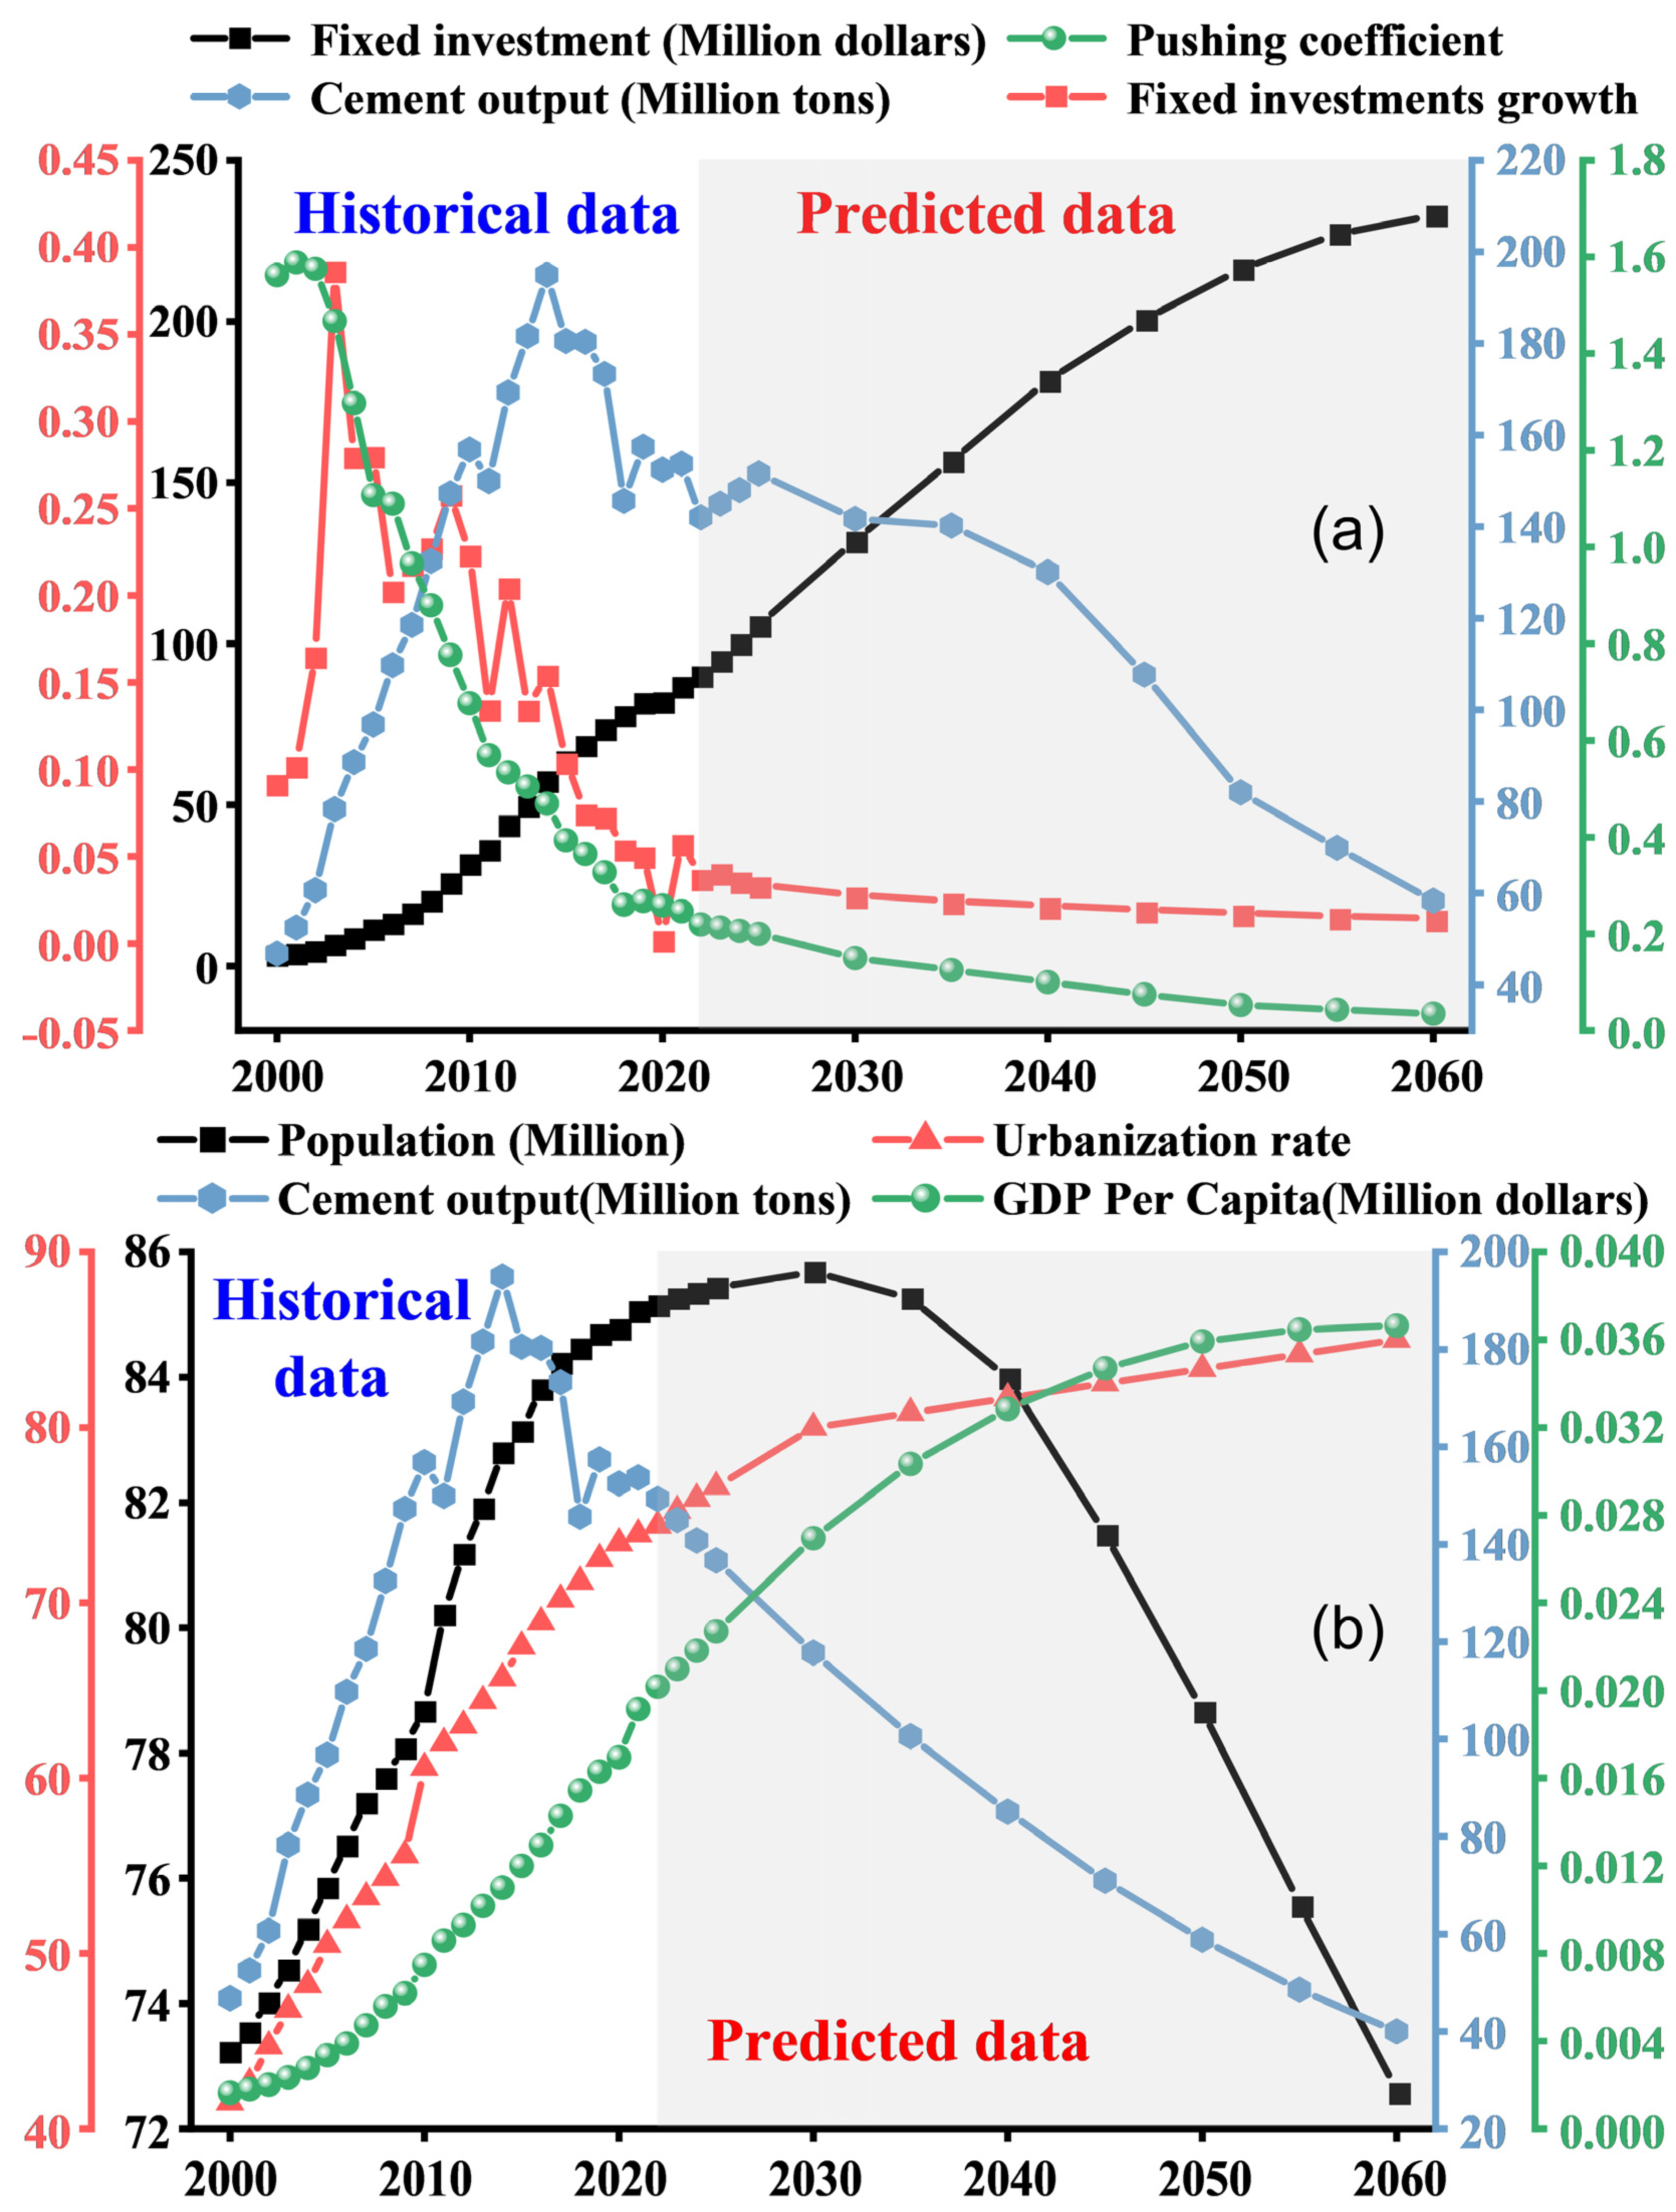
Based on projections of social, economic, and policy factors in Jiangsu Province, the per capita and total cement production post-peak on basis of two models (fixed assets investment and Gompertz) were calculated, respectively. The FAI model indicates that Jiangsu Province’s cement production will decrease to 58.3 Mt by 2060, a reduction of around 83.7 Mt (approximately 59%) from 2012 levels, as shown in Figure 5a. The province’s cement production is expected to plateau by 2035, followed by a more rapid decline due to economic influences. Recent global health events have led to increased infrastructure investment to counter economic pressures, with a 7.3% rise in infrastructure investment in 2022, and this trend is expected to continue in Jiangsu [56]. However, by the “15th Five-Year Plan” period, cement demand will stabilize [11], further reduced by the growth of the green building materials industry [53]. According to the Gompertz model, Jiangsu Province’s cement production is projected to reach 40 Mt by 2060, down by 109 Mt from the 2022 levels (a decrease of about 67%), as illustrated in Figure 5b. This reduction is primarily attributed to negative population growth post-2030, a slowdown in GDP growth, and the completion of urbanization, all of which have diminished the demand for cement in Jiangsu Province. The FAI model and Gompertz model, therefore, outline high-demand and low-demand settings for Jiangsu Province’s cement industry, respectively. This discrepancy primarily arises from the differing key impact factors emphasized by the two forecasting models; the former concentrates on fixed-asset investment, whereas the latter mainly considers three factors: population, economy, and GDP.
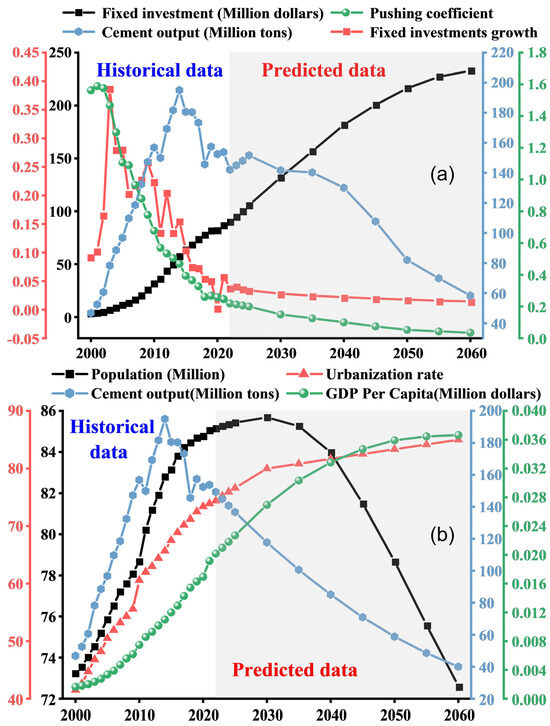
Figure 5.
Cement yield and related factors analyzed by (a) FAI and (b) Gompertz models.
3.2.2. CO2 Emission and Reduction Scenario Analysis
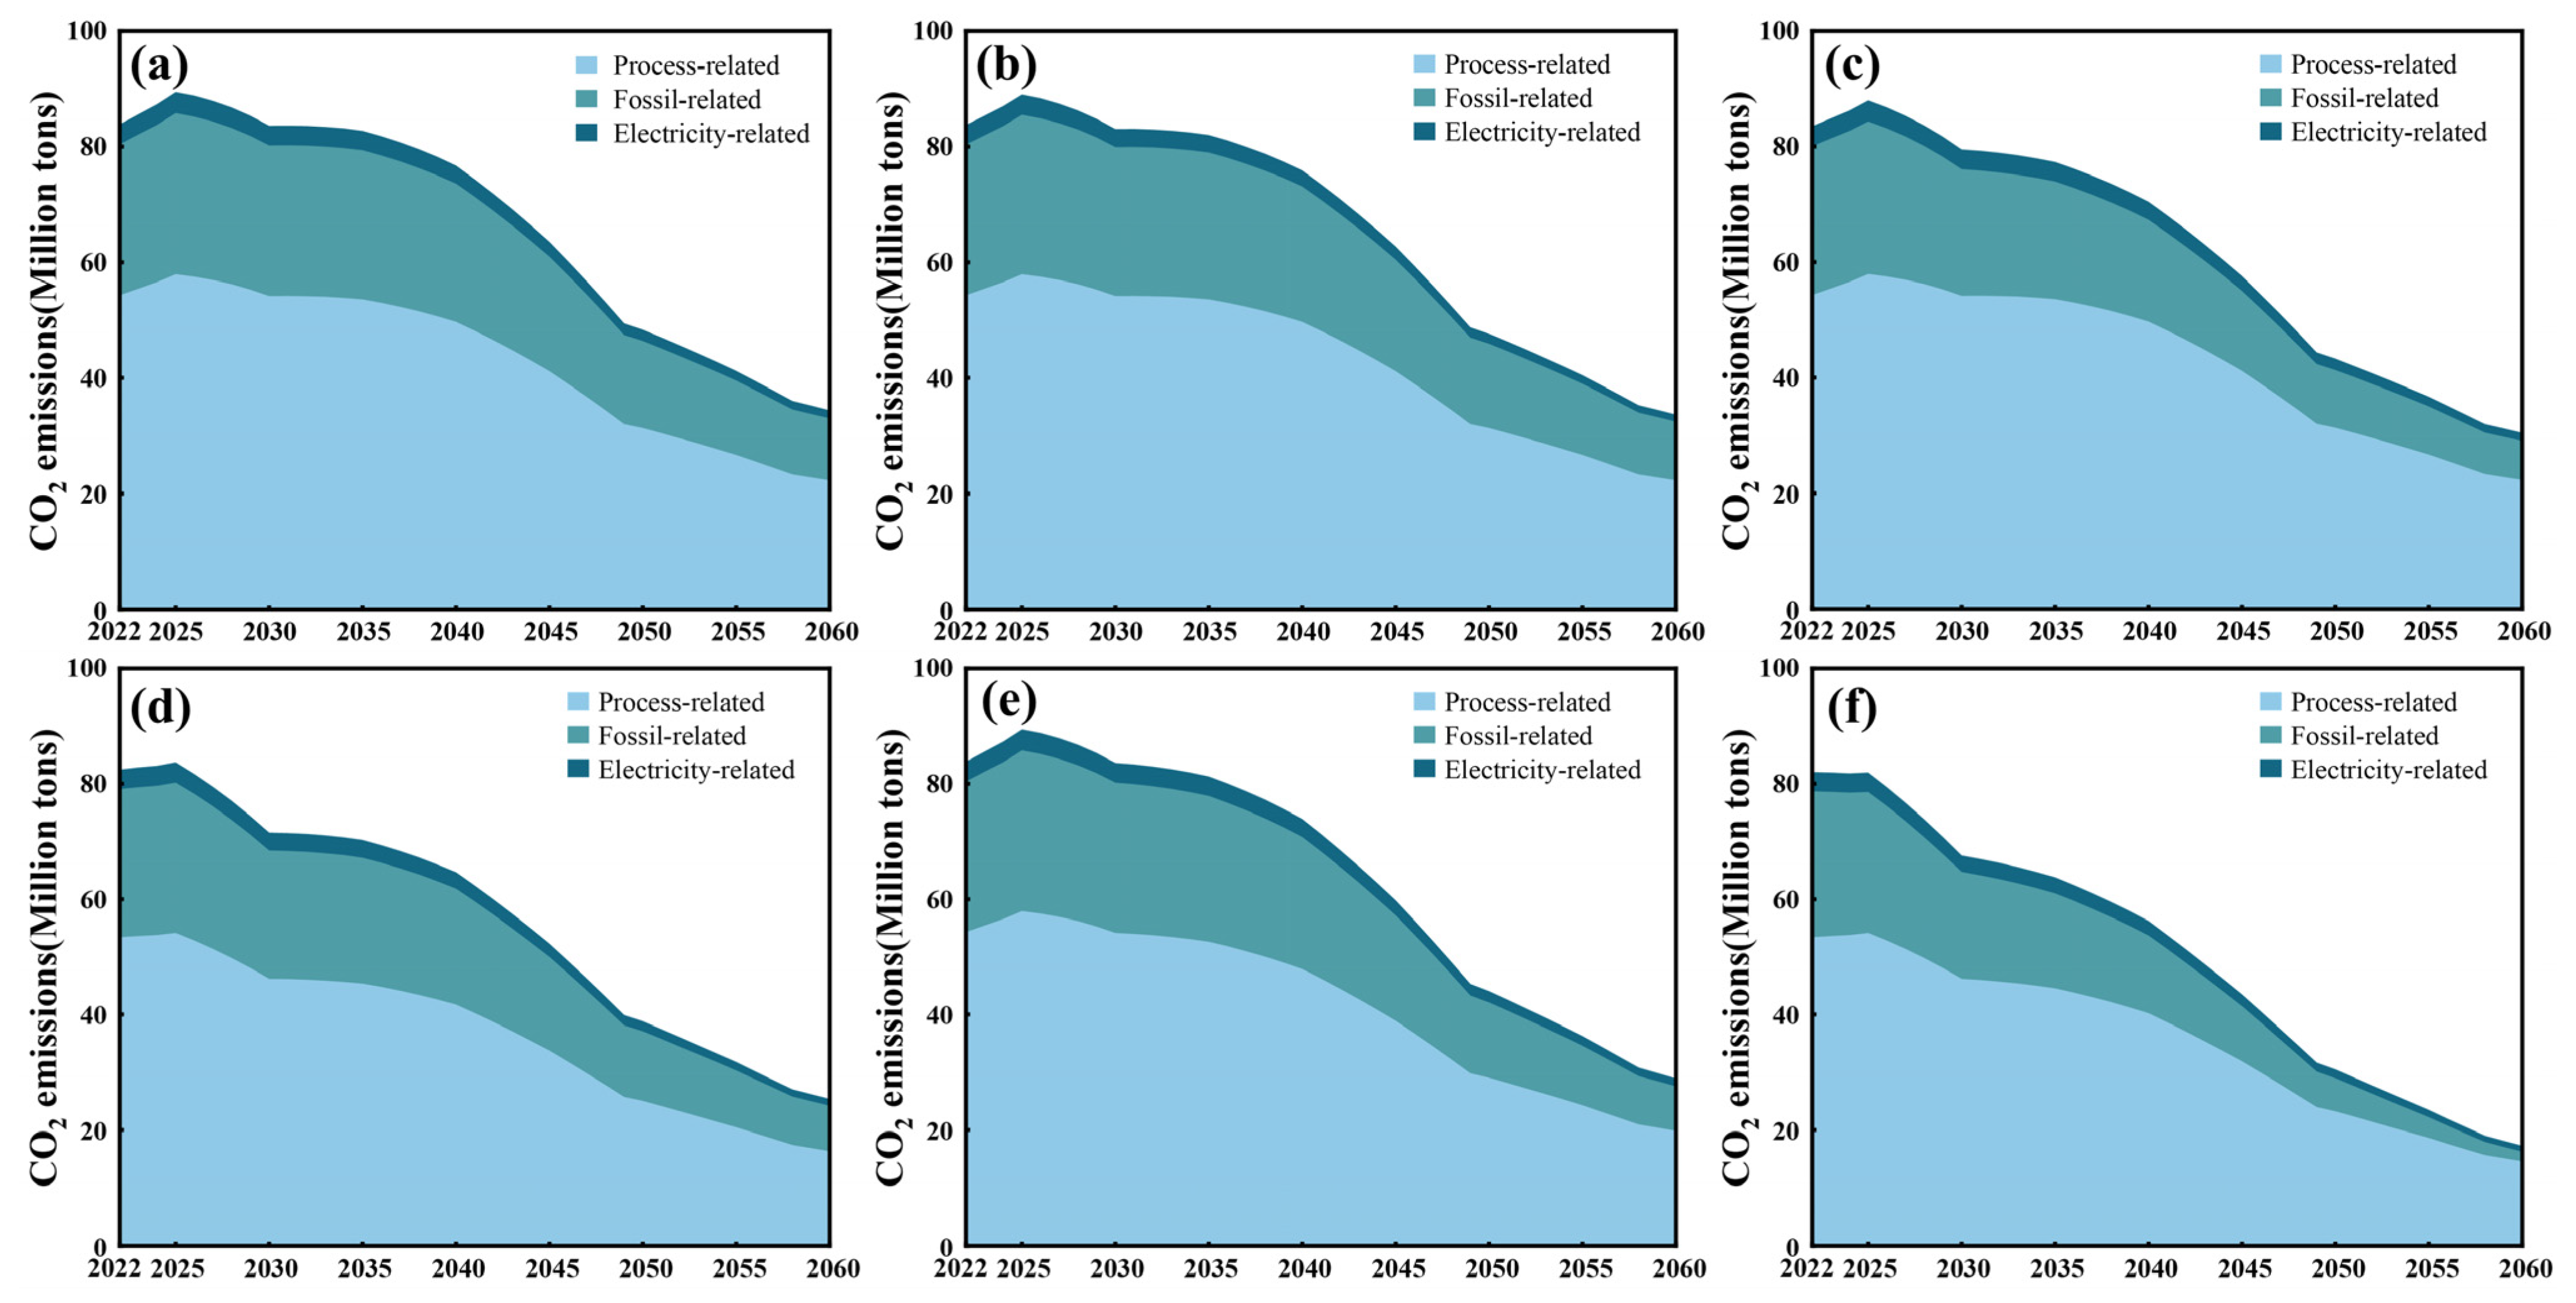
Furthermore, the LEAP model employs the cement production estimates provided by the high- and low-demand settings to forecast CO2 emissions from Jiangsu Province’s cement industry for six distinct emission reduction scenarios before 2060. Depicted in Figure 6 and Figure 7 are the cement industry’s emissions under various scenarios and reduction measures, with industrial processes contributing over 65% of total emissions. Without reduction measures (i.e., frozen scenario, where technology remains at 2021 levels), CO2 emissions will decline solely due to the reduced cement production. As a result, in the frozen scenario, the high-demand setting estimates that CO2 emissions for Jiangsu Province’s cement industry will amount to 34.4 Mt by 2060, whereas the low-demand setting predicts 23.6 Mt.
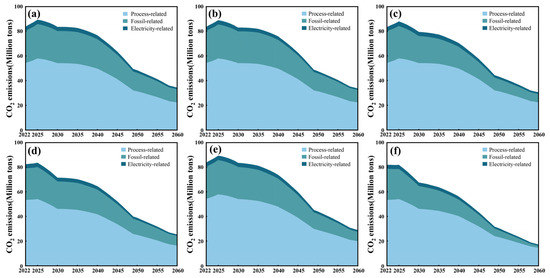
Figure 6.
Changes in cement CO2 emissions trends in high-demand setting: (a) technology freezing (b) energy efficiency improvement; (c) fuel substitution; (d) clinker substitution; (e) CCS technology application; (f) technology integration.

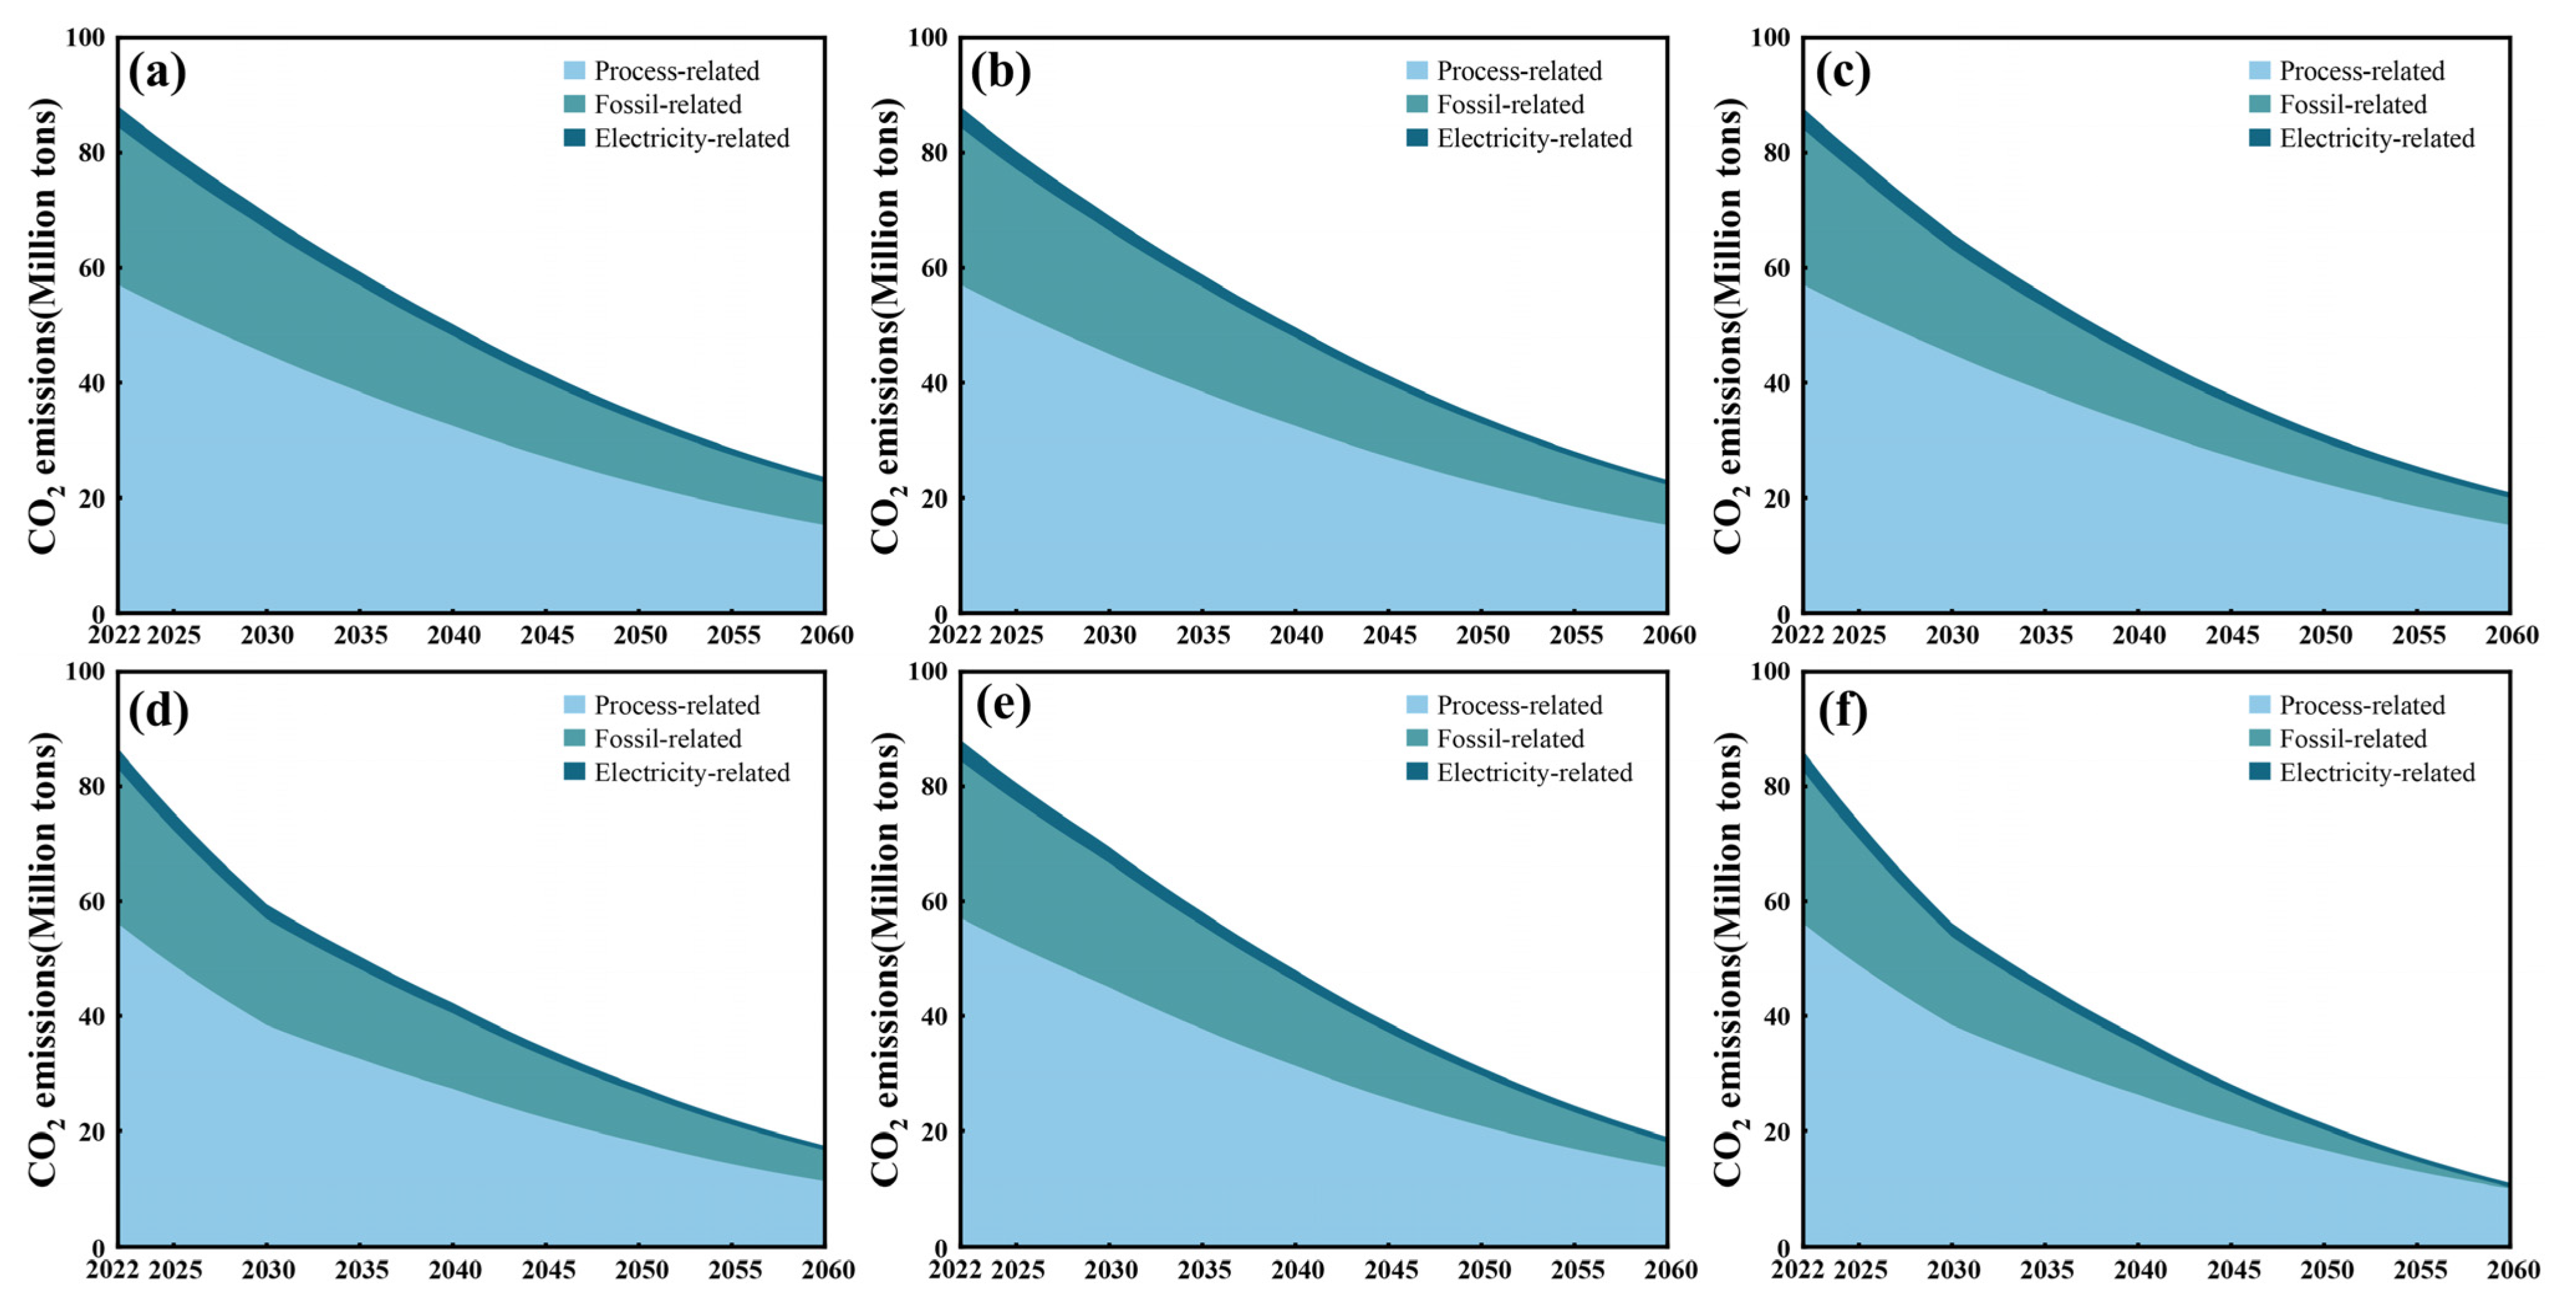
Figure 7.
Changes in cement CO2 emissions trends under low-demand setting: (a) technology freezing; (b) energy efficiency improvement; (c) fuel substitution; (d) clinker substitution; (e) CCS technology application; (f) technology integration.
In the high-demand setting, S2 scenario cuts fossil fuel and electricity emissions, achieving a 25.99 Mt cumulative reduction by 2060 compared to the frozen scenario, with 75% from fossil fuel savings (Figure 6b). Alternative fuel and raw material technologies are considered highly effective for CO2 emission reductions in the cement industry [56]. Currently, biomass, sewage sludge, and municipal solid waste are used as fuel substitutes [57]. Under the S3 scenario (Figure 6c), biomass-based carbon-neutral fuels replace coal, with the substitution rate rising from 2% in 2022 to 40% by 2060 [32]. Consequently, the cumulative CO2 emission reduction for Jiangsu Province’s cement industry is 175.35 Mt less than in the frozen scenario and 6.75 times greater than in the S2 scenario. Calcination and decomposition of limestone during clinker production release the majority of CO2 emissions in the cement industry, with over 65% of the total. During the cement production process, reducing clinker content and using alternative materials can significantly reduce these emissions. Thus, in the S4 scenario (Figure 6d), the proportion of clinker substitution in cement production is incrementally raised from 5% in 2022 to 20% by 2060 [58,59]. Over this period, the cumulative reduction in CO2 emissions amounts to 387 Mt, with a peak reduction of 12.46 Mt occurring in 2035. In the S5 technology scenario (Figure 6e), it is projected that mature CCS technology will be incrementally implemented in the cement industry, starting after 2030 [23], with the application rate rising from 0% to 15% between 2030 and 2060. The deployment of CCS technology in the cement industry between 2030 and 2060 is anticipated to reduce cumulative CO2 emissions by 113 Mt, comprising 46% from CO2 capture in fuel combustion and 54% from CO2 capture in the decomposition of limestone feedstock. Post-2040, the impact of CCS applications on CO2 reductions will diminish due to decreased cement production. Nevertheless, after 2050, the CO2 reductions attributed to CCS are expected to rise substantially as the technology expands its reach. In the S6 scenario (Figure 6f), the combined technology achieves a cumulative emission reduction of 641.44 Mt, with specific contributions from integrated energy efficiency, fuel substitution, clinker substitution, and CCS technology at 22.21 Mt, 140.51 Mt, 387.04 Mt, and 91.68 Mt, respectively.
In the low-demand setting, CO2 emissions are anticipated to be 31.4% lower by 2060 compared to the high-demand setting, primarily due to decreased cement production volumes (Figure 7a–f). Across all technology-related CO2 emissions reduction scenarios, energy efficiency improvement contributes the least to emissions reductions, accounting for a decrease of only 18.72 Mt. Fuel substitution plays a more substantial role, reducing fossil fuel-related emissions by 125.15 Mt. The largest single contributor to CO2 emissions reduction is clinker substitution, which achieves a total CO2 reduction of 281.06 Mt, underscoring its importance in reducing the carbon intensity of cement production. Although CCS technology initially shows a limited impact, its role in emissions reduction grows over time, resulting in a cumulative reduction of 85.55 Mt of CO2 by 2060. Among all scenarios, the integrated technology scenario delivers the most effective results, with an aggregate CO2 reduction of 475.52 Mt by the end of the projection period. The relative contributions of each technology to this total reduction are as follows: energy efficiency improvements accounted for 3.38%, fuel substitution contributed 21.16%, clinker substitution made the largest impact at 59.11%, and CCS technology provided a notable 16.36%. These findings suggest that while each technology individually supports CO2 emissions reduction, a combined approach markedly enhances the overall CO2 emission reduction potential for the cement industry.
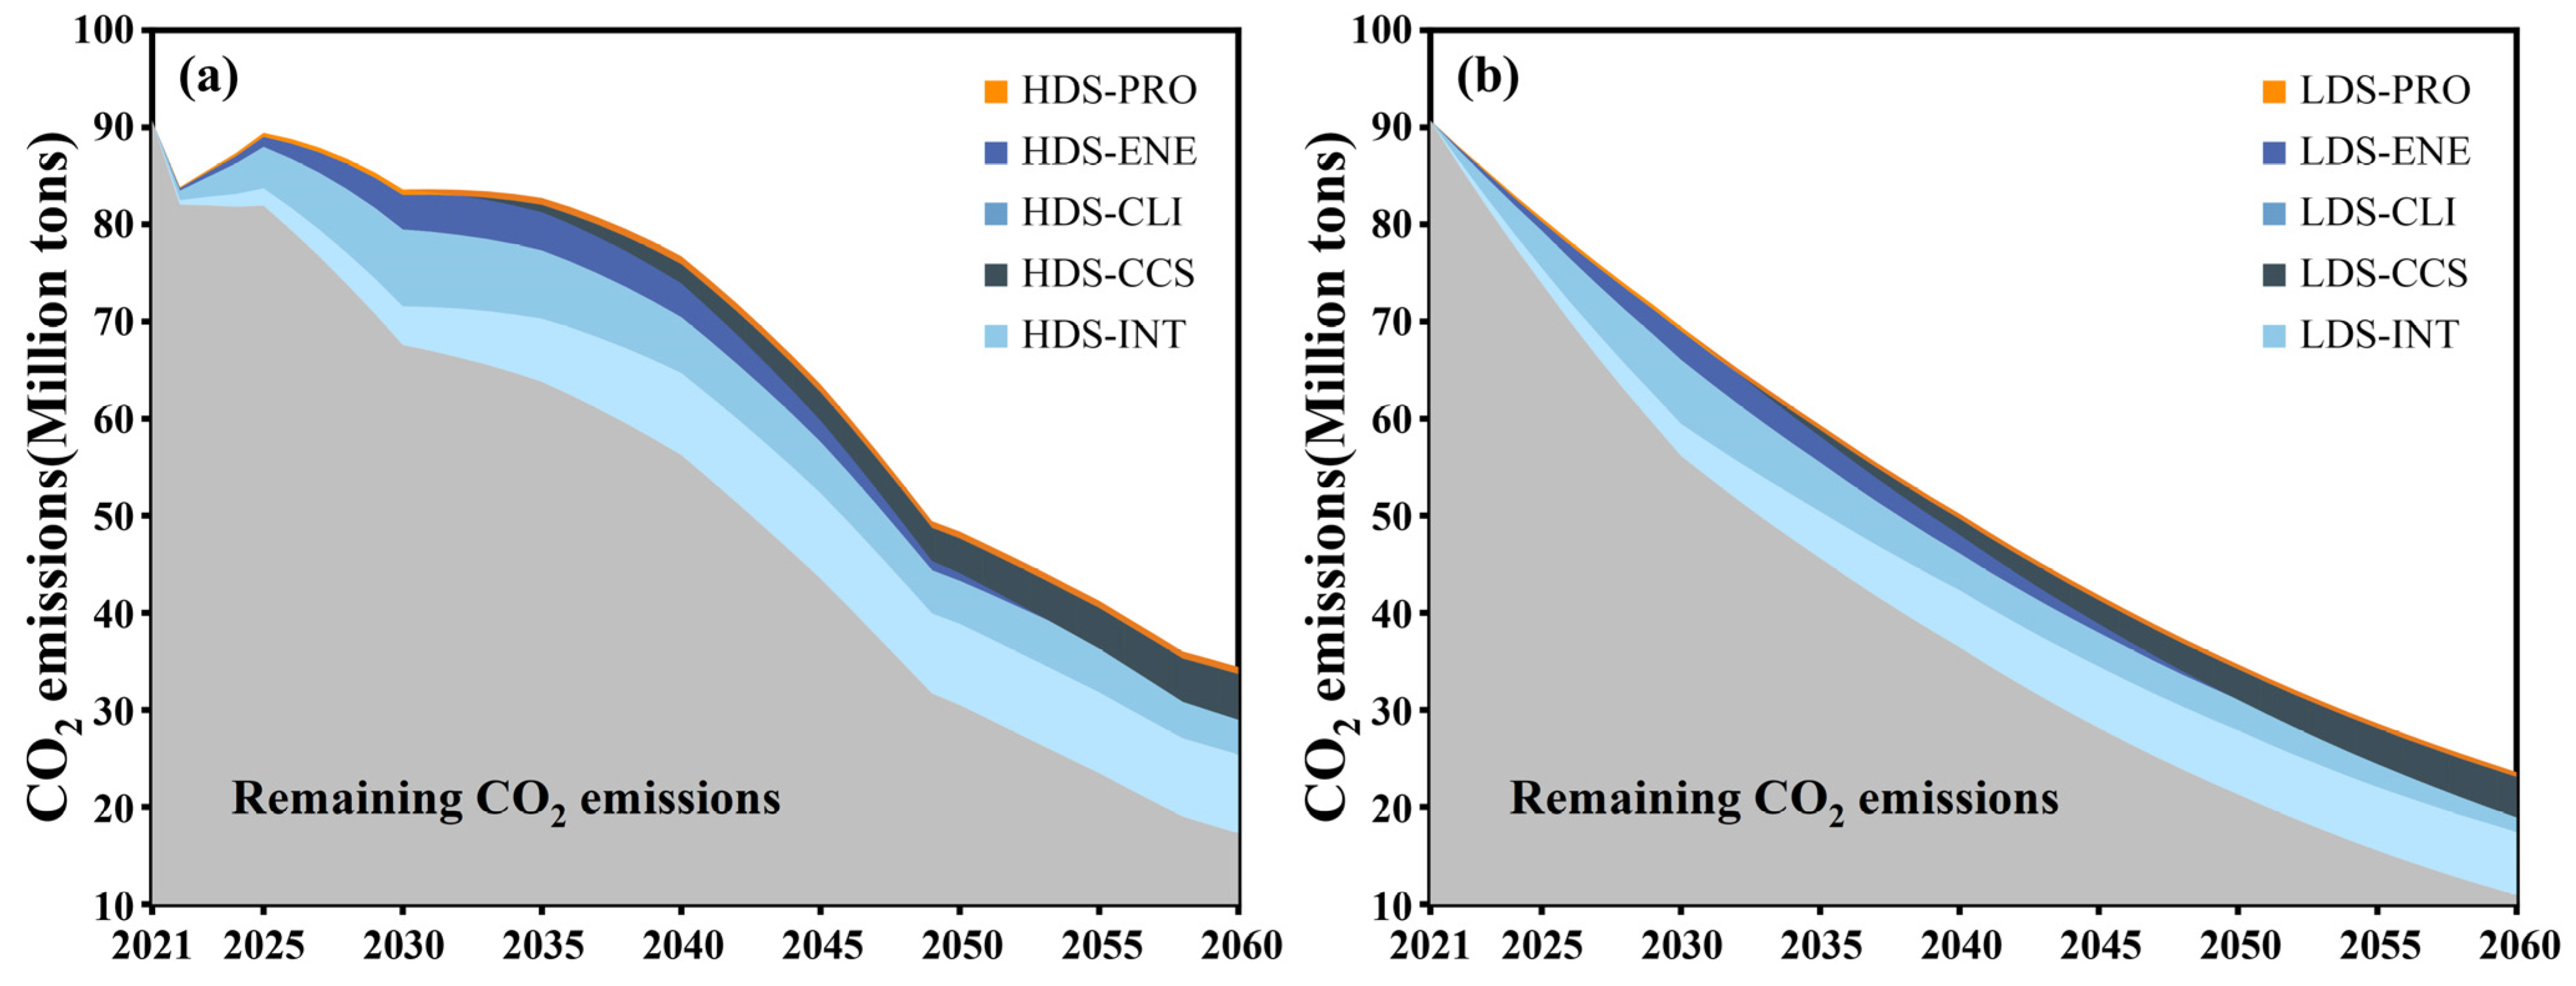
While the two scenarios differ significantly in emissions due to varying cement production levels, they share common technical characteristics (Figure 8a,b). Energy efficiency improvements contribute minimally to emission reductions in both scenarios, as Jiangsu Province’s comprehensive energy consumption is already at an advanced level, limiting further gains due to thermodynamic constraints. At the early stage of the forecast, the emission reduction effect of fuel and raw substitution is more obvious. Before 2030, clinker and raw material substitution contributes over 70% to reductions, and CCS technology will gradually become the main carbon emission reduction after 2030 and reach more than 30% of the contribution rate in 2060. By 2060, the technology composite scenario achieves an emission reduction rate of over 80% compared to base year (81% under high demand and 87% under low demand). However, this still falls short of zero carbon emissions in cement production. Therefore, an analysis of the emission reduction potential of related technologies is conducted to identify the optimal emissions reduction technologies for production.
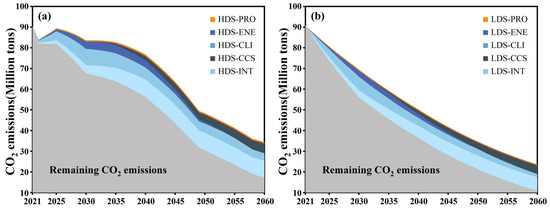
Figure 8.
Different technology-related CO2 emissions reduction scenarios of cement industry, (a) High-demand setting and (b) Low-demand setting.
3.3. Emission Reduction Potential and Industry Optimization Suggestions
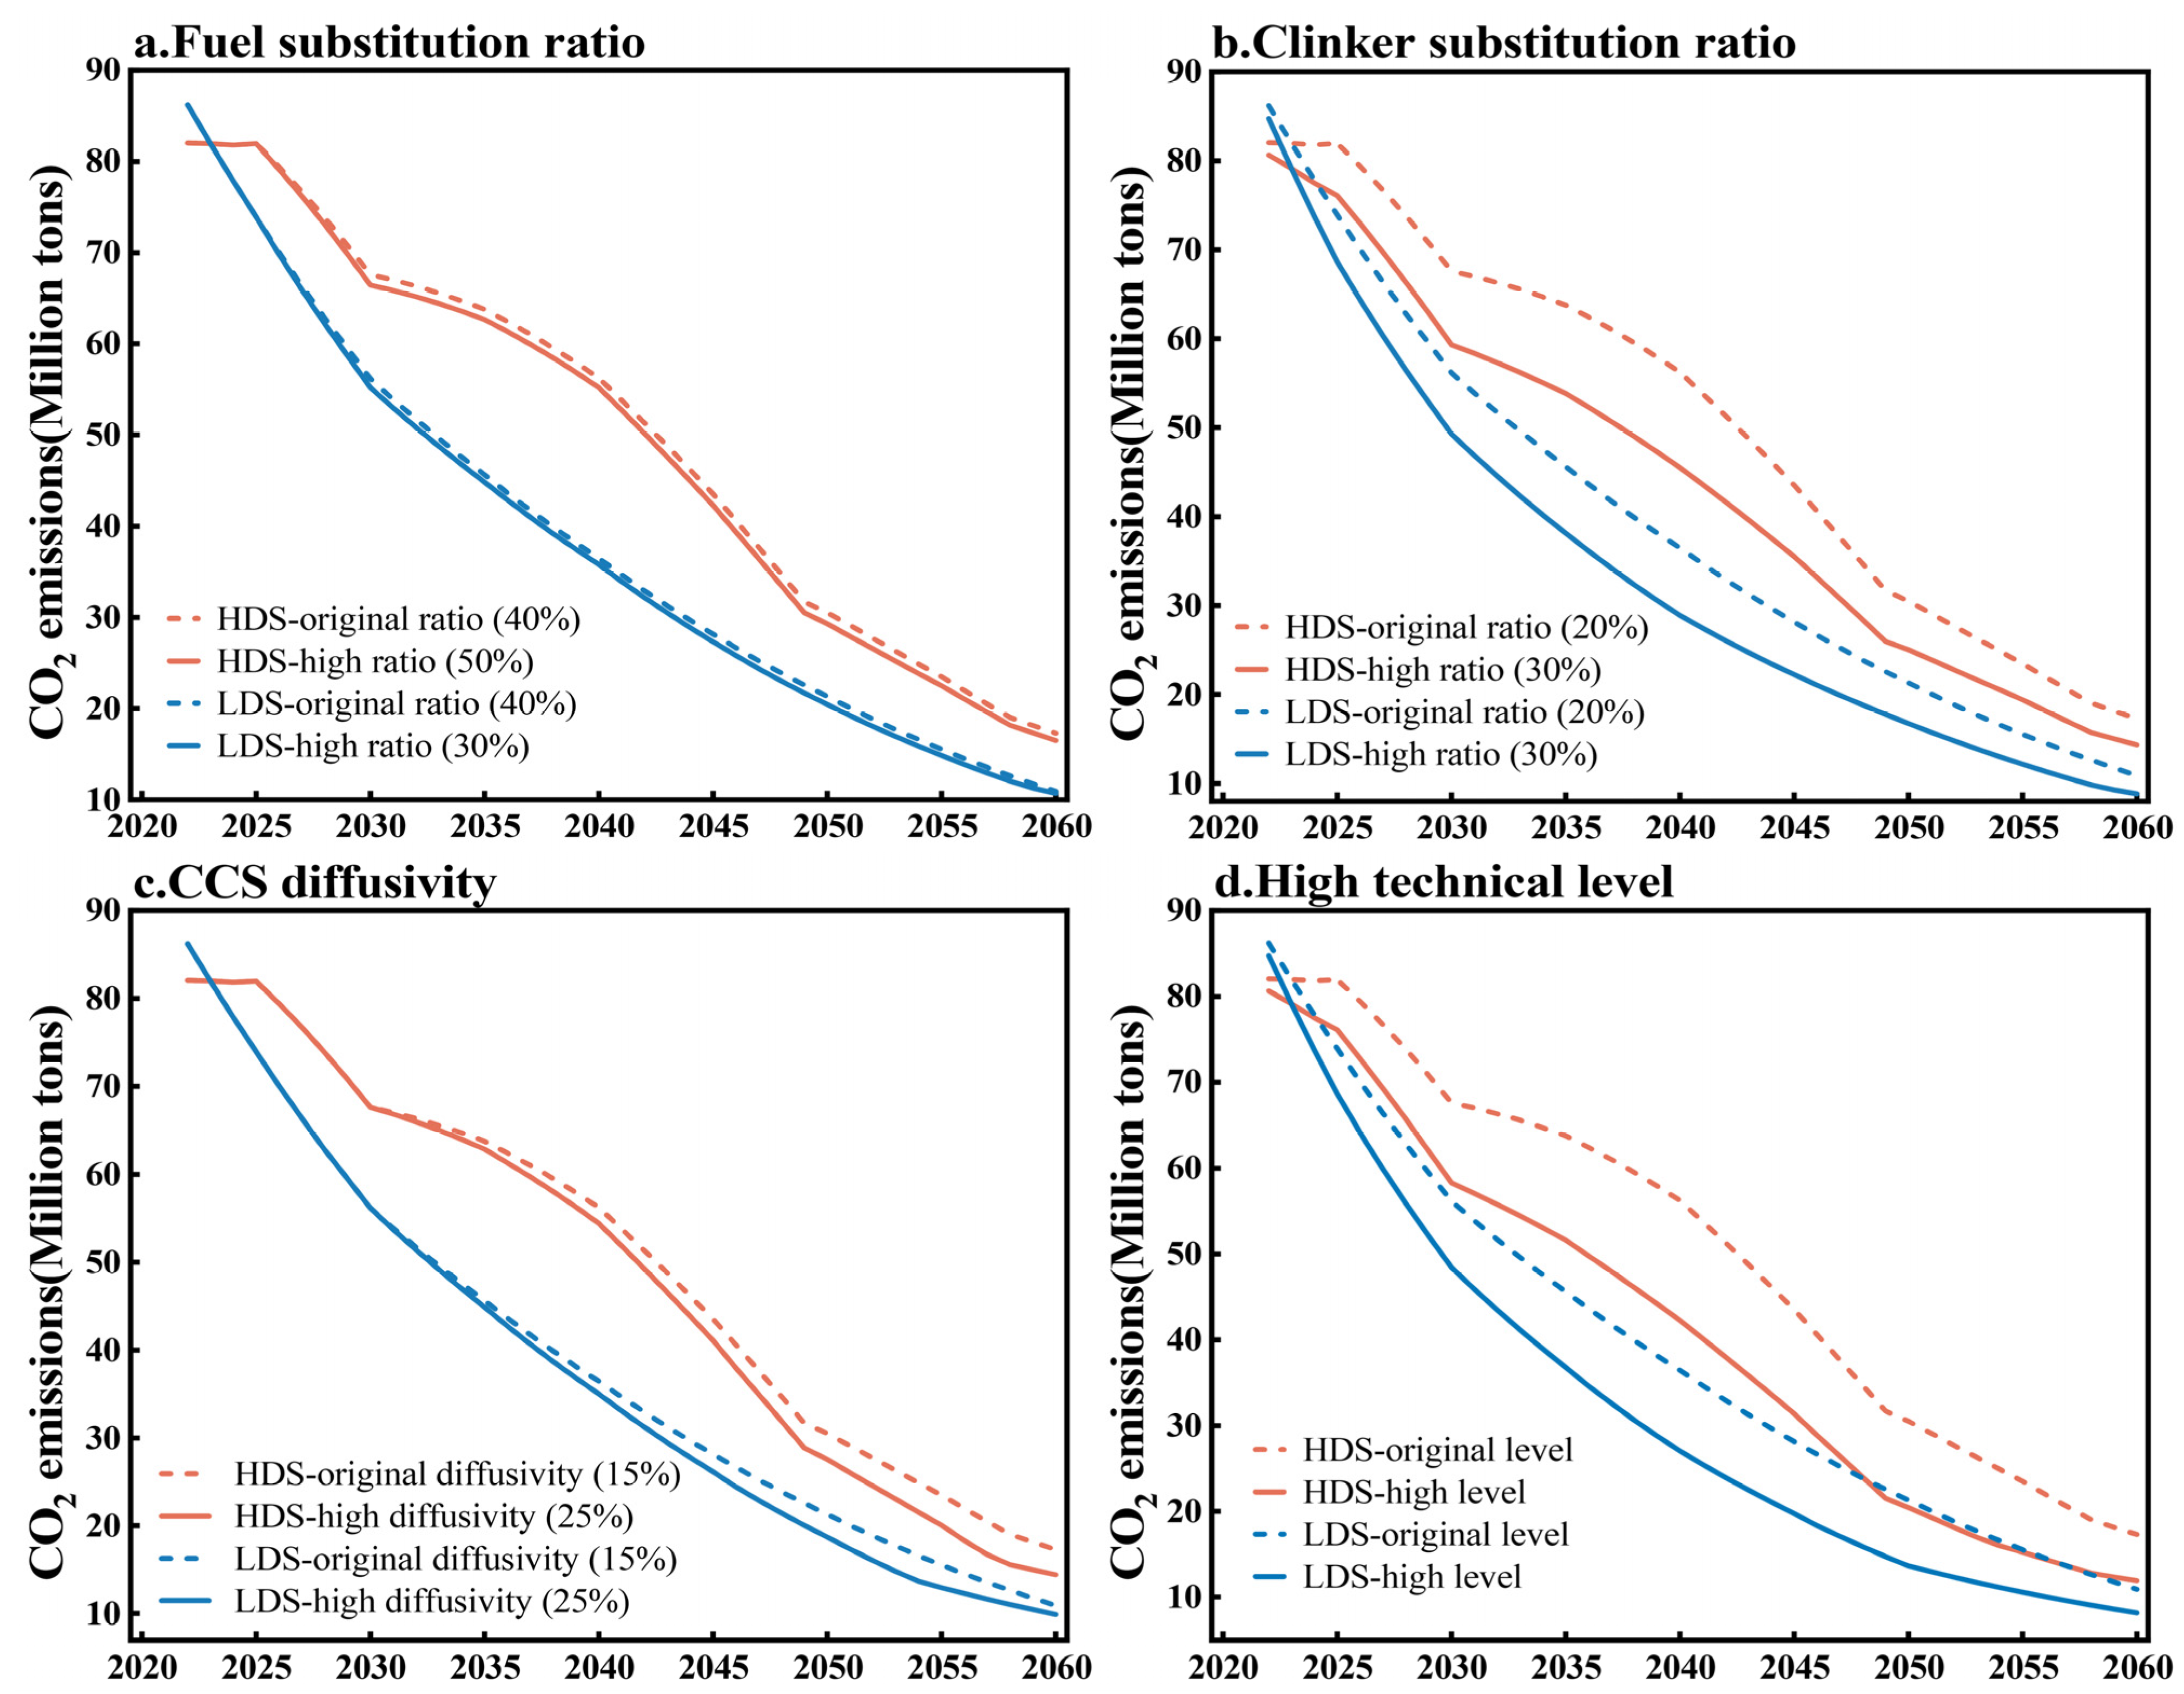
Taking into account the thermodynamic constraints on further energy efficiency improvements in the cement industry, the focus is on the potential for deep CO2 emission reductions through enhanced diffusion of fuel substitution, clinker substitution and CCS. Currently, in the cement industry of Jiangsu Province, the fuel replacement ratio is below 2%, and the clinker replacement ratio during cement production is under 5% [60]. With existing parameters, the carbon-neutral fuel substitution ratio is projected to reach 40% by 2060, allowing for an upward adjustment of 10% to 50% (Figure 9a). Fuel substitution technologies have a minimal impact on emission trends, contributing only 4.5% to CO2 reductions in the high-demand scenario and 5% in the low-demand scenario. In contrast, clinker replacement technology offers greater reduction potential; a 30% clinker replacement rate can lower the high-demand setting’s emissions by 17.1% and the low-demand setting’s emissions by 19% by 2060 (Figure 9b). As illustrated in Figure 9c, a 25% CCS diffusion rate will reduce CO2 emissions by 16.54% for the high-demand setting and 9.26% for the low-demand setting by 2060. The high-technical-level scenario incorporates changes in CO2 emissions from Jiangsu’s cement industry, considering 50% fuel replacement, 30% clinker replacement, and a 25% CCS diffusion rate (Figure 9d). Within the comprehensive technology framework, CO2 emissions in 2060 for the high-technology scenario under the high-demand setting are projected to be 11.90 Mt, achieving a reduction of 5.39 Mt CO2, 31.17% lower than original technology scenario. In the low-demand setting, CO2 emissions are expected to reach 8.16 Mt, representing a decrease of 2.74 Mt, 25.16% lower than the original scenario.
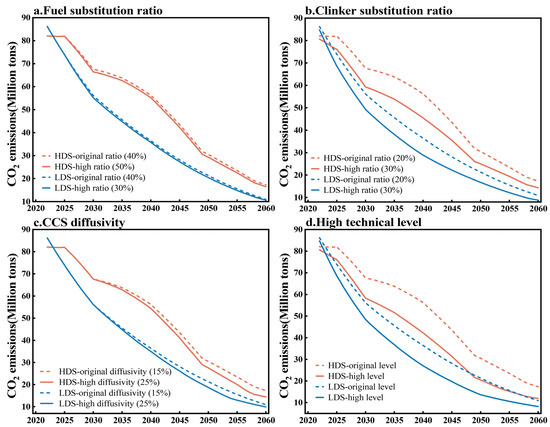
Figure 9.
Influence of technology variables on emission reduction potential under integrated-technology scenario: (a) fuel substitution, (b) clinker substitution, (c) CCS diffusivity, and (d) high technical level.
Although mainstream emission reduction technologies have significant future CO2 reduction potential in cement production, Jiangsu’s cement industry still faces a 10-million-ton CO2 gap to reach carbon neutrality. Addressing this gap requires a comprehensive strategy, combining technological innovation, policy support, and systemic transformation. Supplementary cementitious materials (SCMs), such as fly ash and slag, can replace 15–30% of clinker, reducing emissions while maintaining structural integrity. However, challenges in supply chain consistency and quality standardization persist [61]. Alternative cement systems, including geopolymers and flint cement, offer further decarbonization pathways, with geopolymers potentially cutting emissions by 50–70%. However, scalability is hindered by the high cost of alkali activators and durability concerns [62]. Carbon capture technologies, such as calcium looping integrated with solar heat storage, have demonstrated promising results, achieving 89.8% CO2 conversion while reducing calcination temperatures [63]. In terms of policy, targeted tax incentives, low-interest credit, and financing support for ultra-low emission transitions will be crucial. Integrating the cement sector into the national carbon emission trading market can incentivize emission reduction and offset 18–25% of renovation costs through carbon-trading revenues [64,65]. Collaboration between cement enterprises, universities, and research institutions is key to accelerating technological adoption and innovation. By aligning immediate policy actions with long-term systemic shifts, Jiangsu can establish a replicable model for industrial decarbonization.
4. Conclusions and Recommendation
This study integrates LMDI decomposition and LEAP scenario modeling to analyze the historical drivers and decarbonization potential of CO2 emissions in Jiangsu Province’s cement industry. The findings reveal critical challenges and opportunities for achieving carbon neutrality by 2060, while emphasizing the need for systemic interventions across technological, policy, and market dimensions.
4.1. Key Conclusions
The LMDI breakdown of emissions from 2012 to 2022 shows that the decline in cement production, driven by reduced real estate activity and industrial capacity optimization, is the primary factor restraining emissions growth. In contrast, economic expansion and carbon intensity contribute positively to emissions, highlighting the tension between industrial growth and decarbonization. Notably, shifts in the energy mix (such as the coal-to-gas transition) and energy efficiency improvements play a secondary role, reflecting the slow progress in clean technology adoption.
The forecast to 2060 underscores clinker substitution as the most effective mitigation lever, contributing around 60% of total emissions reductions under the combined-technology scenario. While energy efficiency retrofitting and the adoption of carbon capture and storage (CCS) remain crucial, their impact is limited by cost barriers and scalability challenges. Even with the aggressive deployment of existing technologies, a residual emissions gap of about 1 billion tons of CO2 remains, indicating that breakthroughs in carbon-negative materials or circular economy systems are necessary to achieve full neutralization.
4.2. Strategic Recommendations
To address these challenges, policymakers should prioritize clinker substitution through regulatory reforms and financial incentives. Amending national cement standards to allow for higher substitution rates (around 30%) and subsidizing the utilization of industrial waste (e.g., slag, calcined clay) could accelerate adoption. At the same time, promoting alternative fuels, particularly biomass and municipal waste, requires the establishment of regional supply chains and cross-sectoral partnerships to ensure the availability of raw materials. Demand-side management must complement technical measures to integrate circular-economy principles into urban planning. Additionally, combining provincial real estate policies with low-carbon targets, including stricter building life-cycle rules and renovation incentives, will help reduce emissions from new construction. For difficult-to-reduce process emissions, early investment in CCS infrastructure is critical. Utilizing existing industrial clusters in Jiangsu, a pilot project could leverage a CO2 transport network and storage site shared with neighboring power plants. Simultaneously, research and development of breakthrough technologies should be encouraged, although these innovations will require substantial and continuous funding.
4.3. Limitations and Future Research
This study’s reliance on provincial-level data may overlook enterprise-level heterogeneity in technology adoption rates and operational practices. Future work should provide a detailed analysis of the financial and technical barriers faced by small- and medium-sized cement plants, particularly during the transition to alternative fuels or CCS. Moreover, these scenarios assume linear progress in policy implementation, disregarding potential delays caused by market volatility or geopolitical turbulence. Further research is needed to quantify synergies across sectors, such as the interplay between cement and power industries under renewable energy integration, and the impact of emerging technologies like carbon capture.
In short, Jiangsu’s cement industry requires a multi-scale strategy that balances immediate emissions reductions through clinker substitution and efficiency improvements with long-term investments in disruptive innovations. Achieving carbon neutrality by 2060 will depend not only on technology deployment but also on transforming market structures and governance systems to align industrial growth with planetary boundaries.
Author Contributions
Conceptualization, K.S., J.S. and C.Z.; methodology, K.S. and J.S.; software, K.S. and C.B.; validation, J.S. and L.J.; formal analysis, K.S.; investigation, J.S.; resources, C.Z.; data curation, C.B.; writing—original draft preparation, K.S.; writing—review and editing, K.S. and J.S.; visualization, K.S.; supervision, J.S.; project administration, J.S.; funding acquisition, J.S. All authors have read and agreed to the published version of the manuscript.
Funding
This research was funded by Jiangsu Provincial Department of Education, grant number “23KJB470025” and Foundation of State Key Laboratory of Coal Combustion, grant number “FSKLCCA2406”. The APC was funded by Jian Sun.
Data Availability Statement
Data are unavailable due to privacy or ethical restrictions; a statement is still required.
Conflicts of Interest
Author Long Jiang was employed by the North China Electric Power Research Institute Co., Ltd., Beijing 100045, China. The remaining authors declare that the research was conducted in the absence of any commercial or financial relationships that could be construed as a potential conflict of interest.
Nomenclature
| Abbreviations | Description | Abbreviations | Description |
| LMDI | Logarithmic Mean Index Method | Mtce | Million tons of standard coal |
| LEAP | Low emissions analysis platform | Energy structure effect | |
| GOM | Gompertz curve | Energy intensity effect | |
| FAI | Fixed assets investment method | Output effect | |
| CO2 | Carbon dioxide | Economic effect | |
| Fossil fuel-related emissions | Cement demand in year t | ||
| Electricity-related emissions | Fixed asset investment completed in year t | ||
| Emission of carbonate decomposition | Pushing coefficient | ||
| The consumption of fuel i | Growth rate of fixed asset investment in year t | ||
| The production of cement clinker | Per capita cement demand for year t | ||
| The electricity purchased for clinker production | Per capita cement consumption saturation level | ||
| The electricity purchased for cement preparation | Urbanization rate of Jiangsu Province in year t | ||
| Low calorific value | Urbanization saturation rate for Jiangsu Province | ||
| Carbon content per unit calorific value | Per capita GDP level for year t | ||
| Carbon oxidation rate | The impact of the on | ||
| Electric emission factor for clinker production | Adjustment factor for the time series | ||
| Electric emission coefficient of cement preparation | , | The impact of on | |
| Emission coefficient of raw material decomposition | HDS | High-demand setting | |
| kgce | Kg standard coal | LDS | Low-demand setting |
References
- Wang, W.; Ye, M.; Shi, Y.; Xiao, D. Plant-level intensity of energy and CO2 emissions for Portland cement in Guizhou of Southwest China 2019–2022. Sci. Data 2024, 11, 759. [Google Scholar] [CrossRef] [PubMed]
- Cao, X.; Wen, Z.; Zhao, X.; Wang, Y.; Zhang, H. Quantitative assessment of energy conservation and emission reduction effects of nationwide industrial symbiosis in China. Sci. Total Environ. 2020, 717, 137114. [Google Scholar] [CrossRef] [PubMed]
- Wei, J.; Cen, K.; Geng, Y. China’s cement demand and CO2 emissions toward 2030: From the perspective of socioeconomic, technology and population. Environ. Sci. Pollut. Res. Int. 2019, 26, 6409–6423. [Google Scholar] [CrossRef] [PubMed]
- Sherif, Z.; Sarfraz, S.; Jolly, M.; Salonitis, K. A Critical Review of the Decarbonisation Potential in the UK Cement Industry. Materials 2025, 18, 292. [Google Scholar] [CrossRef]
- Li, Z.; Sun, L.; Zhang, R.; Hanaoka, T. Decarbonization pathways promote improvements in cement quality and reduce the environmental impact of China’s cement industry. Commun. Earth Environ. 2024, 5, 769. [Google Scholar] [CrossRef]
- Taskin, F.D.; Demir, E. Impacts and Implications of Asymmetric Climate Policies on Trade and Environment: Evidence From EU. Int. J. Contemp. Econ. Adm. Sci. 2024, 14, 411–441. [Google Scholar]
- Bekun, F.V.; Alola, A.A.; Gyamfi, B.A.; Kwakwa, P.A.; Uzuner, G. Econometrics analysis on cement production and environmental quality in European Union countries. Int. J. Environ. Sci. Technol. 2023, 20, 4265–4280. [Google Scholar] [CrossRef]
- Okeke, I.J.; Kamath, D.; Nimbalkar, S.U.; Cresko, J. The Role of Low-Carbon Fuels and Carbon Capture in Decarbonizing the US Clinker Manufacturing for Cement Production: CO2 Emissions Reduction Potentials. Energies 2024, 17, 5233. [Google Scholar] [CrossRef]
- Fairbairn, E.M.R.; Americano, B.B.; Cordeiro, G.C.; Paula, T.P.; Toledo Filho, R.D.; Silvoso, M.M. Cement replacement by sugar cane bagasse ash: CO2 emissions reduction and potential for carbon credits. J. Environ. Manag. 2010, 91, 1864–1871. [Google Scholar] [CrossRef]
- Balsara, S.; Jain, P.K.; Ramesh, A. An integrated methodology to overcome barriers to climate change mitigation strategies: A case of the cement industry in India. Environ. Sci. Pollut. Res. 2021, 28, 20451–20475. [Google Scholar] [CrossRef]
- He, J.; He, J.; Wang, Y.; Fan, Y.; Shi, H.; Cai, B.; Yan, G. Pathway of Carbon Emissions Peak for Cement Industry in China. Res. Environ. Sci. 2022, 35, 347–355. [Google Scholar]
- He, Y.; Xing, Y.; Zeng, X.; Ji, Y.; Hou, H.; Zhang, Y.; Zhu, Z. Factors influencing carbon emissions from China’s electricity industry: Analysis using the combination of LMDI and K-means clustering. Environ. Impact Assess. Rev. 2022, 93, 106724. [Google Scholar] [CrossRef]
- Wu, L.; Wang, M.; Cheng, J.; Li, X. Embodied carbon emission of building materials in Southwest China: Analysis based on tapio decoupling and logarithmic mean divisia index decomposition. Clean. Technol. Environ. Policy 2023, 25, 921–935. [Google Scholar] [CrossRef]
- Xu, J.-H.; Fleiter, T.; Eichhammer, W.; Fan, Y. Energy consumption and CO2 emissions in China’s cement industry: A perspective from LMDI decomposition analysis. Energy Policy 2012, 50, 821–832. [Google Scholar] [CrossRef]
- Li, J.; Fu, C.; LI, B. Strategies for the Coordinated Development of CO2 Emission Reduction in the Steel Sector: A Case Study of Beijing-Tianjin-Hebei. Chin. J. Environ. Manag. 2023, 15, 27–34. [Google Scholar]
- Lin, B.; Zhang, Z. Carbon emissions in China׳s cement industry: A sector and policy analysis. Renew. Sustain. Energy Rev. 2016, 58, 1387–1394. [Google Scholar] [CrossRef]
- Wen, Z.; Chen, M.; Meng, F. Evaluation of energy saving potential in China’s cement industry using the Asian-Pacific Integrated Model and the technology promotion policy analysis. Energy Policy 2015, 77, 227–237. [Google Scholar] [CrossRef]
- Gao, T.; Shen, L.; Shen, M.; Liu, L.; Chen, F.; Gao, L. Evolution and projection of CO2 emissions for China’s cement industry from 1980 to 2020. Renew. Sustain. Energy Rev. 2017, 74, 522–537. [Google Scholar] [CrossRef]
- Dinga, C.D.; Wen, Z. China’s green deal: Can China’s cement industry achieve carbon neutral emissions by 2060? Renew. Sustain. Energy Rev. 2022, 155, 111931. [Google Scholar] [CrossRef]
- Zhang, S.; Ren, H.; Zhou, W.; Yu, Y.; Chen, C. Assessing air pollution abatement co-benefits of energy efficiency improvement in cement industry: A city level analysis. J. Clean. Prod. 2018, 185, 761–771. [Google Scholar] [CrossRef]
- Zhang, S.; Worrell, E.; Crijns-Graus, W. Mapping and modeling multiple benefits of energy efficiency and emission mitigation in China’s cement industry at the provincial level. Appl. Energy 2015, 155, 35–58. [Google Scholar] [CrossRef]
- Zhu, S.; Lu, Y.; Wang, S.; Liu, W.; Tang, K.; Li, N. Characteristics and reduction potential of carbon dioxide emission in China’s cement industry from 2020 to 2050. Acta Sci. Circumstantiae 2024, 44, 453–463. [Google Scholar]
- Wang, Y.; Höller, S.; Viebahn, P.; Hao, Z. Integrated assessment of CO2 reduction technologies in China’s cement industry. Int. J. Greenh. Gas. Control 2014, 20, 27–36. [Google Scholar] [CrossRef]
- Tan, C.; Yu, X.; Guan, Y. A technology-driven pathway to net-zero carbon emissions for China’s cement industry. Appl. Energy 2022, 325, 119804. [Google Scholar] [CrossRef]
- Dang, W.; Jing, Z.; Zong, W.; Zhang, Y. Emission of CO2 and air pollutants from cement industry in Beijing-Tianjin-Hebei (2018–2020) and its reduction forecast. Int. J. Environ. Pollut. 2023, 72, 178–197. [Google Scholar]
- Shan, Y.; Zhou, Y.; Meng, J.; Mi, Z.; Liu, J.; Guan, D. Peak cement-related CO2 emissions and the changes in drivers in China. J. Ind. Ecol. 2019, 23, 959–971. [Google Scholar]
- 27Carbon Emission Accounts and Datasets. Available online: https://www.ceads.net/ (accessed on 25 February 2025).
- China Energy Statistical Yearbook 2022. Available online: https://www.stats.gov.cn/ (accessed on 25 February 2025).
- Guidelines for the Preparation of Provincial Greenhouse Gas Inventories. Available online: https://max.book118.com/html/2017/0923/134771860.shtm (accessed on 25 February 2025).
- Statistical Yearbook of Jiangsu Province 2012–2022. Available online: https://www.jiangsu.gov.cn/ (accessed on 25 February 2025).
- Jiangsu Provincial Department of Industry and Information Technology. Available online: https://gxt.jiangsu.gov.cn/ (accessed on 25 February 2025).
- Nanjing Statistical Yearbook. 2012–2022. Available online: https://tjj.nanjing.gov.cn (accessed on 25 February 2025).
- Yang, J.; Cai, W.; Ma, M.; Li, L.; Liu, C.; Ma, X.; Li, L.; Chen, X. Driving forces of China’s CO2 emissions from energy consumption based on Kaya-LMDI methods. Sci. Total Environ. 2020, 711, 134569. [Google Scholar] [CrossRef]
- Jehlička, P.; Jacobsson, K. The importance of recognizing difference: Rethinking Central and East European environmentalism. Political Geogr. 2021, 87, 102379. [Google Scholar] [CrossRef]
- Ang, B.W. LMDI decomposition approach: A guide for implementation. Energy Policy 2015, 86, 233–238. [Google Scholar] [CrossRef]
- Ang, B.W. The LMDI approach to decomposition analysis: A practical guide. Energy Policy 2005, 33, 867–871. [Google Scholar] [CrossRef]
- Ke, J.; Zheng, N.; Fridley, D.; Price, L.; Zhou, N. Potential energy savings and CO2 emissions reduction of China’s cement industry. Energy Policy 2012, 45, 739–751. [Google Scholar] [CrossRef]
- Feng, X.-Z.; Lugovoy, O.; Qin, H. Co-controlling CO2 and NOx emission in China’s cement industry: An optimal development pathway study. Adv. Clim. Change Res. 2018, 9, 34–42. [Google Scholar] [CrossRef]
- The Fourteenth Five-Year New Urbanization Plan of Jiangsu Province. Available online: https://fzggw.jiangsu.gov.cn/art/2021/8/26/art_83783_9993919.html (accessed on 25 February 2025).
- WBCSD, IEA. Technology Roadmap Low-Carbon Transition in the Cement Industry. World Business Council for Sustainable Development and International Energy Agency. 2018. Available online: https://www.iea.org/ (accessed on 25 February 2025).
- Subramanyam, V.; Ahiduzzaman, M.; Kumar, A. Greenhouse gas emissions mitigation potential in the commercial and institutional sector. Energy Build. 2017, 140, 295–304. [Google Scholar] [CrossRef]
- Ma, Z.; Wang, Y.X.; Duan, H.Y.; Wang, X.E.; Dong, D.M. Study on the Passenger Transportation Energy Demand and Carbon Emission of Jilin Province Based on LEAP Model. Adv. Mater. Res. 2012, 518–523, 2243–2246. [Google Scholar] [CrossRef]
- Shi, C.; Qin, G.; Tan, Q.; Yang, J.; Chen, X.; Liu, Q.; Zhang, T.; Kammen, D.M. Simulation of hydrogen transportation development path and carbon emission reduction path based on LEAP model- A case study of Beijing-Tianjin-Hebei Region. Energy Policy 2024, 194, 114337. [Google Scholar] [CrossRef]
- Sadri, A.; Ardehali, M.M.; Amirnekooei, K. General procedure for long-term energy-environmental planning for transportation sector of developing countries with limited data based on LEAP (long-range energy alternative planning) and Energy PLAN. Energy 2014, 77, 831–843. [Google Scholar] [CrossRef]
- Feng, H.; Wang, R.; Zhang, H. Research on Carbon Emission Characteristics of Rural Buildings Based on LMDI-LEAP Model. Energies 2022, 15, 9269. [Google Scholar] [CrossRef]
- Zhang, C.; Luo, H. Research on carbon emission peak prediction and path of China’s public buildings: Scenario analysis based on LEAP model. Energy Build. 2023, 289, 113053. [Google Scholar] [CrossRef]
- Cai, L.; Duan, J.; Lu, X.; Luo, J.; Yi, B.; Wang, Y.; Jin, D.; Lu, Y.; Qiu, L.; Chen, S.; et al. Pathways for electric power industry to achieve carbon emissions peak and carbon neutrality based on LEAP model: A case study of state-owned power generation enterprise in China. Comput. Ind. Eng. 2022, 170, 108334. [Google Scholar] [CrossRef]
- Wu, Z.; Wu, Q.; Yu, X.; Wang, Q.; Tan, J. Exploring phase-out path of China’s coal power plants with its dynamic impact on electricity balance. Energy Policy 2024, 187, 114021. [Google Scholar] [CrossRef]
- Mirjat, N.H.; Uqaili, M.A.; Harijan, K.; Das Walasai, G.; Mondal, M.A.H.; Sahin, H. Long-term electricity demand forecast and supply side scenarios for Pakistan (2015–2050): A LEAP model application for policy analysis. Energy 2018, 165, 512–526. [Google Scholar] [CrossRef]
- Wang, H. Analysis and medium-long term forecast of China’s fixed asset investment in 2023. Ind. Innov. Res. 2023, 21, 1–4. [Google Scholar]
- Kresnawan, M.R.; Safitri, I.A.; Darmawan, I. Long Term Projection of Electricity Generation Sector in East Kalimantan Province: LEAP Model Application. In Proceedings of the 12th Symposium of the South-East-Asian-Technical-University-Consortium (SEATUC)—Engineering Education and Research for Sustainable Development, Yogyakarta, Indonesia, 12–13 March 2018. [Google Scholar]
- Ntuli, M.N.; Dioha, M.O.; Ewim, D.R.E.; Eloka-Eboka, A.C. Review of energy modelling, energy efficiency models improvement and carbon dioxide emissions mitigation options for the cement industry in South Africa. In Proceedings of the 5th International Conference on Engineering for a Sustainable World (ICESW), Ota, Nigeria, 10–12 November 2022; Covenant Univ, Ctr Entrepreneurial Studies: Ota, Nigeria, 2021; pp. 2260–2268. [Google Scholar]
- Oral, H.V.; Saygin, H. Simulating the future energy consumption and greenhouse gas emissions of Turkish cement industry up to 2030 in a global context. Mitig. Adapt. Strateg. Glob. Change 2019, 24, 1461–1482. [Google Scholar] [CrossRef]
- Energy Consumption Limit for Cement Products (GB16780-2021). Available online: https://www.cnis.ac.cn/bydt/kydt/202201/t20220104_52642.html (accessed on 25 February 2025).
- General Purpose Portland Cement (GB175-2023). Available online: https://std.samr.gov.cn/gb/search/gbDetailed?id=0B330DE79FE1CE9DE06397BE0A0AEFB0 (accessed on 25 February 2025).
- Aranda Usón, A.; López-Sabirón, A.M.; Ferreira, G.; Llera Sastresa, E. Uses of alternative fuels and raw materials in the cement industry as sustainable waste management options. Renew. Sustain. Energy Rev. 2013, 23, 242–260. [Google Scholar] [CrossRef]
- Gao, T.; Shen, L.; Zhao, J.; Wang, L.; Liu, L.; Dai, T. Regional disparity in clinker emission factors and their potential reduction in China. Environ. Sci. Pollut. Res. Int. 2021, 28, 64220–64233. [Google Scholar] [CrossRef]
- The Thirteenth Five-Year Plan of Jiangsu Province. Available online: https://www.jsrd.gov.cn/hyzl/qgrdh/d_9267/sycy/201802/t20180227_491059.shtml (accessed on 25 February 2025).
- Electrolytic Aluminum Industry Energy Saving and Carbon Reduction Special Action Plan. Available online: https://www.gov.cn/zhengce/zhengceku/202407/content_6964214.htm (accessed on 25 February 2025).
- The Fuel Replacement Ratio is Below 2%, and the Clinker Replacement Ratio During Cement Production is Under 5%. Available online: https://std.samr.gov.cn (accessed on 25 February 2025).
- Hall, L.M.H.; Buckley, A.R. A review of energy systems models in the UK: Prevalent usage and categorisation. Appl. Energy 2016, 169, 607–628. [Google Scholar] [CrossRef]
- Ahmed, A. Assessing the effects of supplementary cementitious materials on concrete properties: A review. Discov. Civil. Eng. 2024, 1, 145. [Google Scholar] [CrossRef]
- Van Deventer, J.S.J. Chapter 10—Progress in the Adoption of Geopolymer Cement. In Handbook of Low Carbon Concrete; Academic: Cambridge, MA, USA, 2017; pp. 217–262. [Google Scholar]
- Teng, L.; Xuan, Y.; Liu, X.; Liu, D.; Ding, Y. Efficient in situ conversion of captured CO2 into fuels enabled by direct solar driven multifunctional calcium looping. Renew. Sustain. Energy Rev. 2023, 183, 113484. [Google Scholar] [CrossRef]
- Han, J.; Sun, Q.; Jiang, Y. Studying the risk spillover effects of the carbon market and high-carbon-emission industries under economic uncertainty. Front. Environ. Sci. 2024, 12, 1407135. [Google Scholar] [CrossRef]
Disclaimer/Publisher’s Note: The statements, opinions and data contained in all publications are solely those of the individual author(s) and contributor(s) and not of MDPI and/or the editor(s). MDPI and/or the editor(s) disclaim responsibility for any injury to people or property resulting from any ideas, methods, instructions or products referred to in the content. |
© 2025 by the authors. Licensee MDPI, Basel, Switzerland. This article is an open access article distributed under the terms and conditions of the Creative Commons Attribution (CC BY) license (https://creativecommons.org/licenses/by/4.0/).