Article

Environmental Impacts and Adsorption Isotherms of Coconut Shell Activated Carbon: Effect of Acid Activation, Water, and Fuel

1
Division of Sustainable Development, College of Science and Engineering, Hamad Bin Khalifa University, Qatar Foundation, Doha P.O. Box 5825, Qatar
2
Center for Advanced Materials, Qatar University, Doha P.O. Box 2713, Qatar
*
Authors to whom correspondence should be addressed.
These authors contributed equally to this work.
Submission received: 9 January 2025 / Revised: 5 March 2025 / Accepted: 6 March 2025 / Published: 10 March 2025
(This article belongs to the Section Carbon Materials and Carbon Allotropes)

Abstract

:
Activated biomass has gained interest as an alternative to coal-based activated carbon (AC). This work investigates the environmental impact (EI) of coconut shell (CS)-derived AC as a substitute for non-renewable coal-based AC. The AC was produced in-house using tandem acid activation and pyrolysis, employing two activation pathways: sulfuric acid (H2SO4) and phosphoric acid (H3PO4). This study further investigates the impact of activation routes, fuel types, and water sources on environmental outcomes. This evaluation focuses on six key impacts: climate change, fossil depletion, freshwater ecotoxicity, freshwater eutrophication, land use, and energy net. The H2SO4 activation pathway is more favorable in terms of EI due to its lower net energy requirement (27.2 MJ) and reduced carbon emissions (1.2 kg CO2 eq.). However, it requires 4.7 kg of AC to adsorb 1 kg of dye, whereas the H3PO4 pathway requires only 4.3 kg. Therefore, while the H3PO4 pathway may be preferred for applications needing higher adsorption capacities, the H2SO4 pathway offers a more environmentally benign option, highlighting the trade-offs in selecting an activation method for AC production. Additionally, this study highlights that CS-derived AC offers substantial energy savings of 78%, alongside a 75% reduction in carbon emissions and an 80% decrease in fossil depletion compared to coal-based AC. Overall, the synthesized AC shows promise as a sustainable alternative to coal-based counterparts.

1. Introduction

Activated carbon (AC) is known for its exceptional adsorption properties, making it a popular choice for various applications. Its high surface area and porous structure allow it to trap impurities and contaminants effectively [1,2]. In water treatment, AC can remove organic compounds, chlorine, and other pollutants, improving water quality [3,4]. Moreover, in air purification systems, it can capture volatile organic compounds and odors, enhancing indoor air quality. Using sustainable AC derived from waste materials, such as tire ash, for synergistic adsorption-photocatalytic remediation offers an effective approach to remove contaminants like methylene blue dye from textile wastewater [5]. Recently, the development of AC flakes from palm fiber and polyolefin wastes has gained attention for its potential to lower environmental impacts [6]. Its versatility and efficiency make AC a valuable material in numerous industries worldwide [7].
Methods of producing AC include physical activation, where carbonaceous materials are exposed to high temperatures in the presence of gases like carbon dioxide or steam. Chemical activation involves treating the raw material with chemicals like phosphoric/sulfuric acid or potassium/sodium hydroxide to create pores [8,9]. Another method is the use of a combination of physical and chemical activation for tailored pore structures. The choice of production method impacts on the characteristics of the AC produced, such as pore size distribution and surface area. Each method has its advantages and is selected based on the desired application of the AC.
Coconut shell (CS)-based AC is favored for its sustainability and plentiful supply, providing an environmentally friendly substitute for conventional materials, such as coal. As a low-cost and renewable waste product, CS consists of approximately 28% lignin, 36% cellulose, and 25% hemicellulose, making it an excellent source for AC production [10,11]. It provides a high surface area and has been utilized as electrodes [12], adsorbents for volatile organic compounds [13], dyes and metals [14], and graphene [15].
While CSs have shown strong potential for the sustainable production of high-quality AC, it is crucial to ensure that their conversion processes are environmentally friendly and optimized [16,17]. A life cycle assessment (LCA) provides a robust basis for impact assessment and policy formulation by examining the EIs of products and systems [18]. In the context of biomass recycling, an LCA is especially relevant and valuable as a tool.
The effects of CS-based AC production on the environment have been assessed in numerous studies [19,20,21]. A comparative analysis of CS AC with other raw materials such as coal, wood, peat, and reactivated coal AC revealed that CS AC has the lowest EI impact across several categories [22]. In addition, a study examines CS-derived producer gas as a substitute for coal gas and indicates that a CS-based route reduces 72% fossil fuel consumption and 18% carbon emission [23]. Also, the EIs of CS-based AC production were evaluated, focusing on energy sources and overall environmental performance. It was identified that using electrical energy from renewable sources like biomass could reduce contributions to human toxicity by up to 60% and global warming by up to 80% [24]. Furthermore, the environmental performance of AC produced through steam activation and the resulting electrodes was assessed, reporting a cumulative energy demand of 34.4 MJ and emissions of 5.68 kg of CO2. Significantly, the production of AC constituted about 60% of the overall EIs in the manufacturing of supercapacitor electrodes [25]. A study compares EIs of AC produced from palm-oil shells and CS, revealing that the EI of AC using CS is higher than that using palm-oil shells, particularly in terms of climate change, acidification/eutrophication, and fossil fuel consumption [26]. Moreover, a study emphasizes that understanding the physicochemical properties of CS biomass before thermochemical conversion is essential for producing high-grade charcoal and the importance of knowing the biomass composition for optimizing conversion treatments and reducing greenhouse gas emissions [27].
Existing LCA studies primarily focus on the EIs associated with AC production from CS, neglecting to address the dye adsorption capacity of the resulting AC. It is frequently observed that while some activation methods may enhance adsorption capacity, they may not be environmentally sustainable, considering factors such as net energy and carbon emissions. This gap highlights the need for comprehensive studies that evaluate both the EI and the functional performance of AC produced from CS. Thus, this study uniquely integrates environmental and functional performance analysis.
This research conducts an LCA of AC production by employing activation methods involving sulfuric acid (H2SO4) and phosphoric acid (H3PO4). Adsorption isotherms for acid-activation pathways are provided for the as-synthesized AC using alizarin red dye. The evaluation focuses on EIs per kg AC production, considering six key impacts: climate change, fossil depletion, freshwater ecotoxicity, freshwater eutrophication, land use, and energy net. A comparison is made between these findings and those of commercially available AC, and recommendations are put forth for enhancements, such as altering the fuel source and the type of water utilized in the process.

2. Materials and Methods

The H2SO4, H3PO4, and alizarin red (AR) were sourced from Sigma Aldrich (St. Louis, MO, USA), while the CSs were collected locally.

2.1. Preparation of AC

The coconut shells were enclosed in aluminum foil and kept in a hot furnace as discussed in our previous work [28]. The temperature was set to 600 °C at 10 °C per min increments under nitrogen. Then, the coconut shells were pyrolyzed for 2 h and then cooled down to room temperature at the same rate. Then, the pyrolyzed carbon was soaked in 1.83 M H2SO4 and 2 M H3PO4 solution and left for stirring overnight. The solution was neutralized and rinsed with water and dried under the shade.
Figure 1 illustrates the process flow diagram for the activation procedure, with detailed descriptions and comments available in Table 1. The neutralization step entails eliminating acidic properties to attain a neutral pH, achieved by rinsing the material with water three to five times. For the activation process, we used a mixture of acid and water, specifically preparing solutions of 1.83 M H2SO4 and 2 M H3PO4. This activation process employed both the prepared acid solutions and water. The drying phase was carried out in two stages: initially before activation and subsequently after the acid activation–neutralization step. To determine the adsorption capacity of the prepared AC, 3.2 g/L of AR in water was utilized.
LCA Goal and Scope: This research aims to ascertain the EIs of different techniques used in the production of AC from CS, including transportation and all the necessary inputs, as depicted in Figure 1, but excluding the AC’s end-of-life phase. This study was guided by several assumptions and constraints:
  • The quantification of the inputs and outputs was based on lab-scale experiments.
  • All the materials for the recycling process were sourced locally.
  • The recycling process’s energy was derived from electricity, which was sourced from natural gas. In Qatar, where natural gas is the dominant energy source, these assumptions were accurate. However, the results may vary in regions with different energy mixes.
  • The water was reused in successive processes.
  • Deionized-desalinated water was used as a base case. Deionizing water, which is more energy-intensive than underground water, can be produced via distillation, ion exchange, or reverse osmosis. In this dataset, ion exchange was modeled, with cations and anions exchanged with protons and hydroxide ions. The ion exchanger was regenerated with hydrochloric acid and caustic soda.
  • Energy consumption and emissions from the equipment were not considered. The functional unit was defined as 1 kg of AC produced from CSs, with comparisons to commercial AC based on equal weights. The functional unit was the basis for comparing the environmental impacts of the different production scenarios.
  • The EI data for commercial AC was sourced from the LCA for Experts (GaBi) database.
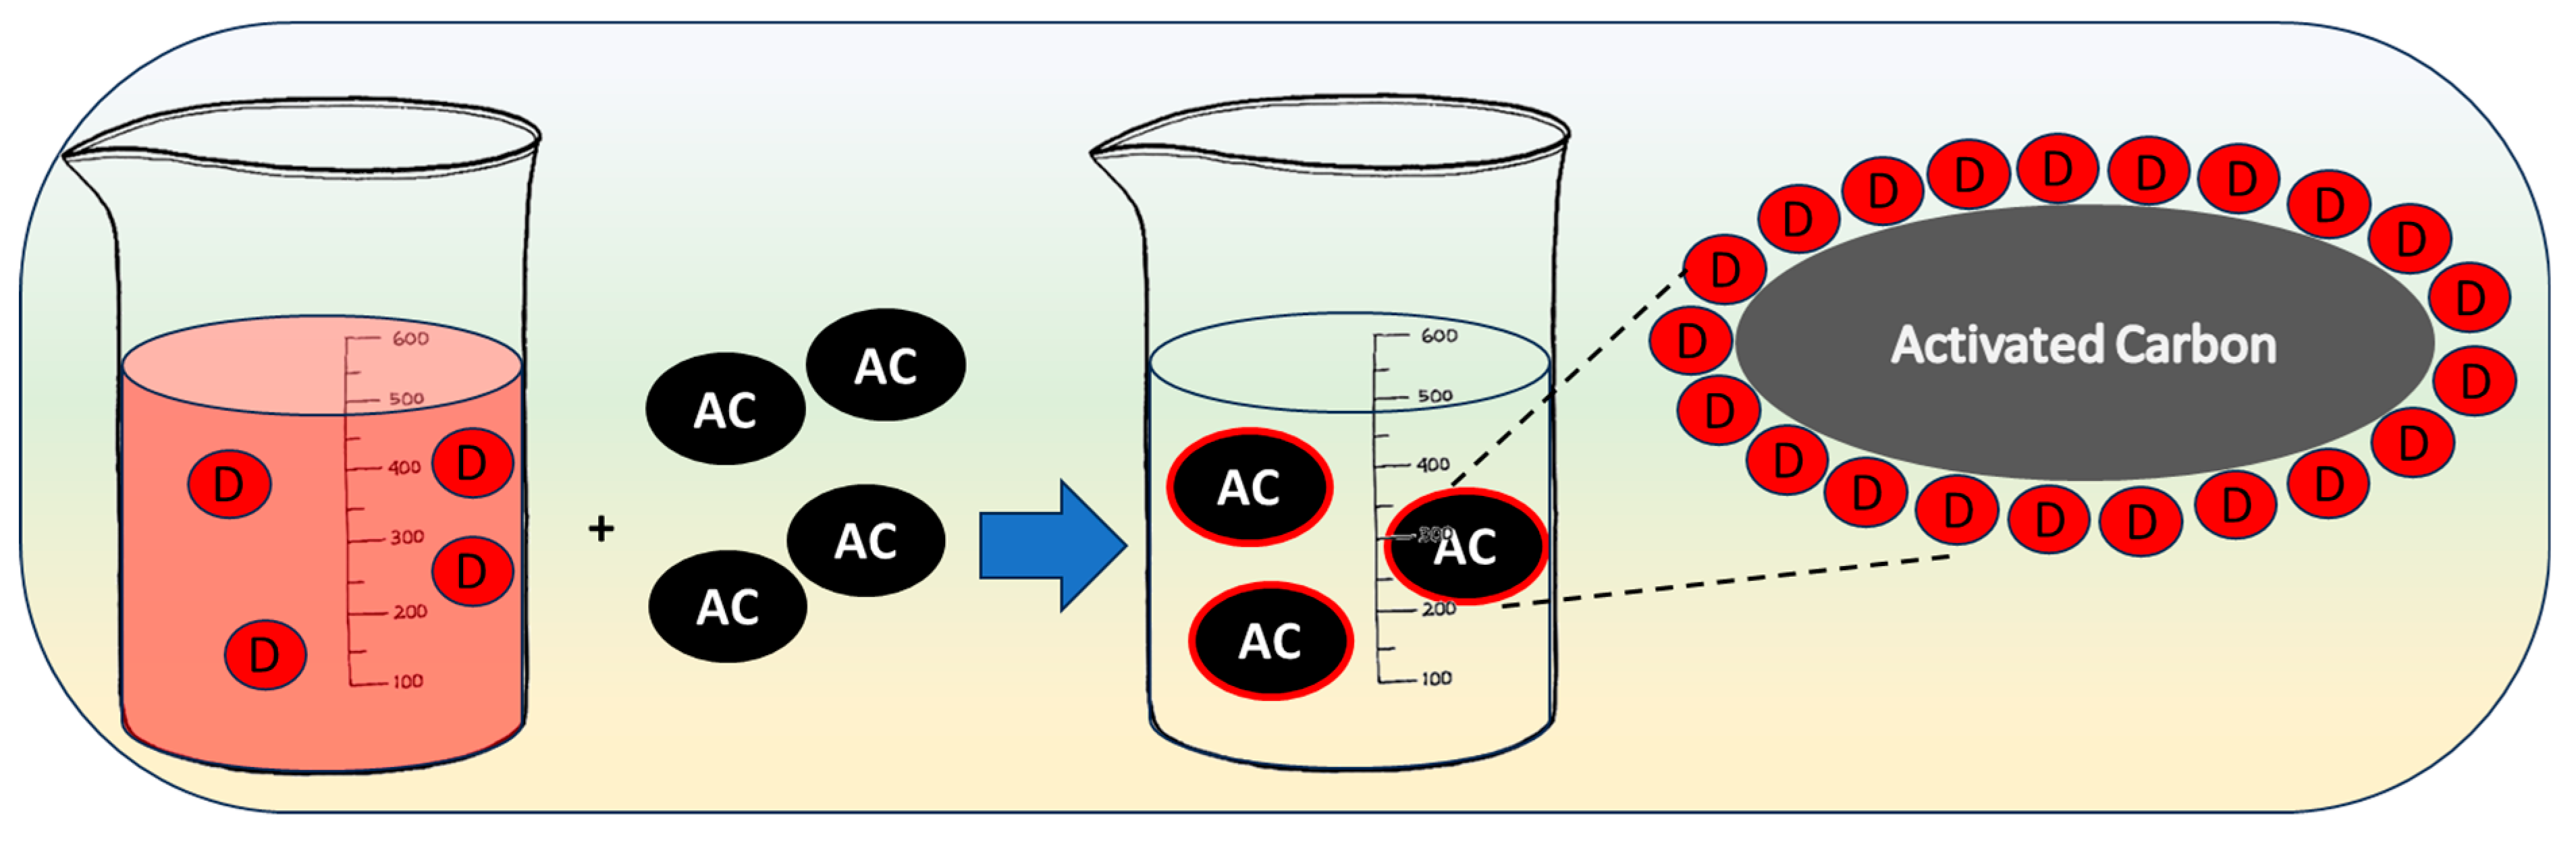
The LCI stage involved detailed cataloging and quantification of all the inputs and outputs, including raw material consumption, energy use, and emissions for each activation process step, following the ISO 14040 and ISO 14044 standards [29,30,31]. Laboratory measurements provided a baseline for evaluating raw material consumption, with Table 1 presenting data for two scenarios. This study used the ReCiPe midpoint approach, a widely recognized method in LCA to evaluate EIs at various stages of AC production.

2.2. Dye Adsorption

Alizarin red dye solutions (100 mL) with initial concentrations ranging from 5 to 1200 mg/L were placed in flasks. An equal mass of 0.1 g of AC was added to each flask, and the mixtures were kept in a shaker at 298 K for 24 h to reach equilibrium. The initial pH of the solutions, approximately 7, was maintained throughout the experiments. The procedure was repeated with two additional sets of flasks containing the same dye concentrations and quantity of AC, maintained at different temperatures: 318 K and 338 K. Samples from the aqueous solutions were collected and centrifuged to reduce interference from fine carbon particles before the analysis. Each experiment was conducted twice to ensure reliability, and dye concentrations were measured using a UV spectrophotometer.

3. Results and Discussion
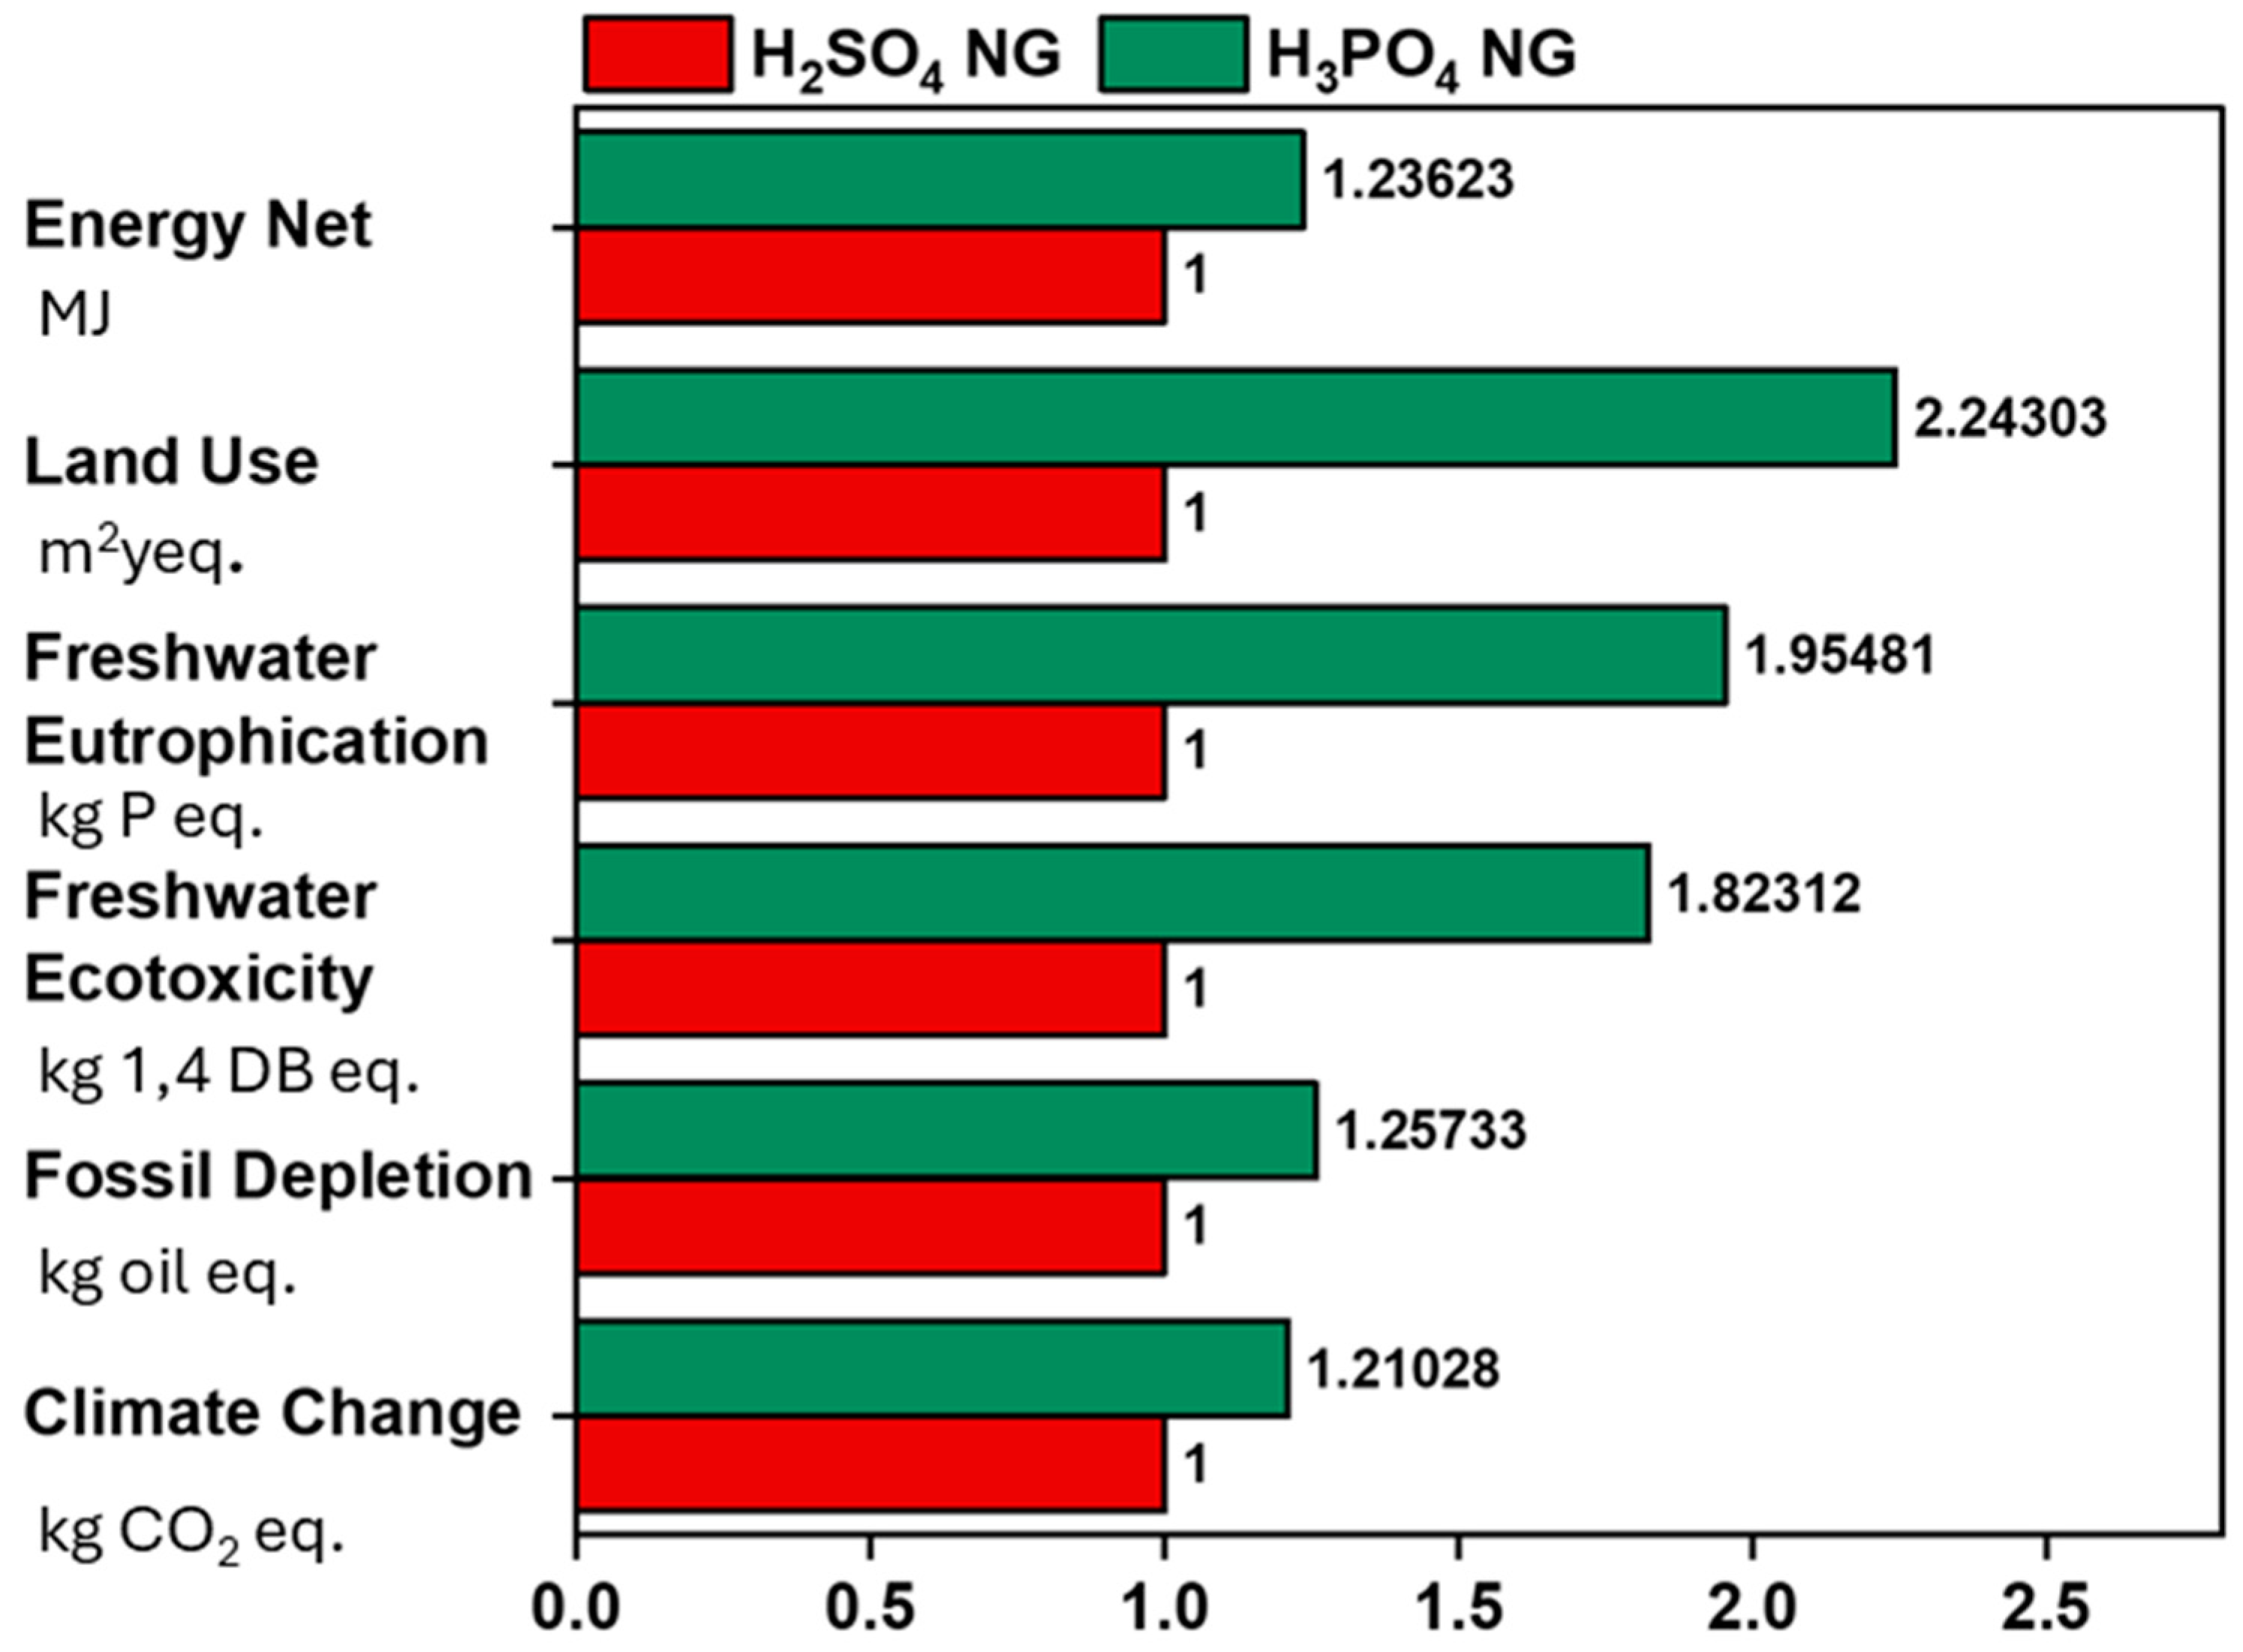
3.1. EI Assessment

The six impact categories are estimated for both sulfuric acid and phosphoric acid pathways for AC production, as presented in Figure 2.
(a) Climate Change (CC) and Net Energy: CC measures the potential contribution to global warming, expressed as kg of CO2 equivalent. It accounts for the release of greenhouse gases such as CO2, methane (CH4), and nitrous oxide (N2O), which trap heat in the atmosphere and lead to climate change. Sulfuric acid (H2SO4) production results in lower carbon emissions compared to phosphoric acid (H3PO4). Specifically, H2SO4 emits about 18% less CO2 equivalent than H3PO4, indicating it is more environmentally friendly in terms of greenhouse gas emissions.
Net energy, on the other hand, measures the total energy consumed in the life cycle of a product or process. It accounts for all energy inputs, including extraction, production, and transportation. Sulfuric acid (H2SO4) production consumes less energy compared to phosphoric acid (H3PO4). H2SO4’s net energy consumption is about 19% lower, making it a more energy-efficient option.
The increased levels of carbon emissions and net energy consumption are linked to the production of H3PO4 due to its specific operational process. H3PO4 is produced through the wet process from raw phosphate and sulfuric acid. In this process, phosphate ore—fluoroapatite, primarily composed of (Ca10(PO4)6F2), with some additional compounds, such as calcite, quartz, and clay—is reacted with aqueous sulfuric acid to create phosphoric acid. The process produces gypsum anhydrite (CaSO4) and H2(SiF6) as co-products depending on the composition of the phosphor ore input. The phosphor ore is crushed and ground to increase the surface area for the reaction. Deionized water is used both to prepare a 96% aqueous solution of H2SO4 and during the filtration/washing stage [32,33].
Fluoroapatite contains about 4% fluoride. When digested by phosphoric acid, fluoride is released as hydrogen fluoride. This hydrogen fluoride then reacts with silica, either present in the ore or added as clay, resulting in a fluorosilicic acid solution within the phosphoric acid. During production, some of the fluorosilicic acid precipitates, forming compounds with sodium or potassium ions or more complex substances. The presence of fluoride in phosphoric acid not only makes this acid more corrosive, but it also makes it unsuitable for fertilizer applications if the concentration is too high. The removal of fluoride from the phosphoric acid is an industrial need, and control of the concentration of the fluoride to be released into the air is critical for the protection of the environment [33,34].
In contrast, H2SO4 production benefits from cheaper raw materials, a more efficient production process, and significant economies of scale, making it less costly to produce. It involves the oxidation of sulfur-to-sulfur dioxide, which is then further oxidized to sulfur trioxide using the contact process in several reactors with different catalysts, before finally being dissolved in deionized water to form H2SO4.
Overall, H3PO4 production consumes more electricity and energy than H2SO4 production. This is primarily due to the energy-intensive steps involved in the concentration and purification of phosphoric acid, as well as the additional processing required for raw materials, like phosphate rock, and the complexity of the production process, which includes the use of sulfuric acid itself. Additionally, the energy requirements for concentrating and purifying phosphoric acid are significant.
(b) Freshwater Ecotoxicity: This measures the potential toxic effects on freshwater ecosystems, expressed in kg of 1,4-dichlorobenzene equivalent. Sulfuric acid production has a significantly lower freshwater ecotoxicity impact than phosphoric acid. Acid treatment typically involves the addition of acids that lower the pH of water. Freshwater organisms, such as fish, amphibians, invertebrates, and plants, often have a specific pH range within which they can survive and thrive. Significant deviations from this range can lead to stress or mortality. Additionally, lower pH levels can increase the solubility of metals in water, such as aluminum, lead, and mercury. Elevated concentrations of these metals can be toxic to aquatic organisms. For example, aluminum toxicity can damage fish gills, impairing respiration and leading to suffocation. Acidification can also alter the availability of essential nutrients like phosphorus and nitrogen, impacting the growth of primary producers like algae and aquatic plants, disrupting the entire food web. Furthermore, acidic conditions can inhibit microbial activity and the decomposition of organic matter, leading to the accumulation of organic matter and affecting nutrient cycling in the ecosystem. Acidification can lead to a loss of sensitive species and a reduction in biodiversity, affecting ecosystem stability and resilience. Additionally, acidic conditions can increase the concentration of un-ionized ammonia, which is toxic to aquatic life. Ammonia toxicity can affect the nervous system and gill function of fish and other organisms. Hence, acid treatment can have significant and multifaceted effects on freshwater ecotoxicity, influencing the health and stability of aquatic ecosystems. These effects can be direct, such as physiological stress on organisms, or indirect, such as changes in nutrient cycling and metal solubility.
(c) Fossil Depletion: This assesses the depletion of fossil fuel resources, expressed as kg of oil equivalent. It reflects the consumption of non-renewable energy sources, such as coal, oil, and natural gas. The production of sulfuric acid (H2SO4) shows a lower impact on fossil fuel depletion compared to phosphoric acid (H3PO4). H2SO4’s fossil depletion is approximately 20% lower compared to H3PO4, indicating that its production and use require fewer fossil resources, thereby making it a more resource-efficient choice. (d) Freshwater Eutrophication: This impact category evaluates the potential for nutrient enrichment in freshwater bodies. It is measured in kilograms of phosphorus equivalent (kg P-eq), which causes eutrophication. For freshwater eutrophication, sulfuric acid (H2SO4) shows lower impacts compared to phosphoric acid (H3PO4). H2SO4’s eutrophication potential is around 49% lower compared to H3PO4, indicating a lesser contribution to nutrient pollution in water bodies.
(e) Land Use Impact: This measures the area of land used or transformed for a particular activity, expressed in square meter years of annual crop equivalent. It considers land occupation and transformation, affecting biodiversity and ecosystem services. In terms of land use, sulfuric acid (H2SO4) has a much lower impact than phosphoric acid (H3PO4). H2SO4’s land use impact is approximately 55% lower, reflecting a smaller ecological footprint in terms of land occupation.

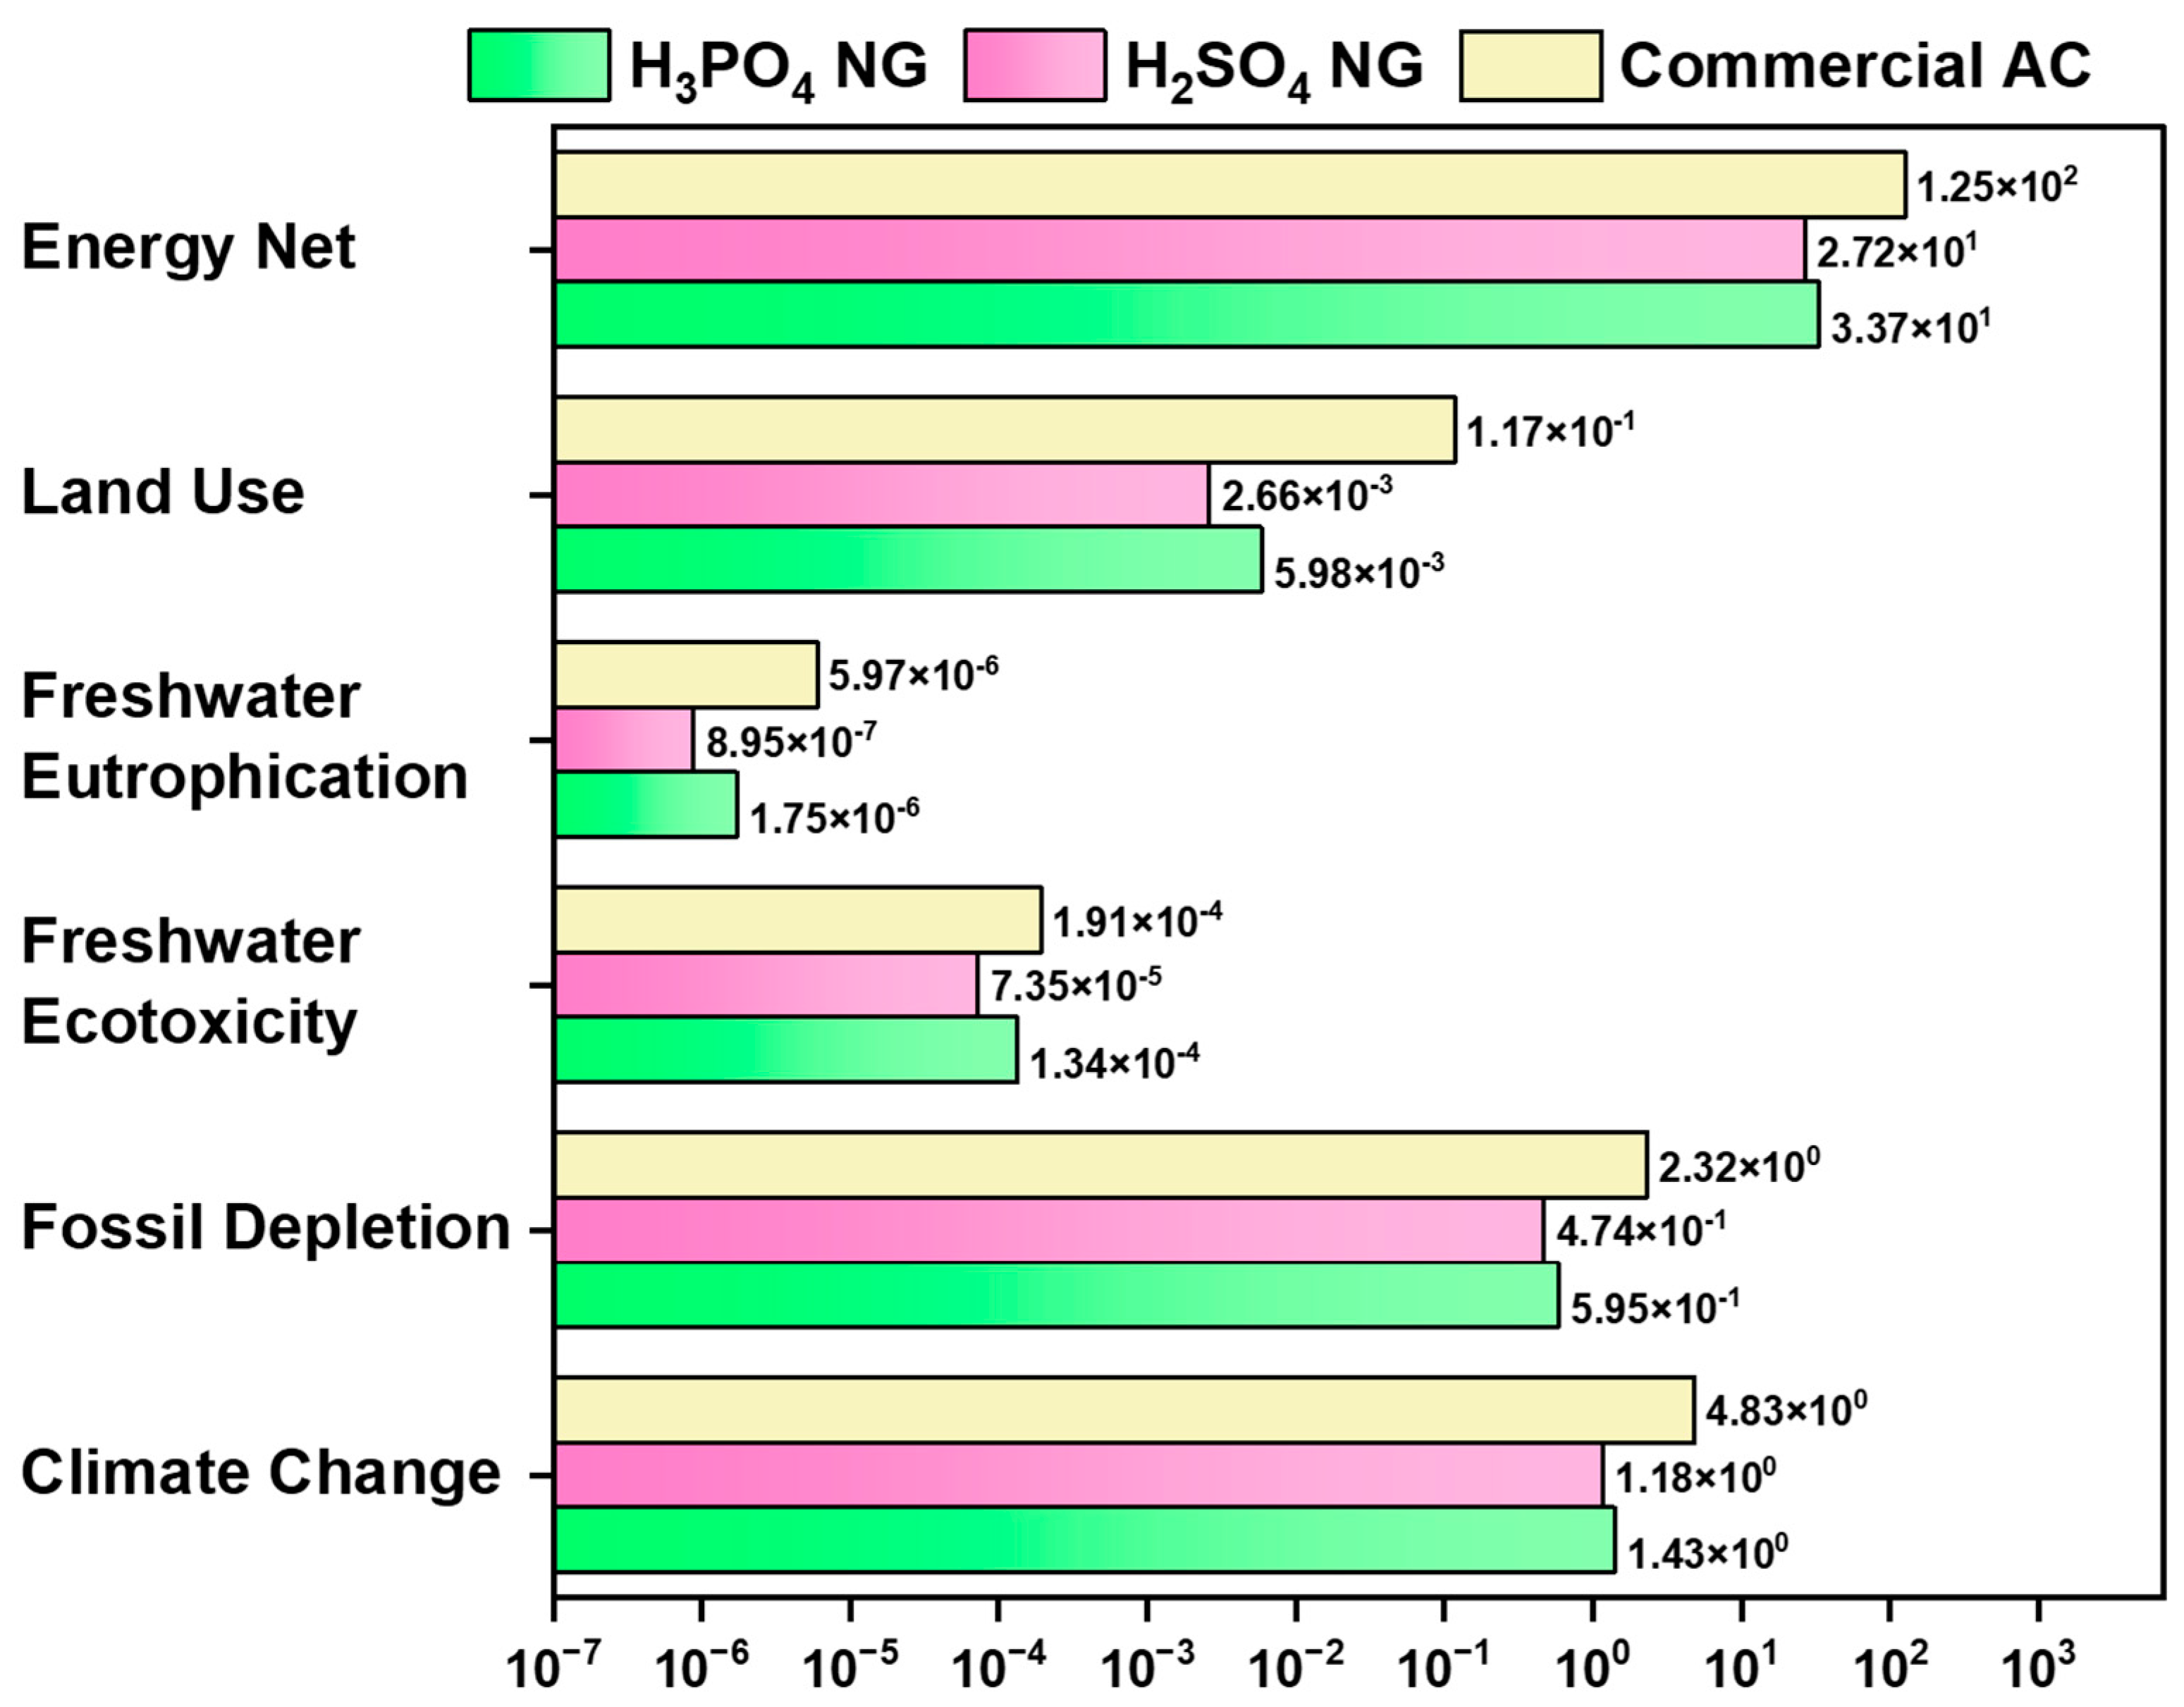
3.2. Comparison with Commercial AC

These results are compared with commercial AC in Figure 3 and Table 2, clearly showing that the EIs, including net energy and carbon emissions, are significantly lower for the as-synthesized AC than for the commercial AC. The higher values of EIs, particularly in terms of net energy and carbon emissions, are linked to its production process and the raw materials used. The main resources for the production of commercial AC are hard coal, brown coal, wood, and coconut or walnut shells. Its synthesis involves two main steps: first, the raw material is carbonized in an oxygen-free environment and then the resulting carbonized product is activated using water vapor [32]. Hence, commercial AC has higher values in all the impact categories, including fossil depletion, freshwater ecotoxicity, freshwater eutrophication, and land use. Table 3 summarizes the % improvement in lowering EIs using acid-activated CS-based AC in comparison to commercial AC.

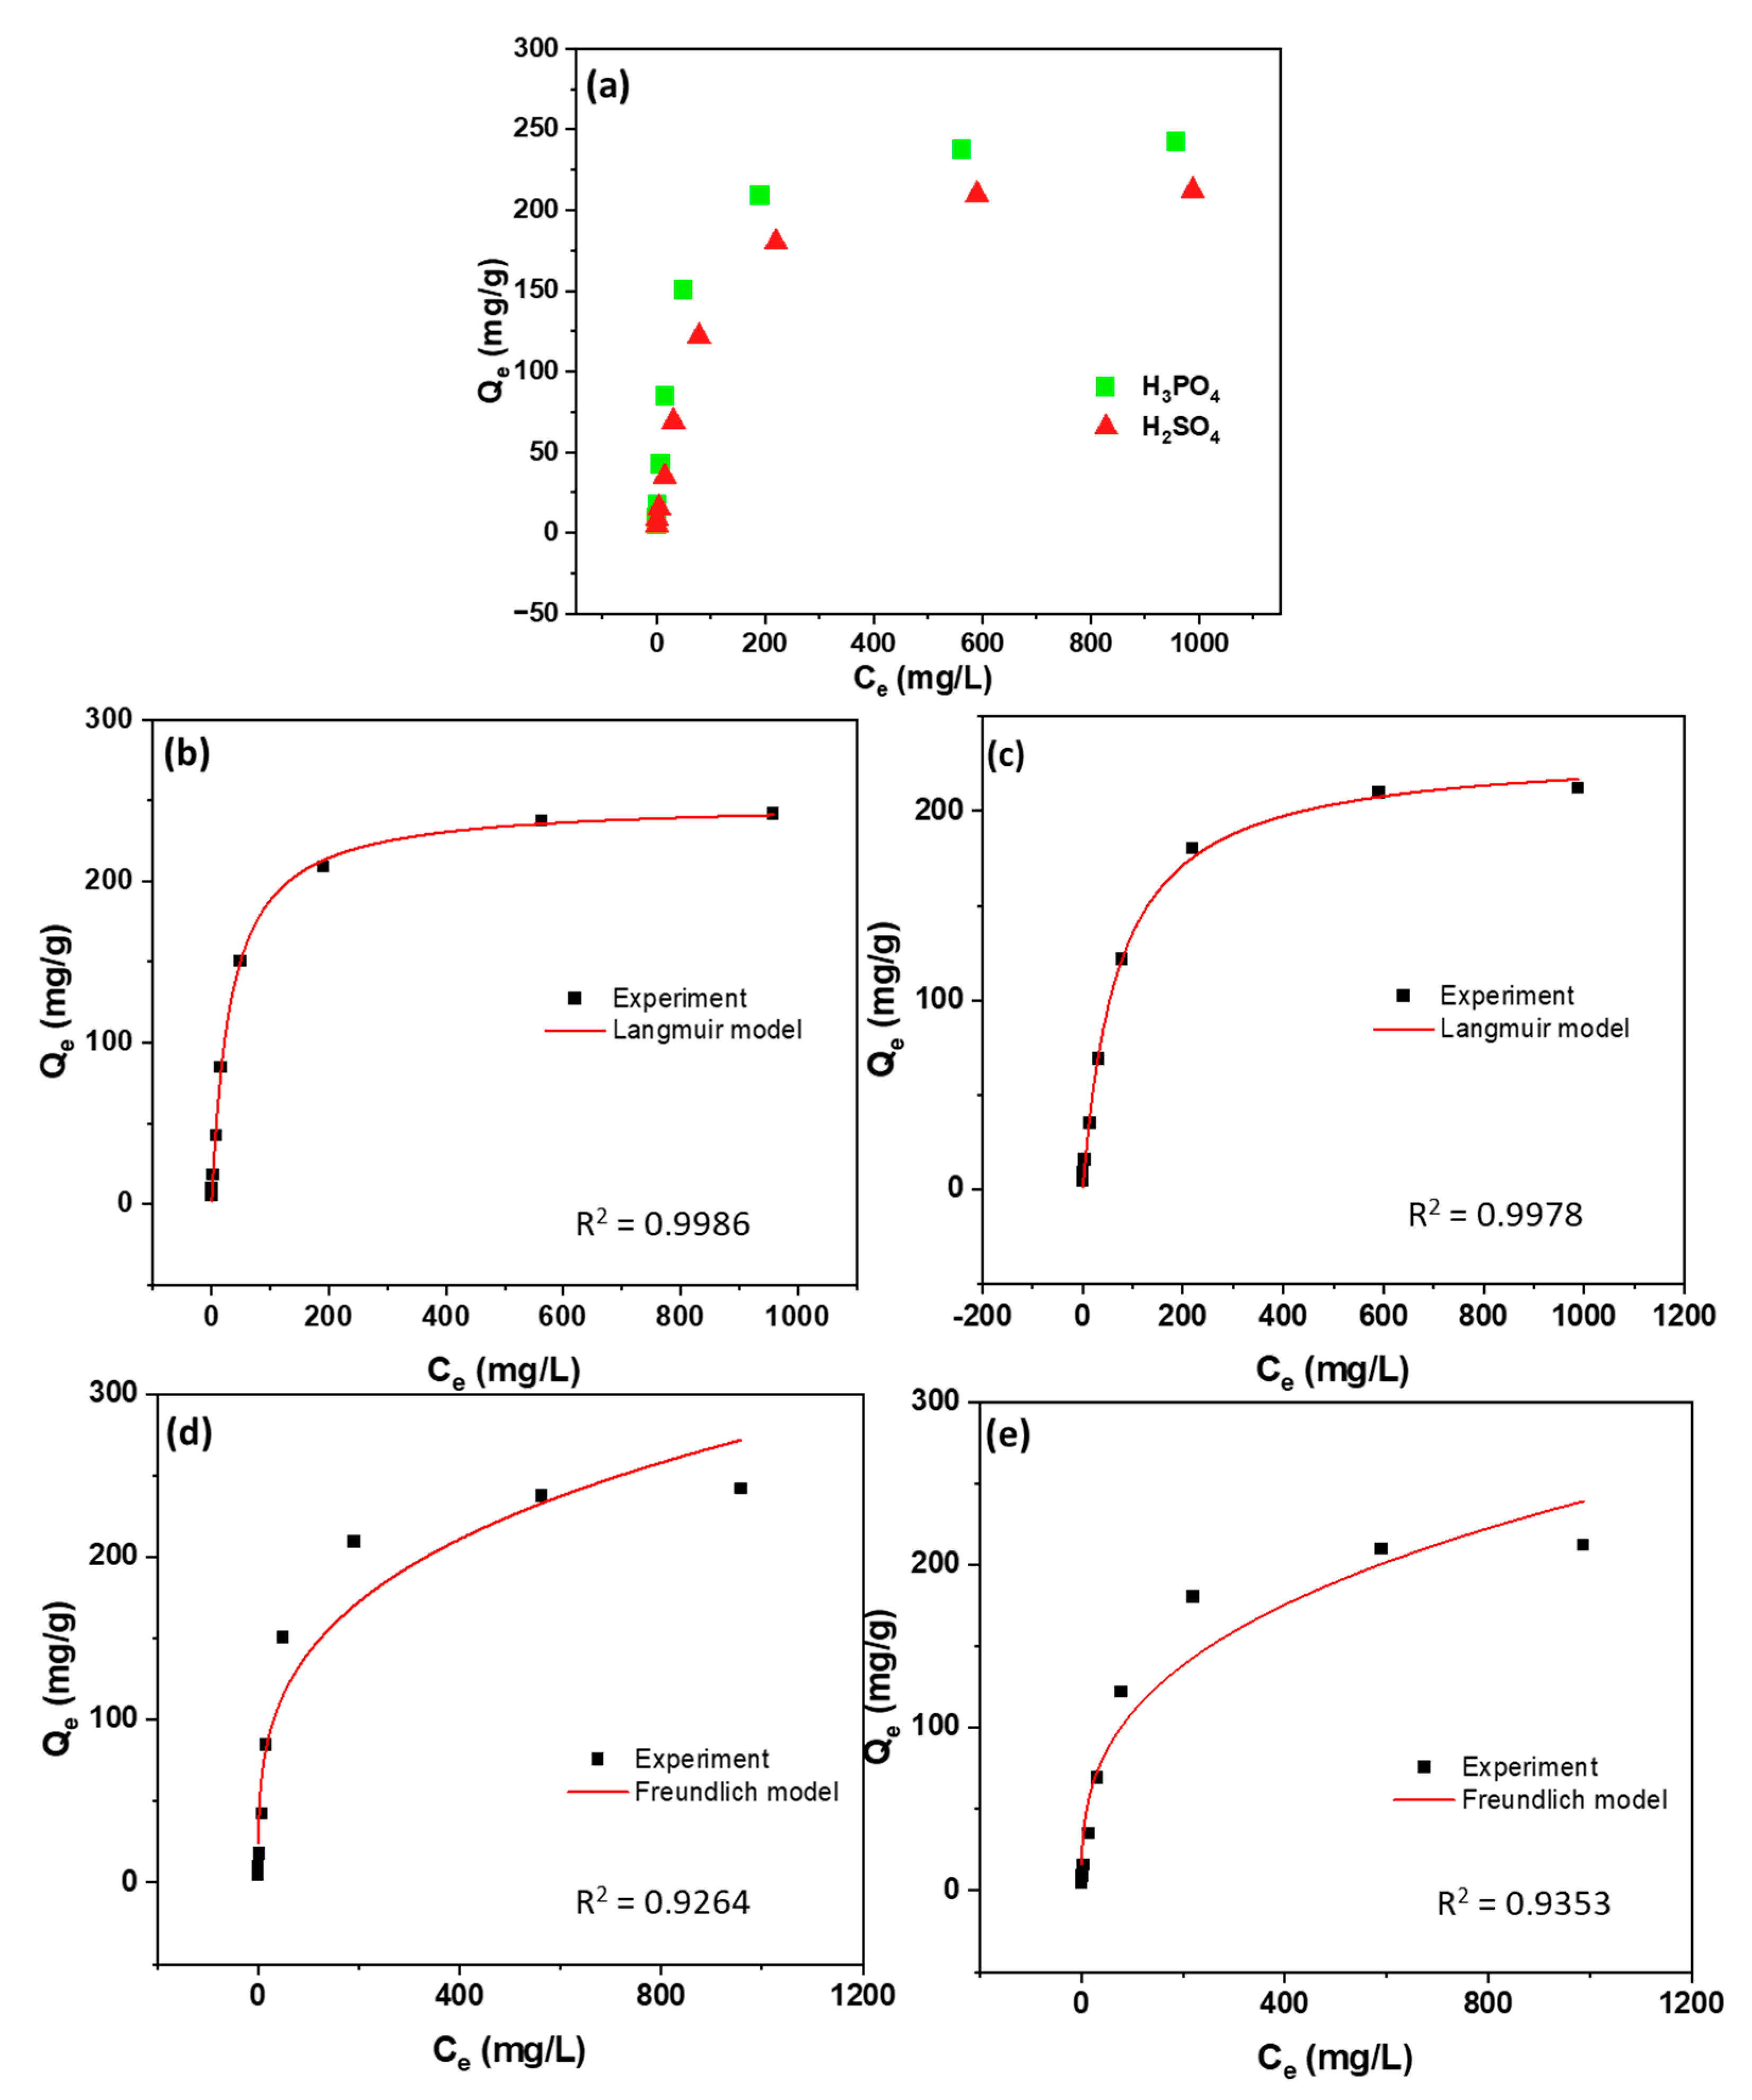
3.3. Adsorption Capacity

While the EIs of the activation processes provide a comprehensive understanding of the sustainability of different acid activation methods, it is equally important to consider their performance in practical applications. One such performance indicator is the adsorption capacity, which is critical for evaluating the efficiency of the AC in various industrial processes.
Activating agents such as H3PO4, H2SO4, KOH, and NaOH are all viable options, each with distinct advantages depending on the application. In this study, the acid activation route was specifically chosen due to its proven effectiveness in enhancing the adsorption capacity for anionic dyes, such as AR, which is the target pollutant in this study [35,36].
Figure 4 illustrates the mechanism of monolayer adsorption of alizarin red dye (D) on the AC surface. Figure 5 provides a comprehensive overview of the adsorption isotherm of the as-synthesized AC. The isotherm depicts the relationship between the concentration of the adsorbate in the solution at equilibrium (Ce) and the amount of adsorbate adsorbed per unit mass of adsorbent at equilibrium (Qe). This relationship is pivotal in understanding the adsorption behavior and efficiency of the AC for a specific adsorbate.
The data presented in Figure 5a reveal that the AC activated via the H2SO4 pathway exhibits an adsorption capacity of 212 g/kg (mg/g). Conversely, the AC activated through the H3PO4 pathway demonstrates a higher adsorption capacity, reaching 242 g/kg. This difference in adsorption capacity between the two activation pathways is significant and demonstrates the impact of the activation agent on the final properties of the AC. Figure 5b,c confirm that the adsorption data for both acids fit well with the Langmuir isotherm model, indicating monolayer adsorption on a homogenous surface.
While the H3PO4 activation pathway offers a superior adsorption capacity, it is important to consider other factors, such as the EI of the activation process. The H2SO4 activation pathway, despite its lower adsorption capacity, is more favorable in terms of EI. This is attributed to the lower net energy required and the reduced carbon emissions associated with the H2SO4 route. Thus, while the H3PO4 pathway may be preferred for applications requiring higher adsorption capacities, the H2SO4 pathway presents a more environmentally benign option, highlighting the trade-offs that must be considered in the selection of an activation method for AC production.

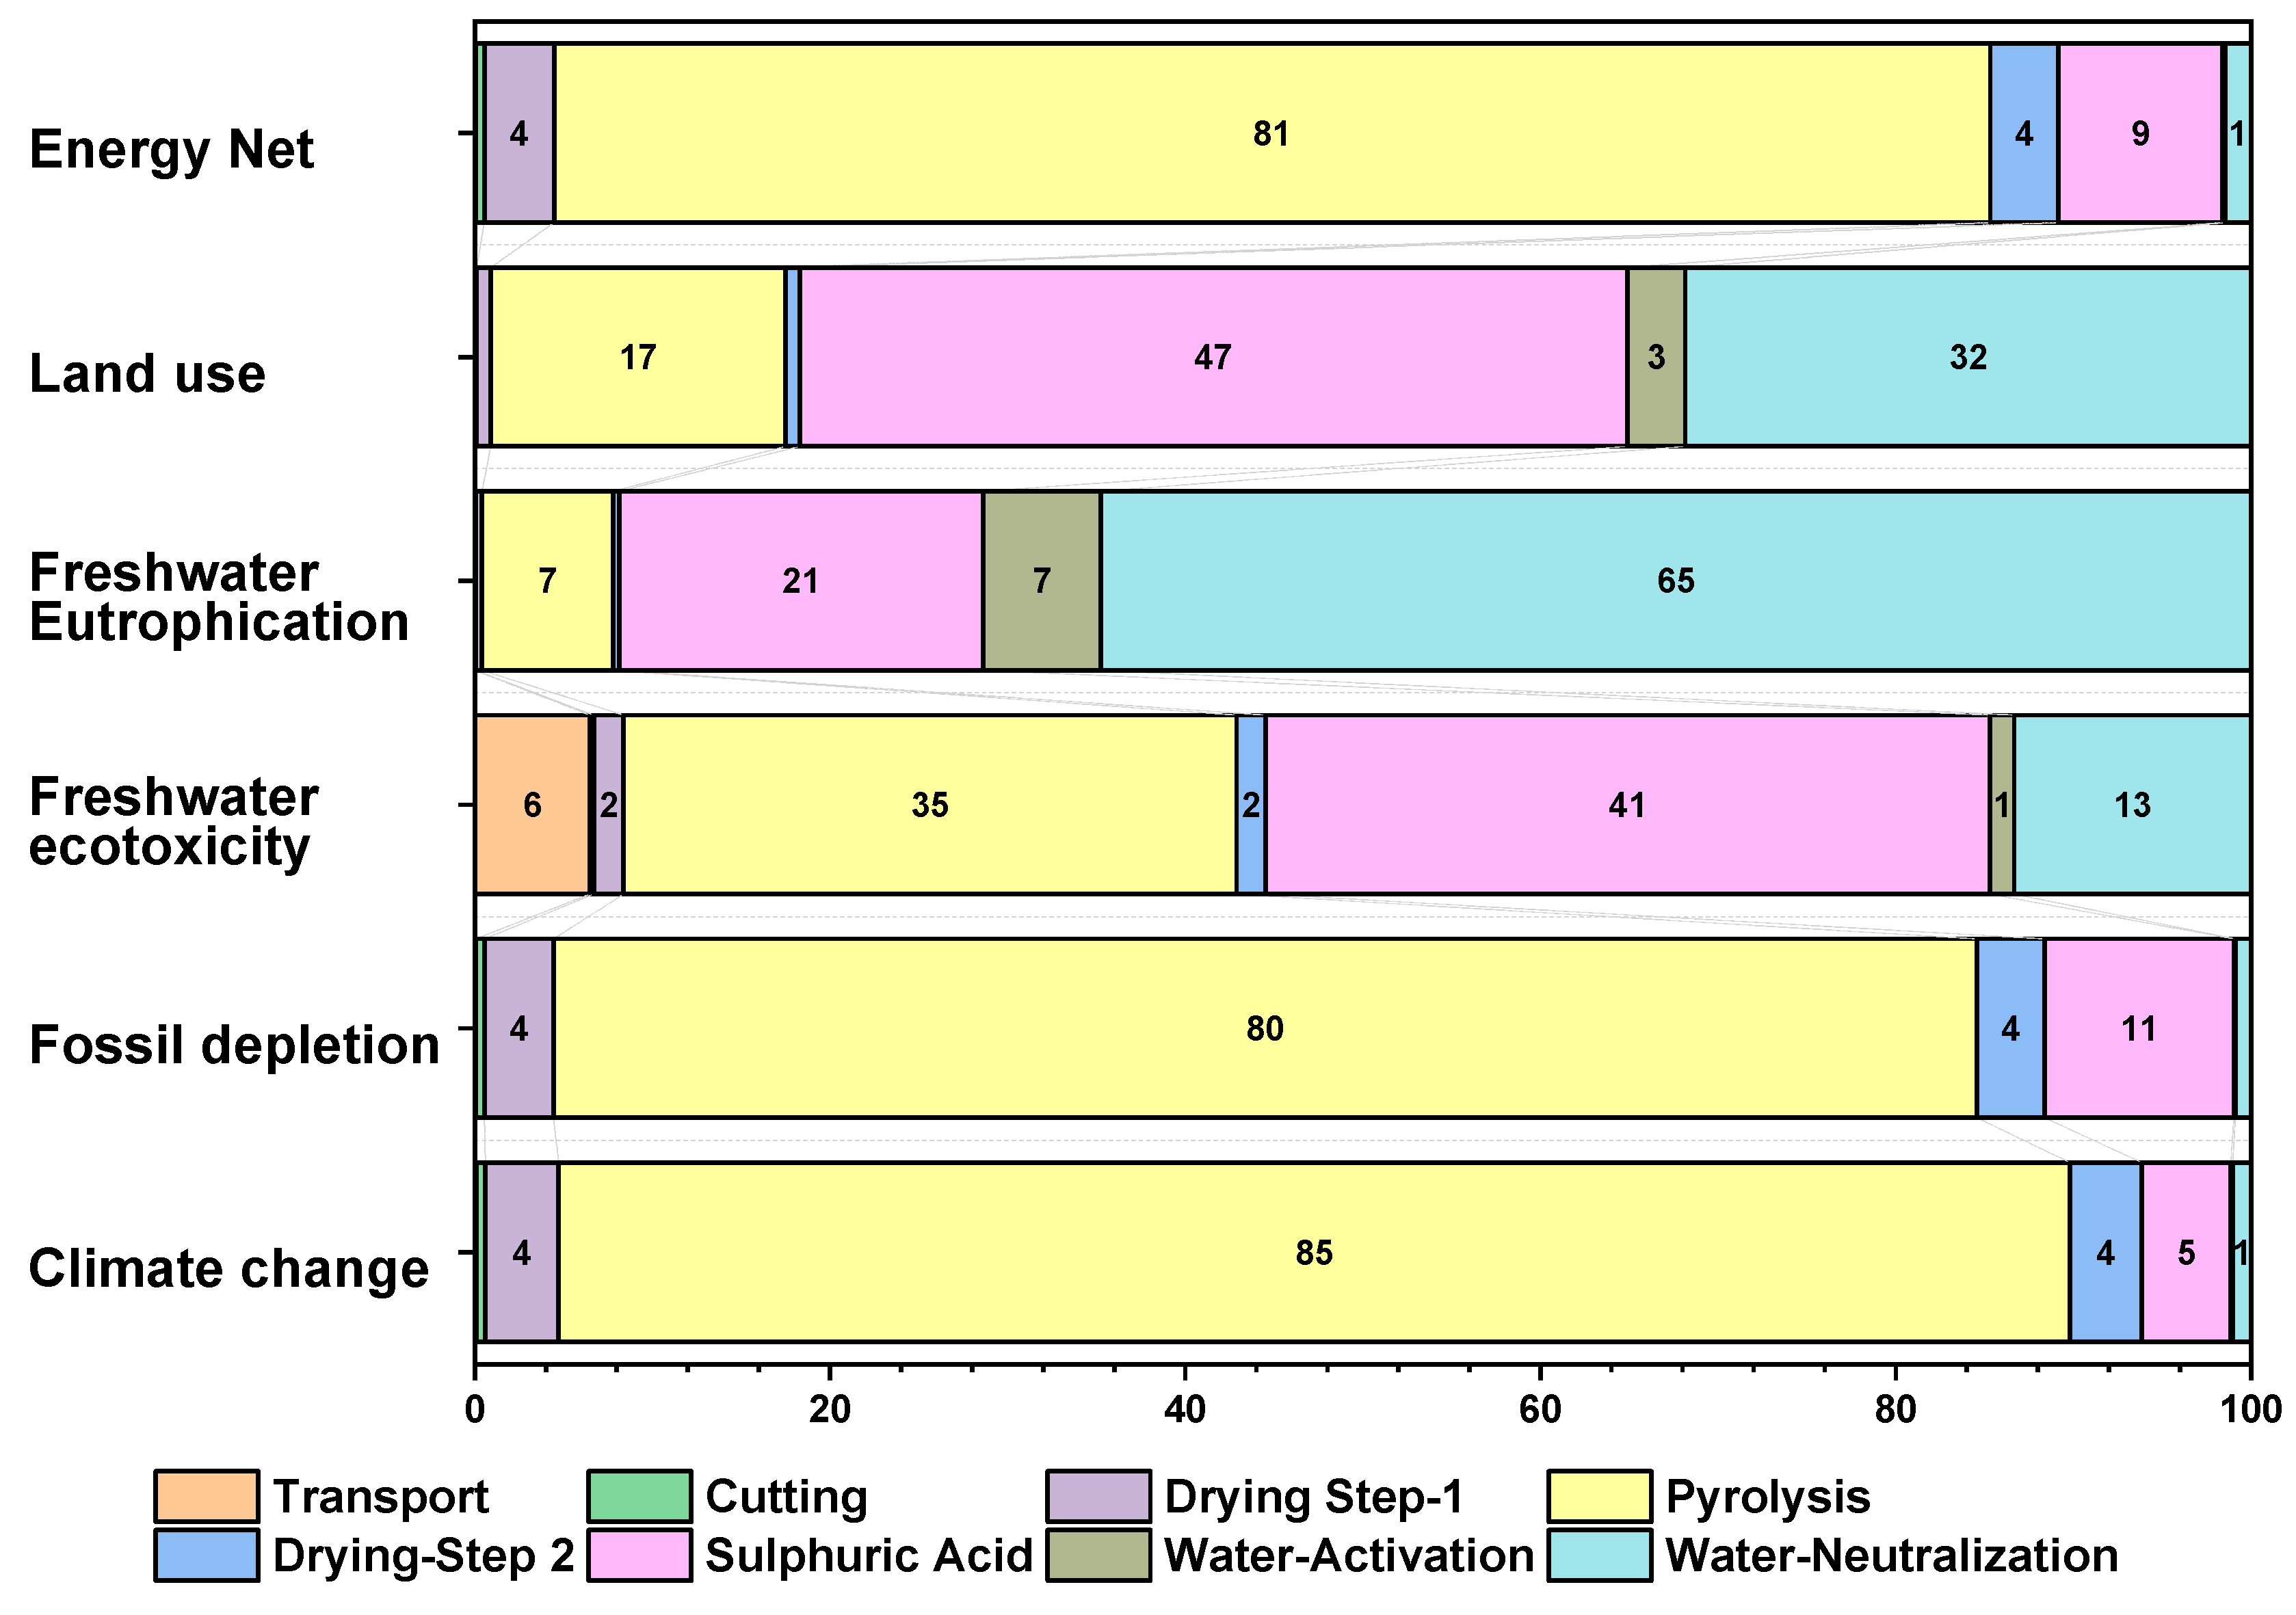
3.4. Contribution Analysis
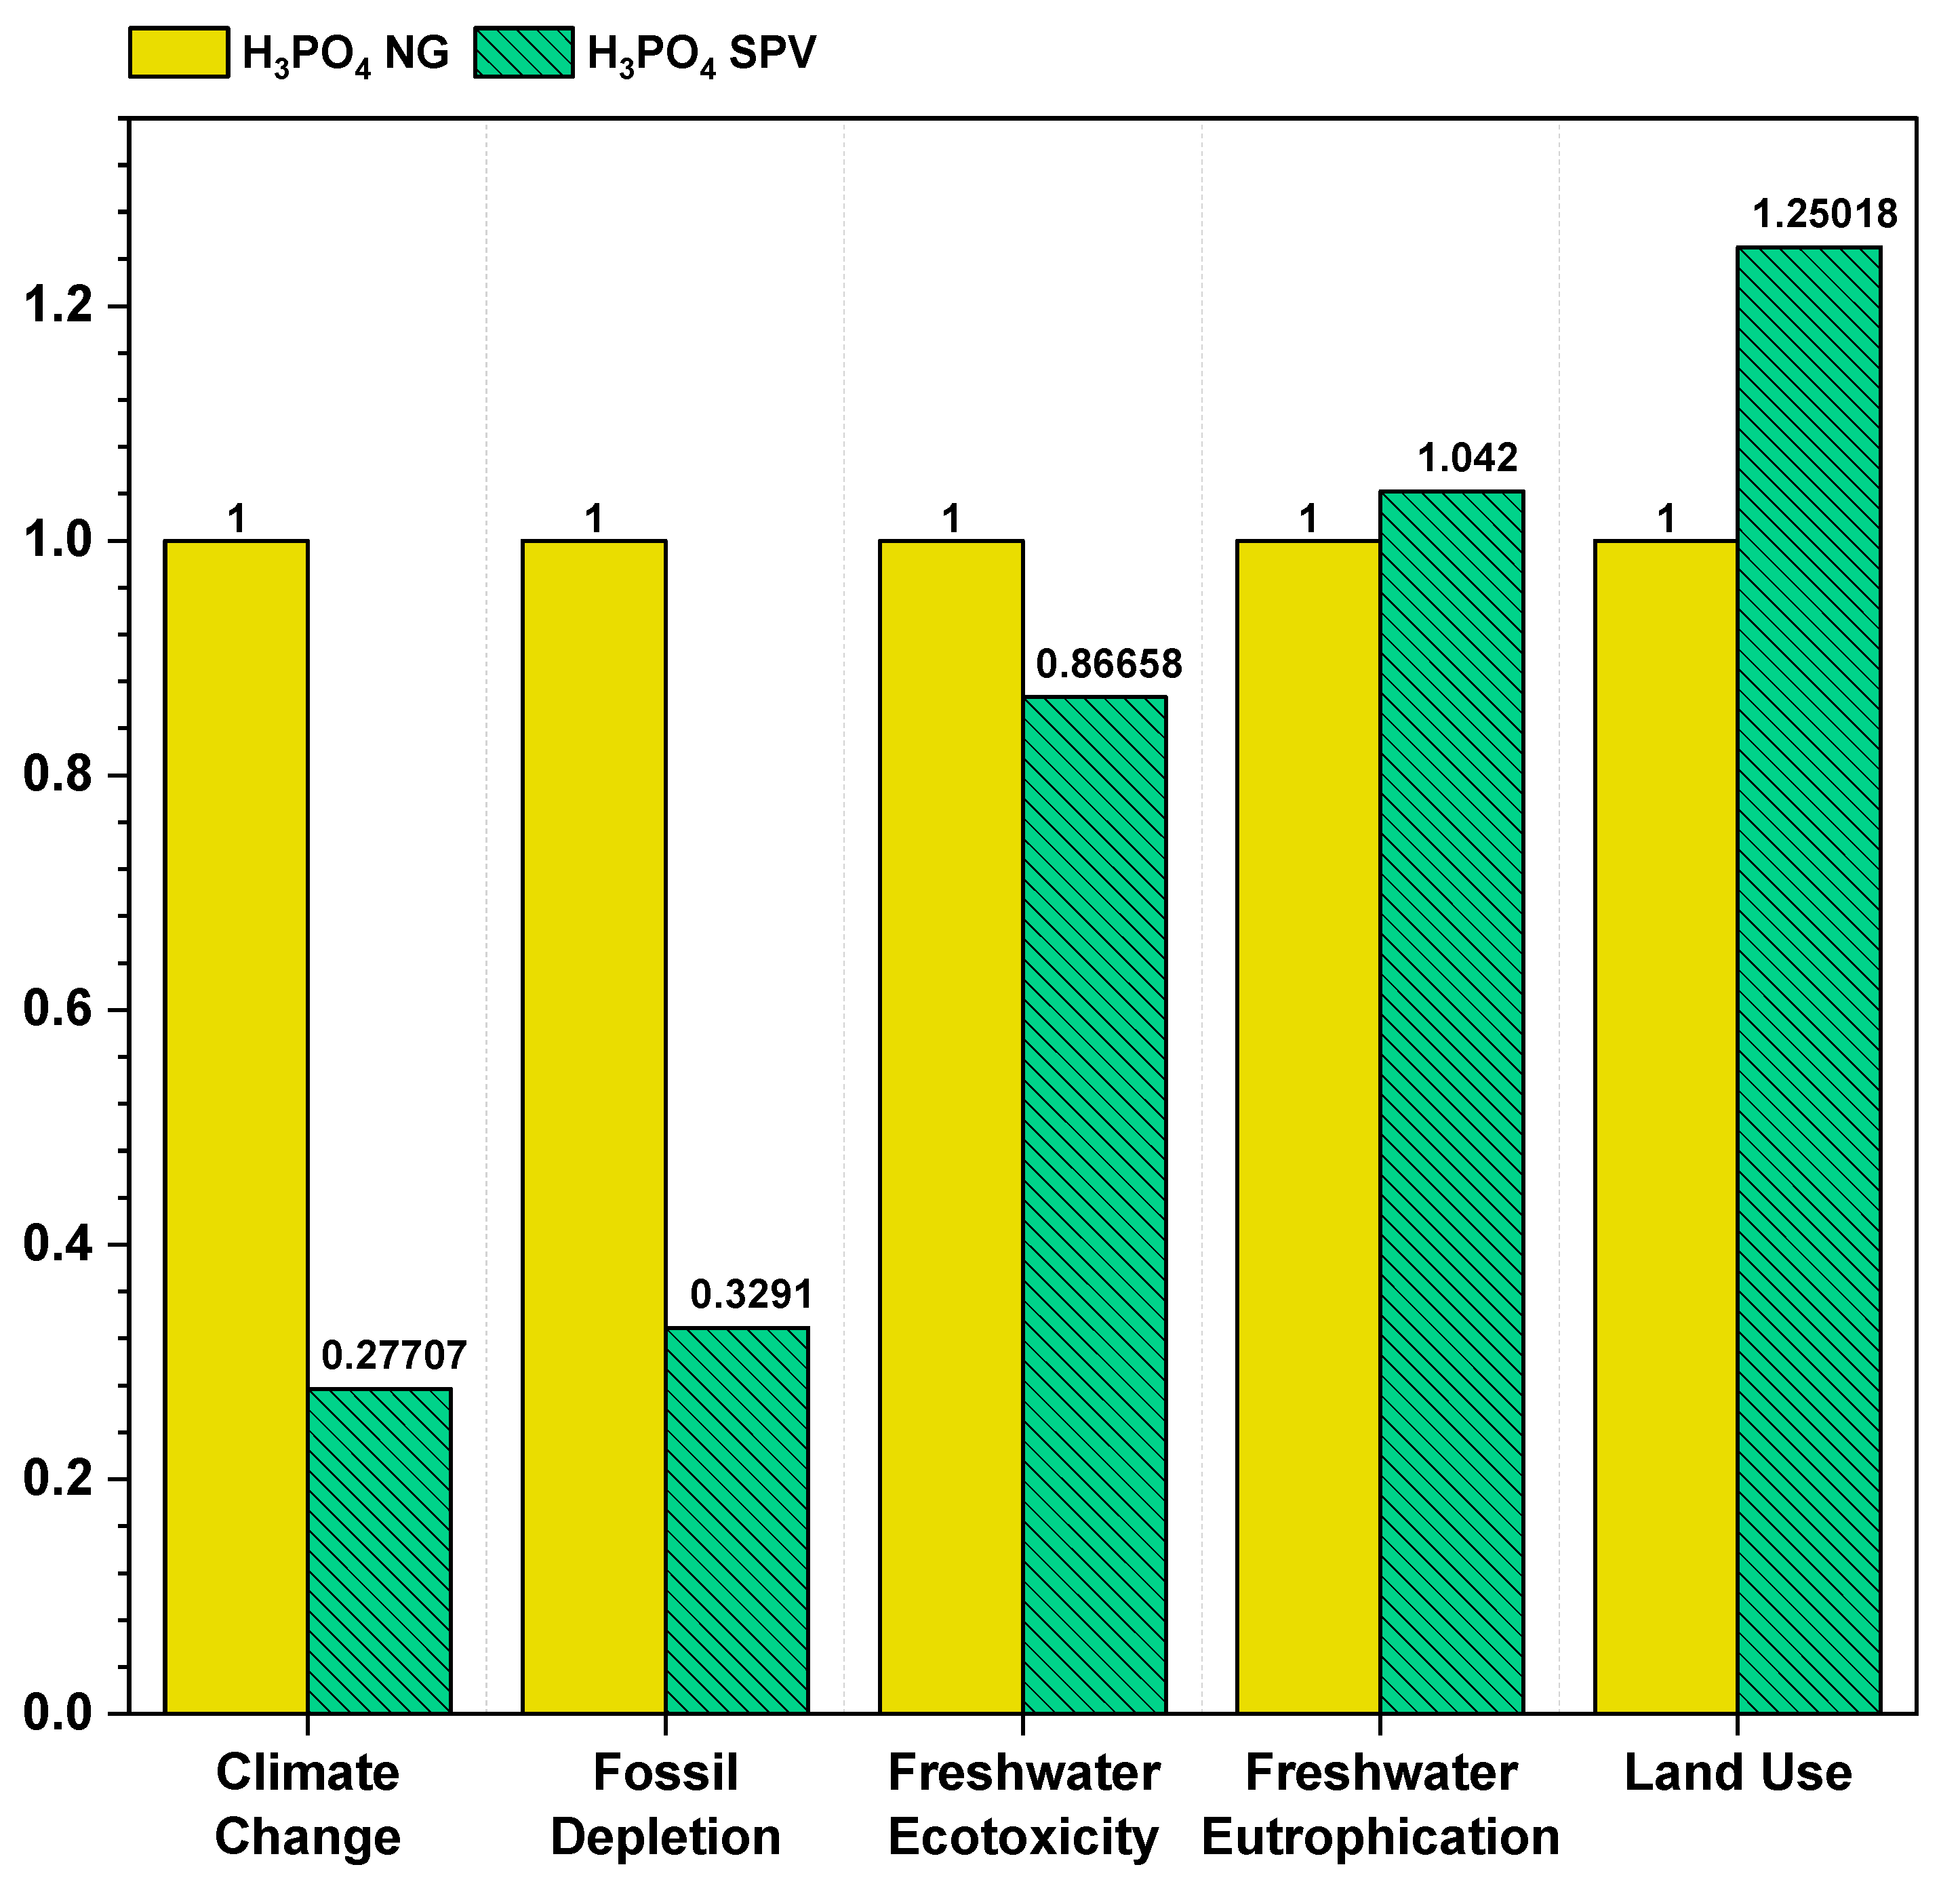
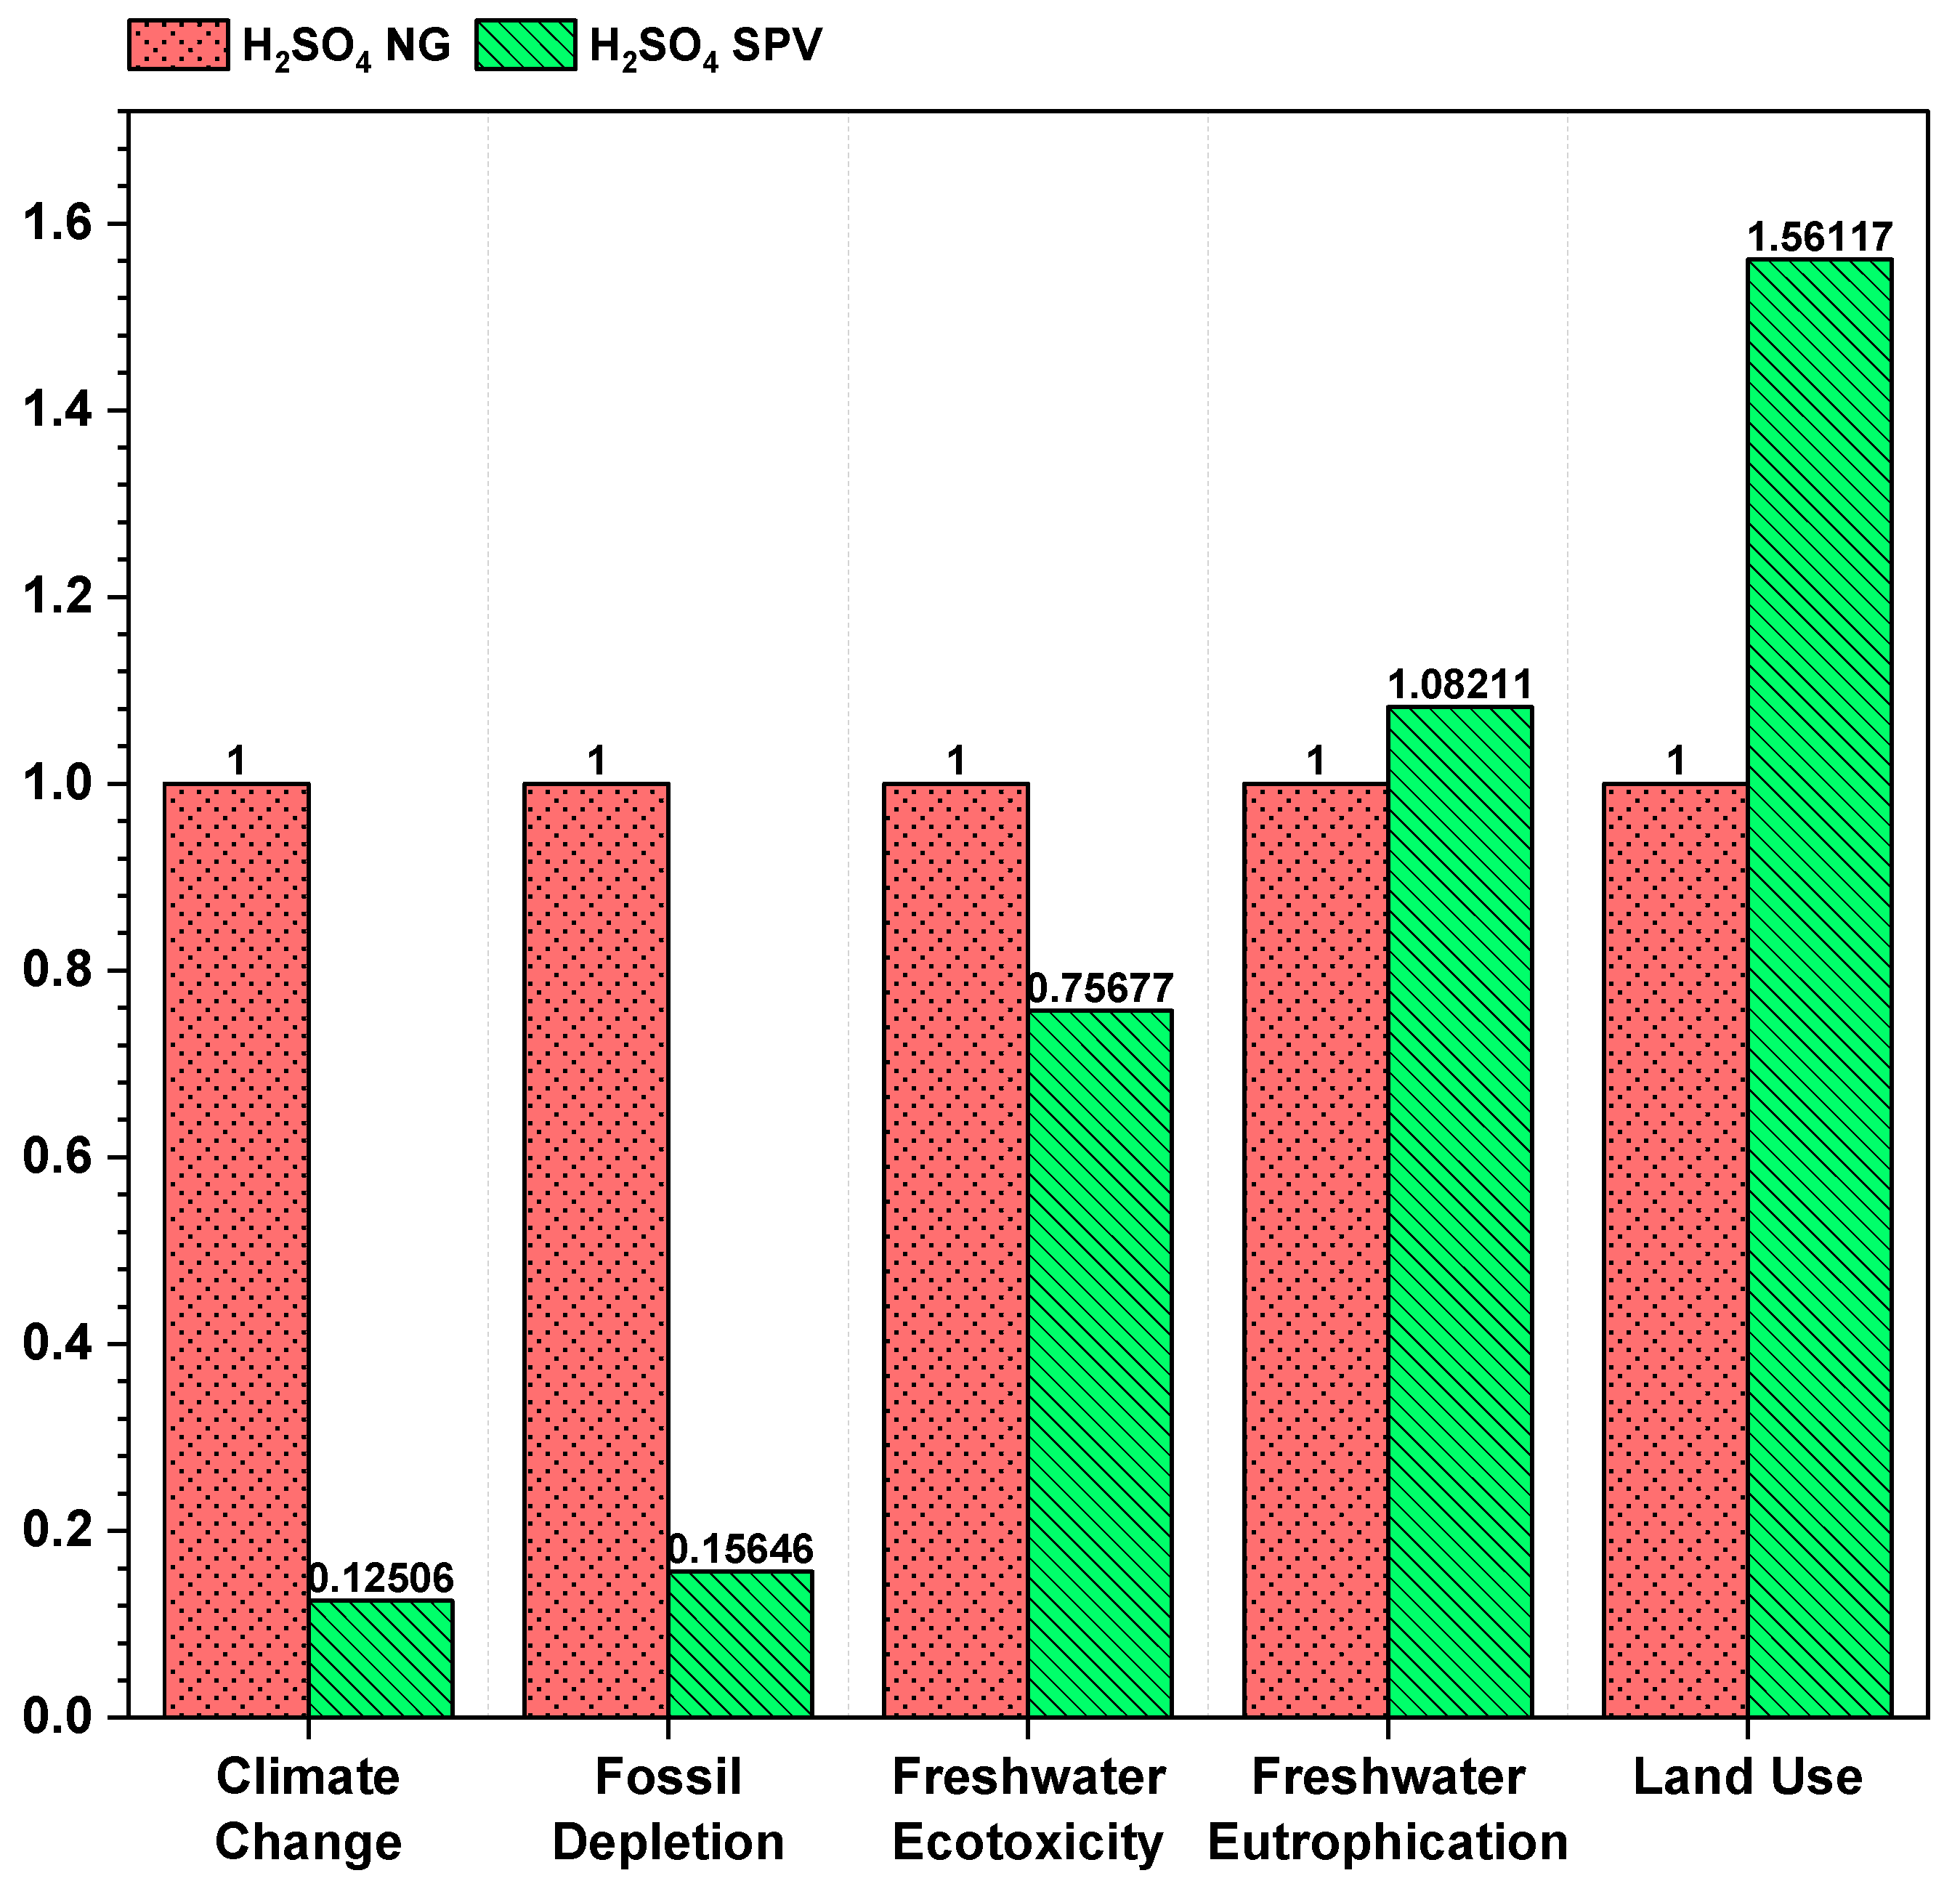
Figure 6 and Figure 7 provide a comprehensive insight into the contribution analysis of the two activation pathways for producing AC from CS. This analysis is crucial for pinpointing the stages that significantly impact the environmental footprint and for identifying potential areas for optimization and improvement. It is evident from the analysis that certain stages, such as transportation, shredding, and drying, have relatively minor EIs. Conversely, processes like acid activation, neutralization, and pyrolysis emerge as the most impactful stages across both pathways.
The drying process comprises two stages. The first stage precedes the acid activation, while the second follows the neutralization of the acidic medium. The acid activation step is a critical phase in the production of AC, involving the treatment of dried CS powder with an acid. When utilizing the H3PO4 route, the primary inputs are a 2 M solution of H3PO4 and deionized-desalinated water, amounting to 205.71 g of H3PO4 and 0.939 L of water. This step is the second most energy-intensive in the H3PO4 activation pathway, accounting for 27% of the net energy required and 22% of the total carbon emissions. In contrast, when employing the H2SO4 route, the inputs are a 1.83M solution of H2SO4 and deionized-desalinated water, totaling 188.379 g of H2SO4 and 0.946 L of water. This step contributes 9% of the net energy required and 5% of the total carbon emissions for AC production. The acid activation step has a substantial impact on freshwater eutrophication, freshwater toxicity, and fuel depletion, with the H3PO4 route showing higher impacts in these categories compared to the H2SO4 route.
The neutralization step involves washing with water, requiring 9.236 L of water for both pathways. The embodied energy for producing this water is consistent across the pathways. However, the relative contribution of this step to the overall EI varies between the two activation routes.
The pyrolysis step is the most energy-consuming and carbon-emitting stage in both activation pathways. It requires 1.94 kWh of energy for AC production, with the H3PO4 route accounting for 65% of the net energy and 70% of the total carbon emissions. For the H2SO4 route, pyrolysis accounts for 81% of the net energy required and 85% of the total carbon emissions. During the pyrolysis of CS, various gases and by-products are emitted, including volatile organic compounds (VOCs), CO2, methane (CH4), carbon monoxide (CO), Particulate Matter (PM), and Non-Condensable Gases. These emissions have direct and indirect effects on the environment and contribute to climate change. CO2 and CH4 are significant greenhouse gases emitted during pyrolysis, with potential implications for global warming.
To mitigate the EI of AC production, it is imperative to focus on reducing emissions from the pyrolysis process and exploring ways to utilize by-products for energy recovery. Optimizing the pyrolysis conditions and managing emissions effectively can enhance the sustainability of AC production from CS.

3.5. Source of Fuel

The discussion on the EI of AC production has so far centered on the use of electricity sourced from natural gas. However, the landscape of energy production is evolving, and renewable energy sources, such as solar photovoltaic (SPV) technology, are becoming increasingly viable alternatives. The adoption of PV technology in the AC production process could potentially alter the environmental footprint of the product. Figure 8 and Figure 9 (normalized values) provide a comparative analysis of the normalized EIs associated with AC production using natural gas (NG) and SPV as energy sources, for both the H3PO4 and H2SO4 production routes.
The data presented in these figures highlight the environmental advantages of utilizing solar PV technology. AC synthesized using SPV demonstrates a significantly lower CC impact compared to its NG-produced counterpart. This reduction is indicative of the lower greenhouse gas emissions and the diminished contribution to global warming when renewable energy is employed in the production process.
To quantify the benefits of using SPV over NG, we can examine the percentage improvement in each EI. Table 4 summarizes these improvements for both the H3PO4 and H2SO4 production routes.
It is clear that the use of solar PV technology leads to substantial improvements in most EIs. The most significant improvements are observed in the climate change and fossil depletion categories, where the percentage improvements range from 72.6% to 87.5% and 67.1% to 84.3%, respectively. These figures highlight the potential of renewable energy sources in mitigating the EIs of AC production.
It is also noteworthy that while there is a slight increase in land use when switching to SPV, the benefits in terms of reduced greenhouse gas emissions and fossil fuel consumption far outweigh this minor drawback. Additionally, the energy output, measured by the net calorific value, shows a significant increase when SPV is used, indicating a more energy-efficient production process.
The adoption of solar PV technology in AC production offers a promising way to reduce EI, with immediate benefits in lowering greenhouse gas emissions and fossil fuel consumption, while also supporting long-term sustainability for large-scale production. By shifting away from traditional, carbon-intensive energy sources, industries can not only lower their operational costs over time but also contribute considerably to the global efforts toward reducing reliance on non-renewable resources. These improvements in EIs emphasize the potential of renewable energy in driving sustainable industrial practices.

3.6. Source of Water
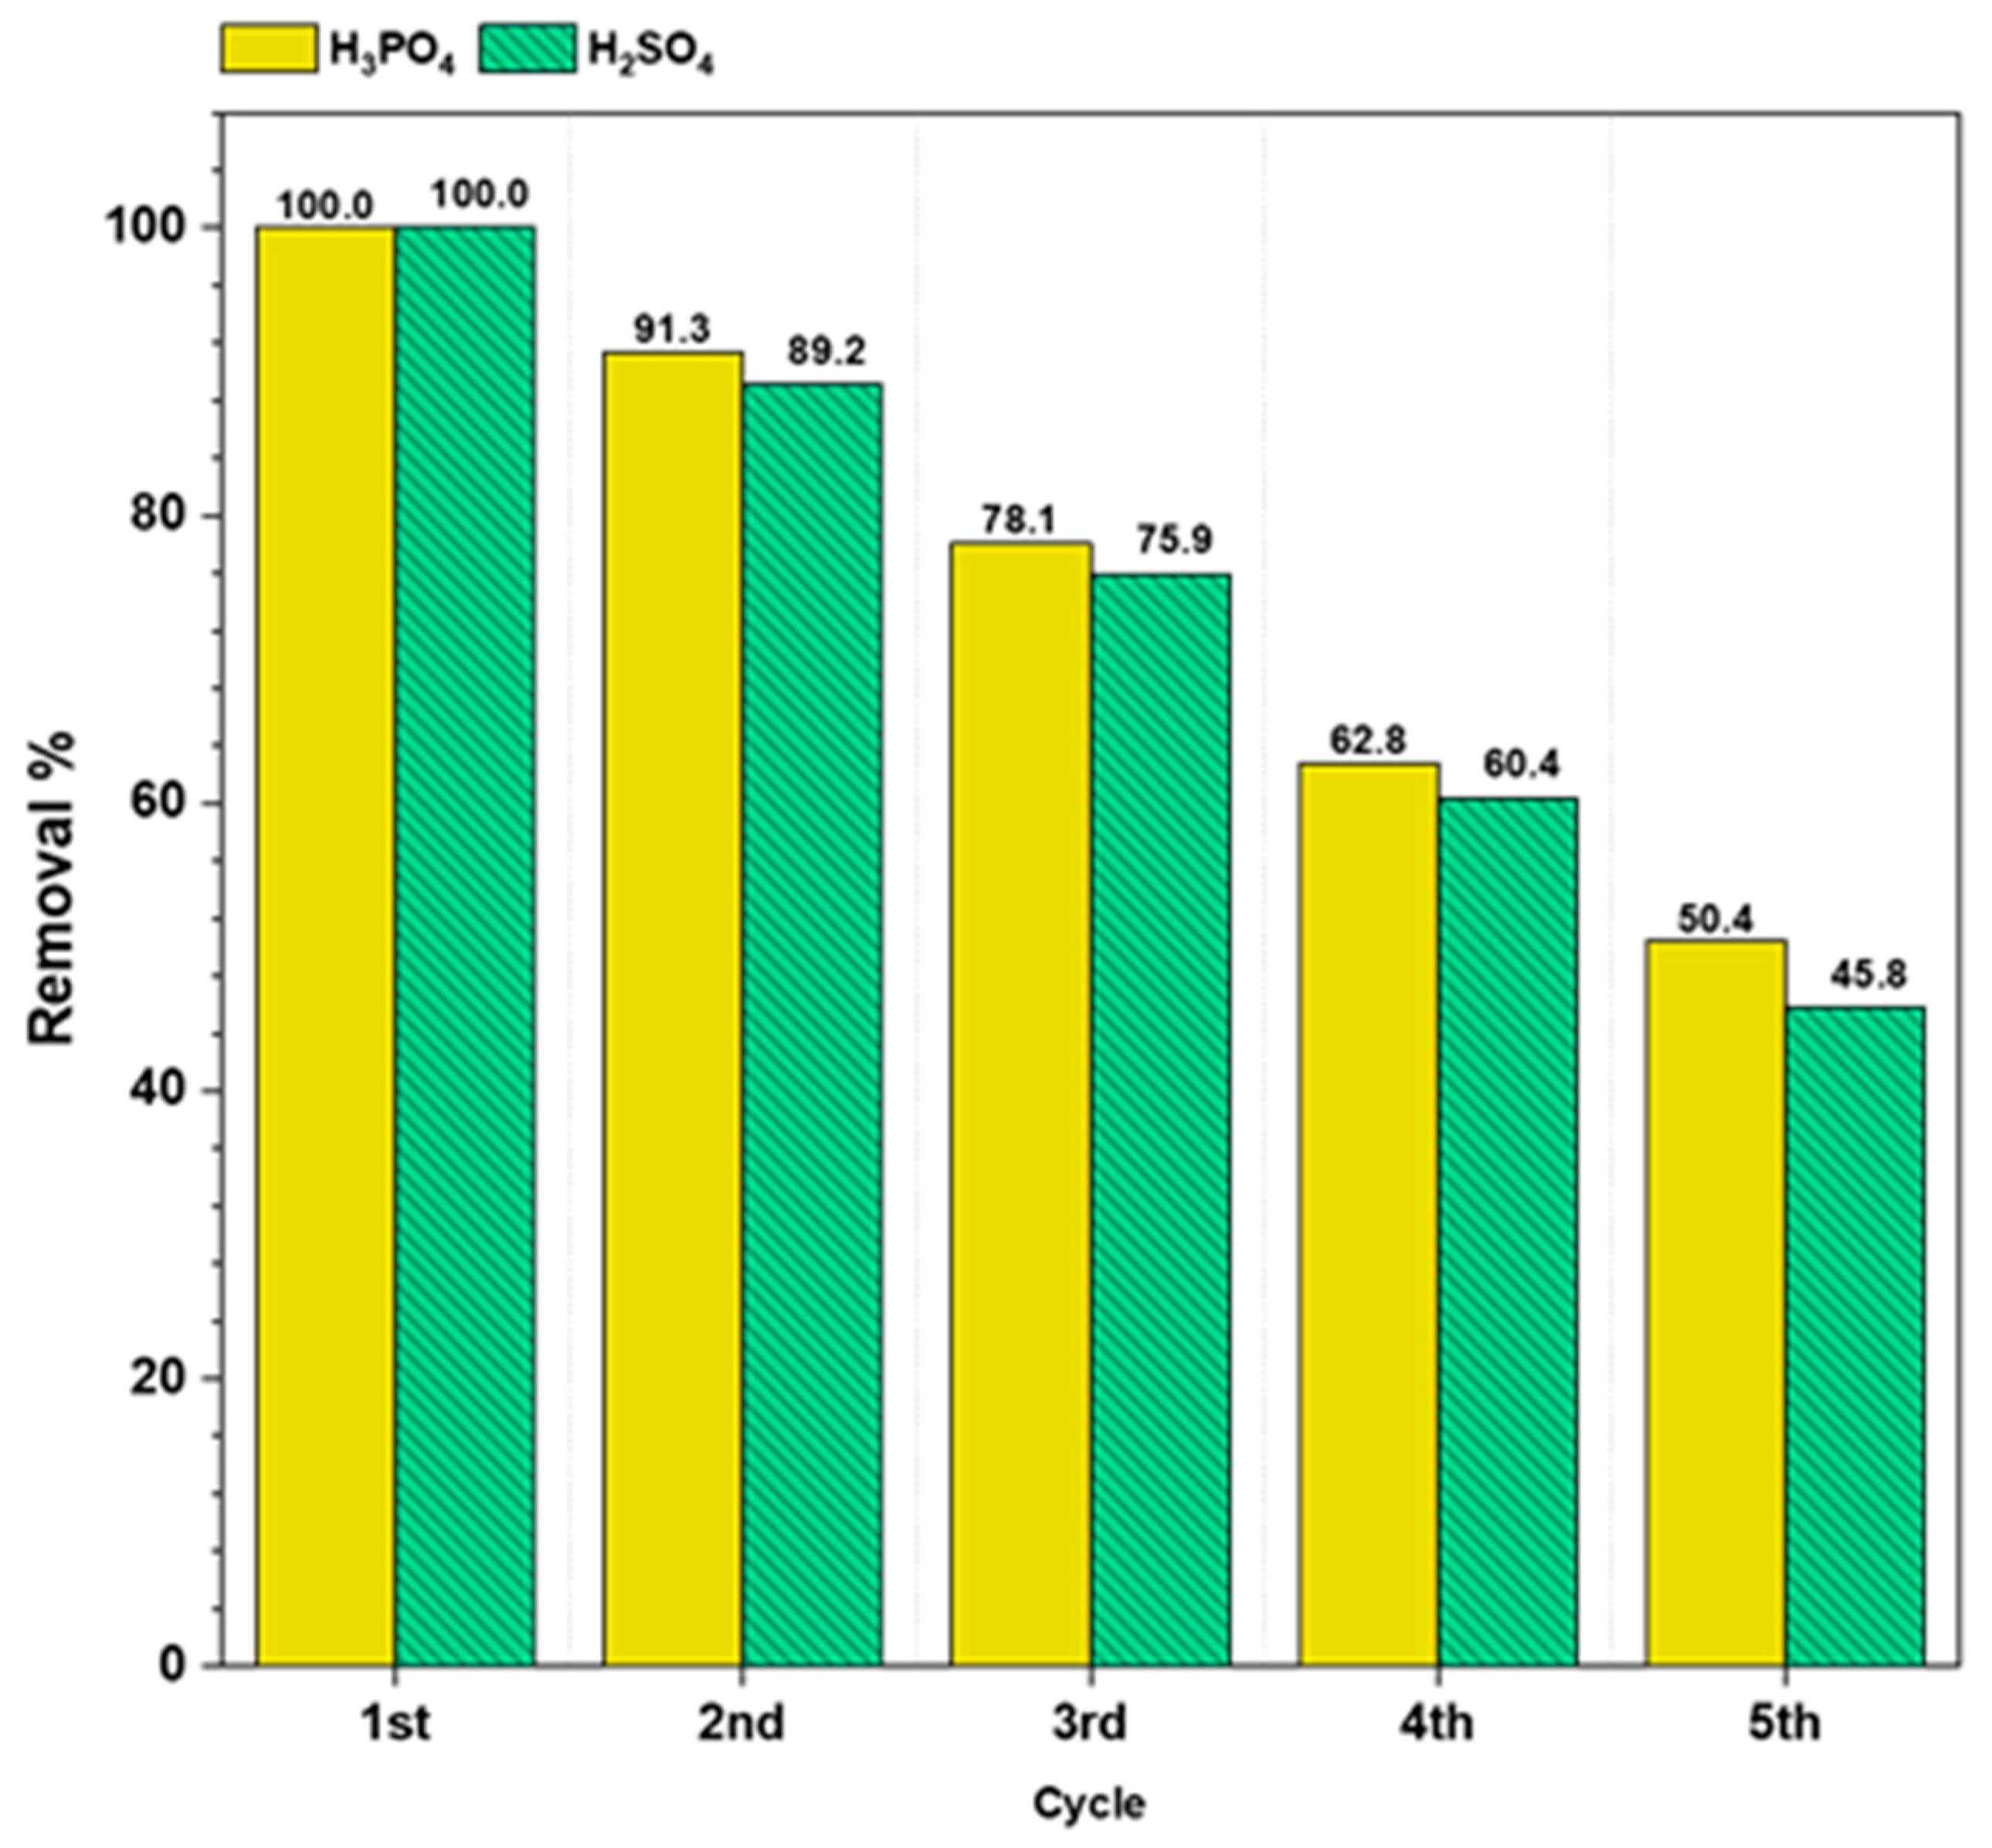
In the quest for sustainable production processes, the choice of water source for industrial applications is a critical consideration. The EI of AC production can be significantly influenced by the source of water used. We explored the implications of using different water sources—desalinated-deionized water, groundwater, and surface water (rivers, ponds, and lakes)—on the EIs of AC production, Figure 10.
Desalinated-deionized water is often considered the base case for industrial processes due to its high purity. This type of water is produced through a combination of desalination, which removes salts and minerals from seawater or brackish water, and deionization, which further purifies the water by removing ions. However, this process is energy-intensive and has a relatively high environmental footprint. The reliance on desalinated-deionized water in industrial processes, particularly in the Arabian Gulf region, presents a complex interplay between the need for high-purity water and the environmental implications of its production. The Arabian Gulf, being a relatively small and shallow sea, experiences high rates of evaporation, resulting in some of the highest salinity levels in the world [37]. Additionally, the continuous discharge of brine exacerbates salinity and poses significant threats to marine life. The Gulf’s restricted water exchange, due to its narrow connection to the open ocean, leads to a slow water turnover cycle of about 8–9 years. This slow replenishment rate not only heightens salinity but also extends the duration pollutants from sewage, power plants, and oil tankers remain in the water, worsening environmental conditions [37,38]. The environmental footprint of desalination in the Arabian Gulf is significant, with high energy consumption contributing to greenhouse gas emissions and brine discharge impacting marine ecosystems. The energy-intensive nature of desalination, particularly in the context of the Gulf’s high salinity levels, places additional strain on the region’s carbon footprint. Moreover, the discharge of brine, enriched with salts and minerals, into already stressed marine environments can lead to habitat degradation and harm marine life [39].
Groundwater, on the other hand, is a more readily available resource in many regions and typically requires less treatment than desalinated-deionized water. It is extracted from aquifers beneath the Earth’s surface. The use of groundwater can reduce the energy demand associated with water purification, potentially leading to lower EIs. However, the over-extraction of groundwater can lead to aquifer depletion and other environmental issues.
Surface water, including water from rivers, ponds, and lakes, is another alternative. It is generally more abundant than groundwater but may contain higher levels of contaminants and require more extensive treatment before it can be used in industrial processes. The EI of using surface water depends on the local context, including the quality of the water source and the treatment methods employed.
Table 5 presents an assessment of EIs using various sources of water in the production of AC. The base case, using desalinated-deionized water (with a H2SO4 activation route), is compared against scenarios where groundwater and surface water are utilized. The data reveal that there are marginal differences in EIs among the different water sources. For instance, the climate change impact is slightly lower when groundwater or surface water is used instead of desalinated-deionized water. Similarly, fossil depletion shows minor reductions in scenarios 1 and 2 compared to the base case.
Interestingly, freshwater ecotoxicity and freshwater eutrophication impacts are notably lower when groundwater or surface water is used, indicating that these sources may have less impact on freshwater ecosystems. Land use also shows a slight decrease in scenarios 1 and 2, suggesting that the use of natural water sources may lead to more efficient land management.
The energy requirements for the different scenarios are also worth noting. The base case requires the highest energy input, likely due to the energy-intensive desalination and deionization processes. Scenarios 1 and 2 show minor reductions in energy use, which could translate into lower operational costs and reduced EI.
The choice of water source for AC production has nuanced effects on the environmental footprint of the process. While desalinated-deionized water offers high purity, it comes with higher energy costs and EIs. Groundwater and surface water present viable alternatives that could reduce certain EIs, particularly related to freshwater ecosystems and energy use. However, the decision on water source should also consider local water availability, quality, and the potential for sustainable management to ensure that the environmental benefits are not offset by other adverse impacts.

3.7. Reusability

The reusability of the spent adsorbents was investigated by sonicating them in acetone, with the results presented in Figure 11. This sonication process dissolved the dyes adsorbed onto the adsorbents into the solution, thereby regenerating free active sites for further dye removal. However, we observed a decrease in the efficiency of the adsorbents with each subsequent dye removal cycle. The adsorbents could be regenerated up to five consecutive times, though their efficiency was reduced to 47% and 45% of the initial removal capacities for H3PO4- and H2SO4-treated AC, respectively. Specifically, the initial adsorption capacities in the first cycle were 242 mg/g for H3PO4 and 212 mg/g for H2SO4, decreasing to 115 mg/g and 97 mg/g by the fifth cycle.

4. Conclusions

The comparative assessment of EIs for AC production from CS using H2SO4 and H3PO4 activation reveals key differences. H2SO4 activation demonstrates lower EI in most categories, including 18% fewer CO2 emissions, 19% less net energy consumption, and significant reductions in freshwater ecotoxicity (45%), eutrophication (49%), fossil depletion (20%), and land use (55%). These advantages are attributed to the simpler, more resource-efficient production process of H2SO4.
While H3PO4 offers higher adsorption capacity (242 g/kg vs. 212 g/kg), the overall environmental performance favors H2SO4. Additionally, the use of solar photovoltaic energy and sustainable water sources further reduces the environmental footprint of AC production. In conclusion, H2SO4 activation emerges as the more sustainable option for CS-derived AC, balancing environmental benefits with practical considerations.

Author Contributions

Conceptualization, J.S. and Z.K.B.M.; methodology, Z.K.B.M.; software, Z.K.B.M.; validation, J.S., F.T. and Z.K.B.M.; formal analysis, J.S. and Z.K.B.M.; investigation, J.S. and Z.K.B.M.; resources, G.M. and T.A.-A.; data curation, J.S.; writing—original draft preparation, J.S.; writing—review and editing, J.S., F.T., Z.K.B.M., G.M. and T.A.-A.; visualization, J.S.; supervision, G.M.; All authors have read and agreed to the published version of the manuscript.

Funding

This publication was made possible by NPRP grant number NPRP12S-0325-190443 from the Qatar National Research Fund (a member of the Qatar Foundation). Open-access funding is provided by the Qatar National Library (QNL).

Data Availability Statement

The original contributions presented in the study are included in the article, further inquiries can be directed to the corresponding authors.

Conflicts of Interest

The authors declare no conflicts of interest.

Nomenclature

ACActivated Carbon
ARAlizarin Red
CCClimate Change
CO2Carbon Dioxide
CSCoconut Shell
EIEnvironmental Impact
ENEnergy Net
FDFossil Depletion
FEFreshwater Ecotoxicity
FUFreshwater Eutrophication
H3PO4Phosphoric Acid
H2SO4Sulfuric Acid
LCALife Cycle Assessment
LCILife Cycle Inventory
LULand Use
NGNatural Gas
SPVSolar Photovoltaic

References

  1. Limousy, L.; Ghouma, I.; Ouederni, A.; Jeguirim, M. Amoxicillin removal from aqueous solution using activated carbon prepared by chemical activation of olive stone. Environ. Sci. Pollut. Res. 2017, 24, 9993–10004. [Google Scholar] [CrossRef] [PubMed]
  2. Garg, S.; Das, P. High-grade activated carbon from pyrolytic biochar of Jatropha and Karanja oil seed cakes—Indian biodiesel industry wastes. Biomass Convers. Biorefinery 2018, 8, 545–561. [Google Scholar] [CrossRef]
  3. Mckay, G. The adsorption of dyestuffs from aqueous solutions using activated carbon. iii. intraparticle diffusion processes. J. Chem. Technol. Biotechnol. Chem. Technol. 2007, 33, 196–204. [Google Scholar] [CrossRef]
  4. Parthasarathy, P.; Sajjad, S.; Saleem, J.; Alherbawi, M.; Mckay, G. A review of the removal of dyestuffs from effluents onto biochar. Separations 2022, 9, 139. [Google Scholar] [CrossRef]
  5. Munonde, T.S.; Madima, N.; Ratshiedana, R.; Nosizo Nomngongo, P.; Mofokeng, L.E.; Dima, R.S. Synergistic adsorption-photocatalytic remediation of methylene blue dye from textile industry wastewater over NiFe LDH supported on tyre-ash derived activated carbon. Appl. Surf. Sci. 2025, 679, 161205. [Google Scholar] [CrossRef]
  6. Saleem, J.; Tahir, F.; Zubair Khalid Baig, M.; McKay, G. Environmental impacts of activated carbon flakes from Palm fiber and polyolefin wastes using life cycle assessment. Mater. Today Proc. 2024. [Google Scholar] [CrossRef]
  7. Hu, Z.; Srinivasan, M.P.; Ni, Y. Preparation of Mesoporous High-Surface-Area Activated Carbon. Adv. Mater. 2000, 12, 62–65. [Google Scholar] [CrossRef]
  8. Saleem, J.; Shahid, U.B.; Hijab, M.; Mackey, H.; McKay, G. Production and applications of activated carbons as adsorbents from olive stones. Biomass Convers. Biorefinery 2019, 9, 775–802. [Google Scholar] [CrossRef]
  9. Dimbo, D.; Abewaa, M.; Adino, E.; Mengistu, A.; Takele, T.; Oro, A.; Rangaraju, M. Methylene blue adsorption from aqueous solution using activated carbon of spathodea campanulata. Results Eng. 2024, 21, 101910. [Google Scholar] [CrossRef]
  10. Lee, K.-C.; Lim, M.S.W.; Hong, Z.-Y.; Chong, S.; Tiong, T.J.; Pan, G.-T.; Huang, C.-M. Coconut shell-derived activated carbon for high-performance solid-state supercapacitors. Energies 2021, 14, 4546. [Google Scholar] [CrossRef]
  11. Dhyani, V.; Bhaskar, T. A comprehensive review on the pyrolysis of lignocellulosic biomass. Renew. Energy 2018, 129, 695–716. [Google Scholar] [CrossRef]
  12. Taer, E.; Taslim, R.; Putri, A.W.; Apriwandi, A.; Agustino, A. Activated Carbon Electrode Made From Coconut Husk Waste For Supercapacitor Application. Int. J. Electrochem. Sci. 2018, 13, 12072–12084. [Google Scholar] [CrossRef]
  13. Li, L.; Liu, S.; Liu, J. Surface modification of coconut shell based activated carbon for the improvement of hydrophobic VOC removal. J. Hazard. Mater. 2011, 192, 683–690. [Google Scholar] [CrossRef]
  14. Song, C.; Wu, S.; Cheng, M.; Tao, P.; Shao, M.; Gao, G. Adsorption Studies of Coconut Shell Carbons Prepared by KOH Activation for Removal of Lead(II) From Aqueous Solutions. Sustainability 2013, 6, 86–98. [Google Scholar] [CrossRef]
  15. Saleh, A.; Amhadin, F.A.; Novianty, I. Synthesis of Reduced Graphene Oxide and Zinc Oxide Composite From Candlenut Shell Charcoal (Aleuritas moluccana). Elkawnie 2022, 8, 1–11. [Google Scholar] [CrossRef]
  16. Tsai, W.-T.; Jiang, T.-J. Mesoporous activated carbon produced from coconut shell using a single-step physical activation process. Biomass Convers. Biorefinery 2018, 8, 711–718. [Google Scholar] [CrossRef]
  17. Islam, M.A.; Ahmed, M.J.; Khanday, W.A.; Asif, M.; Hameed, B.H. Mesoporous activated coconut shell-derived hydrochar prepared via hydrothermal carbonization-NaOH activation for methylene blue adsorption. J. Environ. Manag. 2017, 203, 237–244. [Google Scholar] [CrossRef]
  18. Saleem, J.; Tahir, F.; Baig, M.Z.K.; Al-Ansari, T.; McKay, G. Assessing the environmental footprint of recycled plastic pellets: A life-cycle assessment perspective. Environ. Technol. Innov. 2023, 32, 103289. [Google Scholar] [CrossRef]
  19. Chan, A.A.; Buthiyappan, A.; Raman, A.A.A.; Ibrahim, S. Recent advances on the coconut shell derived carbonaceous material for the removal of recalcitrant pollutants: A review. Korean J. Chem. Eng. 2022, 39, 2571–2593. [Google Scholar] [CrossRef]
  20. Muralikrishnan, R.; Jodhi, C. Biodecolorization of Reactive Dyes Using Biochar Derived from Coconut Shell: Batch, Isotherm, Kinetic and Desorption Studies. ChemistrySelect 2020, 5, 7734–7742. [Google Scholar] [CrossRef]
  21. Pundlik, R.C.; Chowdhury, S.D.; Dash, R.R.; Bhunia, P. Life-Cycle Assessment of Agricultural Waste-Based and Biomass-Based Adsorbents. In Biomass, Biofuels, Biochemicals; Elsevier: Amsterdam, The Netherlands, 2021; pp. 669–695. [Google Scholar]
  22. Vilén, A.; Laurell, P.; Vahala, R. Comparative life cycle assessment of activated carbon production from various raw materials. J. Environ. Manag. 2022, 324, 116356. [Google Scholar] [CrossRef] [PubMed]
  23. Sreejith, C.C.; Muraleedharan, C.; Arun, P. Life cycle assessment of producer gas derived from coconut shell and its comparison with coal gas: An Indian perspective. Int. J. Energy Environ. Eng. 2013, 4, 8. [Google Scholar] [CrossRef]
  24. Arena, N.; Lee, J.; Clift, R. Life Cycle Assessment of activated carbon production from coconut shells. J. Clean. Prod. 2016, 125, 68–77. [Google Scholar] [CrossRef]
  25. Glogic, E.; Kamali, A.K.; Keppetipola, N.M.; Alonge, B.; Kumara, G.R.A.; Sonnemann, G.; Toupance, T.; Cojocaru, L. Life Cycle Assessment of Supercapacitor Electrodes Based on Activated Carbon from Coconut Shells. ACS Sustain. Chem. Eng. 2022, 10, 15025–15034. [Google Scholar] [CrossRef]
  26. Noijuntira, I.; Kittisupakorn, P. Life Cycle Assessment for the Activated Carbon Production by Coconut Shells and Palm-Oil Shells. 2010. Available online: https://repository.rmutp.ac.th/handle/123456789/708 (accessed on 1 June 2024).
  27. Kabir Ahmad, R.; Anwar Sulaiman, S.; Yusup, S.; Sham Dol, S.; Inayat, M.; Aminu Umar, H. Exploring the potential of coconut shell biomass for charcoal production. Ain Shams Eng. J. 2022, 13, 101499. [Google Scholar] [CrossRef]
  28. Saleem, J.; Moghal, Z.K.B.; Pradhan, S.; McKay, G. High-performance activated carbon from coconut shells for dye removal: Study of isotherm and thermodynamics. RSC Adv. 2024, 14, 33797–33808. [Google Scholar] [CrossRef]
  29. ISO 14044; Environmental Management—Life Cycle Assessment: Principles and Framework. ISO: Geneva, Switzerland, 1997.
  30. ISO 14040; Environmental Management—Life Cycle Assessment: Requirements and Guidelines. ISO: Geneva, Switzerland, 2006.
  31. Saleem, J.; Shahid, U.B.; McKay, G. Environmental Nanotechnology. In Handbook of Environmental Materials Management; Springer International Publishing: Cham, Switzerland, 2018; pp. 1–32. [Google Scholar]
  32. Thinkstep GaBi [Computer Software], Thinkstep, Sphera Solutions; Sphera: Leinfelden-Echterdingen, Germany, 2020.
  33. Guendouzi, M.E.; Rifai, A.; Skafi, M. Properties of fluoride in wet phosphoric acid processes: Fluorosilicic acid in an aqueous solution of H2SiF6–H20 at temperatures ranging from 298.15K to 353.15K. Fluid Phase Equilib. 2015, 396, 43–49. [Google Scholar] [CrossRef]
  34. Altintaş, N.; Ayok, T.; Gözmen, T. Fluorine pollution in the marmara region, Turkey. Production methods for fluorine removal and recovery. Water Res. 1987, 21, 781–788. [Google Scholar] [CrossRef]
  35. Ghaedi, M.; Najibi, A.; Hossainian, H.; Shokrollahi, A.; Soylak, M. Kinetic and equilibrium study of Alizarin Red S removal by activated carbon. Toxicol. Environ. Chem. 2012, 94, 40–48. [Google Scholar] [CrossRef]
  36. Fayazi, M.; Ghanei-Motlagh, M.; Taher, M.A. The adsorption of basic dye (Alizarin red S) from aqueous solution onto activated carbon/γ-Fe2O3 nano-composite: Kinetic and equilibrium studies. Mater. Sci. Semicond. Process. 2015, 40, 35–43. [Google Scholar] [CrossRef]
  37. Tahir, F.; Baloch, A.A.B.; Ali, H. Resilience of Desalination Plants for Sustainable Water Supply in Middle East. In Sustainability Perspectives: Science, Policy and Practice: A Global View of Theories, Policies and Practice in Sustainable Development; Springer: Cham, Switzerland, 2020; pp. 303–329. [Google Scholar]
  38. Darwish, M. Qatar water problem and solar desalination. Desalin. Water Treat. 2014, 52, 1250–1262. [Google Scholar] [CrossRef]
  39. Dawoud, M.A. Environmental Impacts of Seawater Desalination: Arabian Gulf Case Study. Int. J. Environ. Sustain. 2012, 1, 22–37. [Google Scholar] [CrossRef]
Figure 1. Process flow for acid activation of CS into AC.
Carbon 11 00022 g001
Figure 2. EI assessment using normalized values of activation routes for the production of AC.
Carbon 11 00022 g002
Figure 3. EI assessment of activation routes for the production of AC and comparison with commercial AC.
Carbon 11 00022 g003
Figure 4. The mechanism of monolayer adsorption of alizarin red dye (D) on the AC surface.
Carbon 11 00022 g004
Figure 5. Adsorption isotherm for acid-activation pathways at room temperature: (a) experimental adsorption Qe vs. Ce plot, (b) Langmuir isotherm obtained using H3PO4 pathway and (c) Langmuir isotherm using H2SO4 pathway, and (d) Freundlich isotherm obtained using H3PO4 pathway and (e) Freundlich isotherm using H2SO4 pathway.
Carbon 11 00022 g005
Figure 6. EIs of steps involved for the production of AC using H2SO4.
Carbon 11 00022 g006
Figure 7. EIs of steps involved for the production of AC using H3PO4.
Carbon 11 00022 g007
Figure 8. A comparison of different fuel sources for AC production using the H3PO4 pathway.
Carbon 11 00022 g008
Figure 9. A comparison of different fuel sources for AC production using the H2SO4 pathway.
Carbon 11 00022 g009
Figure 10. A comparison of different sources of water for the production of AC.
Carbon 11 00022 g010
Figure 11. Reusability of the spent adsorbents.
Carbon 11 00022 g011
Table 1. Resource utilization for various steps in the production of 1 kg of AC.
ProcessH2SO4H3PO4Remarks
Transportation2 km2 kmTransportation of waste—diesel truck
Shredding42.408 kJ42.408 kJ-
Drying339.12 kJ339.12 kJDrying under oven
Activation188.379 g H2SO4
0.946 L water
205.71 g H3PO4
0.939 L water
-
Neutralization9.236 L water9.236 L water-
Drying332.28 kJ332.28 kJDrying under oven
Pyrolysis6984 kJ6984 kJ
Table 2. EI comparison of acid-activation routes of as-synthesized AC with commercial AC.
Impact CategoryUnitScenarios
H3PO4H2SO4Commercial AC
Climate changekg CO2 eq.1.431031.1823984.831549
Fossil depletionkg oil eq.0.5954540.4735872.318179
Freshwater ecotoxicitykg 1,4 DB eq.0.0001347.35 × 10−50.000191
Freshwater eutrophicationkg P eq.1.75 × 10−68.95 × 10−75.97 × 10−6
Land usem2y eq.0.0059760.0026640.117129
Energy netMJ33.6599927.22802125.3223
Table 3. The % improvement in lowering EIs using as-synthesized AC.
Impact CategoryH2SO4Commercial AC% Improvement
Climate change1.1823984.83154975.5
Fossil depletion0.4735872.31817979.5
Freshwater ecotoxicity7.35 × 10−50.00019161.6
Freshwater eutrophication8.95 × 10−75.97 × 10−685.1
Land use0.0026640.11712997.7
Energy net27.22802125.322378.3
Table 4. EIs associated with different types of fuel.
EINatural Gas (NG)Solar Photovoltaic (SPV)
H3PO4H2SO4H3PO4H2SO4
Climate Change1.431031.1823980.3964990.147868
Fossil Depletion0.5954540.4735870.1959630.074097
Freshwater Ecotoxicity0.0001347.35 × 10−50.0001165.56 × 10−5
Freshwater Eutrophication1.75 × 10−68.95 × 10−71.82 × 10−69.68 × 10⁻⁷
Land Use0.0059760.0026640.0074720.00416
Table 5. EIs assessment using rounded-off values for different sources of water.
Impact CategoryDeionized-Desalinated WaterScenario 1
Groundwater
Scenario 2
Surface Water
Climate Change1.1821.1701.171
Fossil Depletion0.4740.4690.470
Freshwater Ecotoxicity7.35 × 10−56.47 × 10−56.48 × 10−5
Freshwater Eutrophication8.95 × 10−73.74 × 10−73.76 × 10−7
Land Use0.002660.001760.00179
Energy Net27.22826.80526.825
Disclaimer/Publisher’s Note: The statements, opinions and data contained in all publications are solely those of the individual author(s) and contributor(s) and not of MDPI and/or the editor(s). MDPI and/or the editor(s) disclaim responsibility for any injury to people or property resulting from any ideas, methods, instructions or products referred to in the content.

