Article

Modulation of Giant Magnetoimpedance Effect in Co-Based Amorphous Wires by Carbon-Based Nanocoatings

1
Guangxi Key Laboratory of Brain-Inspired Computing and Intelligent Chips, School of Electronic and Information Engineering, Guangxi Normal University, Gulin 541004, China
2
Key Laboratory of Integrated Circuits and Microsystems, Education Department of Guangxi Zhuang Autonomous Region, Guangxi Normal University, Guilin 541004, China
3
National Key Laboratory of Advanced Micro and Nano Manufacture Technology, Department of Micro-Nano Electronics, School of Electronic Information and Electrical Engineering, Shanghai Jiao Tong University, Shanghai 200240, China
*
Authors to whom correspondence should be addressed.
Submission received: 17 January 2025 / Revised: 5 March 2025 / Accepted: 27 March 2025 / Published: 1 April 2025
(This article belongs to the Section Carbon Materials and Carbon Allotropes)

Abstract

:
Co-based amorphous wires (Co-AWs) are functional materials renowned for their high impedance change rate in magnetic fields and a pronounced giant magnetoimpedance (GMI) effect. In this study, magnetron sputtering (MS) and dip-coating (DC) techniques were employed to fabricate carbon-based nanocoatings aimed at modulating the GMI properties of Co-AWs. The magnetic properties and GMI responses of the composite Co-AWs with carbon-based coatings were comparatively analyzed. The results demonstrate that both methods effectively enhanced the GMI properties of the coated Co-AWs. The DC method emerged as a rapid and efficient approach for forming the coated film, achieving a modest enhancement in GMI performance (10% enhancement). In contrast, the MS technique proved more effective in improving the GMI effect, yielding superior results. Co-AWs coated via Ms exhibited smoother surfaces and reduced coercivity. Notably, the GMI effect increased with the thickness of the sputtered carbon coatings, reaching a maximum GMI effect of 522% (a remarkable 357% enhancement) and a sensitivity of 33.8%/Oe at a coating thickness of 334 nm. The observed trend in the GMI effect with carbon layer thickness corresponded closely to variations in transverse permeability, as determined by vibrating sample magnetometry (VSM). Furthermore, the carbon coating induced changes in the initial quenching stress on the surface of the Co-AWs, leading to alterations in impedance and a significant reduction in the characteristic frequency of the Co-AWs. Our findings provide valuable insights into the modulation of GMI properties in Co-AWs, paving the way for their optimized application in advanced magnetic sensor technologies.

Graphical Abstract

1. Introduction

The GMI effect refers to the phenomenon that the impedance of magnetic materials changes significantly with the change in external magnetic field under the excitation of alternating current [1]. As an important physical effect, the GMI effect has a wide range of applications in the fields of high-performance magnetic sensors, magnetic field detection, and so on. The continuous advancement of science, technology, and industry has led to a growing demand for cost-effective functional materials with controllable properties. Magnetic materials are one of the important functional materials [2]. Low cost magnetic materials with improved magnetic properties are needed in many fields such as magnetic sensors, medicine, aerospace, etc. Among magnetic materials, soft magnetic materials have attracted the attention of researchers because of their ability to respond quickly to changes in the external magnetic field and their advantages of high permeability, low coercivity, etc. Soft magnetic materials such as thin films, amorphous ribbons, and amorphous wires play an important role in the preparation of GMI sensors [3]. Amorphous wires with unique magnetic domain structures have many excellent properties, and, initially, researchers focused on the spontaneous magnetic bistability of amorphous wires with rectangular hysteresis loop features [4]. Another property of amorphous wires, the GMI effect, was later discovered and has since renewed the interest of researchers in amorphous wires [5,6,7,8].
Significant advances have been made in GMI sensor technology, including the development of new amorphous materials, optimization of sensor structures and processes, and integration with microelectronics. Current sensors, magnetoelastic sensors, stress sensors, curvature sensors, etc., have been fabricated based on amorphous wires [9,10,11,12]. These sensors are extensively utilized in various fields, such as the automotive and aviation industries, magnetic data storage, electronic compasses, drone control and indoor navigation, among others. Especially in the detection of weaker biomagnetic fields, amorphous wire sensors are widely used for cancer biomarker detection due to their high sensitivity. For example, Zhu et al. achieved an ultrasensitive detection of AFP antigen using CoFeSiB amorphous wire combined with a microfluidic chip with a lower limit of detection of 100 fg/mL [13]. This ultrasensitive GMI biosensor provides an effective method for cancer biomarker detection. Meanwhile, Qin et al. fabricated a magnetically induced pressure sensor using glass-coated amorphous wires to enable the monitoring of hand rehabilitation in hemiplegic stroke patients [14]. GMI sensors also play an important role in non-destructive testing, such as monitoring and diagnosing pipeline conveyor belts [15]. Flexible magnetic sensors are also expected to play a greater role in emerging areas such as the Internet of Things and wearable electronics [16].
In recent years, researchers have investigated the GMI effect of amorphous wires from various perspectives. In order to facilitate the normal operation of amorphous wire sensors in low magnetic fields or some harsh environments, it is crucial to improve their sensitivity and GMI effect. The influence of annealing on the GMI effect in amorphous wires has been a topic to explore [17,18,19,20]. The results show that adjusting the distance between two amorphous wires and changing the structure of amorphous wires can effectively enhance the GMI effect [21,22,23]. During the melt extraction of the microwires, the magnetic domain structure, surface roughness, and GMI effect of the microwires are modified by the substitution of B by Zr [24]. A more comprehensive report on post-processing tools for optimizing the GMI effect was presented by Zhukov et al., which suggests a reasonable solution for sensor preparation [25].
Studies show that the GMI effect in amorphous ribbon can be improved by thin film coating. The surface roughness of ribbons can be reduced, interlayer stress can be weakened, and stray fields can be decreased with the appropriate thickness of coating [26,27,28]. Similar results have been found for microwires [29,30,31,32]. The magnetic properties and GMI effects of microwires can be affected by the coating of magnetic, conductive, or insulating layers on the sample [33,34,35,36,37]. Due to high strength flexibility, thermal conductivity and electrical conductivity, and optical properties, graphene has a very wide range of applications and has attracted researchers attention [38,39,40,41,42]. Exposure to toluene results in the formation of graphene-like carbon layers in amorphous wires, a surface modification that significantly alters their effective magnetic anisotropy [43]. Electrodeposition methodology is utilized to coat carbon nanotubes and graphene oxide on the surface of amorphous microwires, resulting in a 230% and 130% enhancement in the GMI effect, respectively [44]. There are different deposition techniques for the preparation of carbon films, such as laser deposition, magnetron sputtering, chemical vapor deposition, and electrodeposition. Among them, sputtering has the advantages of low fabrication temperature and uniformity of properties, and the preparation of carbon films by this method needs to be investigated.
In this study, DC and MS were employed to deposit carbon layers on the surfaces of amorphous wires, and the magnetic properties of the resulting composite amorphous wires were compared. Composite wires with carbon coatings of varying thicknesses were fabricated using the MS, and the impact of the coatings on the composite wires was analyzed to elucidate the underlying mechanisms. This study provides a valuable reference for future methods of adding coating layers to soft magnetic materials.

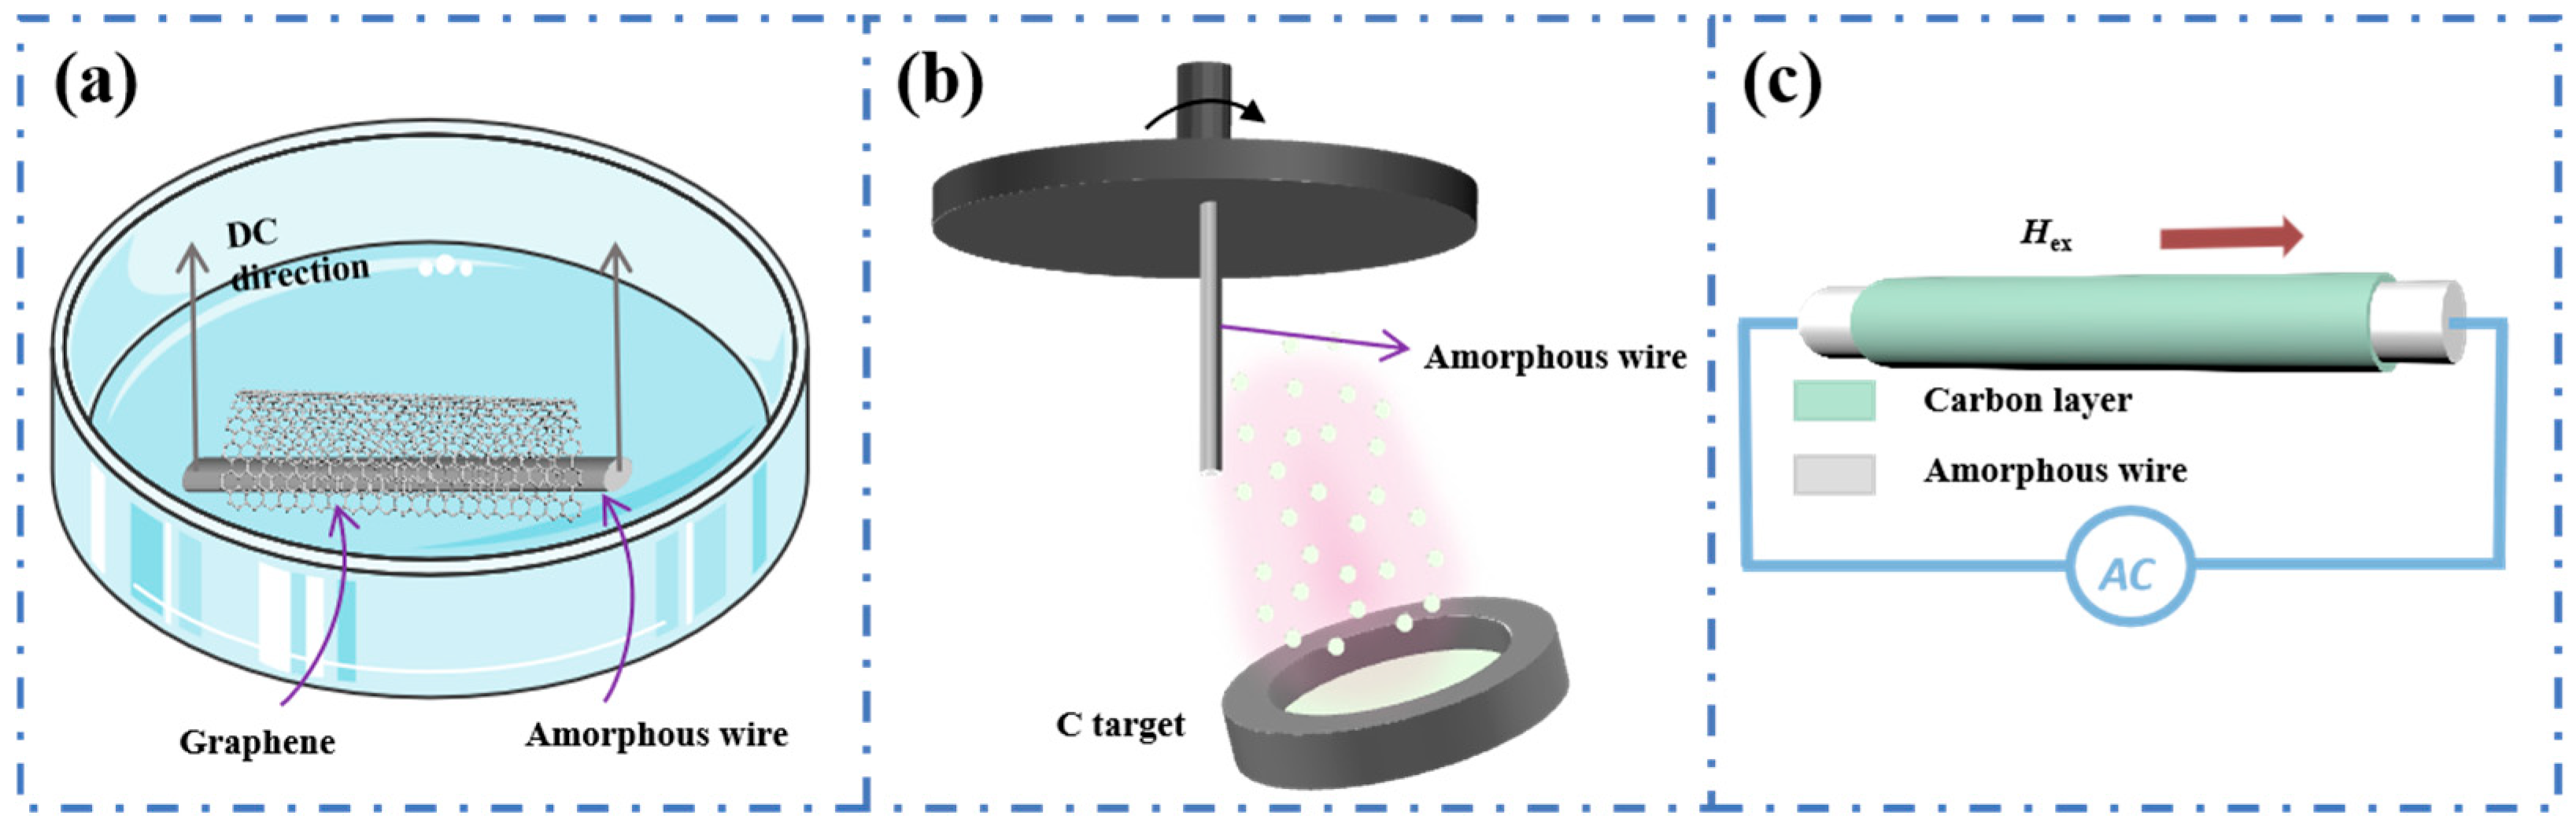
2. Materials and Methods

The cobalt-based amorphous water spinning used in this study was purchased from Dongfang Microelectronics Technology Co., Ltd (Wuhan, China). The length was 5 cm, the effective length was 1 cm, the diameter was 125 μm, and the saturation magnetization intensity was 46 emu/g. Copper-based graphene composite films were purchased from XFNANO Materials Tech Co., Ltd (Jiangsu, China). A high-purity carbon target was purchased from Jinyuan Advanced Materials Technology Co., Ltd (Beijing, China). A schematic illustration of the fabrication and measurement of composite Co-AWs using the DC and MS methods is shown in Figure 1. Co-AWs, measuring 5 cm in length, were sequentially immersed in glass containers filled with acetone, alcohol, and deionized water, followed by ultrasonication for 2 min each. Subsequently, the wires were dried with nitrogen gas in preparation for the subsequent samples. The DC samples was prepared as follows: Firstly, poly(methyl methacrylate) (PMMA) was uniformly spin-coated on the surface of copper foil with a single layer of graphene as a support layer for graphene after etching. And then the copper growth substrate was etched in an ammonium persulfate solution, transferring monolayer graphene into a deionized water solution. Finally, the Co-AWs were immersed in the prepared graphene solution and pulled horizontally from the solution in a vertical direction, as shown in Figure 1a. Carbon nanocoatings of 67 nm, 203 nm, 334 nm, 467 nm, and 601 nm thicknesses were coated on the surfaces of Co-AWs using the MS method. The base vacuum was maintained at 1.2 × 10⁻⁴ Pa, the argon pressure was set at 1.8 Pa with a flow rate of 42 sccm, the substrate temperature was maintained at 80 °C, the sputtering power was 150 W, the rotational speed was 10 r/min, and the sputtering rate was approximately 6.42 nm/min. The morphology of the coatings was examined using scanning electron microscopy (SEM) with a Quanta 200FEG field emission scanning electron microscope. The structure and composition of the composite wires were analyzed using energy-dispersive X-ray spectroscopy (EDS) and X-ray diffraction (XRD). The scanning range of XRD was 30–80° and the scanning speed was 2°/min. Hysteresis loops were measured using a vibrating sample magnetometer (VSM, Quantum Design SQUID-VSM (MPMS-3)) at room temperature.
Impedance was tested using a 4194A impedance analyzer and a 16047D fixture with the AC frequency set at 100 Hz to 100 MHz. The external magnetic field was provided by a Helmholtz coil, and the magnitude of the magnetic field, ranging from −140 Oe to 140 Oe, was controlled by adjusting the current of the direct current power supply and the gap between the ends of the Helmholtz coils. The measurement principle is schematically shown in Figure 1c. The GMI ratio is defined as
GMI ( % ) = Z ( H ) - Z ( H max ) Z ( H max ) × 100 %
where Z(H) is the impedance value under a specific magnetic field, and Z(Hmax) is the impedance value under the applied maximum magnetic field, when the amorphous wire has reached magnetic saturation. An important feature of the GMI effect is its sensitivity to the external magnetic field:
ξ = ( Δ Z / Z ) ( H )

3. Results

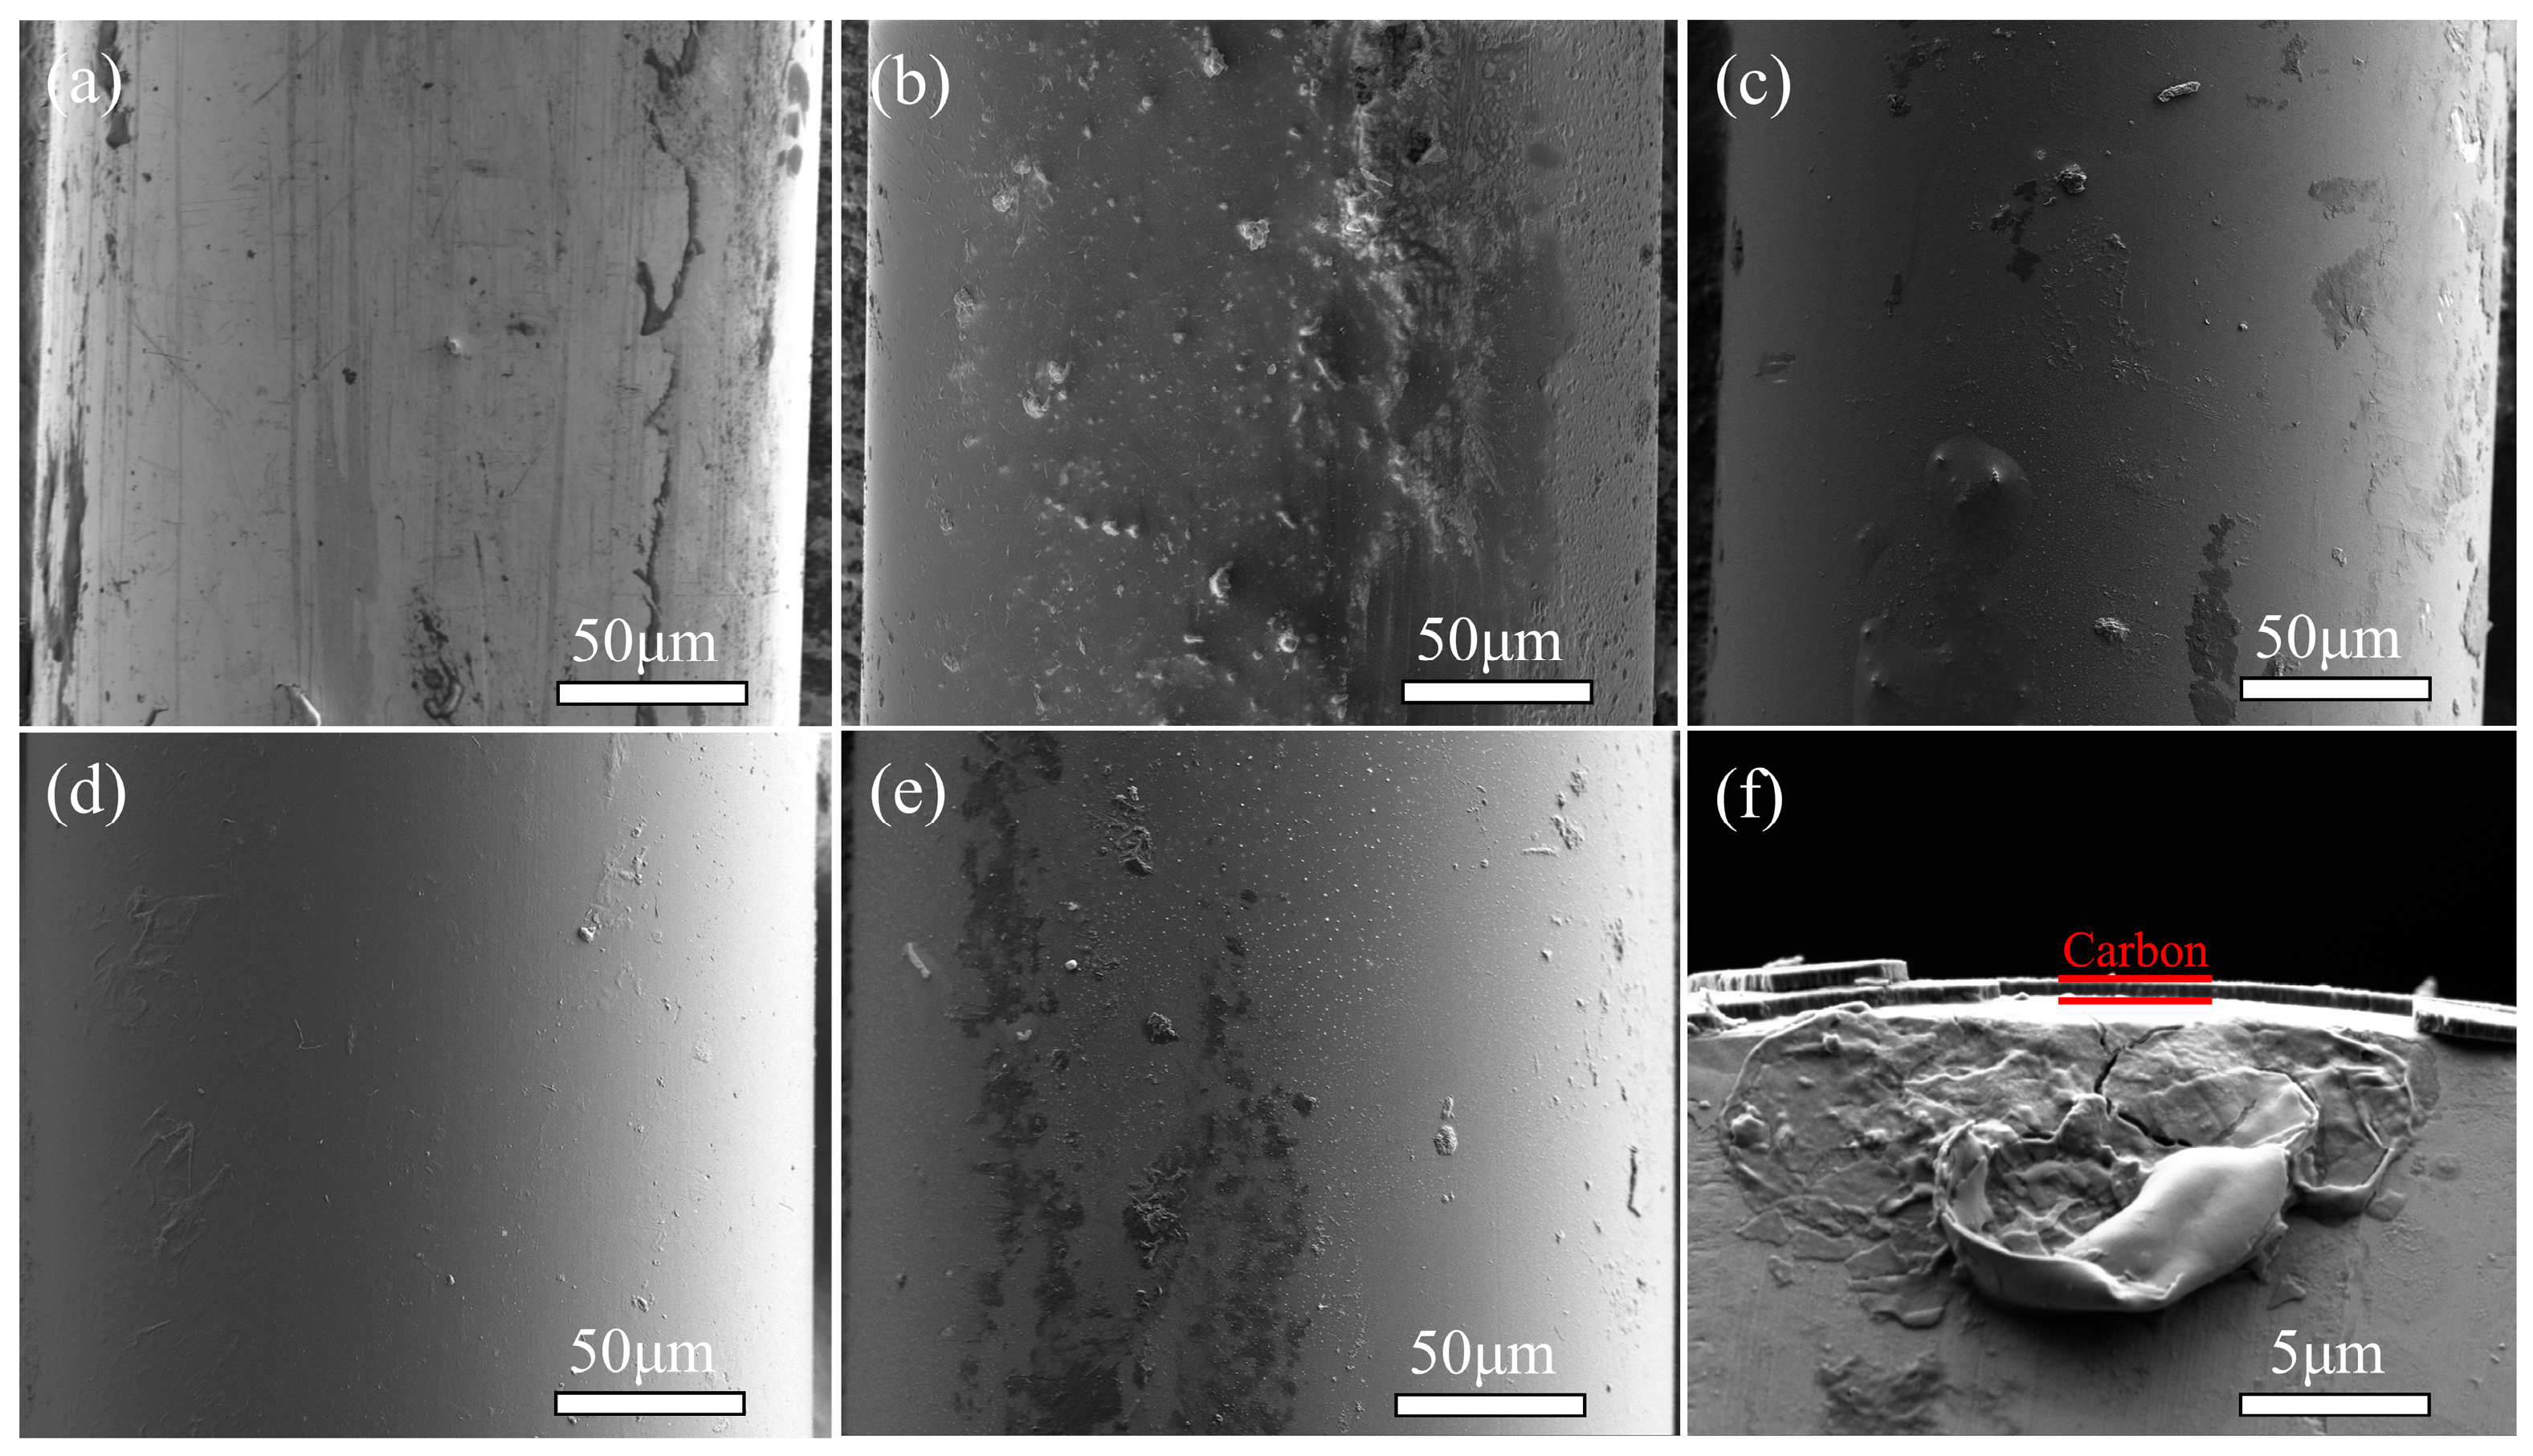
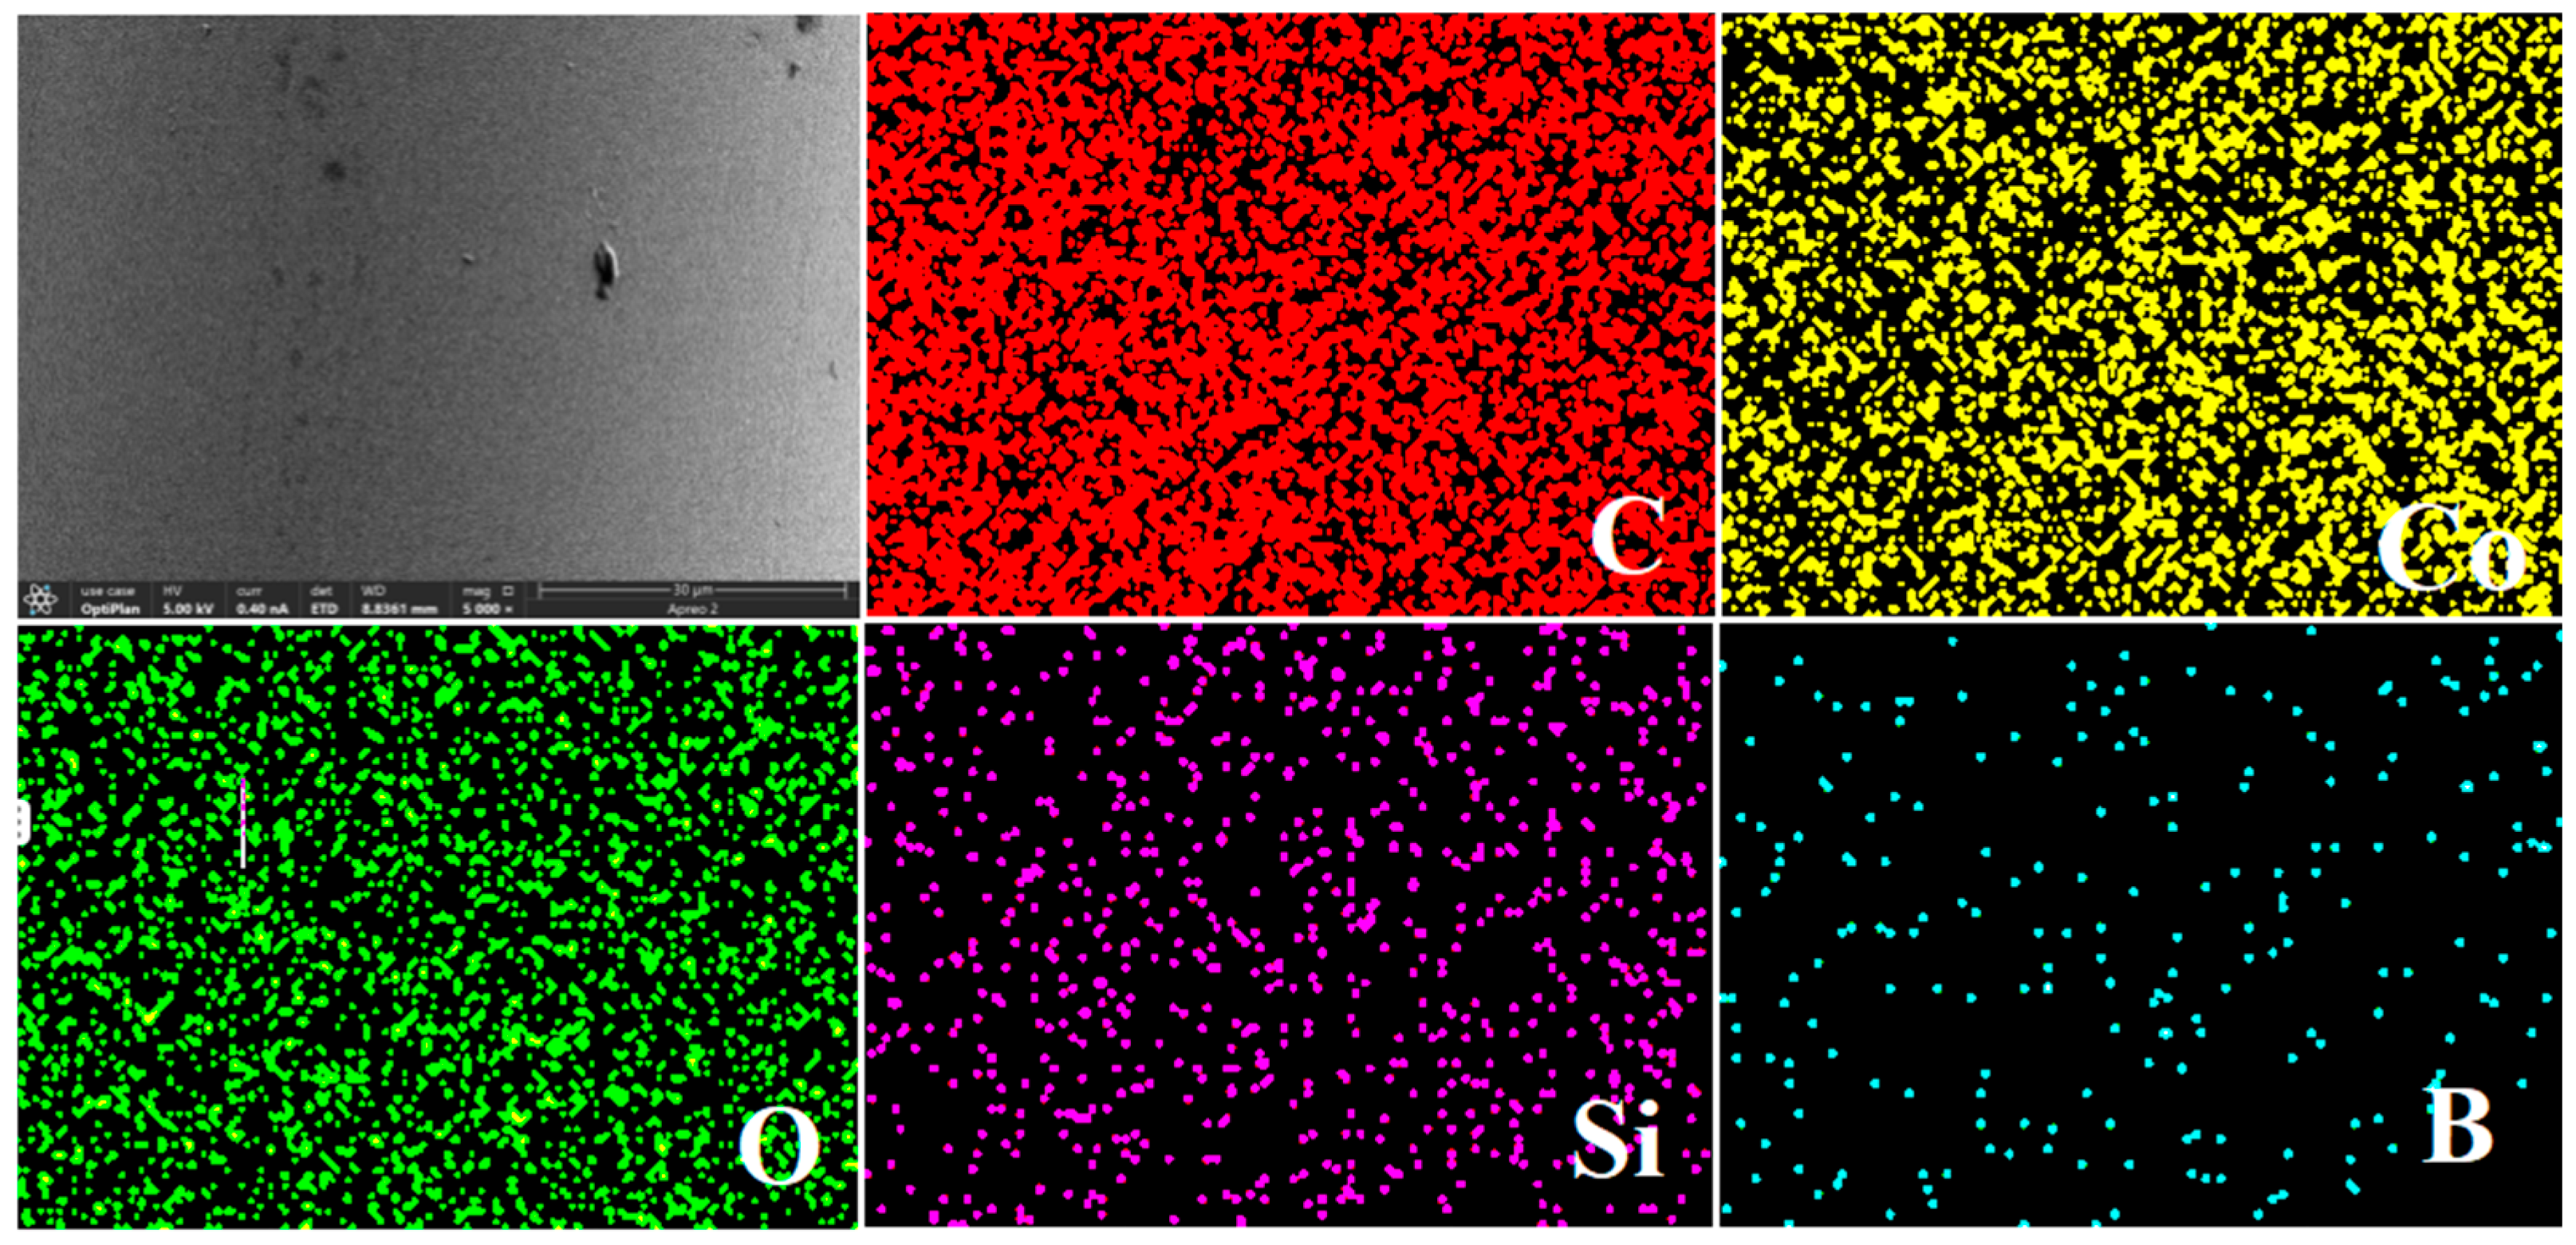
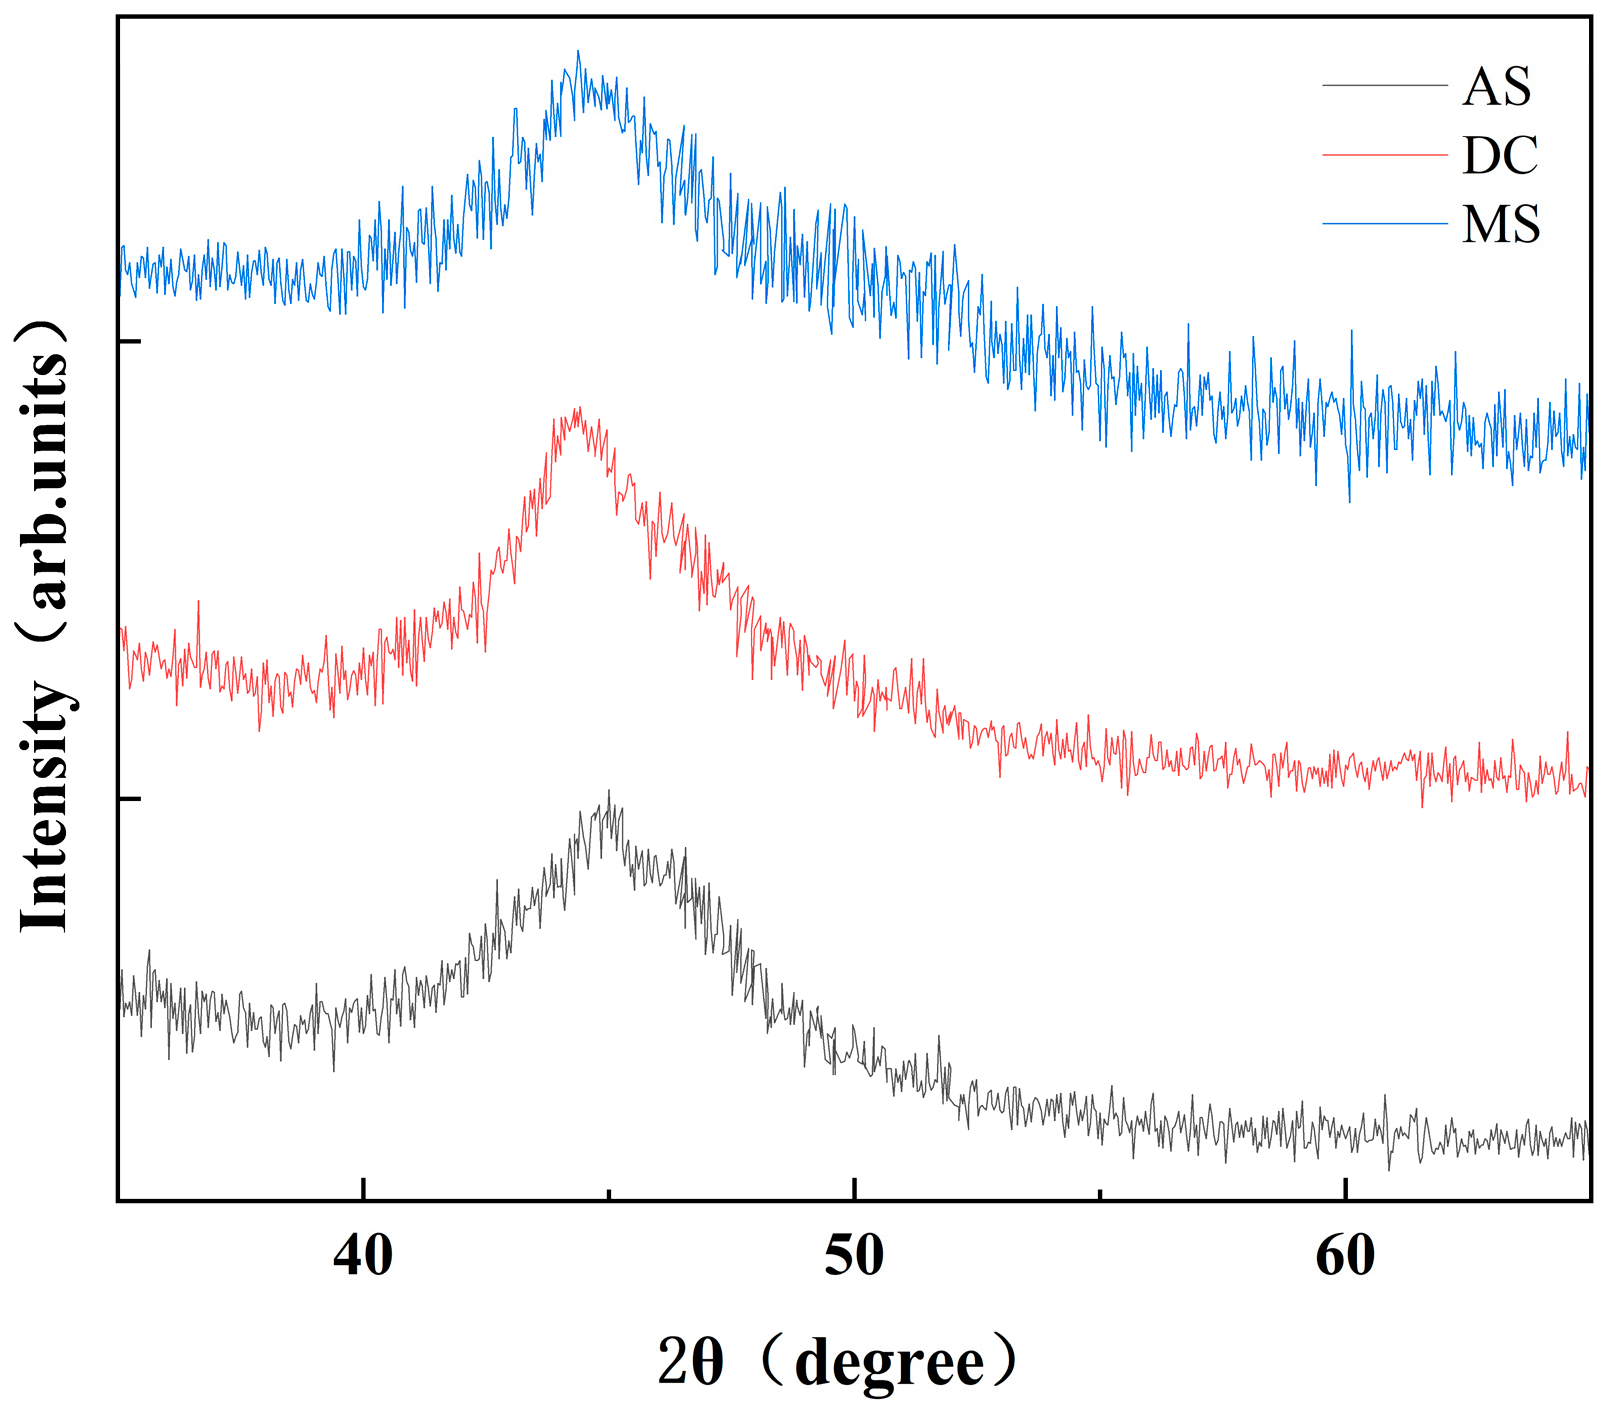
3.1. Characterization of Co-AWs

Figure 2 illustrates the surface morphology of the AS sample, DC sample, and MS samples with carbon nanocoatings of varying thicknesses and amplified cross-sections of composite Co-AWs. There were obvious crack defects on the surface AS sample, as seen in Figure 2a. In Figure 2b, we can see that the surfaces of DC samples tend to form clusters, likely due to the inherently uneven nature of the Co-AWs and DC process. Compared with the AS sample and DC sample, a denser nanocoating with fewer defects and smoother surface can be found in the MS samples, as seen in Figure 2c–e. For the MS samples, it can be seen that some small particles appear on the surfaces of Co-Aws, which may be caused by partial carbon agglomeration. When the thickness of the carbon nanocoating reaches 334 nm, it can be seen that the surfaces of the Co-AWs are very smooth and dense defects are minimized. However, a further increase in the thickness of the carbon nanocoating leads to the appearance of lumpy carbon agglomerates on the surface of the Co-AWs, as depicted in Figure 2e. A clear delamination structure observed between the Co-AWs and the carbon nanocoatings is shown in Figure 2f. The carbon nanocoating exhibits relatively uniform thickness, effectively demonstrating the successful preparation of a high-quality carbon film on the surfaces of Co-AWs via the MS method. By chemically plating graphene on the strip, it is known that the more complete the surface is, the smaller the degree of defects and the lower the stress [45].
Figure 3a shows the normalized hysteresis loops of the DC sample and MS sample. It was found that all samples exhibited typical ferromagnetism with favorable soft magnetic properties. Similar magnetization curves and low-saturation magnetic fields (<100 Oe) were observed, which can provide the conspicuous GMI effect in the applied fields (−140 Oe to 140 Oe). The DC and MS samples had lower coercivity and residual magnetization strength compared to the AS samples. The coercivity and residual magnetization strength of MS samples with different thicknesses of carbon nanocoatings are shown in Figure 3b. The coercivities of AS and DC samples were 7.2 Oe and 4.4 Oe, and the coercivity of all MS samples (203, 334, and 467 nm coatings) was below 5 Oe. The smallest coercivity of 3.4 Oe was obtained for the MS sample with a 334 nm nanocoating. Notably, the coercivities of the samples decreased and then increased with the increase in the thickness of the nanocoatings, while the permeability also changed. The decisive parameter for the GMI effect of the samples was μt, which increased and then decreased with increasing thickness, and this result can be used to interpret the MI results.
EDS was employed to analyze the elemental composition of the AS sample, the DC sample, and the MS samples. It was confirmed that the contents of carbon atoms on the surface of the DC sample (14%) and the MS samples (>26%) were significant higher than that of the AS sample (4.8%). Meanwhile, as the thicknesses of the carbon nanocoatings increase, the carbon atom content rises from 26.2% to 45.5%, with data analyzed by EDS spectroscopy presented in Table 1. This confirmed the formation of a progressively thickening carbon nanocoating on the surfaces of the Co-AWs. Figure 4 shows the energy spectrum analysis results of contained elements on the surface of the Co-AWs. The presence and content of the elements C, Co, O, Si, and B were confirmed. Figure 5 shows the X-ray diffraction patterns of AS, DC, and MS, and it can be seen that for all the samples, there is no significant crystallization peak. This indicates that the carbon layer is amorphous and that it does not change the microstructure of the composite wires.

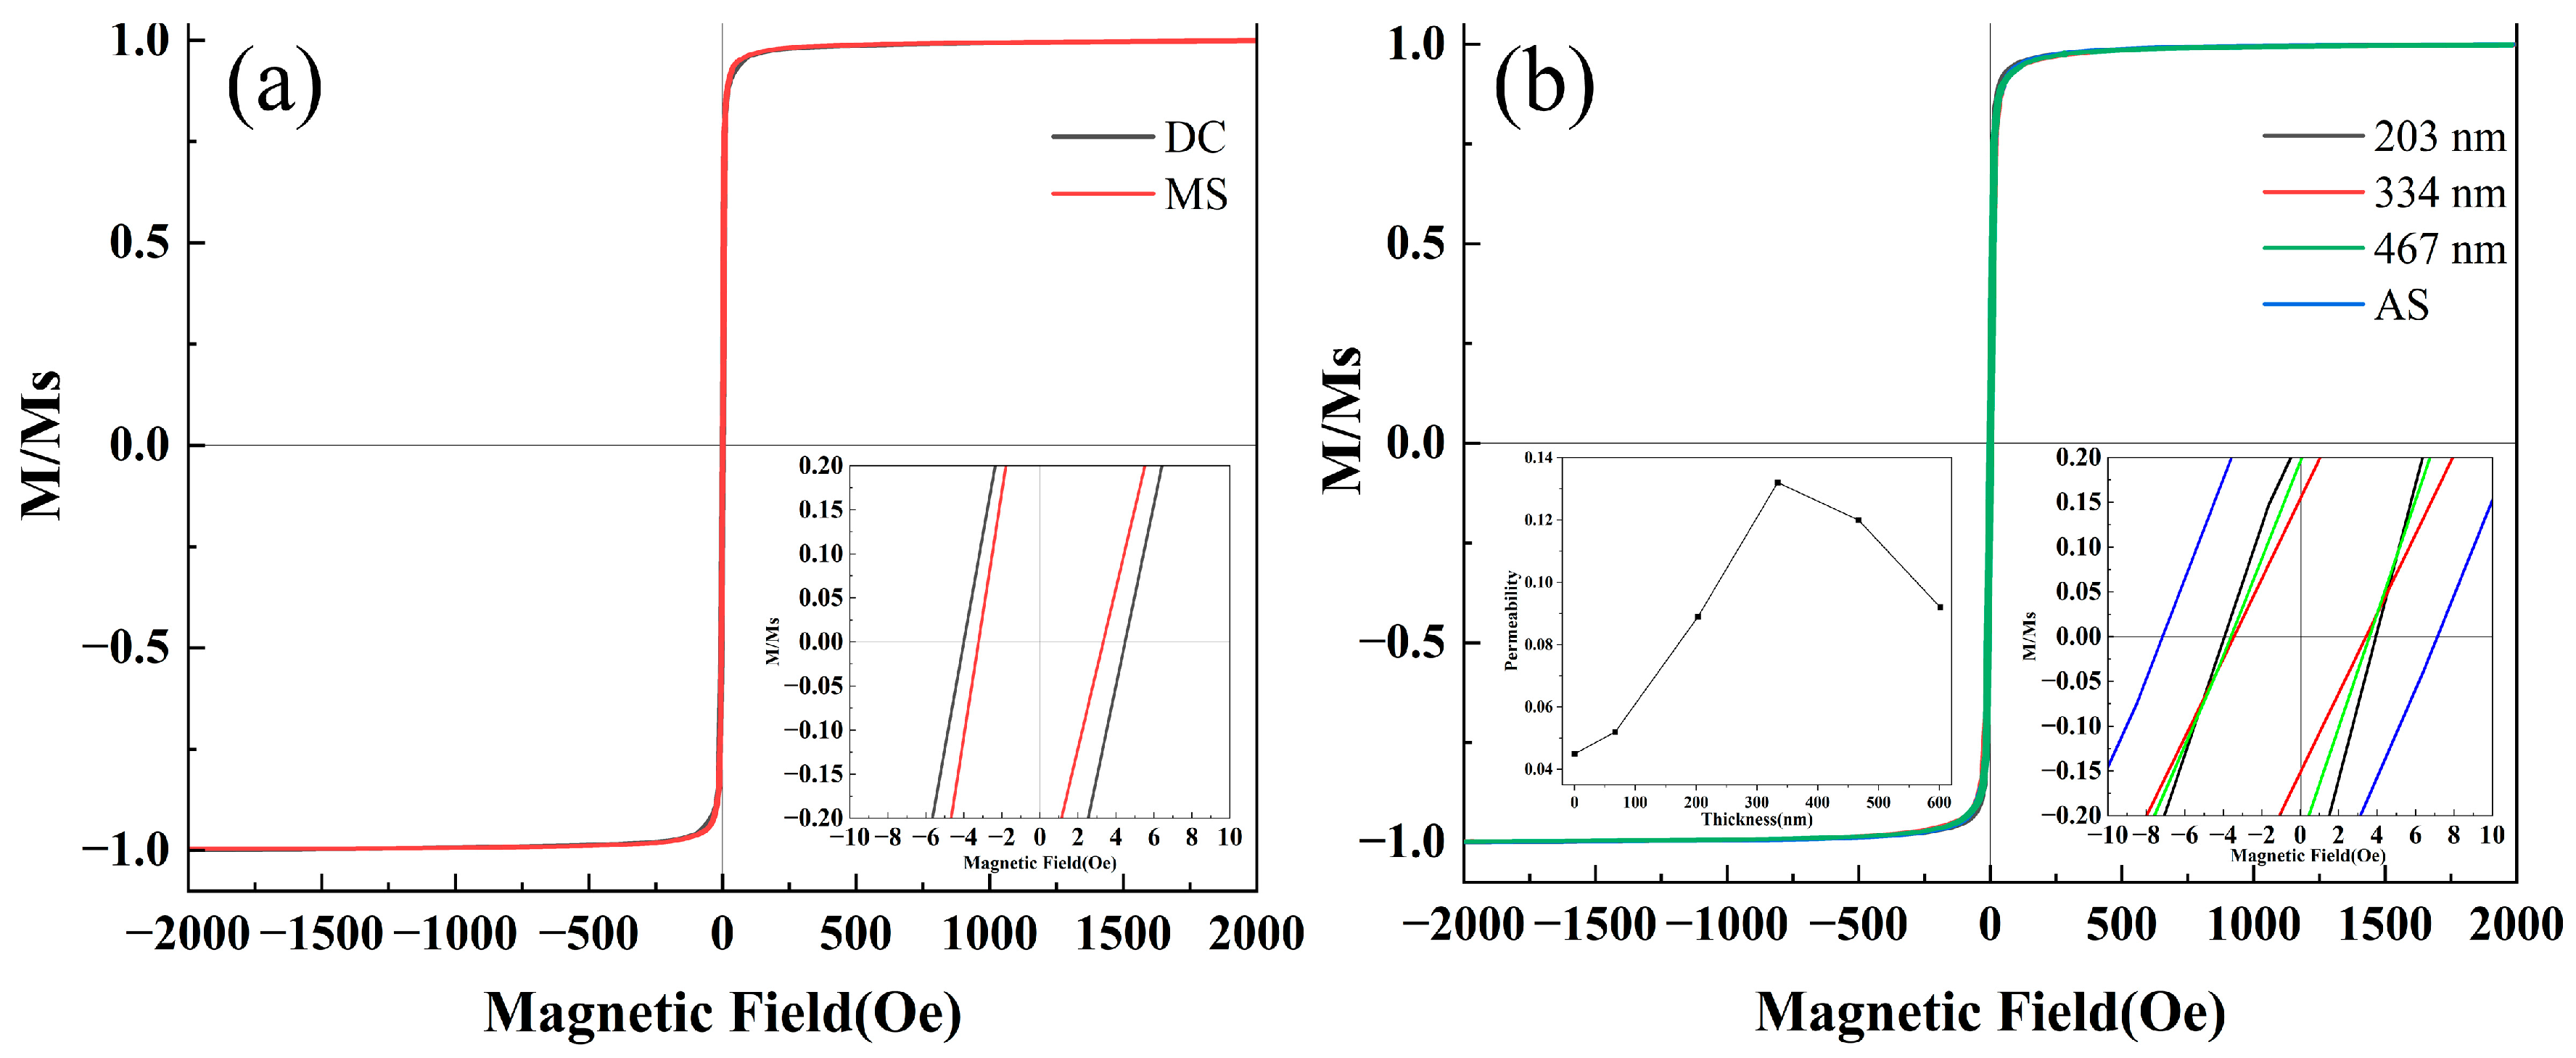
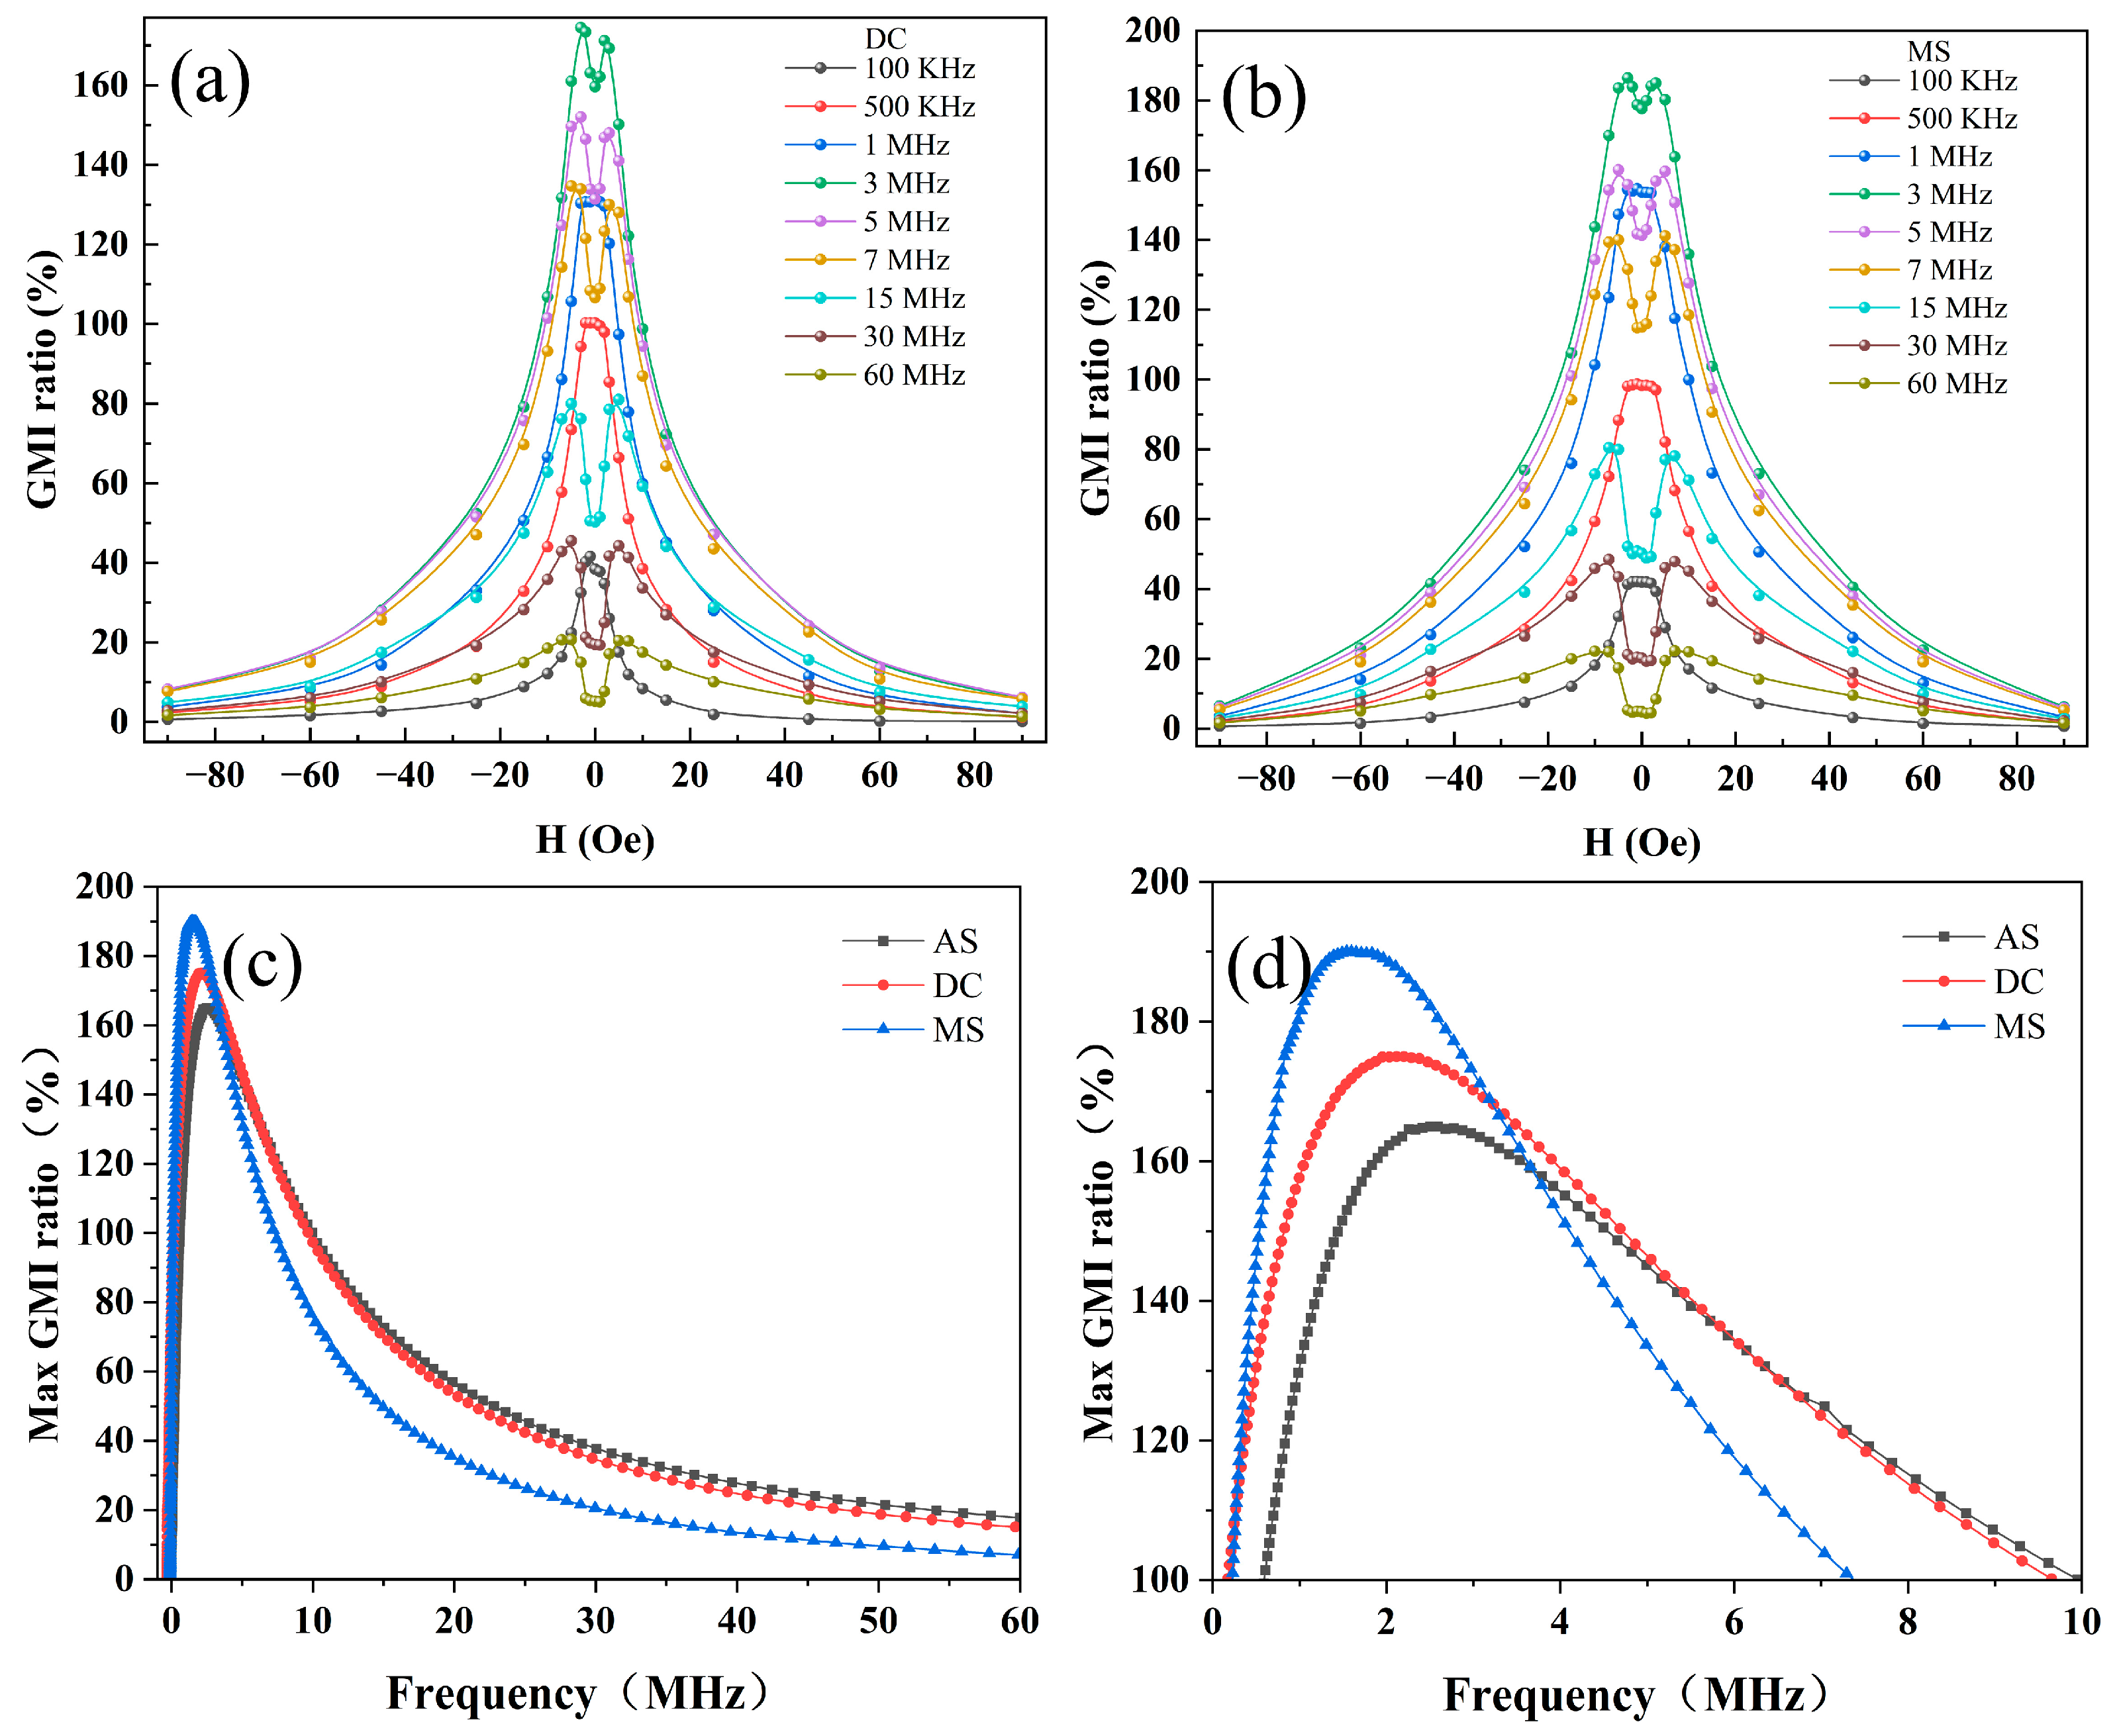
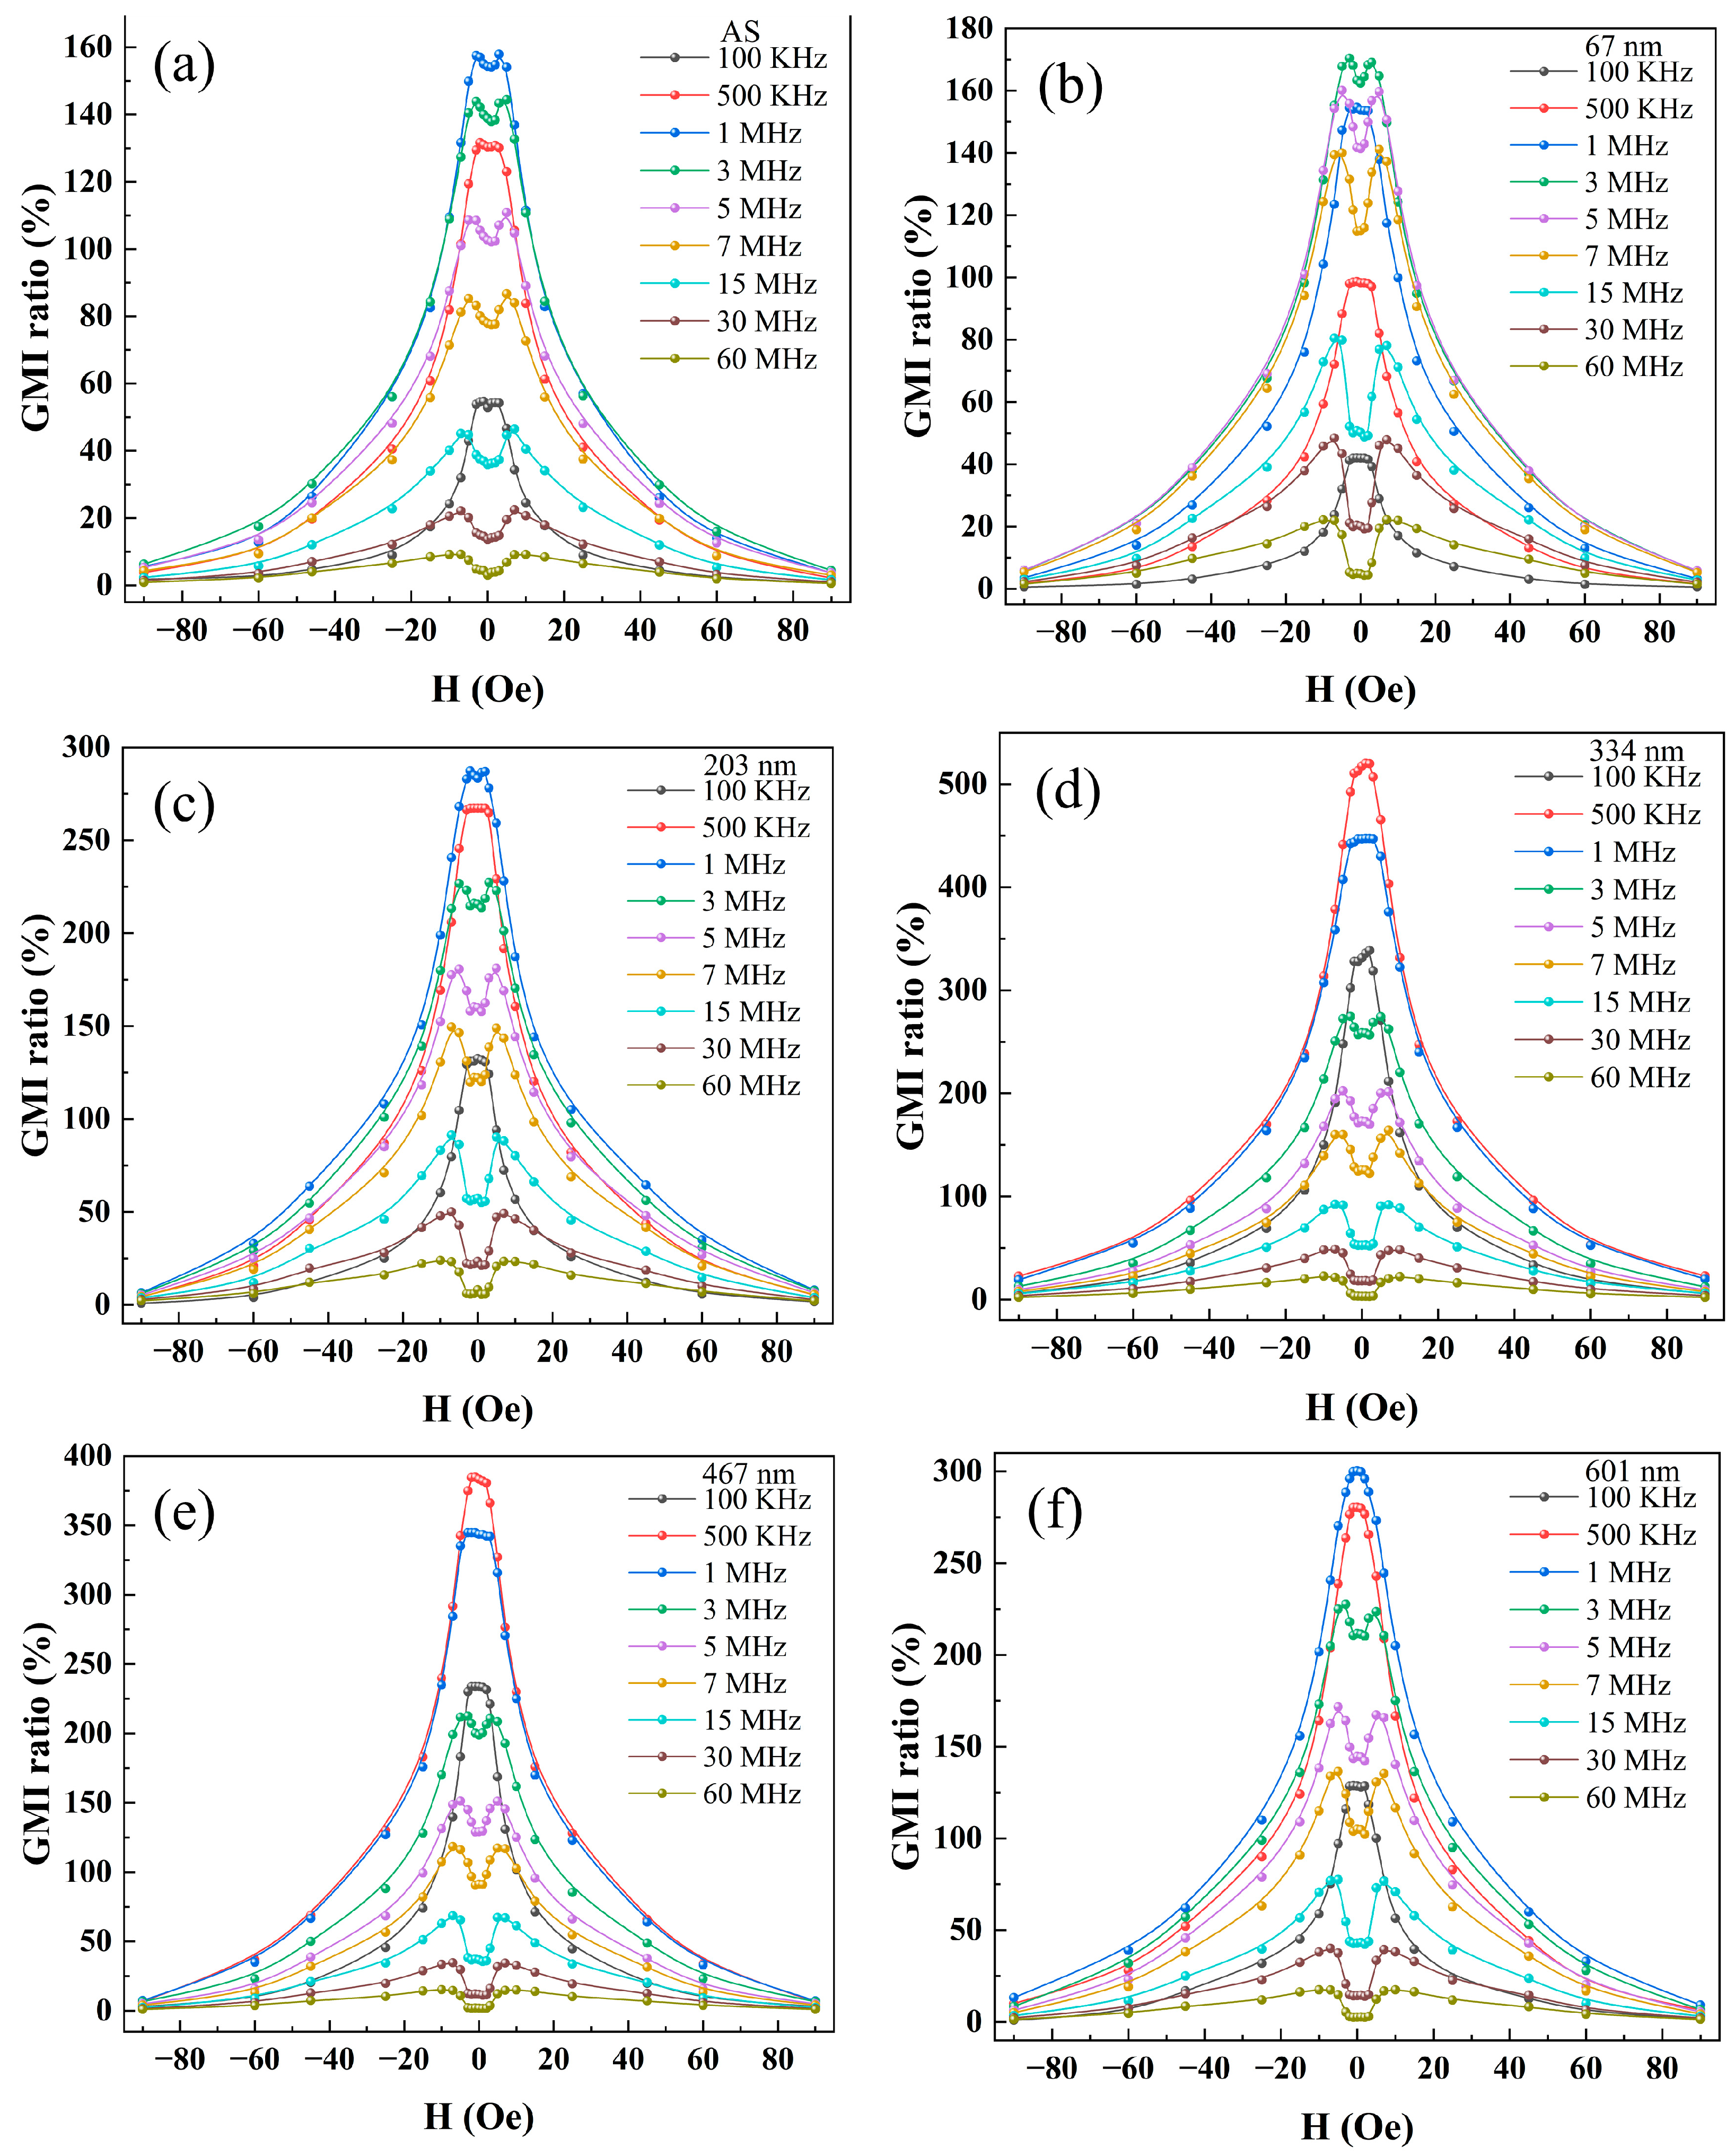
3.2. GMI Behaviors Analysis

Figure 6a,b show the field dependence of GMI responses for the DC sample and MS sample with 50 nm thickness nanocoatings. The maximum GMI effects were 175% and 190% for the DC and MS samples, respectively. And it can be seen that all of the GMI curves exhibit a double peak at higher frequencies (3~100 MHz) and a single peak at lower frequencies (100 KHz~1 MHz). The contribution of domain wall motion and magnetization rotation to the permeability changes with increasing frequency [44]. The frequency dependence of the maximum GMI for all the samples is shown in Figure 6c,d. The results show that the GMI effect was improved by both of the nanocoating methods. And the maximum GMI effect of the MS sample was increased by 25%, whereas the GMI effect of the DC sample was only increased by 10% compared with that of AS sample (165%). The results confirmed that MS is a better coating method to improve the GMI effect of Co-AWs. It can be seen in Figure 2 that the film of DC is not very homogeneous compared to MS and is prone to a large number of clusters, which may lead to an increase in stress. According to Equation (3), this will cause a change in the stress energy, which will affect the GMI curve. Compared with electrodeposited carbon nanotubes, carbon films can be formed more rapidly by the DC method. And the MS method obtained a higher magnetoimpedance change, and the prepared carbon film was denser and smoother. From Figure 6d, we can conclude that the characteristic frequencies of the AS sample, DC sample, and MS sample are 2.5 MHz, 2.1 MHz, and 1.7 MHz, respectively. The frequency range of the optimal GMI can be affected by a number of factors, such as the diameter of the metal core, the interfacial layer between the metal core and the coating, and magnetoelastic anisotropy [46].
Figure 7 illustrates the magnetic field dependence of the GMI effect of the AS sample and MS samples with varying carbon nanocoating thicknesses. All GMI curves show the same trend as stated above for the single- and double-peak phenomena. When the thickness of the carbon nanocoating exceeded 67 nm, a better GMI effect (280%, 522%, 370%, and 300% for 203, 334, 467, and 601 nm nanocoatings, respectively) could be obtained at lower working frequencies, as can be seen in Figure 7c–f. The characteristic frequencies of the MS samples (203–601 nm nanocoatings) were less than 1.0 MHz. The maximum GMI effect with 522% was obtained at a carbon nanocoating thickness of 334 nm. The preparation of amorphous wires with a diameter of 125 μm requires a high quenching rate, and alcohol consumption means that strong internal stresses are generated, especially in the near-surface layer [47]. When the GMI ratio reaches the maximum at this time, the external magnetic field is the peak field (Hp), which is equivalent to the magnetic anisotropy field of the sample. In Figure 7a–f, it can be seen that at a frequency of 3 MHz, Hp first decreases and then increases to 4.9 Oe, 4.5 Oe, 4.2 Oe, 3.1 Oe, 3.6 Oe, and 4 Oe, respectively, and this variation is not only related to anisotropy but also to the stress of the composite wires and to the electromagnetic interactions [45].
H p = H k + H i + H s
where Hk is anisotropic, Hi is electromagnetic energy, and Hs is stress energy. The addition of a carbon layer not only improves the surface roughness but also creates stress during the preparation. This causes a change in the peak field position, which has an effect on the magnetoresistance of the sample. Faraday’s law of induction shows that an induced current is generated when an AC current is passed through the composite wire. The induced current can be considered an eddy current, which distributes the AC current towards the surface of the composite wire, thus causing a change in the skin effect. The enhancement of the skin effect leads to an increase in the GMI effect. According to Equations (1) and (2), the highest sensitivities of the MS samples with 33.8%/Oe are larger than that of the AS sample (9.6%/Oe). The maximum GMI was enhanced by 357% from the AS sample to the MS sample.
Figure 8 illustrates the frequency dependence of the GMI ratio of the AS sample and all the MS samples at a magnetic field of 3 Oe. As the frequency increases, the GMIs of all samples initially increase, reaches a maximum at a specific frequency, and finally begins to decrease at higher frequencies. This phenomenon is related to the contribution of the domain wall motion and magnetization rotation to the permeability μt. In the higher-frequency range, because of the damping of the domain walls by eddy currents, only the magnetization rotation affects the magnetoimpedance [3]. The variation in the GMI can be explained by the skinning effect, and the skinning depth is defined as follows:
δ = 1 π σ μ t f
where σ is the conductivity, f is the frequency of the AC current, and μt is the dynamic transverse permeability. The variation in magnetoimpedance for different carbon layer thicknesses is related to the variation in magnetic permeability in the inset of Figure 3b, with an increase in μt, an enhancement of the skinning effect, and an increase in the MI ratio. The interaction between rGO and FINEMET strips leads to change in the skinning depth, and surfaces may undergo the same changes after the deposition of the carbon layer [45]. The change in the magnetoimpedance of the sample before and after deposition can be attributed to a combination of stress and electromagnetic interactions.
The relationship between the maximum GMI and the characteristic frequency as a function of carbon nanocoating thickness is shown in Figure 9a. The GMI of the MS samples initially increased and then decreased with the increasing thickness of the nanocoating. The maximum GMI value is 3.16 times larger than that of the AS sample. When the nanocoating thickness increases to 601 nm, the maximum GMI decreases to 301%. The characteristic frequencies of the samples are decreasing as the thickness of the carbon layer increases. The characteristic frequency can be roughly estimated as
f max = f ( 1 μ S π t 2 σ )
where t is the coating thickness and μs is the saturation permeability. It can be seen that the characteristic frequency is related to the magnetic properties and thickness of the coating. In order to verify the reliability of both DC and MS methods, two batches of samples were studied in this work, and the results of 10 tests of the same sample were compared, as shown in Figure 9b. The standard deviation of this sample was calculated from the test results of each batch of samples, where the standard deviations of AS and DC were 1.23 and 1.3, respectively. The maximum and minimum values of the standard deviation of the MS samples were 1.29 and 1.06, respectively. The results showed that the sensors prepared using the two methods had high repeatability and accuracy.

4. Conclusions

This study successfully utilized the MS and DC methods to fabricate carbon-based nanocoatings to modulate the GMI properties of Co-AWs. Using the DC method, the GMI effect of Co-AWs was improved from 165% to 175%. This approach demonstrated a quick and effective approach for the modulation of the GMI performance of Co-AWs; however, certain limitations were observed, including the production of overly thin nanocoatings in a single DC process and a lack of film density. Future work could address these challenges by employing multiple DC cycles to achieve thicker and denser nanocoatings. The MS method, on the other hand, proved to be a more effective technique for GMI modification in amorphous Co-AWs. Investigations into the effect of varying carbon nanocoating thicknesses revealed the existence of an optimal thickness for modulating the GMI effect. A coating thickness of 334 nm yielded the smoothest surface and the most favorable magnetic properties, including a coercivity of 3.4 Oe. This configuration achieved the highest GMI effect of 522% at a frequency of 0.8 MHz. The carbon nanocoating not only improved the surface roughness but also reduced the characteristic frequency of the composite wire, enhanced surface smoothness, and modified the initial surface quenching stress. Moreover, changes in magnetic permeability further elucidated the critical role of the carbon layer in altering the magnetoimpedance properties of Co-AWs. These findings present a novel methodology and theoretical framework for optimizing the performances of composite Co-AWs, paving the way for advancements in magnetic sensor technologies.

Author Contributions

Z.Y. and J.H. conceived and designed the experiments; J.C. and J.H. contributed to the fabrication of the composite wires; J.H. performed the GMI measurement; J.C. performed the SEM test and the VSM test; Z.Y. and C.L. analyzed the data, prepared graphical materials, and wrote the manuscript. All authors have read and agreed to the published version of the manuscript.

Funding

This work is financially supported by the Guangxi Science and Technology Program (2023JJA170157), the Innovation Project of Guangxi Graduate Education (JGY2023041), a grant from the Guangxi Key Laboratory of Brain-inspired Computing and Intelligent Chips (No. BCIC-23-K8), the National Key R&D Program of China (2023YFC2811100, 2023YFC2811104), and the National Major Scientific Instruments and Equipments Development Project of the National Natural Science Foundation of China (42127807-03).

Data Availability Statement

The data supporting the conclusions of this article are available on request from the corresponding author.

Acknowledgments

We thank Wenguo Chen and Yongbin Guo for their help with magnetic properties analysis.

Conflicts of Interest

The authors declare no conflicts of interest.

References

  1. Panina, L.V.; Mohri, K. Magneto-impedance effect in amorphous wires. Appl. Phys. Lett. 1994, 65, 1189–1191. [Google Scholar]
  2. Zhukov, A. (Ed.) Novel Functional Magnetic Materials: Fundamentals and Applications; Springer International Publishing: Cham, Switzerland, 2016. [Google Scholar]
  3. Phan, M.-H.; Peng, H.-X. Giant magnetoimpedance materials: Fundamentals and applications. Prog. Mater. Sci. 2008, 53, 323–420. [Google Scholar]
  4. Heiden, C.; Rogalla, H. Barri-Iausen Jump Field Distribution of Iron Whiskers. J. Magn. Magn. Mater. 1982, 26, 275–277. [Google Scholar]
  5. Zhukova, V.; Zhukov, A.; Blanco, J.M.; Gonzalez, J.; Ponomarev, B.K. Switching field fluctuations in a glass-coated Fe-rich amorphous microwire. J. Magn. Magn. Mater. 2002, 249, 131–135. [Google Scholar]
  6. Mohri, K.; Humphrey, F.B.; Kawashima, K.; Kimura, K.; Mizutani, M. Large Barkhausen and Matteucci effects in FeCoSiB, FeCrSiB, and FeNiSiB amorphous wires. IEEE Trans. Magn. 1990, 26, 1789–1791. [Google Scholar]
  7. Vazquez, M.; Chen, D.-X. The magnetization reversal process in amorphous wires. IEEE Trans. Magn. 1995, 31, 1229–1238. [Google Scholar]
  8. Corte-Leon, P.; Zhukova, V.; Ipatov, M.; Blanco, J.M.; Gonzalez, J.; Churyukanova, M.; Baraibar, J.M.; Taskaev, S.; Zhukov, A. Stress dependence of the magnetic properties of glass-coated amorphous microwires. J. Alloys Compd. 2019, 789, 201–208. [Google Scholar]
  9. Valenzuela, R.; Freijo, J.J.; Salcedo, A.; Vázquez, M.; Hernando, A. A miniature dc current sensor based on magnetoimpedance. J. Appl. Phys. 1997, 81, 4301–4303. [Google Scholar]
  10. Cobeño, A.F.; Zhukov, A.; Blanco, J.M.; Larin, V.; Gonzalez, J. Magnetoelastic sensor based on GMI of amorphous microwire. Sens. Actuators A Phys. 2001, 91, 95–98. [Google Scholar]
  11. Alimohammadi, S.; Williams, P.I.; Meydan, T. A Curvature Sensor Utilizing the Matteucci Effect in Amorphous Wire. Sensors 2023, 23, 1243. [Google Scholar] [CrossRef]
  12. Šmelko, M.; Draganová, K.; Lipovský, P.; Semrád, K.; Blišťanová, M.; Kašper, P. Non-Destructive Testing of Aircraft Structures Using Microwire-Based Tensile Stress Sensor. Appl. Sci. 2020, 10, 8218. [Google Scholar] [CrossRef]
  13. Zhu, Y.; Zhang, Q.; Li, X.; Pan, H.; Wang, J.; Zhao, Z. Detection of AFP with an ultra-sensitive giant magnetoimpedance biosensor. Sens. Actuators B Chem. 2019, 293, 53–58. [Google Scholar] [CrossRef]
  14. Zhu, Z.; Estevez, D.; Feng, T.; Chen, Y.; Li, Y.; Wei, H.; Wang, Y.; Wang, Y.; Zhao, L.; Jawed, S.A.; et al. A Novel Induction-Type Pressure Sensor based on Magneto-Stress Impedance and Magnetoelastic Coupling Effect for Monitoring Hand Rehabilitation. Small 2024, 20, 2400797. [Google Scholar] [CrossRef]
  15. Semrád, K.; Draganová, K. Non-Destructive Testing of Pipe Conveyor Belts Using Glass-Coated Magnetic Microwires. Sustainability 2022, 14, 8536. [Google Scholar] [CrossRef]
  16. Yang, H.; Li, S.; Wu, Y.; Bao, X.; Xiang, Z.; Xie, Y.; Pan, L.; Chen, J.; Liu, Y.; Li, R. Advances in Flexible Magnetosensitive Materials and Devices for Wearable Electronics. Adv. Mater. 2024, 36, 2311996. [Google Scholar] [CrossRef]
  17. Zhukova, V.; Churyukanova, M.; Kaloshkin, S.; Corte-Leon, P.; Ipatov, M.; Zhukov, A. Magnetostriction of amorphous Co-based and Fe-Ni-based magnetic microwires: Effect of stresses and annealing. J. Alloys Compd. 2023, 954, 170122. [Google Scholar] [CrossRef]
  18. Mu, C.; Hu, L.; Zhu, F.; Cui, Z.; He, A.; Dong, Y.; Man, Q.; Ma, H.; Li, J. Effects of drawing and tension stress annealing on the structure and magnetic properties of Co-based amorphous wire. J. Magn. Magn. Mater. 2024, 589, 171569. [Google Scholar] [CrossRef]
  19. Gonzalez, Á.; Corte-León, P.; Zhukova, V.; García-Gómez, A.; Ipatov, M.; González, J.M.; María Blanco, J.; Zhukov, A. Heat and current annealing effects on magnetic properties of Fe-rich glass-coated amorphous microwires with different radius. In Proceedings of the 2023 IEEE International Magnetic Conference—Short Papers (INTERMAG Short Papers), Sendai, Japan, 15–19 May 2023; IEEE: New York, NY, USA, 2023; pp. 1–2. [Google Scholar]
  20. Liu, R.; Cao, G.; Liu, J.; Li, Z.; Zhang, Y.; Liu, Z. Comparative study on GMI properties of Co-based microwires improved by alcohol and liquid nitrogen medium-current annealing. Mater. Res. Express 2021, 8, 065202. [Google Scholar] [CrossRef]
  21. Jiang, S.D.; Eggers, T.; Thiabgoh, O.; Xing, D.W.; Fang, W.B.; Sun, J.F.; Srikanth, H.; Phan, M.H. Enhancement of Giant Magneto-Impedance in Series Co-Rich Microwires for Low-Field Sensing Applications. J. Electron. Mater. 2018, 47, 2667–2672. [Google Scholar] [CrossRef]
  22. Zhu, Z.; Peng, M.; Wang, Y.; Qin, F. Ultra-large giant magnetoimpedance effect by a 2D square spiral amorphous microwire. J. Magn. Magn. Mater. 2022, 550, 169090. [Google Scholar] [CrossRef]
  23. Zhang, S.-L.; Chai, Y.-S.; Fang, D.-Q.; Wang, L.-C.; Xing, D.-W.; Sun, J.-F. Giant magneto-impedance effect of two paralleled amorphous microwires. Rare Met. 2016, 35, 344–348. [Google Scholar]
  24. Jiang, S.D.; Eggers, T.; Thiabgoh, O.; Xing, D.W.; Fei, W.D.; Shen, H.X.; Liu, J.S.; Zhang, J.R.; Fang, W.B.; Sun, J.F.; et al. Relating surface roughness and magnetic domain structure to giant magneto-impedance of Co-rich melt-extracted microwires. Sci. Rep. 2017, 7, 46253. [Google Scholar]
  25. Zhukov, A.; Ipatov, M.; Churyukanova, M.; Talaat, A.; Blanco, J.M.; Zhukova, V. Trends in optimization of giant magnetoimpedance effect in amorphous and nanocrystalline materials. J. Alloys Compd. 2017, 727, 887–901. [Google Scholar]
  26. Zhang, Y.; Huang, C.; Duan, Z.; Liu, Q.; Wang, J.; Shi, W. Enhanced magnetoimpedance effect of Fe75.5Cu1Nb3Si13.5B7 ribbon covered by in-situ growth vertical graphene sheets. Mater. Lett. 2018, 222, 131–134. [Google Scholar]
  27. Chen, Y.; Zou, J.; Shu, X.; Song, Y.; Zhao, Z. Enhanced giant magneto-impedance effects in sandwich FINEMET/rGO/FeCo composite ribbons. Appl. Surf. Sci. 2021, 545, 149021. [Google Scholar]
  28. Guo, Y.-B.; Wang, D.; Wang, Z.-M.; Ma, L.; Zhao, Z.-J. Asymmetric magnetoimpedance effect and dipolar interactions of FINEMET/SiO2/FePd composite ribbons. Chin. Phys. B 2023, 32, 070703. [Google Scholar]
  29. Zhang, Q.; Mao, Q.; Ruan, J.; Wang, Q.; Yang, X.; Zhao, Z. Giant magneto-impedance effect of magnetron sputtered Ni80Fe20/SiO2/Cu composite wires. J. Magn. Magn. Mater. 2008, 320, 2319–2321. [Google Scholar] [CrossRef]
  30. Xie, L.; Li, X.; Zou, J.T.; Pan, H.L.; Xie, W.H.; Zhao, Z.J. Optimized giant magneto-impedance effect in electroless-deposited NiFeP/Cu composite wires. Surf. Coat. Technol. 2018, 334, 158–163. [Google Scholar]
  31. Mardani, R.; Shahmirzaee, H.; Ershadifar, H.; Vahdani, M.R. Electrodeposition of Ni32Fe48Mo20 and Ni52Fe33W15 alloy film on Cu microwire from ionic liquid containing plating bath. Surf. Coat. Technol. 2017, 324, 281–287. [Google Scholar]
  32. Salary, M.M.; Jafar-Zanjani, S.; Mosallaei, H. Time-varying metamaterials based on graphene-wrapped microwires: Modeling and potential applications. Phys. Rev. B 2018, 97, 115421. [Google Scholar]
  33. Tandon, P.; Sahu, R.; Mishra, A.C.; Singh, K.; Srikanti, K.; Gopalan, R. Magnetoimpedance effect in electrodeposited NiFe/Cu wire using trisodium citrate additive in plating bath. J. Magn. Magn. Mater. 2023, 570, 170490. [Google Scholar]
  34. Tandon, P.; Sahu, R.; Mishra, A.C. Giant magnetoimpedance effect in electrodeposited CoNiFe/Cu composite wire: Experimental study and analytical modelling. Phys. B Condens. Matter. 2022, 642, 414131. [Google Scholar]
  35. Xiang, S.; Zou, J.; Li, X.; Xie, W.; Zhao, Z.J. Magnetic properties and giant magneto-impedance effect in electroless-deposited CoP/Cu composite wires. Mater. Res. Express 2019, 6, 066101. [Google Scholar]
  36. Tandon, P.; Mishra, A.C. The effect of magnetic field orientation on the magnetoimpedance of electroplated NiFeCo/Cu wire. J. Mater. Sci. Mater. Electron. 2022, 33, 18311–18326. [Google Scholar]
  37. Shi, L.; Ruan, J.; Zhang, J.; Zhao, Z.; Gao, H.B.; Hartmann, U. Enhancement of giant magneto-impedance effect in Ni80Fe20/SiO2/Cu composite wires. Phys. B Condens. Matter. 2009, 404, 3766–3770. [Google Scholar]
  38. Mbayachi, V.B.; Ndayiragije, E.; Sammani, T.; Taj, S.; Mbuta, E.R.; Khan, A.U. Graphene synthesis, characterization and its applications: A review. Results Chem. 2021, 3, 100163. [Google Scholar]
  39. Razaq, A.; Bibi, F.; Zheng, X.; Papadakis, R.; Jafri, S.H.M.; Li, H. Review on Graphene-, Graphene Oxide-, Reduced Graphene Oxide-Based Flexible Composites: From Fabrication to Applications. Materials 2022, 15, 1012. [Google Scholar] [CrossRef]
  40. Novoselov, K.S.; Fal′ko, V.I.; Colombo, L.; Gellert, P.R.; Schwab, M.G.; Kim, K. A roadmap for graphene. Nature 2012, 490, 192–200. [Google Scholar]
  41. Okhay, O.; Goncalves, G. Carbon and Related Composites for Sensors and Energy Storage: Synthesis, Properties, and Application. C 2024, 10, 101. [Google Scholar] [CrossRef]
  42. Giri, P.; Gill, I.; Swensgard, M.; Kaiser, A.; Rust, A.; Stuparyk, B.; Fisher, A.; Williams, J.; Renoit, K.; Kreeb, E.; et al. Pristine and Coated Carbon Nanotube Sheets—Characterization and Potential Applications. C 2024, 10, 17. [Google Scholar] [CrossRef]
  43. Golubeva, E.V.; Stepanova, E.A.; Balymov, K.G.; Volchkov, S.O.; Kurlyandskaya, G.V. Magnetic Properties and the Giant Magnetoimpedance of Amorphous Co-Based Wires with a Carbon Coating. Phys. Met. Metallogr. 2018, 119, 324–331. [Google Scholar] [CrossRef]
  44. Estevez, D.; Zhao, Y.; Wang, Y.; Qin, F.; Peng, H.-X. Optimizing magnetoimpedance of amorphous microwires by nanocarbon-induced magnetic anisotropy. J. Magn. Magn. Mater. 2020, 502, 166527. [Google Scholar] [CrossRef]
  45. Zou, J.; Chen, Y.; Shu, X.; Li, X.; Song, Y.; Zhao, Z. Proper pH value enhances giant magneto-impedance effect of FINEMET/rGO composite ribbons by electroless plating. Mater. Sci. Eng. B 2021, 265, 115004. [Google Scholar] [CrossRef]
  46. Corte-León, P.; Zhukova, V.; Ipatov, M.; Blanco, J.M.; Gonzalez, J.; Dominguez, L.; Churyukanova, M.; Zhukov, A. High frequency giant magnetoimpedance effect of a stress-annealed Fe-rich glass-coated microwire. J. Alloys Compd. 2019, 802, 112–117. [Google Scholar] [CrossRef]
  47. Vázquez, M.; Hernando, A. A soft magnetic wire for sensor applications. J. Phys. D Appl. Phys. 1996, 29, 939–949. [Google Scholar] [CrossRef]
Figure 1. A schematic diagram of the principle: (a) DC method (b) MS method. (c) Impedance measurement.
Carbon 11 00026 g001
Figure 2. Typical SEM images: (a) AS sample, (b) DC sample, and (ce) MS samples with 203 nm, 334 nm, and 467 nm carbon nanocoatings, respectively; (f) amplified cross-section of composite Co-AWs with 203 nm carbon nanocoating.
Carbon 11 00026 g002
Figure 3. Normalized hysteresis loops of DC sample vs. MS samples (a) and MS samples with nanocoatings of various thicknesses vs. AS sample. Inset shows slope at zero (permeability) and partial enlargement view (b).
Carbon 11 00026 g003
Figure 4. Elemental mapping image corresponding to a MS sample with 467 nm nanocoating.
Carbon 11 00026 g004
Figure 5. X-ray diffraction of AS, DC, and MS samples.
Carbon 11 00026 g005
Figure 6. The magnetic field dependence of GMI for (a) the DC sample and (b) the MS sample and the frequency dependence of the maximum GMI ratio for the samples’ (c) full views and (d) partial enlargement views.
Carbon 11 00026 g006
Figure 7. The field dependence of the GMI effect of the AS sample (a) and the MS samples with various coatings with thicknesses of 67 nm (b), 203 nm (c), 334 nm (d), 467 nm (e), and 601 nm (f).
Carbon 11 00026 g007
Figure 8. Frequency dependence of the GMI ratio of the AS sample and the MS samples at a magnetic field of 3 Oe.
Carbon 11 00026 g008
Figure 9. Variation in the maximum GMI ratio and fmax with different thicknesses of carbon nanocoatings (a) and maximum GMI ratios for the AS, DC, and MS array samples (b).
Carbon 11 00026 g009
Table 1. Analysis of carbon element in varying samples by energy spectroscopy.
SampleASDC203 nm334 nm467 nm
Atomic %4.814.026.230.245.5
Weight1.24.48.911.221.8
Disclaimer/Publisher’s Note: The statements, opinions and data contained in all publications are solely those of the individual author(s) and contributor(s) and not of MDPI and/or the editor(s). MDPI and/or the editor(s) disclaim responsibility for any injury to people or property resulting from any ideas, methods, instructions or products referred to in the content.

