Review

Proton Exchange Membrane Electrolyzer Modeling for Power Electronics Control: A Short Review

1
Group of Research in Electrical Engineering of Nancy (GREEN), Université de Lorraine, GREEN, F-54000 Nancy, France
2
Department of Teacher Training in Electrical Engineering, Faculty of Technical Education, King Mongkut’s University of Technology North Bangkok (KMUTNB), 1518, Pracharat 1 Road, Bangsue, Bangkok 10800, Thailand
3
ICAR, Institute for High Performance Computing and Networking, Italian National Research Council of Italy, 90146 Palermo, Italy
*
Author to whom correspondence should be addressed.
Submission received: 31 March 2020 / Revised: 26 April 2020 / Accepted: 6 May 2020 / Published: 9 May 2020

Abstract

:
The main purpose of this article is to provide a short review of proton exchange membrane electrolyzer (PEMEL) modeling used for power electronics control. So far, three types of PEMEL modeling have been adopted in the literature: resistive load, static load (including an equivalent resistance series-connected with a DC voltage generator representing the reversible voltage), and dynamic load (taking into consideration the dynamics both at the anode and the cathode). The modeling of the load is crucial for control purposes since it may have an impact on the performance of the system. This article aims at providing essential information and comparing the different load modeling.

Graphical Abstract

1. Introduction

Hydrogen is the most innumerable and simplest element on Earth. It can store and deliver usable energy. However, it does not exist by itself in nature and must be made from different elements that contain it. For instance, it can be combined with carbon (e.g., oil, natural gas) and with oxygen in water (H2O) [1]. Hydrogen has the highest specific energy per kilogram of all fuels (i.e., 120–140 MJ/kg), but its energy density is less suitable for storage (i.e., 2.8–10 MJ/L) depending on the physical-based storage (e.g., compressed (350–700 bar), liquid) [2]. On one hand, the global hydrogen production from natural gas, coal, and oil by using the reformation process represents approximately 96%. On the other hand, the use of the water electrolysis process to split the deionized water into hydrogen and oxygen represents around 4% of the global hydrogen production [3]. Albeit hydrogen being an intrinsically clean energy vector, it requires energy to be produced; the kind of adopted source makes the difference. Hydrogen produced by fossil fuels is known as grey hydrogen due to indirect pollution.
To supply the water electrolysis process, renewable energy sources (RES) (e.g., wind turbines, photovoltaic) are the most suitable since they can limit the environmental impact. In this way, the so-called green hydrogen is obtained. Blending this kind of hydrogen into the existing natural gas pipeline network has been proposed as a means of increasing the output of renewable energy systems. Delivering blends of hydrogen and methane by pipeline also has a long history; recently, the rapid growth in installed wind power capacity and interest in the near-term market readiness of fuel cell electric vehicles has increased the stakeholder interests [4,5].
The water electrolysis process is carried out by an electrolyzer. Nowadays, there are three main types of electrolyzers: alkaline electrolyzer (AEL), proton exchange membrane electrolyzer (PEMEL), and solid oxide electrolyzer (SOEL) [3,6]. Currently, AEL and PEMEL are commercially available, and SOEL is still under research and development. AEL is the oldest technology widespread around the world, commonly used for large-scale systems. The advantage of this technology is its long lifespan and lower capital cost due to the cheaper catalysts based on Nickel material. However, AELs have several drawbacks such as low current density and operational pressures [6]. Besides, their response time in case of dynamic operations is slower compared to PEMELs. Indeed, since AEL is based on a liquid electrolyte leading up to more inertia, the ion transportation is slower compared to PEMEL [7]. This issue is particularly crucial when an electrolyzer has to be operated under fast dynamics, usually met when RES are adopted. Indeed, a RES depends on weather conditions (as solar irradiance or wind speed) that can vary abruptly during the operation. For this reason, this technology is not generally considered to be coupled with RES; conversely, it is employed for high-power stationery operated plants supplied by the grid where the harmonics impact on the grid has to be considered [8,9,10].
In comparison, PEMELs are generally used for small-scale hydrogen production. Anyway, PEMELs can be connected in series to form a multi-stack electrolyzer for large-scale systems. Furthermore, PEMELs offer some advantages compared to AELs, such as high current densities, high cell voltage efficiency, and fast system response when operating dynamically [3,11], since PEMEL has faster ion transportation due to the solid and thin membrane. As a result, this review article is focused on PEMEL technology since it can be connected with RES to produce hydrogen.
On the other side, power converters are mandatory for the hydrogen production system supplied by RES to interface the RES with PEMEL. In these systems, DC–DC converters play a crucial role since most of RESs generate high DC voltage output and PEMELs need to be supplied with low DC voltage input [12]. However, the system needs an AC–DC converter if a wind turbine conversion system or power grid is used [10,13]. Dealing with PEMEL supplied by power converters, it is clear that two systems with their dynamics have to interact with each other. For this reason, the PEMEL model needs a deep investigation; it becomes of the utmost importance when RES is employed since the delivered power can vary with a dynamic that solicits the whole conversion chain.
To simulate the hydrogen production system by using PEMEL supplied by RES, it is necessary to know the PEMEL electrical characteristics. The model must replicate the real behavior of PEMEL (i.e., static, dynamic operations) to investigate its interaction with power converters. In the literature, three types of models have been reported (e.g., resistive load, static load, and dynamic load) [14,15,16,17,18,19,20,21,22,23,24,25]. The last modeling comes from the need to investigate the dynamic of the conversion chain with RES.
The main objective of this article is to present each model used for power electronics control and how these models have been developed. Besides, the validity of these models is discussed. Finally, some guidelines are provided to determine the parameters of the proposed models (i.e., static and dynamic).
This article is divided into three sections. After the introduction presenting the current state-of-the-art, and the reasons to carry out such review work, Section 2 is focused on the proton exchange membrane electrolyzer system for hydrogen production including the DC–DC converter. Finally, a review of proton exchange membrane electrolyzer modeling for control propose and a comparison of the static and dynamic models from the control point of view are provided in Section 3.

2. Proton Exchange Membrane Electrolyzer System

2.1. Proton Exchange Membrane Stack

The first proton exchange membrane electrolyzer has been developed by the General Electric (GE) Company in the 1960s. This technology aims at overcoming the weaknesses of AEL technology [3].
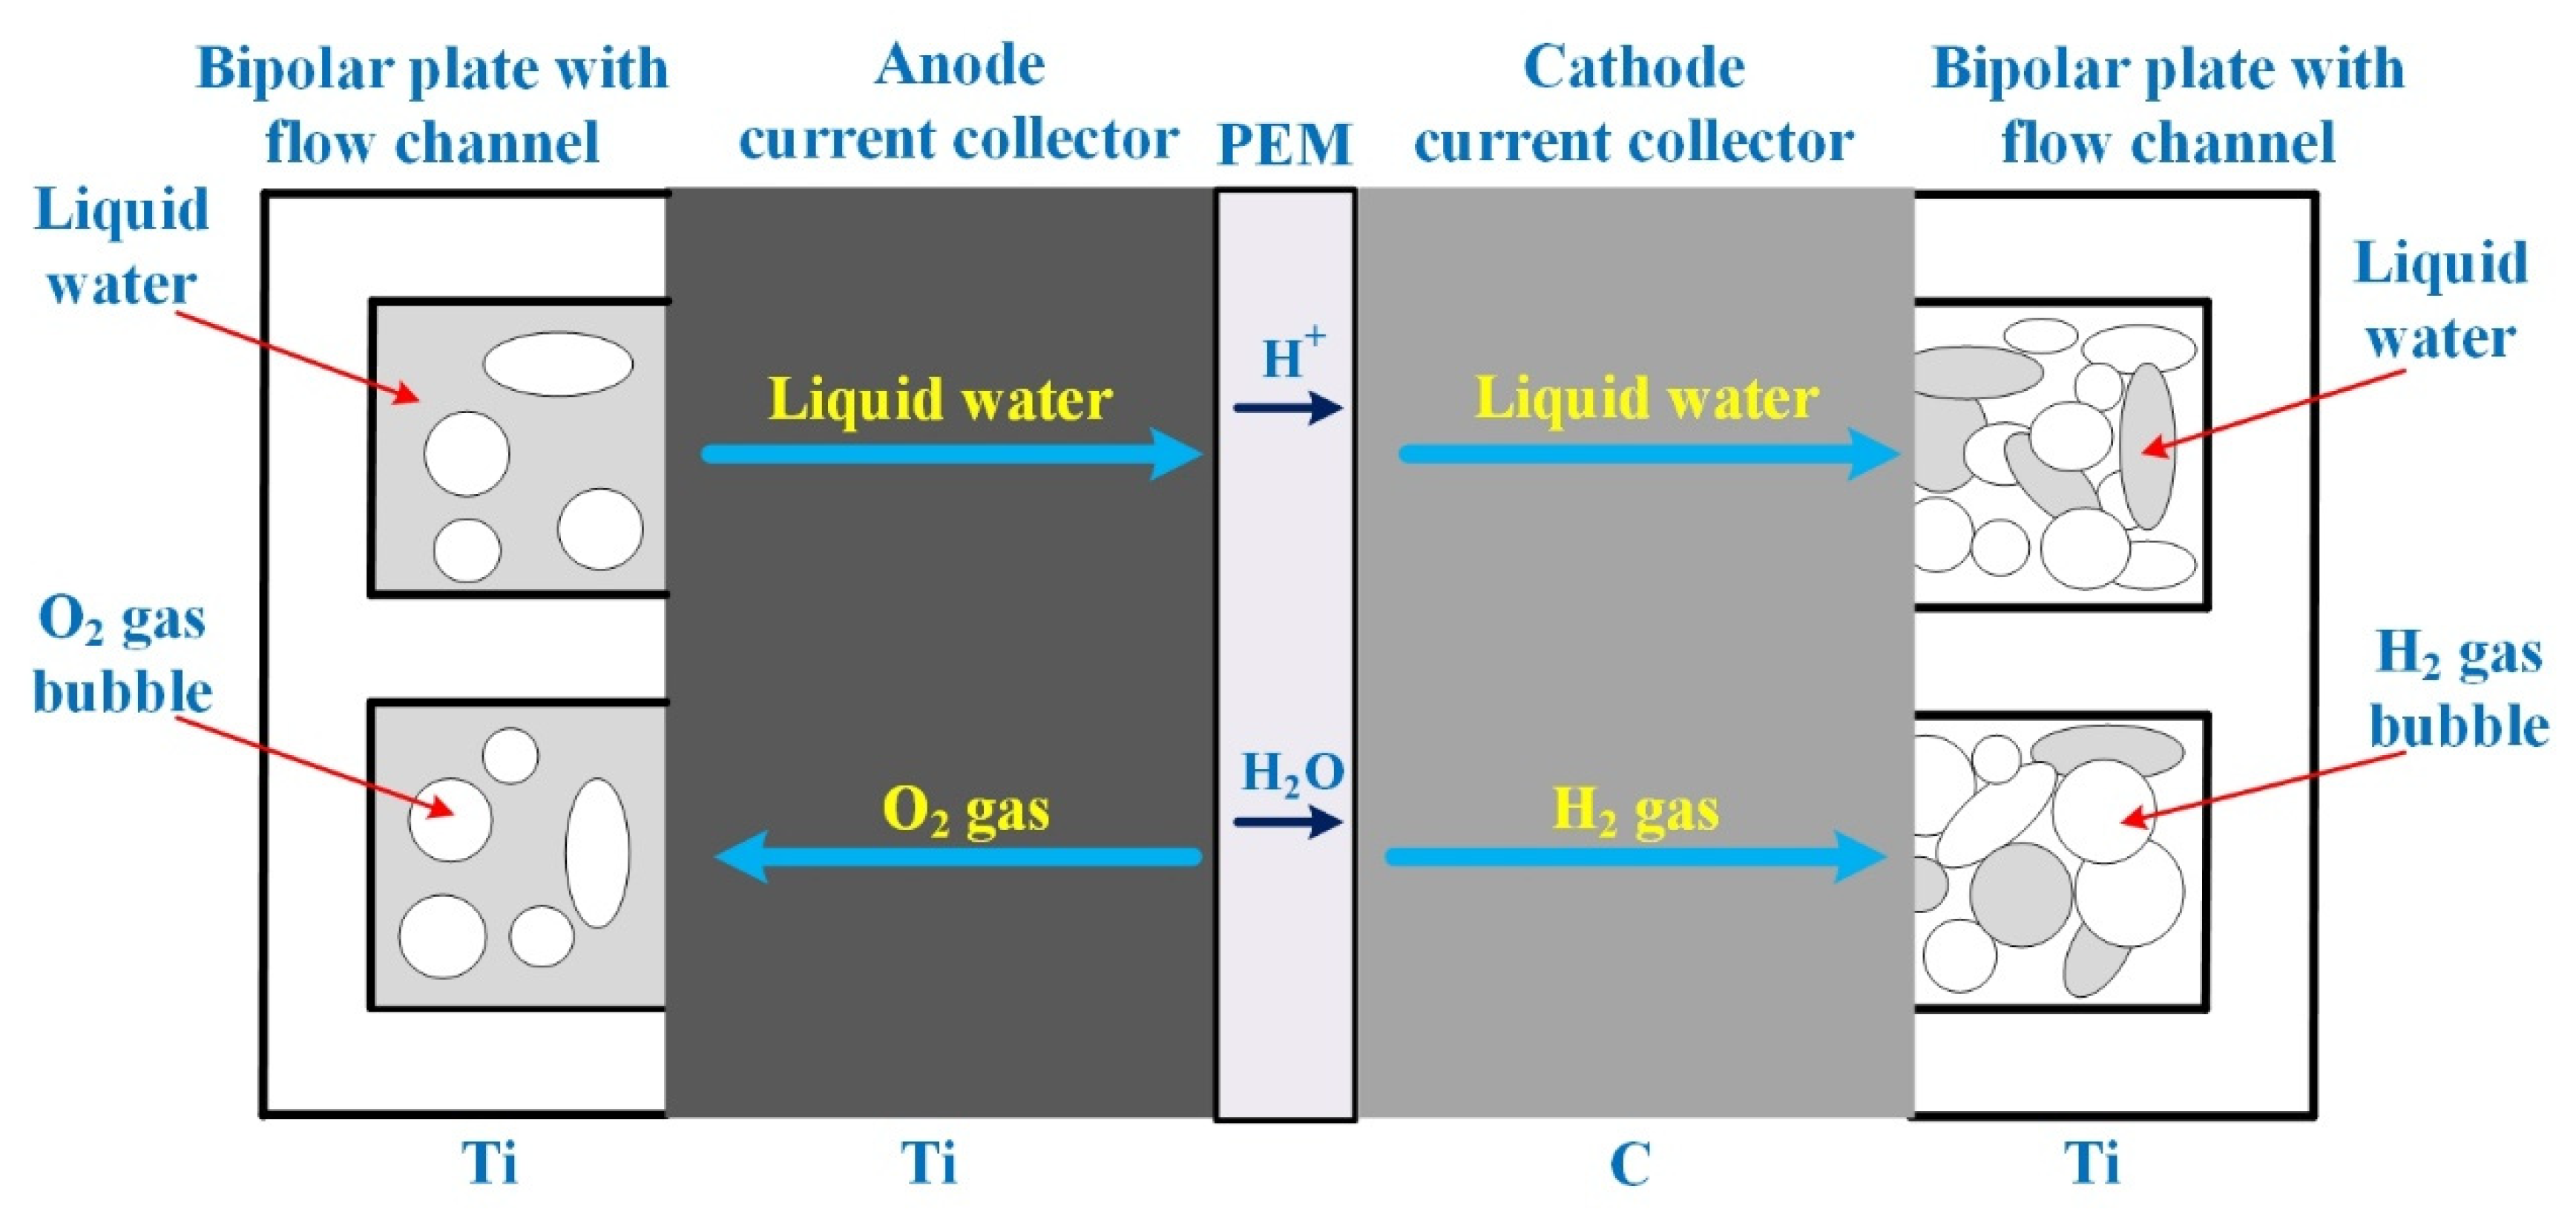
The PEMEL converts the electrical energy directly into chemical energy. The principle of PEMEL is shown in Figure 1. The water is oxidized electrochemically within the anode catalyst layer combine with electricity at the anode side (Wele, including Gibbs energy and energy losses); then water is broken down into oxygen gas, protons, and electrons, and this reaction called oxidation reaction is given by (1). The protons transport across the proton conductive membrane to the cathode side while the electrons move through the outer circuit and also reach the cathode side. The protons and the electrons electrochemically react within the cathode catalyst layer and produce hydrogen gases. This reaction, called reduction reaction, and the overall reaction, called redox reaction, are given by (2) and (3), respectively [3]. It has to be remarked that the redox reaction (3) requires energy to be performed, whereas the reduction (2) is almost spontaneous; it justifies the need to supply the PEMEL and the different dynamics expected by the two reactions.
Oxidation reaction
2 H 2 O + W ele 4 H + + 4 e + O 2
Reduction reaction
4 H + + 4 e 2 H 2
Redox reaction
2 H 2 O 2 H 2 + O 2
In PEMEL, the key components are bipolar plates with flow channels, current collectors, and membrane electrode assembly (MEA) [26]. These components are shown in Figure 2 giving a cross-section of mass transport in a PEMEL. The bipolar plates are mandatory and have crucial functions in PEMEL operation, such as conducting electrons, connecting single cells to realize a stack, arranging a flow path for pure water-sharing over the current collectors, isolating hydrogen and oxygen, supporting the membrane and electrodes, and bringing thermal conduction to handle the PEMEL temperature [26]. To meet these functions, bipolar plates must feature specific properties such as high thermal and electrical conduction, low gas permeability, and high mechanical and corrosion resistance. Generally, bipolar plates based on Titanium (Ti) material are employed since Ti has a high mechanical and corrosion resistance.
In comparison, current collectors are used to move the electrons from the catalyst layer to bipolar plates and to eliminate the gases (i.e., hydrogen, oxygen) from the catalyst layer [26]. It is important to point out that current collectors must operate in the same environment conditions (i.e., acid, high overvoltage) as bipolar plates. Therefore, porosity and electrical conductivity are important requirements in choosing the materials of current collectors. On one hand, in PEM fuel cells, carbon (C) paper or cloth is employed as current collectors (commonly known as gas diffusion layer (GDL)) at both sides of the electrodes. On the other hand, in PEMELs, carbon paper or cloth is not suitable for either the catalyst layer or current collector of the anode side since the anode potential is higher than the cathode potential [26]. This high potential leads to the corrosion of the carbon material during the water electrolysis process. As a result, at the anode side, a material based on Ti is preferred since it features low corrosion even under high anode potential and acid environment. Regarding the cathode side, its potential is smaller than the anode side and close to that for PEM fuel cell operation. Therefore, a material based on carbon is perfectly fit not only for the catalyst layer but also for the current collector.
Finally, MEA (i.e., PEM in Figure 2) is essential to move the protons from the anode to the cathode side and drive the electrons to migrate around a flow path to the cathode. Moreover, the MEA allows the electrical insulation between the anode and cathode while acting as a reactant barrier against gas crossover [27]. Currently, fluoropolymer (PFSA) Nafion membranes from DuPont Company are the most widespread in PEMELs, since they feature high thermal stability and proton conductivity (i.e., 0.1 S.cm−1 at 100 °C) and thin membrane (25–254 µm). The choice of the membrane thickness results in a compromise between the expected operating pressures across the membrane, mechanical resistance, low gas crossover, and ohmic resistance [27]. Different types of Nafion membranes are available in the market, such as NafionTM 211, NafionTM 212, NafionTM 115, NafionTM 117, and NafionTM 1110, depending on their thickness [28]. Based on previous works reported in the literature [27,29], it has been emphasized that very thin membranes allow reducing ohmic losses and operating the membrane at high pressure due to its high mechanical resistance. However, the higher the operating pressure, the higher the equivalent current of hydrogen crossover [30]. As a result, faradaic losses due to the hydrogen and oxygen crossover increase. Faradaic losses related to Faraday’s efficiency are particularly noticeable at low current densities. Since the energy efficiency of the PEMEL is linked to the Faraday’s efficiency, it leads to a decrease of energy efficiency. This important issue has been discussed in [31]. Furthermore, equivalent currents of hydrogen and oxygen crossover are inversely proportional to the membrane thickness [30]. The higher the membrane thickness, the smaller the currents of hydrogen and oxygen crossover. High currents of hydrogen and oxygen crossover may damage the membrane and cause failures of the PEMEL stack [32]. For this reason, membrane thickness and operating pressures are key issues to enhance the performance of the PEMEL [31]. Currently, PFSA Nafion membranes suffer from having a high cost, and their performances are strongly dependent on the relative humidity (RH) and temperature (T), which impede their development at large scale and market penetration [26]. Indeed, these two operating parameters play a key role in drying or flooding the membrane linked to its water content. The membrane must be perfectly hydrated to enhance the move of protons from the anode and cathode and to reduce the gas crossover. To cope with this important issue from the cost and performance point of view, membranes based on hydrocarbon material have much to offer. Indeed, this type of membrane is a promising solution to replace Nafion membranes, since it presents several advantages such as low-cost, fit proton conductivity (>80 mS.cm−1), low gas permeation, and able to operate at low RH (<25%) and large temperature range (from −40 °C to 120 °C) [33].
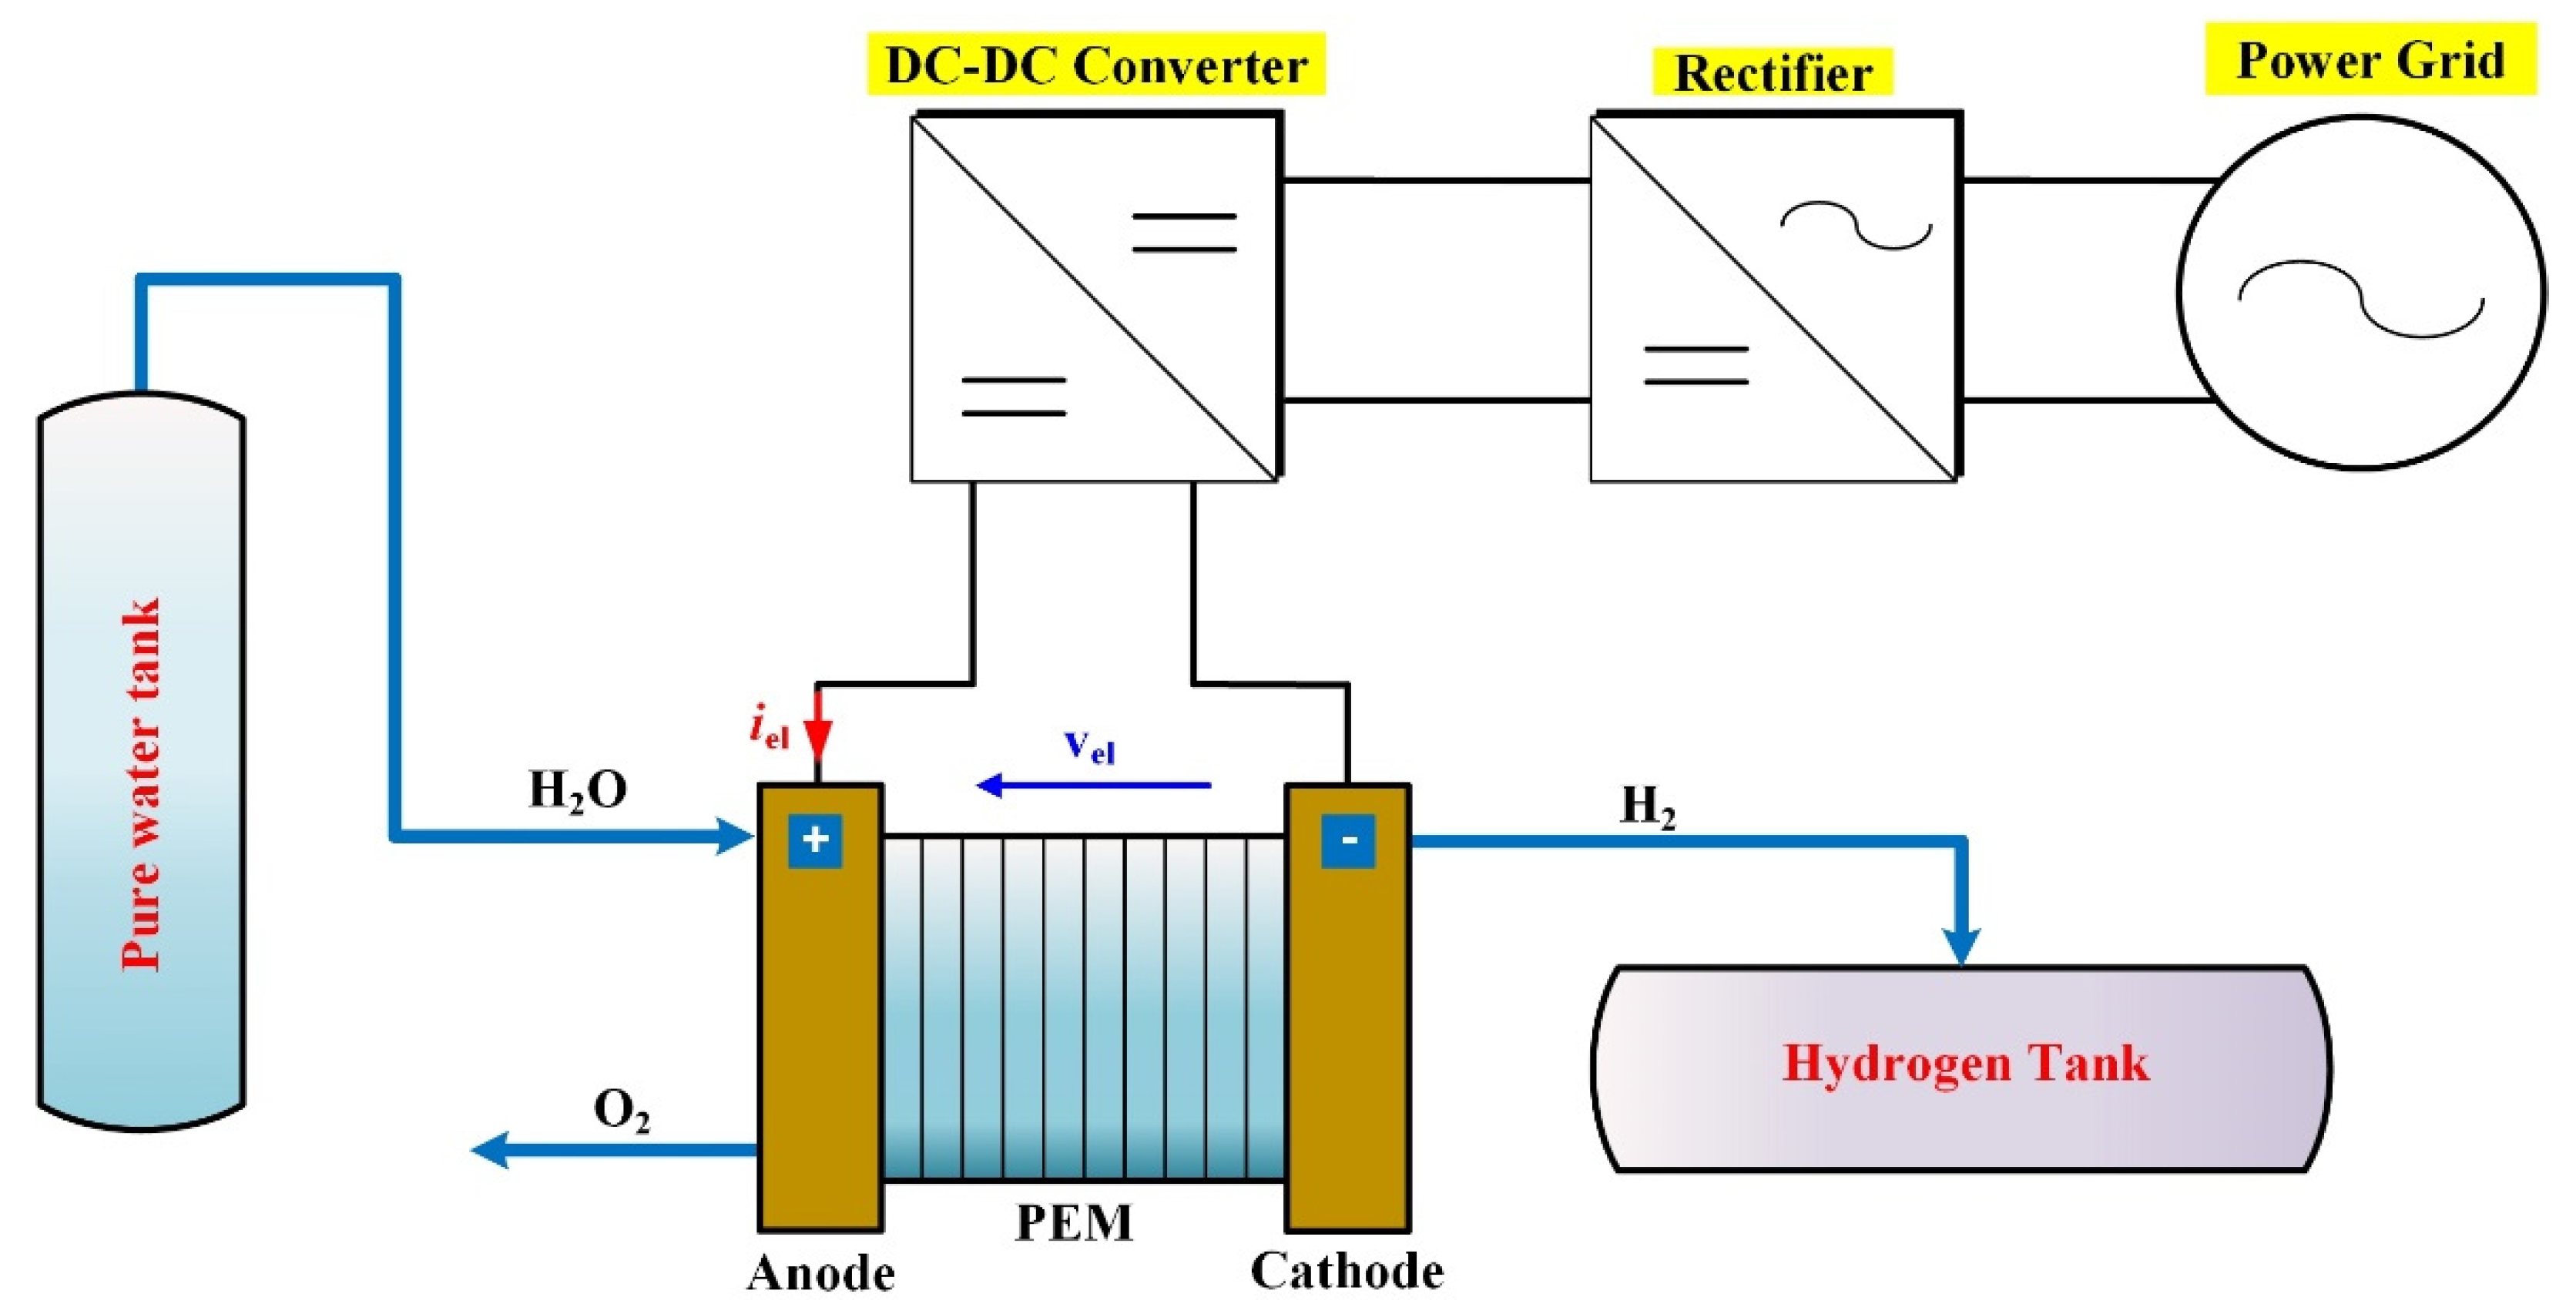
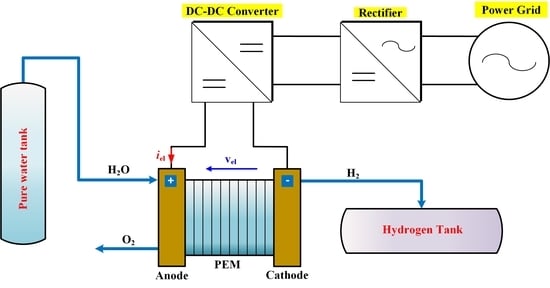
In PEMEL system, the stack is not only the key component. Indeed, PEMEL system includes also several ancillaries such as power conditioning system (i.e., AC–DC and/or DC–DC converter), pure water circulation system (i.e., tanks, circulation pump, and valves), hydrogen processing system (i.e., storage tanks, hydrogen separator, and valves), and cooling system (i.e., cooling pumps, valves) [26]. In Figure 3, a PEMEL system is provided showing only the stack and power electronics part. Given that PEMELs operate at low DC voltages, it is not feasible to directly couple them with the power grid or RES in the hydrogen production system. For this reason, power converters are mandatory to meet the requirements of PEMELs, particularly in terms of low conversion gain. The control of the converters differs depending on the source. For grid-connected applications, the available power significantly overcomes the power required by the electrolyzer; hence, it can be regulated based on the quantity of hydrogen to be produced. Differently, a RES requires that all the available power must be converted into hydrogen. For this reason, the converter needs a maximum power point tracking. Furthermore, to increase the input voltage of PEMELs, multi-stack PEMELs can be used, consisting of connecting several PEMELs in series to meet the requirements (i.e., voltage ratio, hydrogen flow rate, energy efficiency). Finally, power converters slightly decrease the overall efficiency. Since the efficiency of power converters is generally higher than 92–95%, the expected lowering of the whole conversion chain (including the PEMEL), is around 2–6%.

2.2. AC–DC and DC–DC Converters

Power converters can be classified based on the type of RES or bus systems configuration (i.e., DC or AC). From the literature, four types of hydrogen production systems including PEMELs supplied by solar energy, wind energy, DC microgrid system, and the power grid have been reported. In any case, step-down DC–DC converters are needed to supply PEMELs with a low DC voltage (i.e., less than 10 V) [25,34].
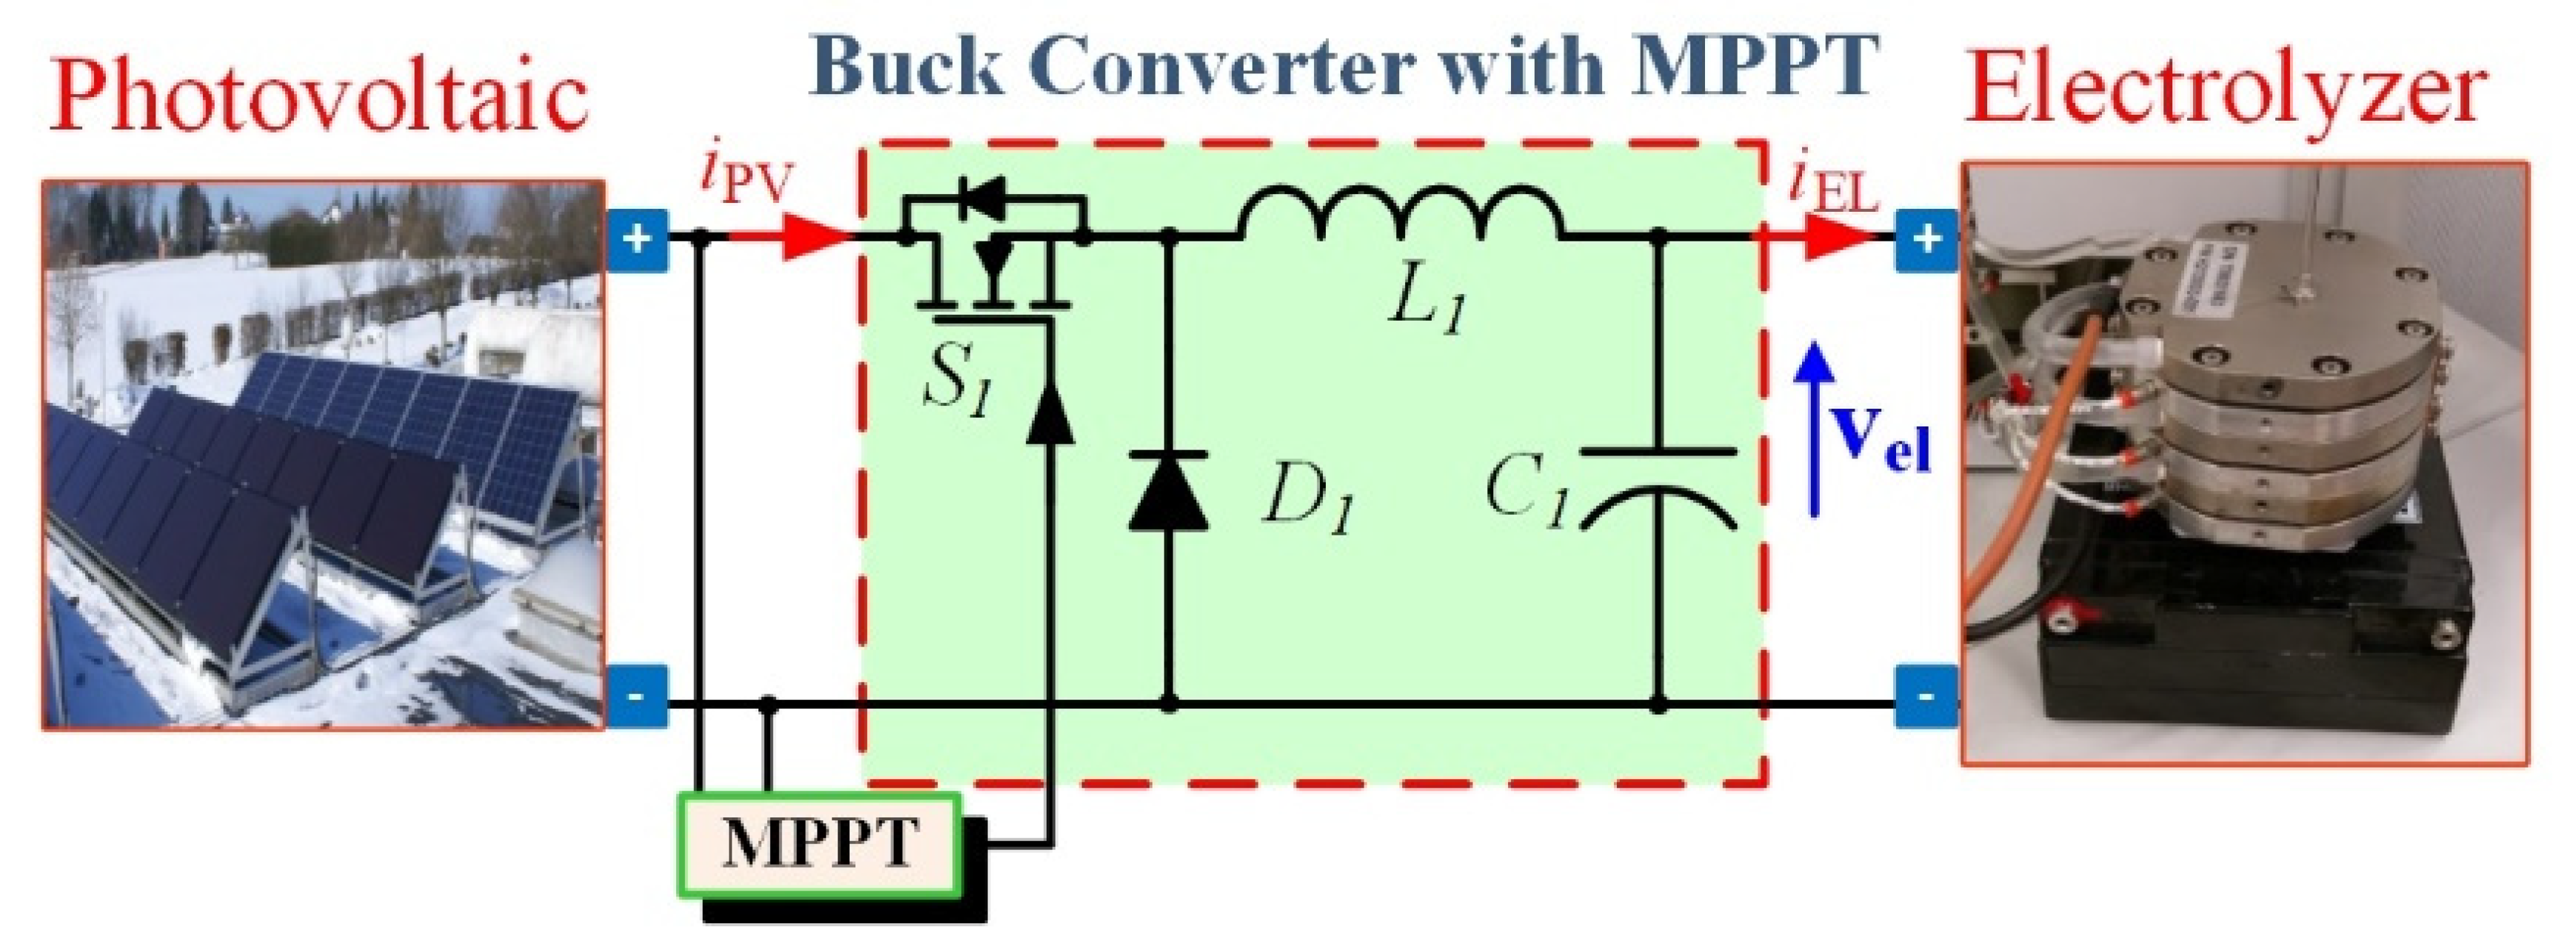
First, the hydrogen production systems supplied by solar energy consist of using photovoltaic (PV) panels, step-down DC–DC converter, and PEMEL. The illustration diagram of this system is presented in Figure 4. The photovoltaic enables harvesting energy from the sun to generate DC voltage and then coupling with the buck (step-down) converter to supply DC current to the PEMEL to produce hydrogen gas. It should be remarked that operating with PV panels, the available power depends on solar irradiance. To maintain a high efficiency of the conversion chain, all this power has to be used to supply the PEMEL. It is guaranteed by the maximum power point (MPPT) algorithm that both controls the step-down converter and supplies the suitable current to the PEMEL.
Second, wind energy systems are composed of the wind turbine, step-down DC–DC converter, and PEMEL. However, wind turbines allow exploiting the kinetic energy of the wind to be transformed into AC voltage at the output of a three-phase generator. The system needs a three-phase rectifier AC–DC converter interfacing the wind turbine, and the buck converter. The schematic diagram of this system is shown in Figure 5. The wind generation system shows a fast dynamic due to gusts. It is partially mitigated by the DC bus capacitor C1, but it must operate with the power transfer to the PEMEL. On one hand, if the available power rises abruptly and it is not transferred to the PEMEL, the voltage of C1 can overcome its rated voltage with risk of damaging. On the other hand, the power flowing through the PEMEL has to be varied without voltage overshoots that could damage the same PEMEL.
The architecture shown in Figure 5 is widely used for permanent magnet synchronous generator (PMSG)-based wind turbines. The simple diode rectifier on the generator side gives a cost-efficient solution since active power flows unidirectionally, and no reactive power is required. Unfortunately, the uncontrolled rectifier might cause low-frequency torque pulsation exciting shaft resonance. The availability of cheap controlled power devices and microprocessor platforms allows conceiving more complicated schemes with better performance. The uncontrolled rectifier can be substituted by a PWM active rectifier, as in Figure 6; it enables full power controllability (four-quadrant operation). The simple structure (available as an integrated power module) is robust and reliable. Besides many turbines where the electrical generator is a squirrel cage induction generator (SCIG), a double-fed induction generator (DFIG) is adopted in this scheme in the back-to-back configuration for grid connection [35,36,37].
In low-power wind turbines with a PMSG, the three-phase high-frequency semicontrolled rectifier, shown in Figure 7, is attractive, since it is simple and robust. Moreover, all active switches are connected to a common point, and a short-circuit through a leg is not possible. A higher distortion of the generator currents results [38].
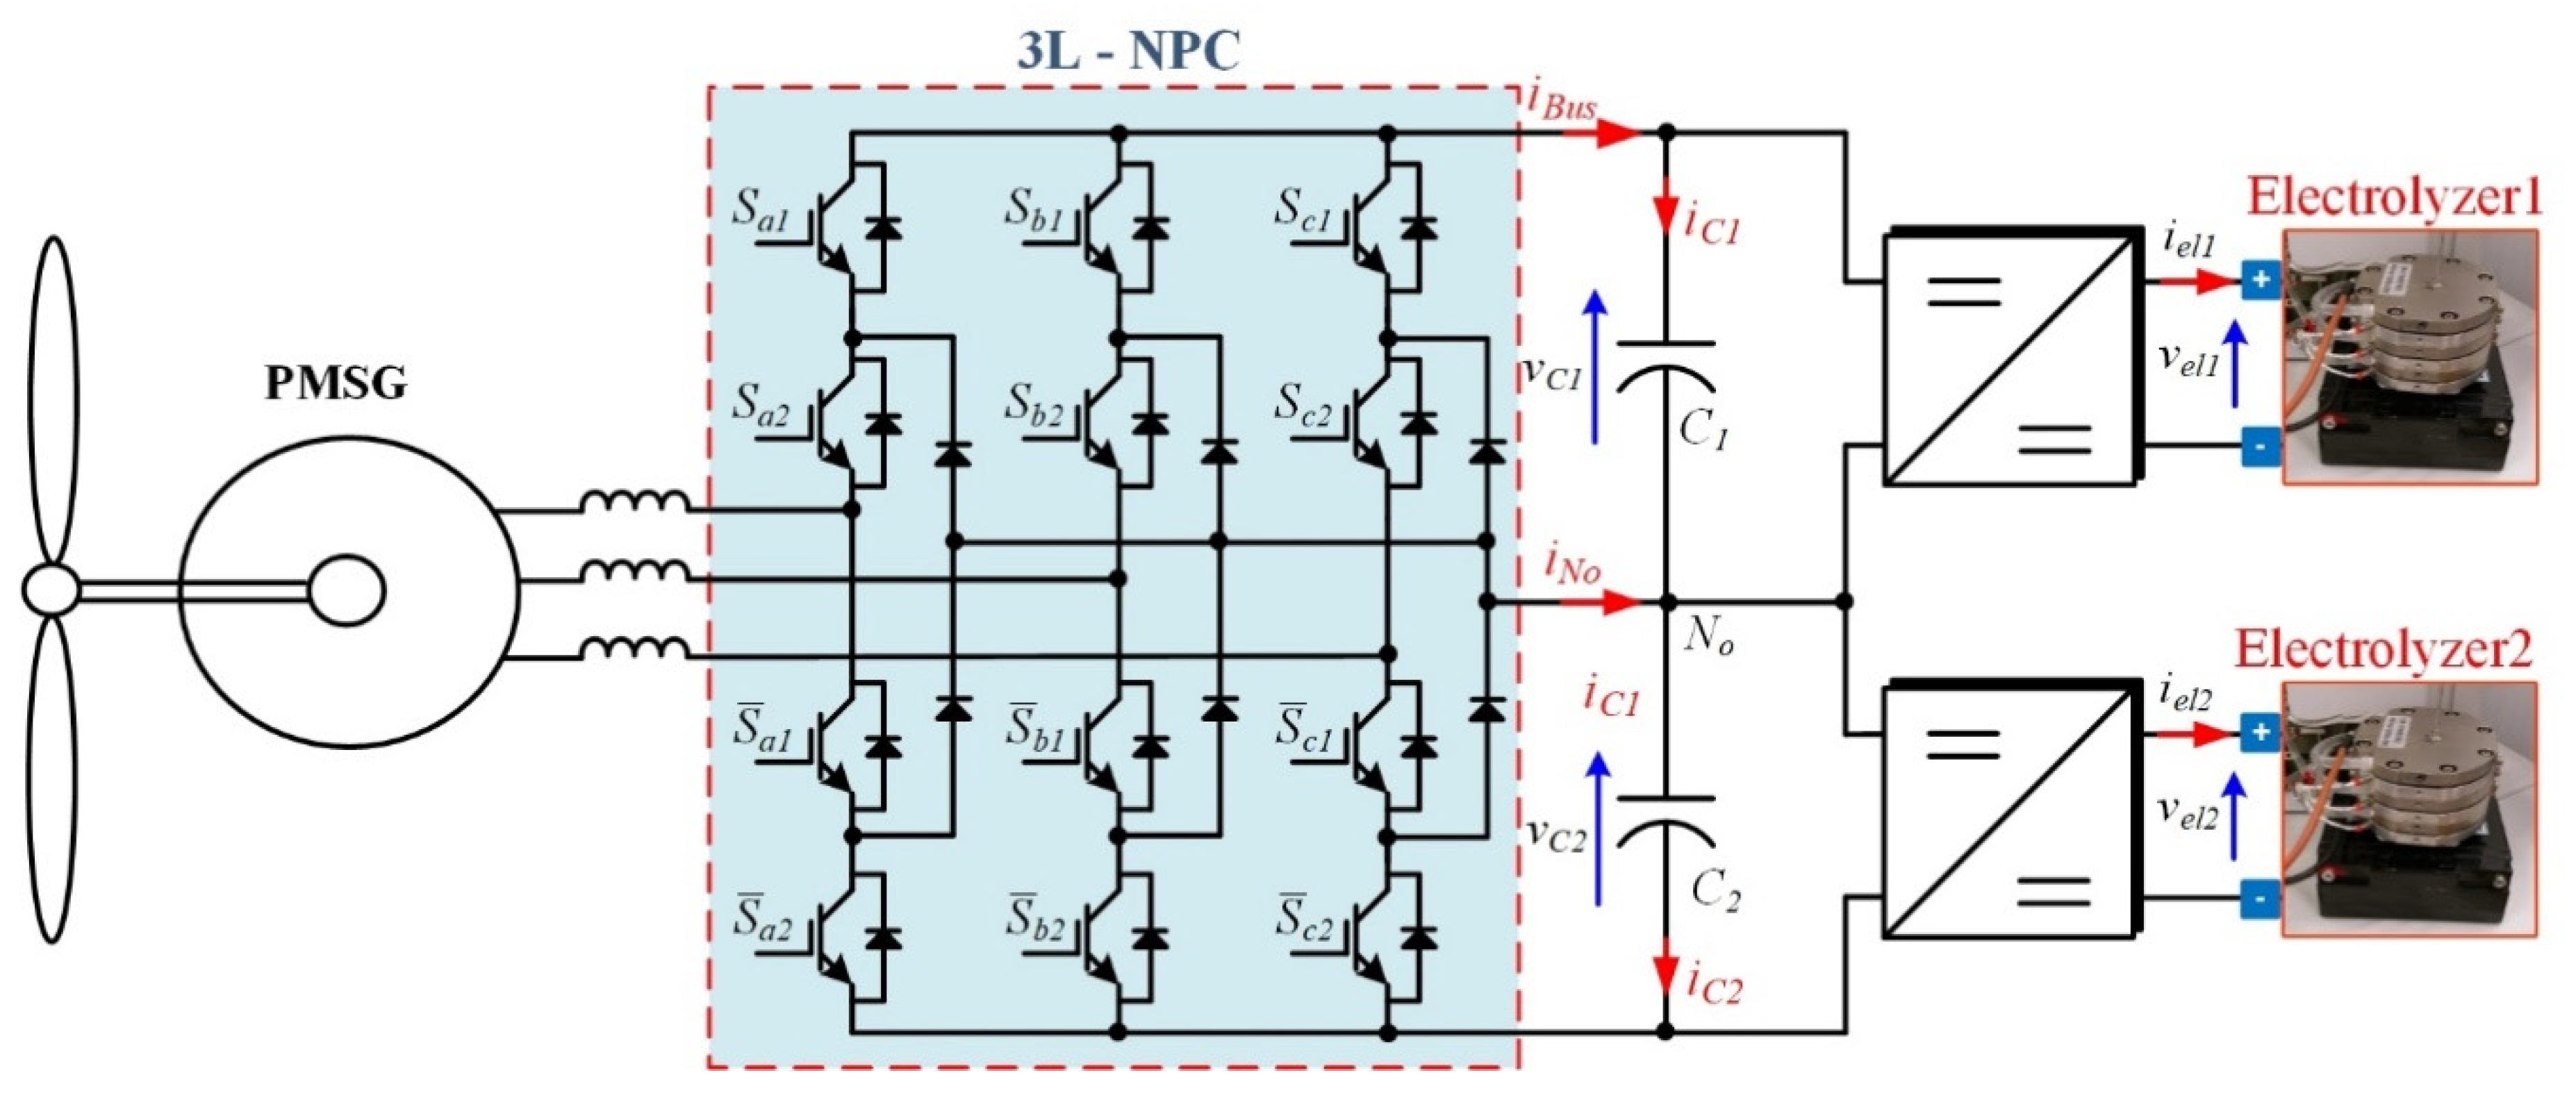
A three-level neutral-point diode clamped front-end topology (3L-NPC) gives two DC outputs that can be connected to two electrolyzers; each DC level has one half of the voltage obtained by the two levels of the active rectifier. It is sketched in Figure 8. The 3L-NPC topology is one of the most commercialized multilevel converters on the market, and it is usually proposed as a back-to-back topology in wind turbines. A potential drawback is the midpoint voltage fluctuation of the DC bus; however, this problem is minimized by the controlling of the redundant switching status [35,36,39].
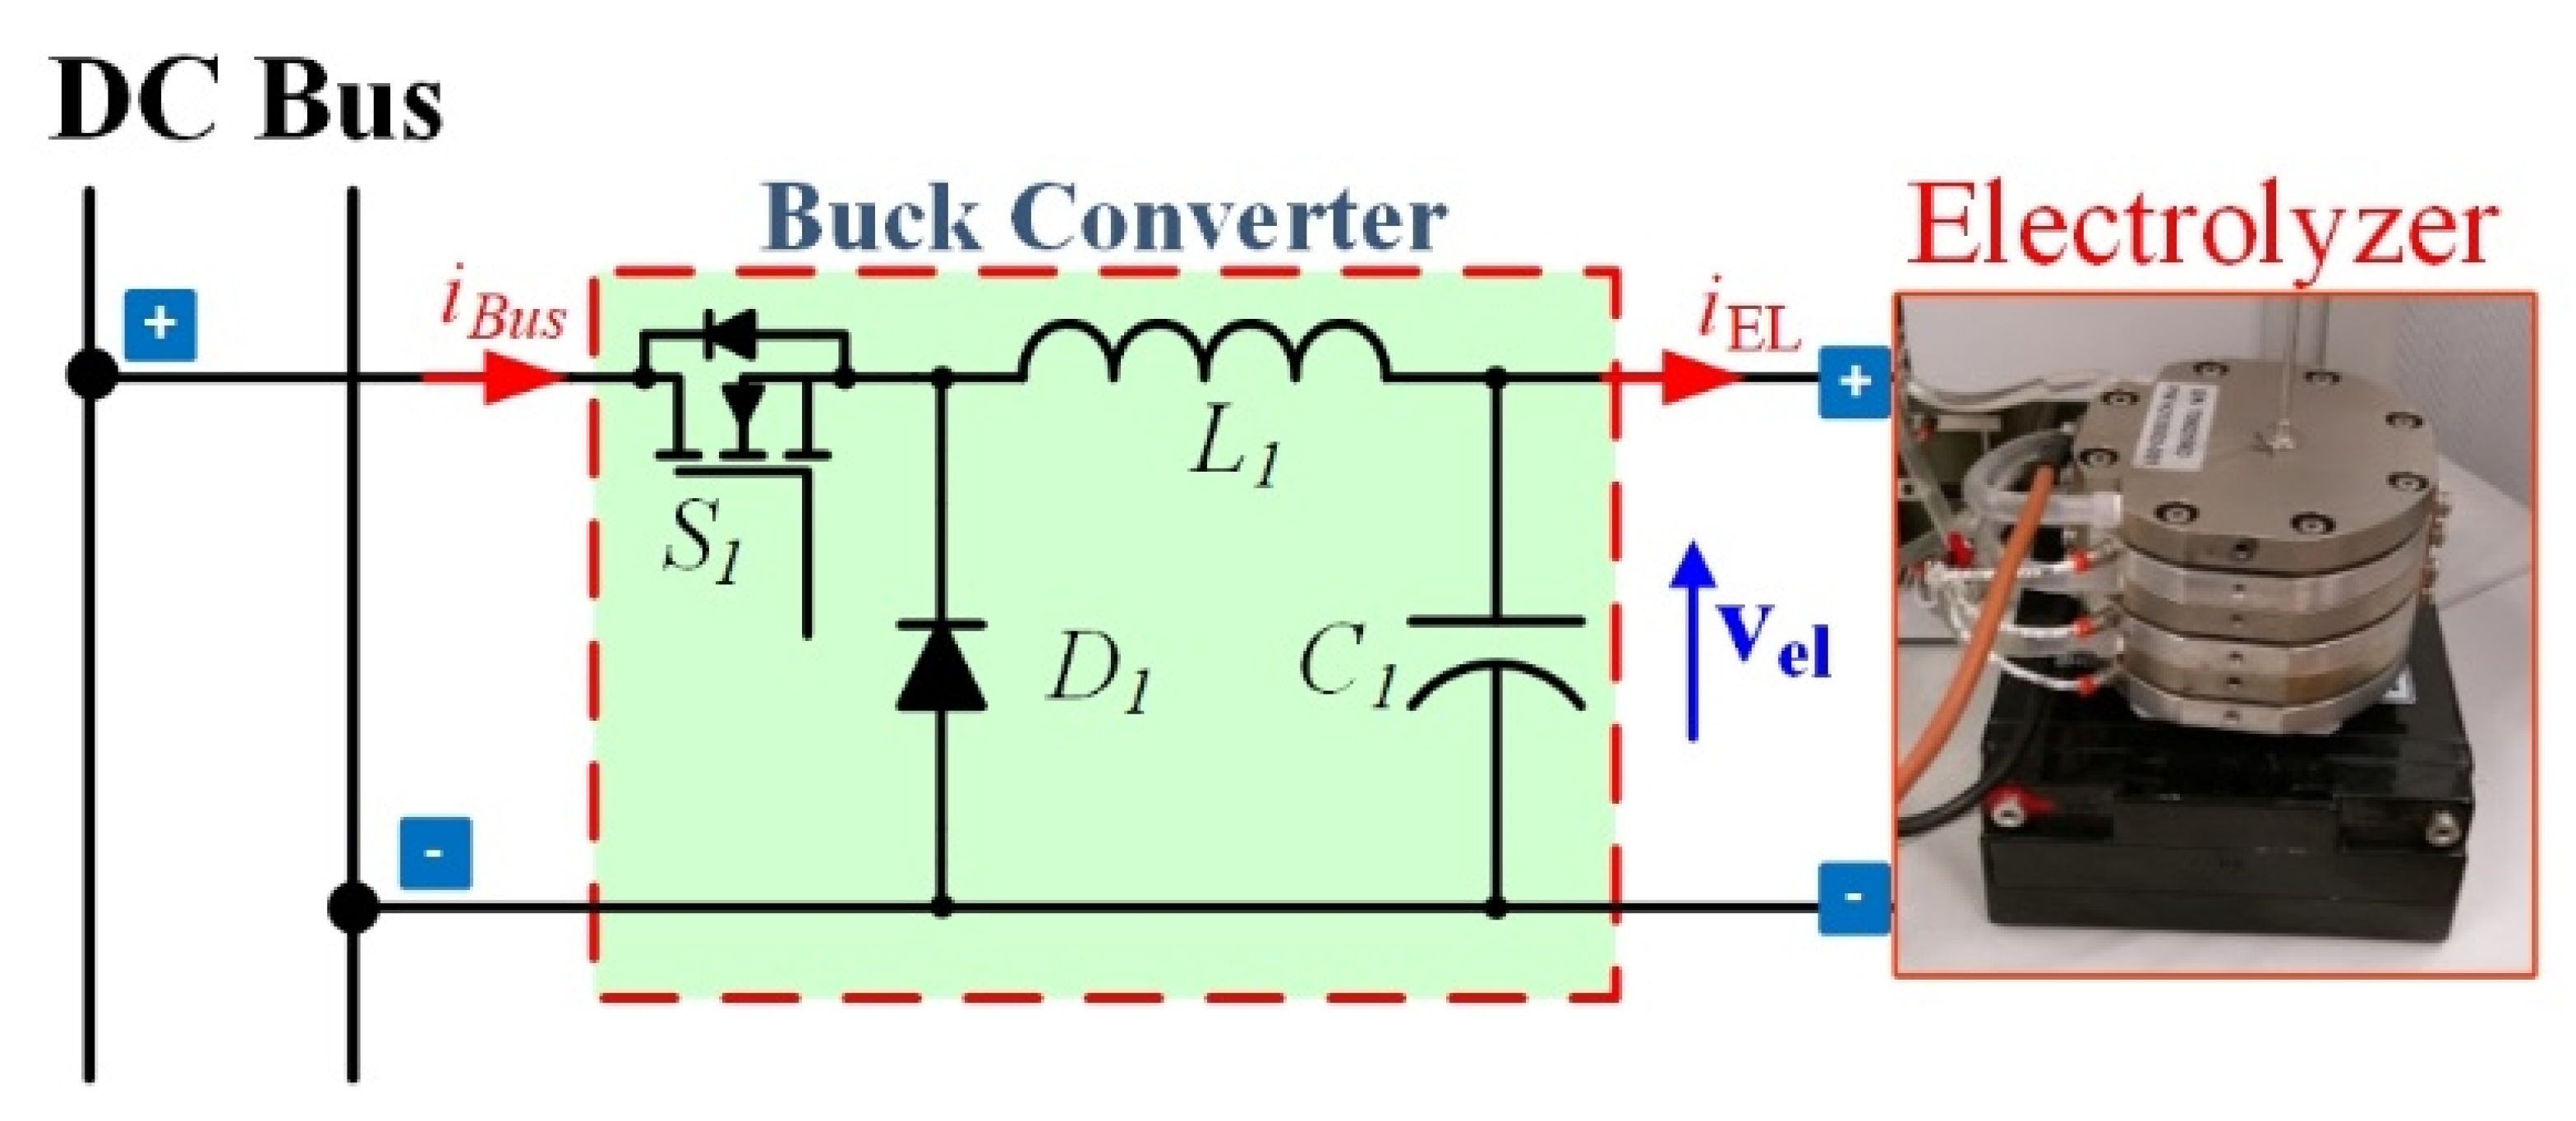
Third, like hydrogen production systems supplied by solar energy, the DC microgrid system is shown in Figure 9 (the input filter is not drawn for the sake of clarity). The input of the buck converter in this system interfaces with the DC bus in DC microgrid and the output coupling with PEMEL [13]. In this case, the dynamic behavior depends on the need to use the hydrogen as storage depending on the constraints of the microgrids.
Finally, the hydrogen production system connected with the utility grid is present in Figure 10. This system consists of a delta-star transformer and an AC–DC rectifier interfacing the grid system and PEMEL. Since the current of the electrolyzer must be controlled, thyristors-based rectifiers are generally preferred for this purpose [8,9,10]. In Figure 10, a 6-pulse thyristor bridge rectifier is shown. Currently, thyristor-based rectifiers are particularly employed for industrial and power-to-gas applications where a high voltage and current are required to supply electrolyzers. In [8,9,10], 6-pulse and 12-pulse thyristors-based rectifiers connected to alkaline electrolyzers have been investigated from the point of view of power quality, gas quality, and output current ripple. It has been demonstrated that the use of a 12-pulse thyristor-based rectifier enables enhancing the power quality and the gas quality while reducing the output current ripple.
The four types of hydrogen production need a suitable controller to control the PEMEL current or voltage to manage its hydrogen flow rate and/or its energy efficiency. Because of the intermittent behavior of solar and wind energy systems, the input voltage of the DC-DC converter may change quickly [23]. As a result, without a suitable and dedicated controller, output hydrogen production and energy efficiency as well can be impacted.
Different control techniques can be applied to control the DC–DC converter for providing a constant current or voltage to PEMEL such as the maximum power point tracking (MPPT) to overcome the intermittent issues in these systems. Besides, the modeling of the PEMEL is important for control purposes, since it might have an impact on the performance of the system [25].

3. Proton Exchange Membrane Electrolyzer Modeling for Control Purpose

The proton exchange membrane electrolyzer modeling is mandatory for control purposes. Indeed, to develop efficient controllers, the PEMEL model has to be coupled with the model of the DC–DC converter. The objective is to get the overall model (i.e., DC–DC converter and the load) under the form of a transfer function or a state–space model. The developed controllers can be used to supply the PEMEL with a constant input energy (to optimize hydrogen flow rate and energy efficiency) or variable input energy to manage the hydrogen flow rate based on requirements (e.g., state-of-charge of hydrogen tanks) [25]. Based on the current literature, three types of modeling have been reported and are investigated in the following section.

3.1. Resistive Model

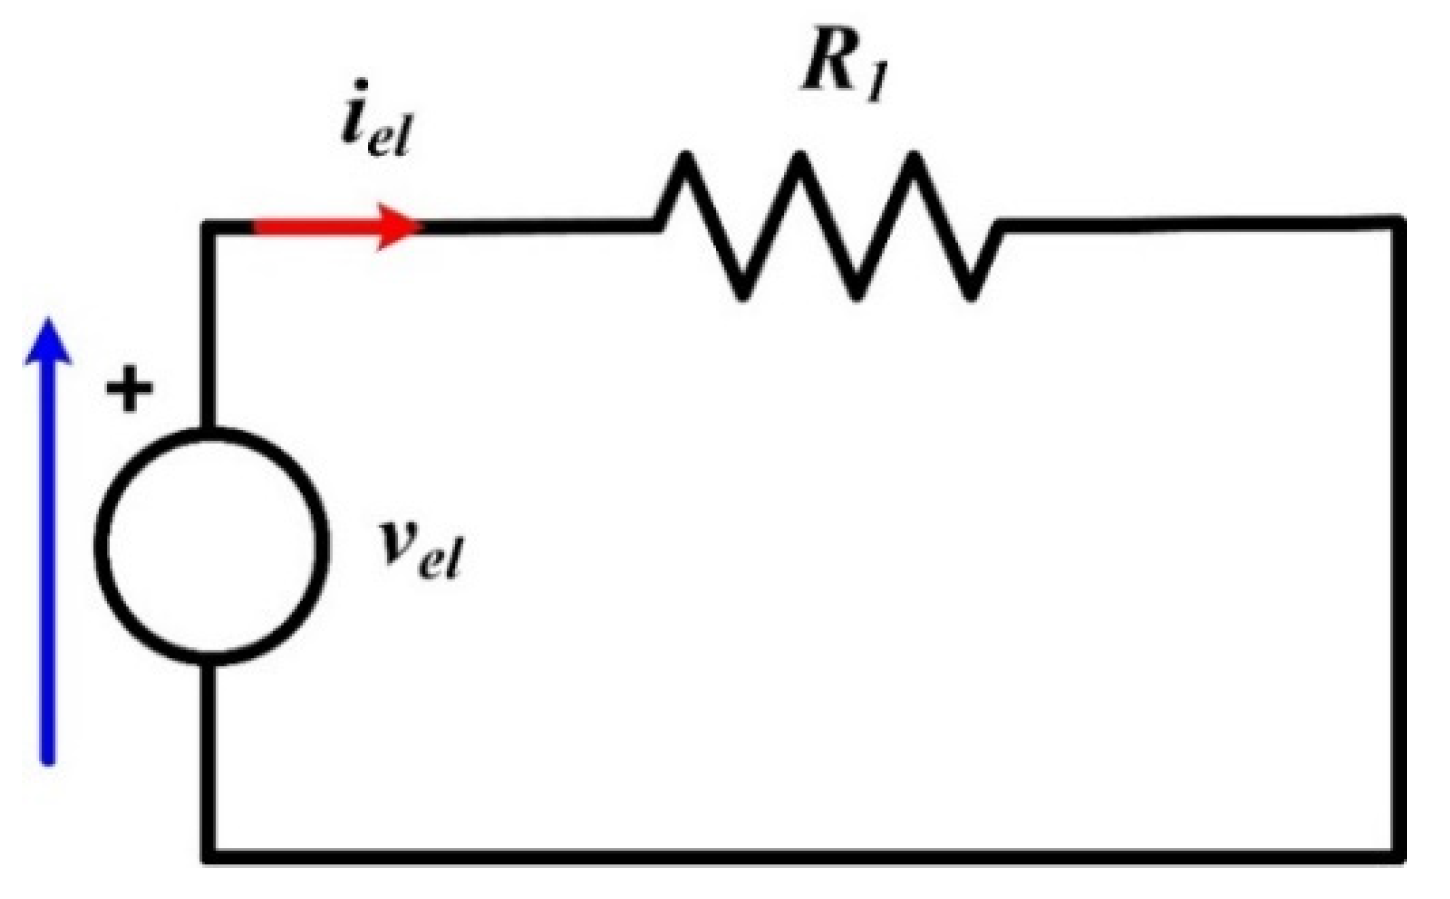
First of all, the PEMEL can be modeled as a resistor as shown in Figure 11. The resistor is the simplest model to represent the electric power transferred to the PEMEL.
This simple model has been used to study the power quality of an alkaline electrolyzer [10] and to develop controllers applied to a synchronous [14] and classic buck converter [17], full-bridge multi resonant converter [18], soft-switching full-bridge converter [15,16], and three-level interleaved buck converter [23]. However, only in [10,23], details are provided to determine the value of the resistive load. In [10], the authors have expressed the equivalent resistance of the electrolyzer based on the static voltage-current characteristic:
R 1 = v e l i e l
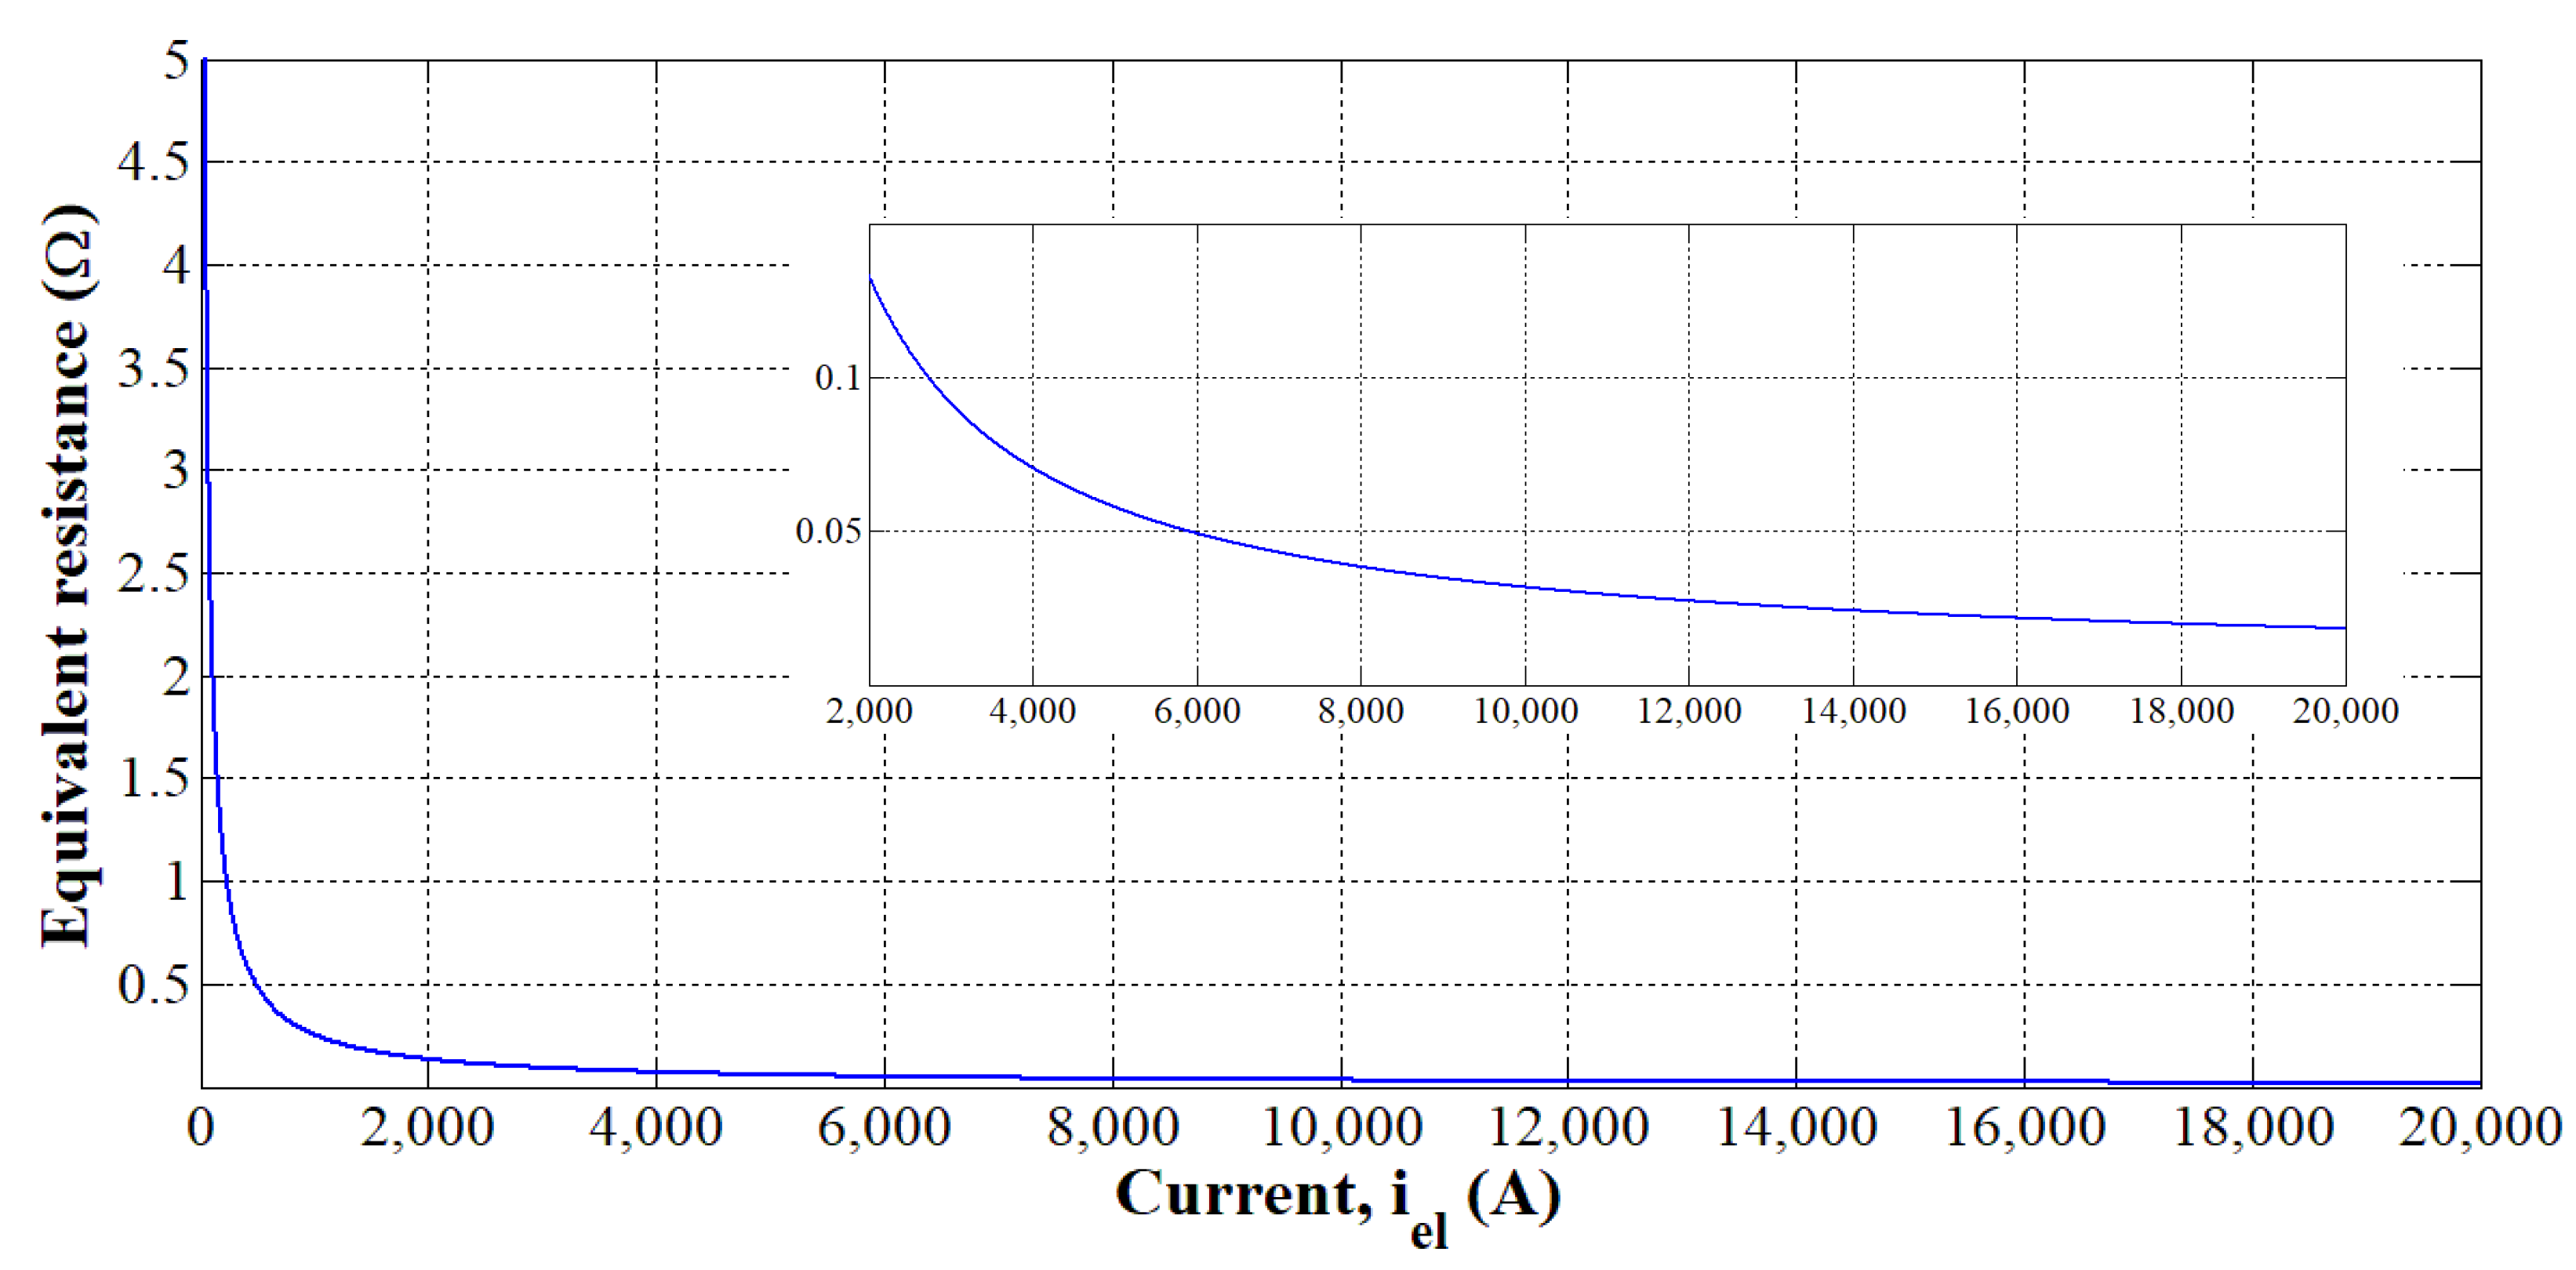
The static voltage-current curve of an alkaline electrolyzer of 3 MW is shown in Figure 12. Based on Equation (4) and Figure 12, the equivalent resistive load according to the current is provided in Figure 13. It has to be noted that the equivalent resistive load decreases according to the current since electrolyzers are high current/low voltage loads as shown in Figure 9. To emphasize better the resistance decrease for a current range included between 2000 and 20,000 A, an additional curve has been inserted in Figure 13.
By comparison, in [23], the authors have expressed the value of the resistive load based on a dynamic electrical circuit model (presented in this section). The value of the resistance is determined as follows:
R 1 = v e l R t o t v e l V i n t
where
- R t o t : sum of the resistances in the equivalent model, taking into account activation losses both at the anode and cathode and ohmic losses. The total resistance value is equal to 0.441 Ω.
- V i n t : reversible voltage of the PEM EL, which is equal to 4.38 V.
- V e l : PEMEL voltage (V), depending on the PEMEL current if the latter is controlled instead of the voltage.
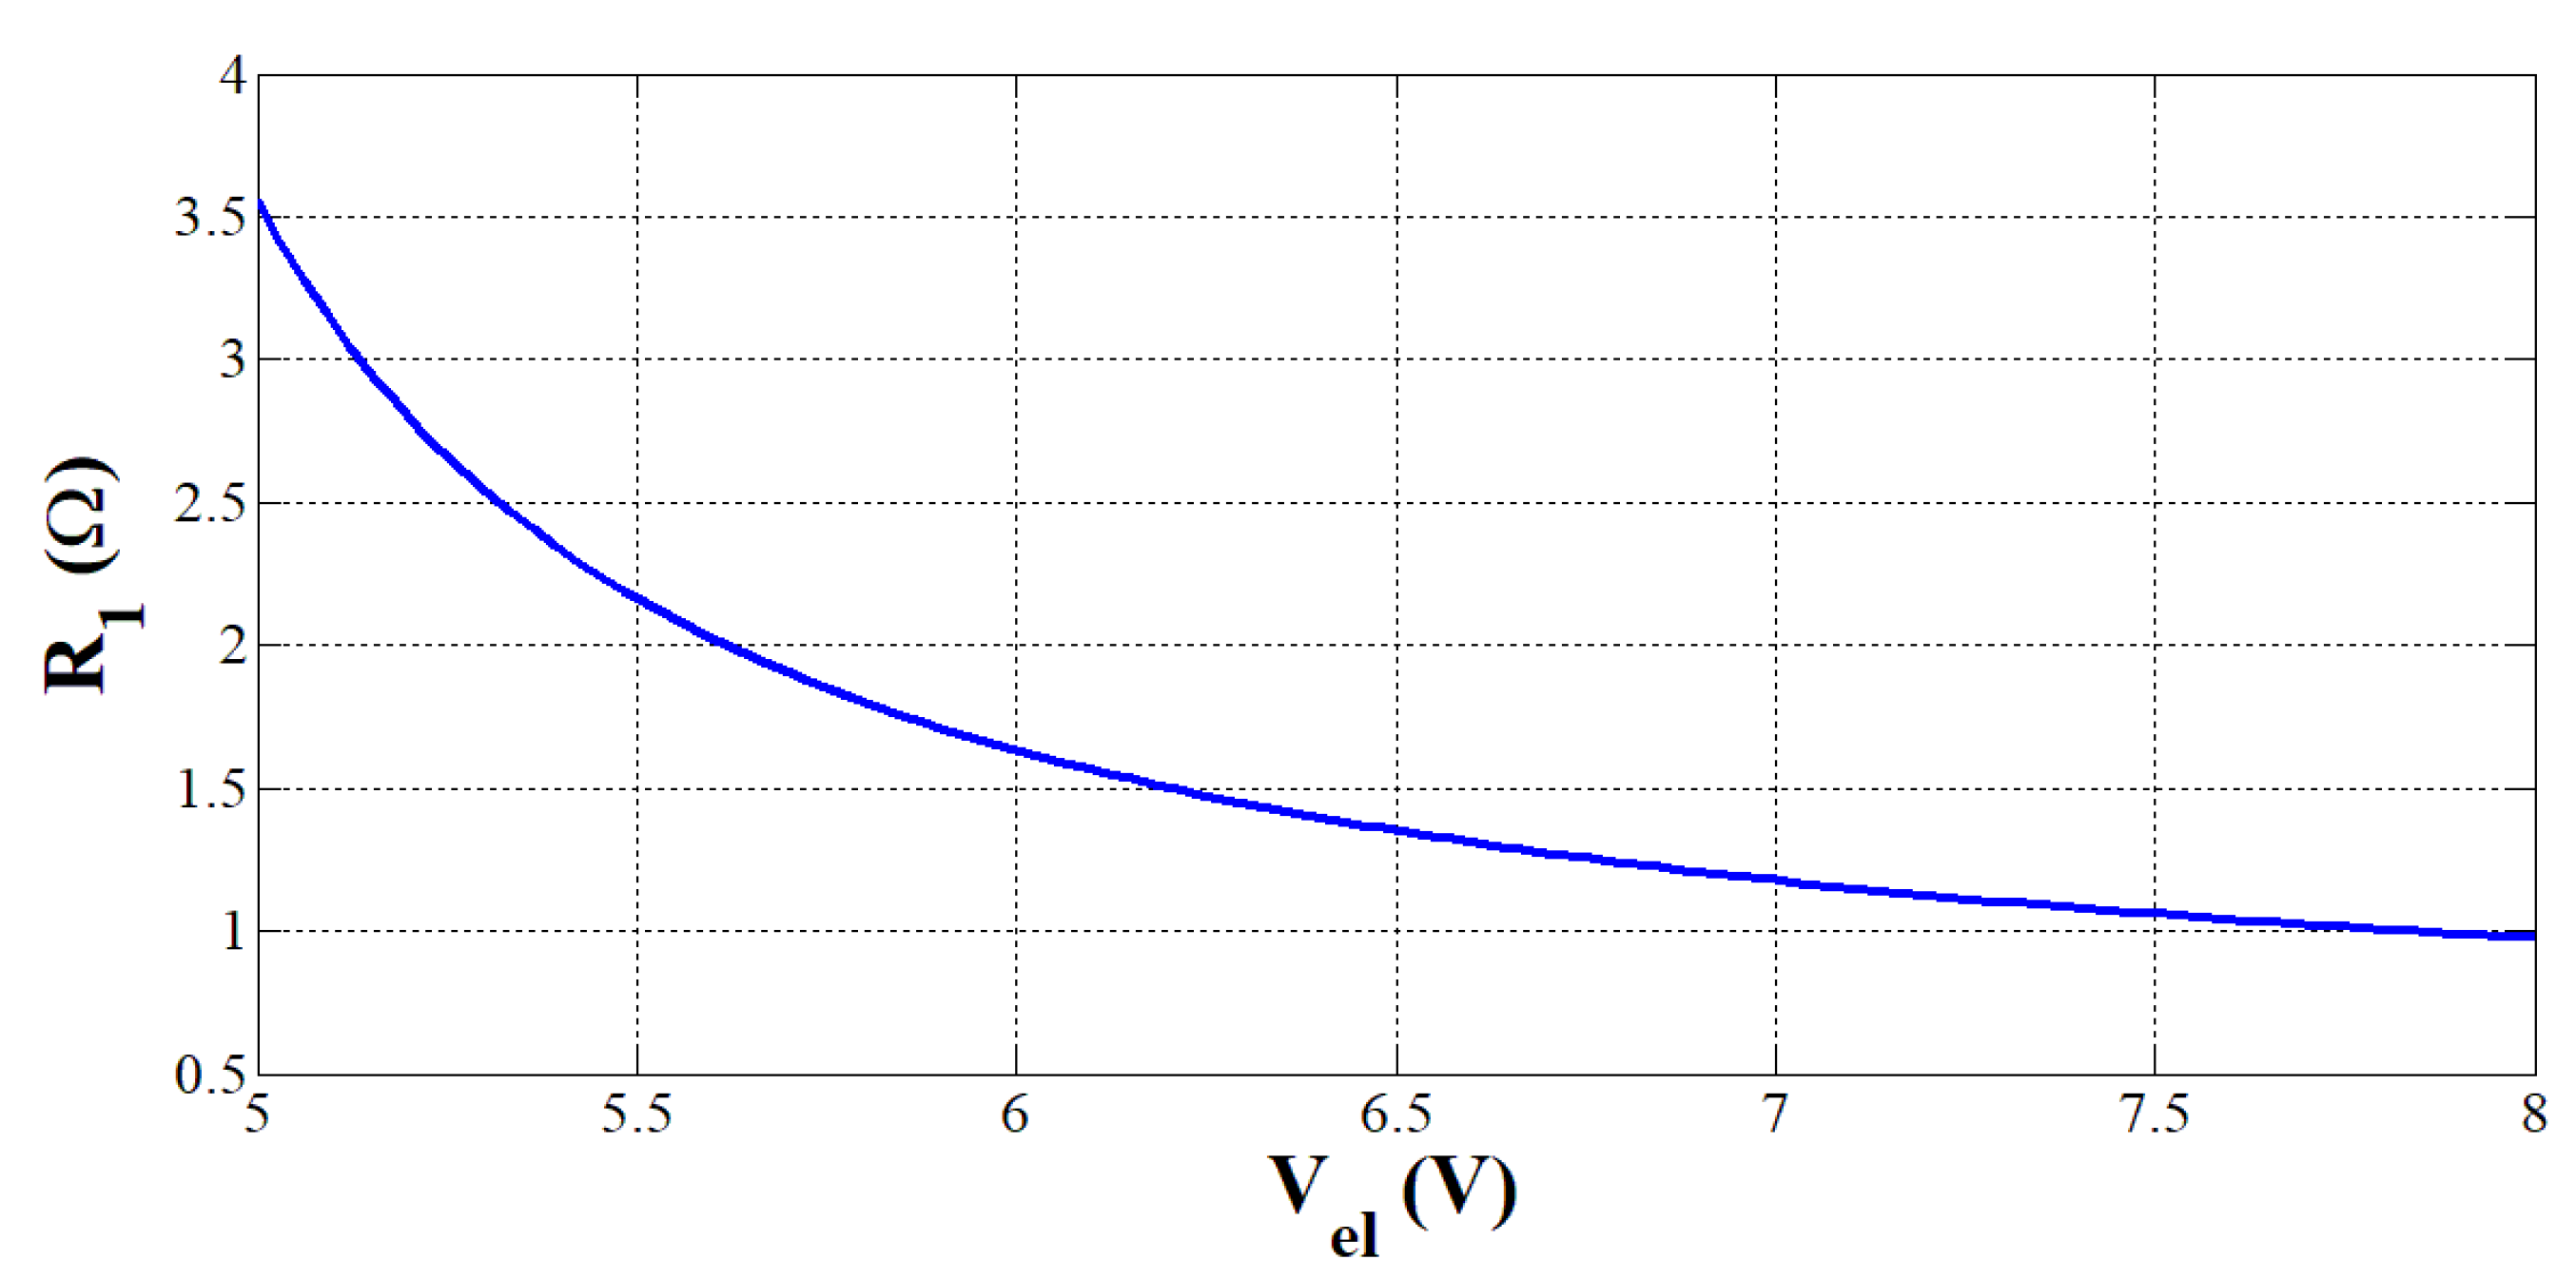
Based on Equation (5), the resistance value has been computed according to the PEMEL voltage range included between 5 and 8 V (rated stack power of 400 W), as shown in Figure 14. The higher the PEMEL voltage, the lower the resistive load. These results are similar to those introduced in [10].
To summarize, based on these two previous works, the calculation of the resistance is based on the static behavior of the PEMEL.

3.2. Static Model

The static model of PEMELs is based on its current-voltage characteristic [19,20,21,22]. The parameters of the I-V characteristic curve are determined by using the measurements of a PEMEL single cell.
An example of an I-V characteristic curve for a PEMEL single cell is shown in Figure 15. This curve has been obtained for the following operating conditions: gas pressures of 1 bar and an ambient temperature of 20 °C. The specifications of the PEMEL used for the experiments are provided in Table 1.
From Figure 15, the PEMEL has a nonlinear behavior. It can be modeled by using either a linear or a nonlinear model. First of all, a simple static modeling approach can be developed based on the following expression [20]:
y = Δ y Δ x x + c v e l = Δ v e l Δ i e l i e l + 1.545 = 2.407 1.545 50 0 i e l + 1.545 v e l = 0.0172 i e l + 1.545 R 1 i e l + V i n t
where:
- R 1 is an equivalent resistance [Ω].
- V i n t is a reversible voltage [V].
The reversible voltage Vint (electrochemical) is important for electrolysis process and hydrogen production, and can be calculated as follows [3]:
V int = Δ G zF = 1.233   V
where:
- Δ G is the Gibbs energy (238 kJ.mol−1 for T = 20 °C) allowing splitting the deionized water into hydrogen and oxygen.
If the water is liquid, Δ G can be determined according to the temperature (°C):
Δ G = 285 , 840 163.2 ( 273 + T )   [ J . mol 1 ]
-z is the number of electrons exchanged during the reaction. For H2, z = 2.
-F is the Faraday’s constant (96 485 C . mol 1 ).
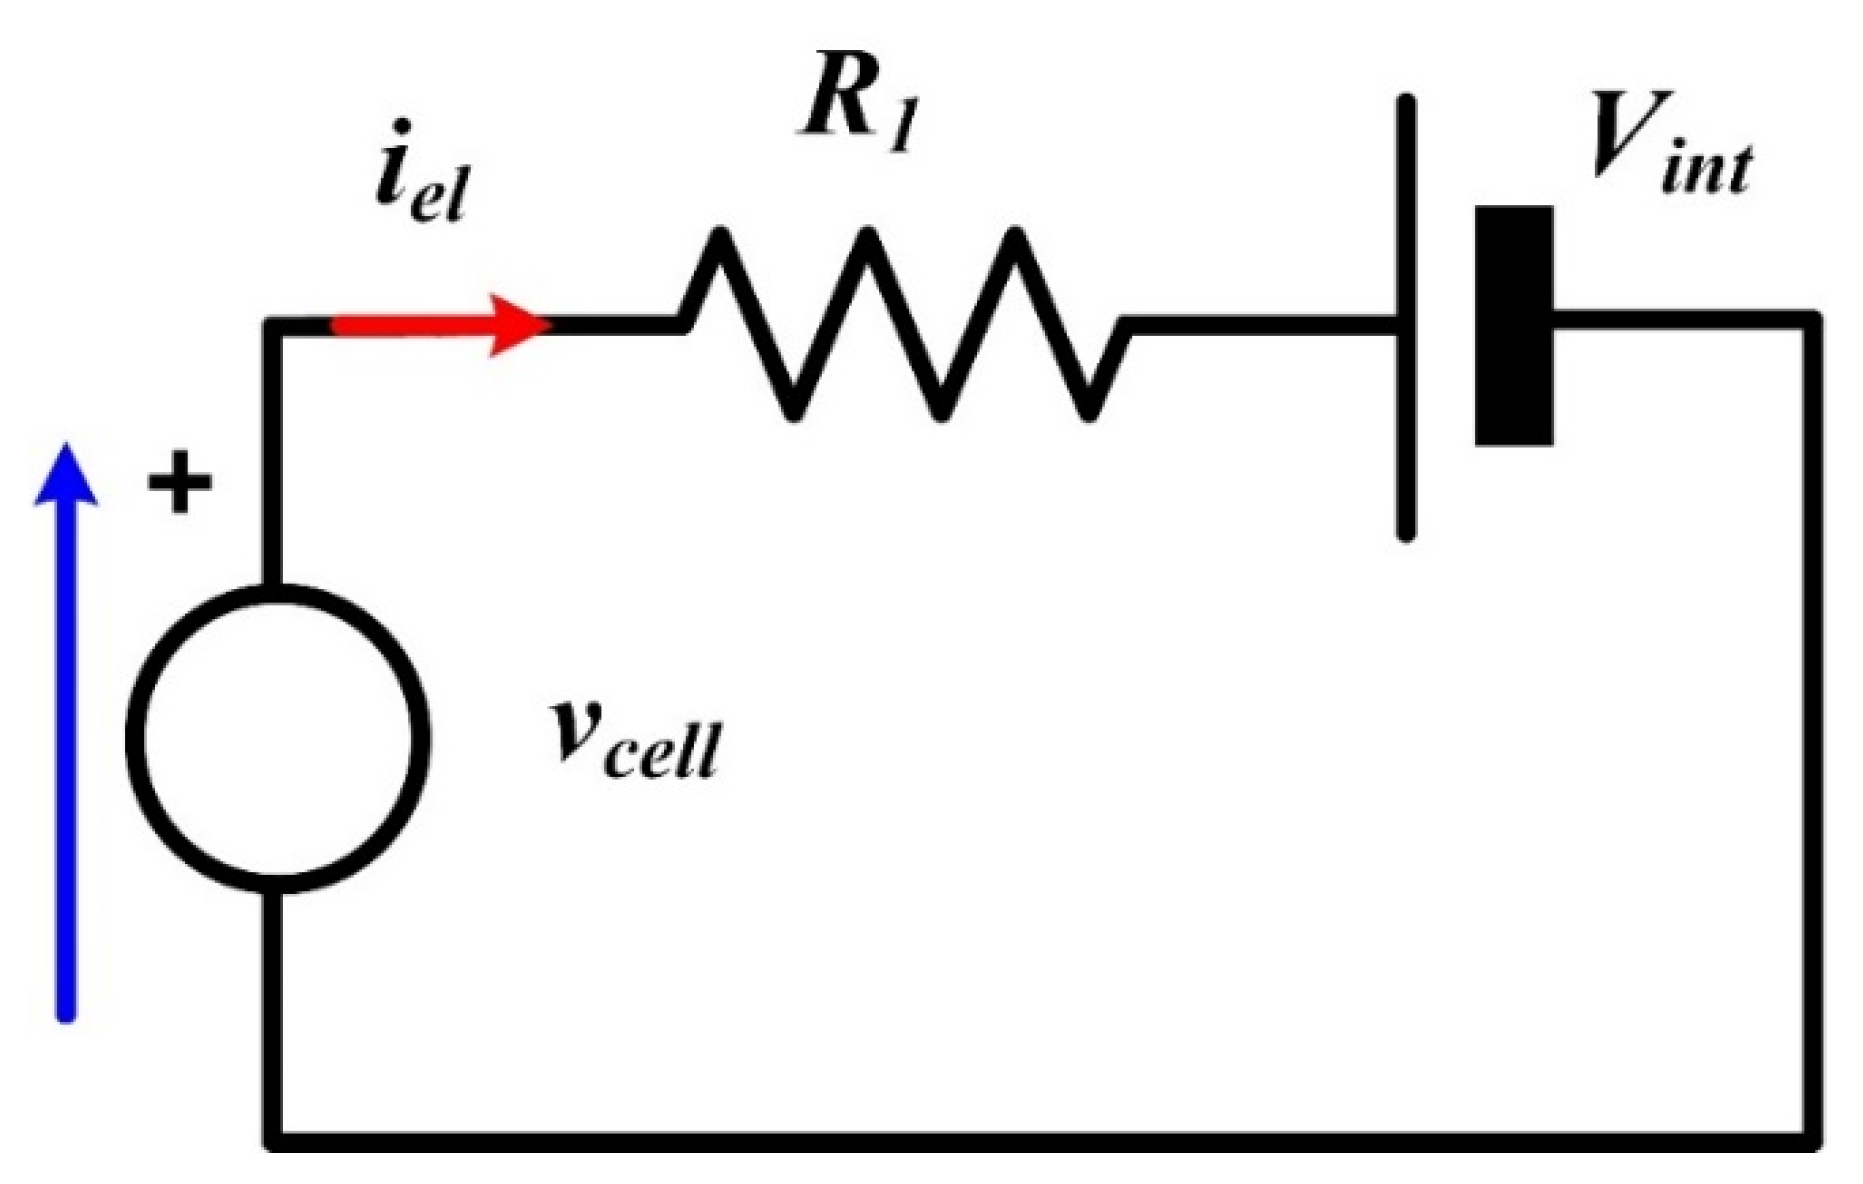
From Equation (6), an equivalent static electrical circuit for a single PEMEL cell can be deduced as shown in Figure 16. It is composed of an electromotive force representing the reversible voltage (Vint) in series-connected with an equivalent resistance (R1) [21].
The electrical power Pcell for a single cell is given by:
P c e l l = v c e l l i e l = i e l 2 R 1 + i e l V i n t
Hence, the total electrical power (Pel) is obtained by multiplying the power (Pcell) by the number of cells (N):
P e l = N v c e l l i e l
From Figure 16, the energy efficiency of the PEMEL is expressed as the ratio between the electrochemical hydrogen energy (PH2) and electrical power (Pel) as follows:
η e l = P H 2 P e l = i e l v i n t v c e l l i e l = V i n t v c e l l
From Equation (11), the higher the cell voltage, the lower the energy efficiency.
Besides, the cell voltage efficiency is defined as the ratio between the thermoneutral cell voltage VTN (given in Equation (13)) and the cell voltage, vcell [3]:
η v c e l l = V T N v c e l l
V T N = Δ H z F
where
- Δ H is the change of enthalpy (285.84 kJ. mol−1).
Finally, the static model of the PEMEL can be modeled by an empirical current-voltage expression. The different parameter values can be found also by using a least-squares regression algorithm. The I–V relationship of the PEMEL is written as follows [41]:
v e l = V i n t + r i e l + s l o g ( t i e l + 1 )
where
- r is the ohmic resistance of electrolyte (Ω).
- s , t are the coefficients for overvoltage on electrodes
It is well known that the overvoltages appearing in Equation (14) are dependent on the temperature. Therefore, the previous equation can be modified to take into consideration the effects of the temperature on the electrode and electrolyte overvoltage. The temperature-dependent I–V model can be expressed as follows [41]:
v e l = V i n t + r 1 + r 2 T i e l + ( s 1 + s 2 T + s 3 T 2 ) l o g ( t 1 + t 2 / T + t 3 / T 2 i e l + 1 )
- r i is the parameters for ohmic resistance of electrolyte (i = 1...2).
- s i , t i are the parameters for overvoltage on electrodes (i = 1...3).
- T is the temperature of electrolyte (°C).
The parameters r i , s i ,   t i are provided in [41].

3.3. Dynamic Model

The previously presented models are static and do not take into consideration the dynamics of the PEMEL in case of operating conditions change. These dynamics can be investigated in performing experimental tests by supplying the PEMEL with dynamic current profiles [24]. The realized experimental test bench to analyze the dynamic behavior of PEMELs is shown in Figure 17.
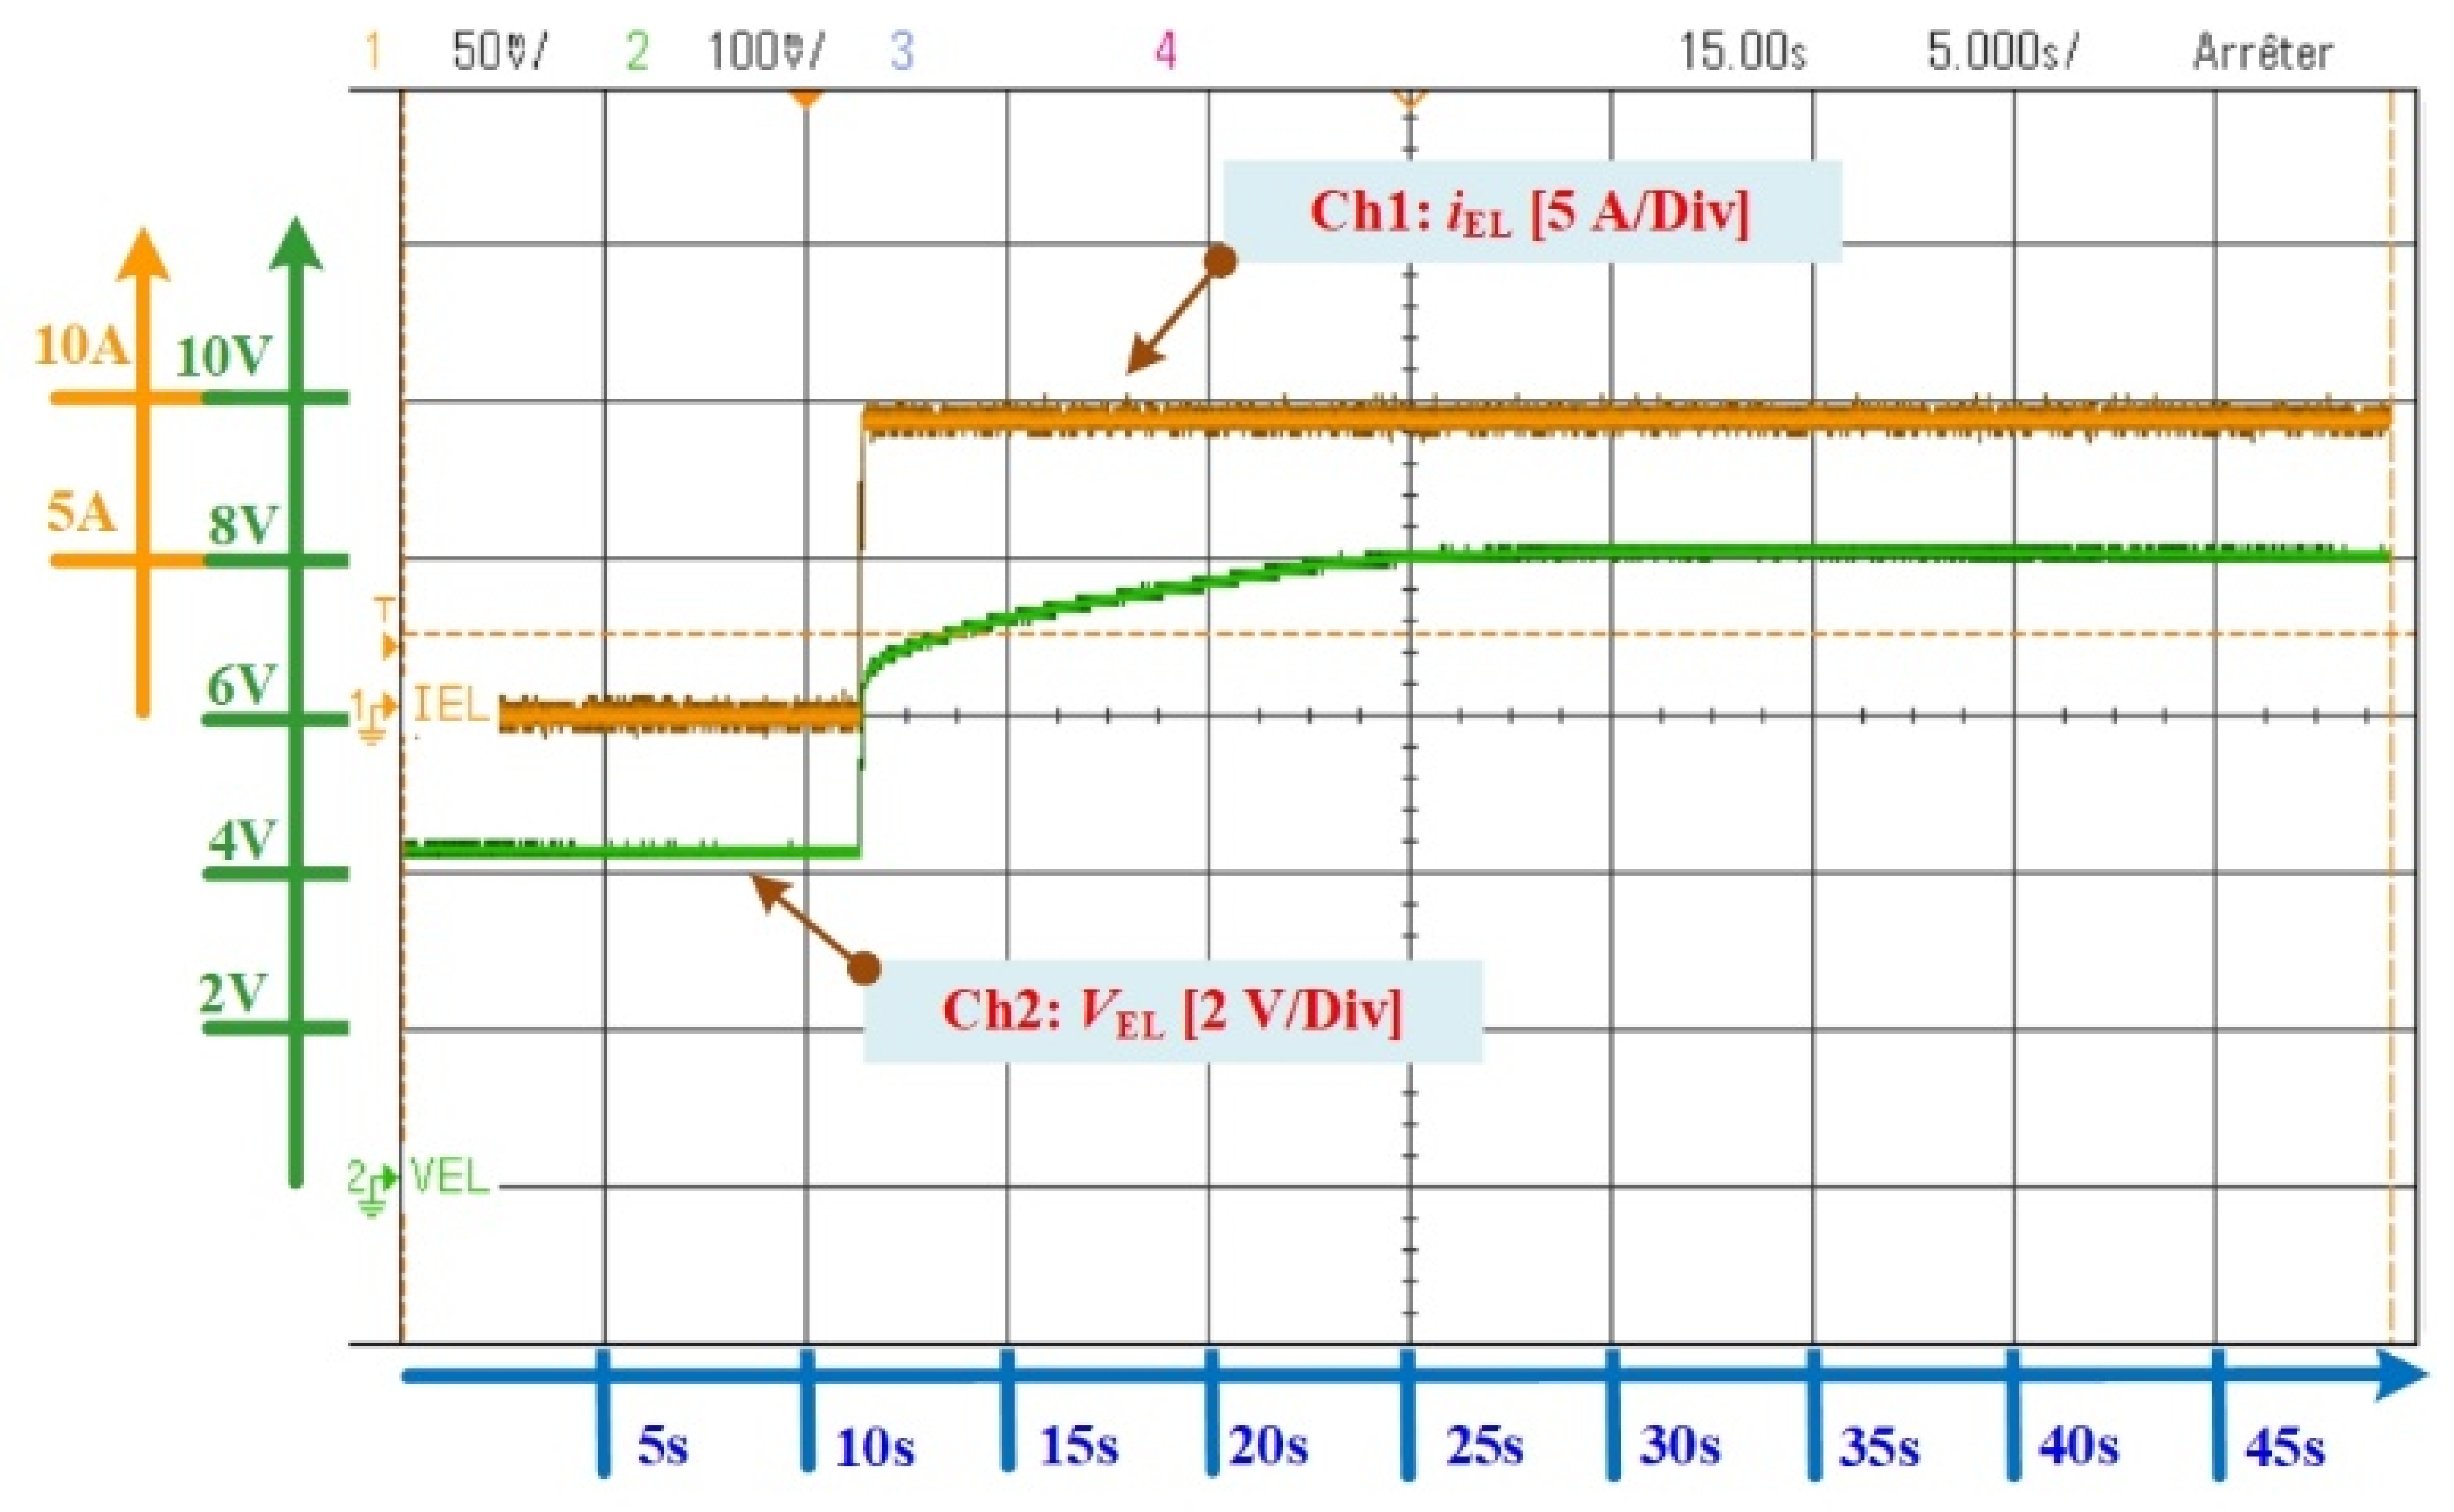
The DC power supply is controlled by using a virtual control panel with a laptop. The specifications of the used PEMEL are reported in Table 1. A test has been carried out with a DC current (from 0 to 10 A) to supply the PEMEL. The PEMEL stack response is provided in Figure 18. A high time scale for this test has been chosen to see the dynamics of the PEMEL and the steady-state operation.
From Figure 18, the PEMEL stack voltage is equal to the open-circuit voltage called Nernst voltage or reversible voltage (Vint) at iel = 0 A. This voltage is approximately equal to 4.33 V. When the DC current is supplied to the PEMEL, an immediate rise in PEMEL stack voltage can be noticed, followed by a slow final rise before reaching its steady-state value. The immediate rise in stack voltage can be modeled as a resistor, representing the ohmic losses in the membrane. Besides, the slow final rise in stack voltage represents the speed of the chemical reactions both at the anode and the cathode. In this test, this final rise lasts 13 s and can change according to the input energy supplying the PEMEL. Indeed, as highlighted in [24], the duration of the final rise to reach the steady-state operation due to the move of the electrons into the anode and cathode lengthens especially as the input energy increases. However, when the stack voltage gets closer to the limit operating voltage (for this PEMEL, the limit voltage is equal to 8 V), the dynamics are faster, and the stack voltage in steady-state operation may drop [24]. To summarize, this slow rise represents the activation overvoltage both at the anode and cathode. Since this dynamic behavior is close to a first-order system, it can be modeled as RC branches. On one hand, the resistors result in activation losses both at the anode and cathode, while the capacitors represent the charge separation into the anode and cathode. Hence, the dynamic behavior of the PEMEL to the final duration required by the charge layers to move when a DC current is supplied can be replicated.
On the other hand, in [24], it has been emphasized that the reaction speed at the anode is much slower than the reaction speed at the cathode. For this reason, the activation phenomena in PEMEL are mainly dominated by the anode reaction.
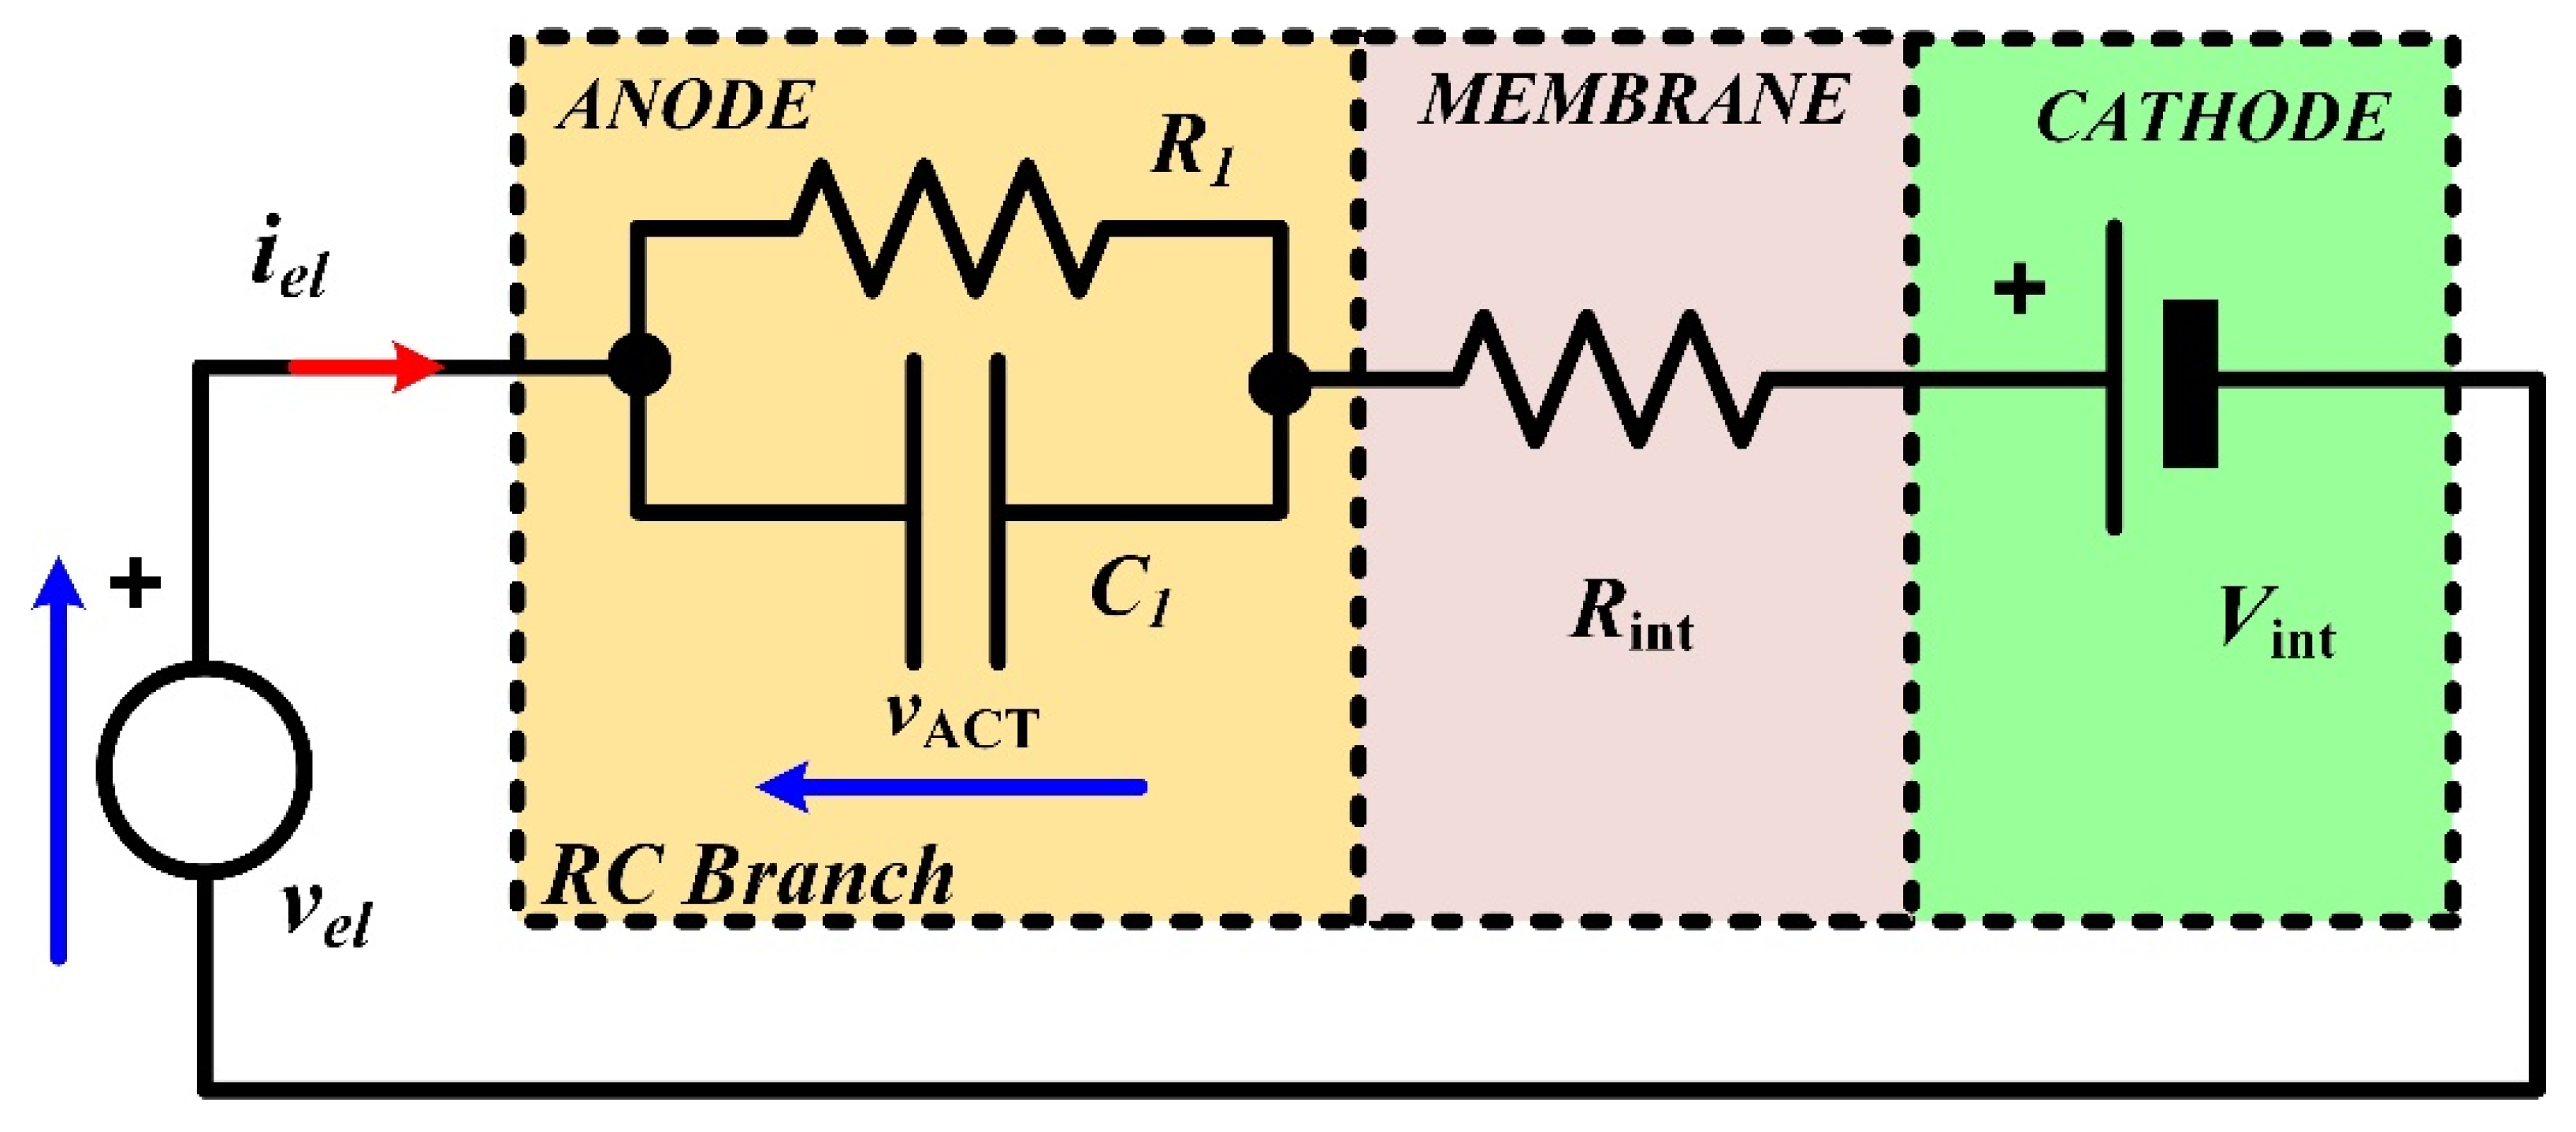
The equivalent electrical circuit used to model the dynamic behavior of the PEMEL is shown in Figure 19. It consists of an electromotive force representing the reversible voltage (Vint), series-connected with a resistor (Rint) modeling the membrane, and an RC branch to emulate the losses in the anode and the dynamics [24]. In the literature, this dynamic model has been reported in other related works [9,42,43]. In [42], the authors have proposed this model based on previous works reported for fuel cells. Experimental results are provided to show the dynamics of a single-cell PEM electrolyzer, but the authors did not determine the parameters of the equivalent circuit. By comparison, in [43], the same model is presented based on [42], but only the static model is considered to be coupled with an interleaved DC–DC buck converter for control purposes. Finally, in [9], this model is presented for an alkaline electrolyzer to investigate the effects of rectifiers on the specific energy consumption and gas quality during dynamic operation.
From Figure 19, the PEMEL stack voltage can be expressed as follows:
v e l = V i n t + v A C T + R i n t i e l
The dynamic activation overvoltage at the anode can be written as:
d v A C T d t = 1 C 1 i e l v A C T R 1 C 1
The couple R1C1 represents the time constant in seconds of the dynamics. The equivalent resistor R1 at the anode can be determined based on the activation overvoltage vACT and the current flowing through the electrolyzer iel. Hence, the constant time τ a at the anode is expressed as follows:
τ a = R 1 C 1 = ( V A C T i e l ) C 1
By using the static model identification (see Section 3.2), the reversible voltage (Vint) and the membrane resistor (Rint) can be determined. After that, to identify the parameters of the RC branch for the anode reaction, a dynamic model identification has to be considered by investigating the transient operation as shown in Figure 18. A least-squares regression algorithm has been used to determine the time constant of the transient operation, then the parameters of the activation resistance and double-layer capacitor [24]. It has to be noted that the equivalent double-layer capacitor determined for this study is equal roughly to 37 F, while the values reported for PEM fuel cells and alkaline electrolyzers are of the order of a few Farad [44] and milli Farad [9], respectively. These results are high in terms of capacitance values and are assimilated to supercapacitors.

3.4. Comparison between Static and Dynamic Model

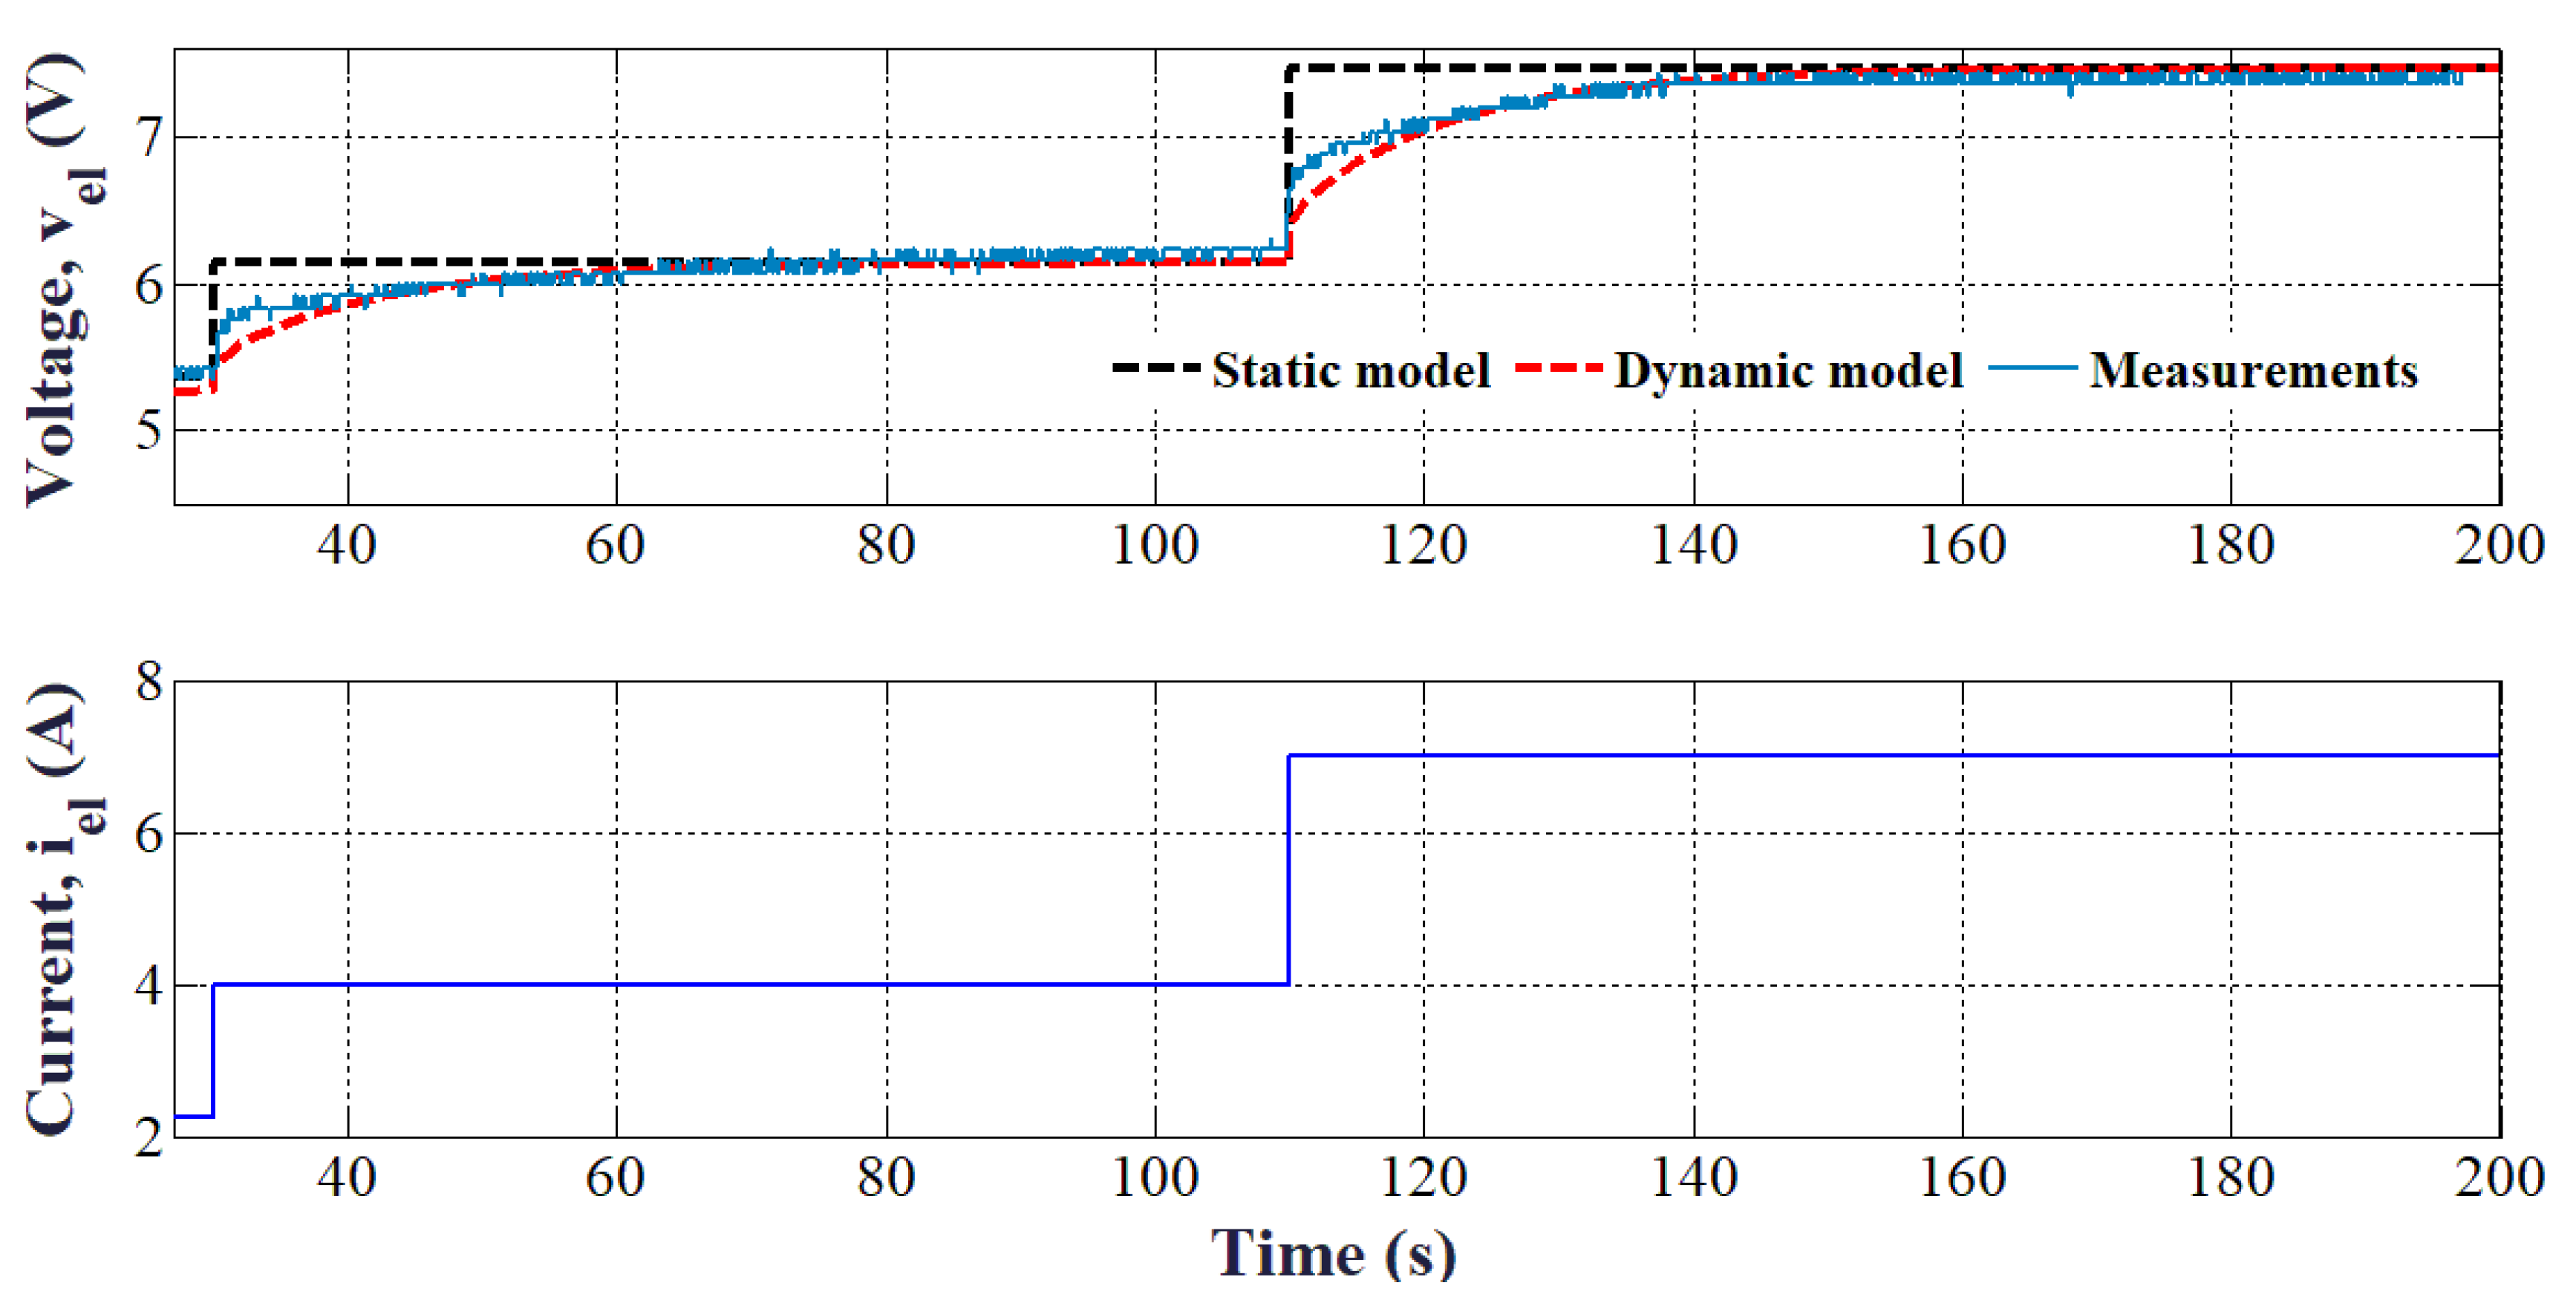
A comparison between the static model (Figure 16) and the dynamic model (Figure 19) providing the voltage response of the PEMEL according to a current profile is given in Figure 20 [24]. It can be noted that the voltage response obtained by the dynamic model allows replicating accurately the real dynamic behavior of a PEMEL. Based on previous work [24], a dynamic model features a maximum error of about 4%, whereas a static model presents a maximum error of about 15%. Unfortunately, the maximum error for the static model occurs just after the step solicitation; it is a typical situation depicted by an abrupt variation of the available power when a RES is used.
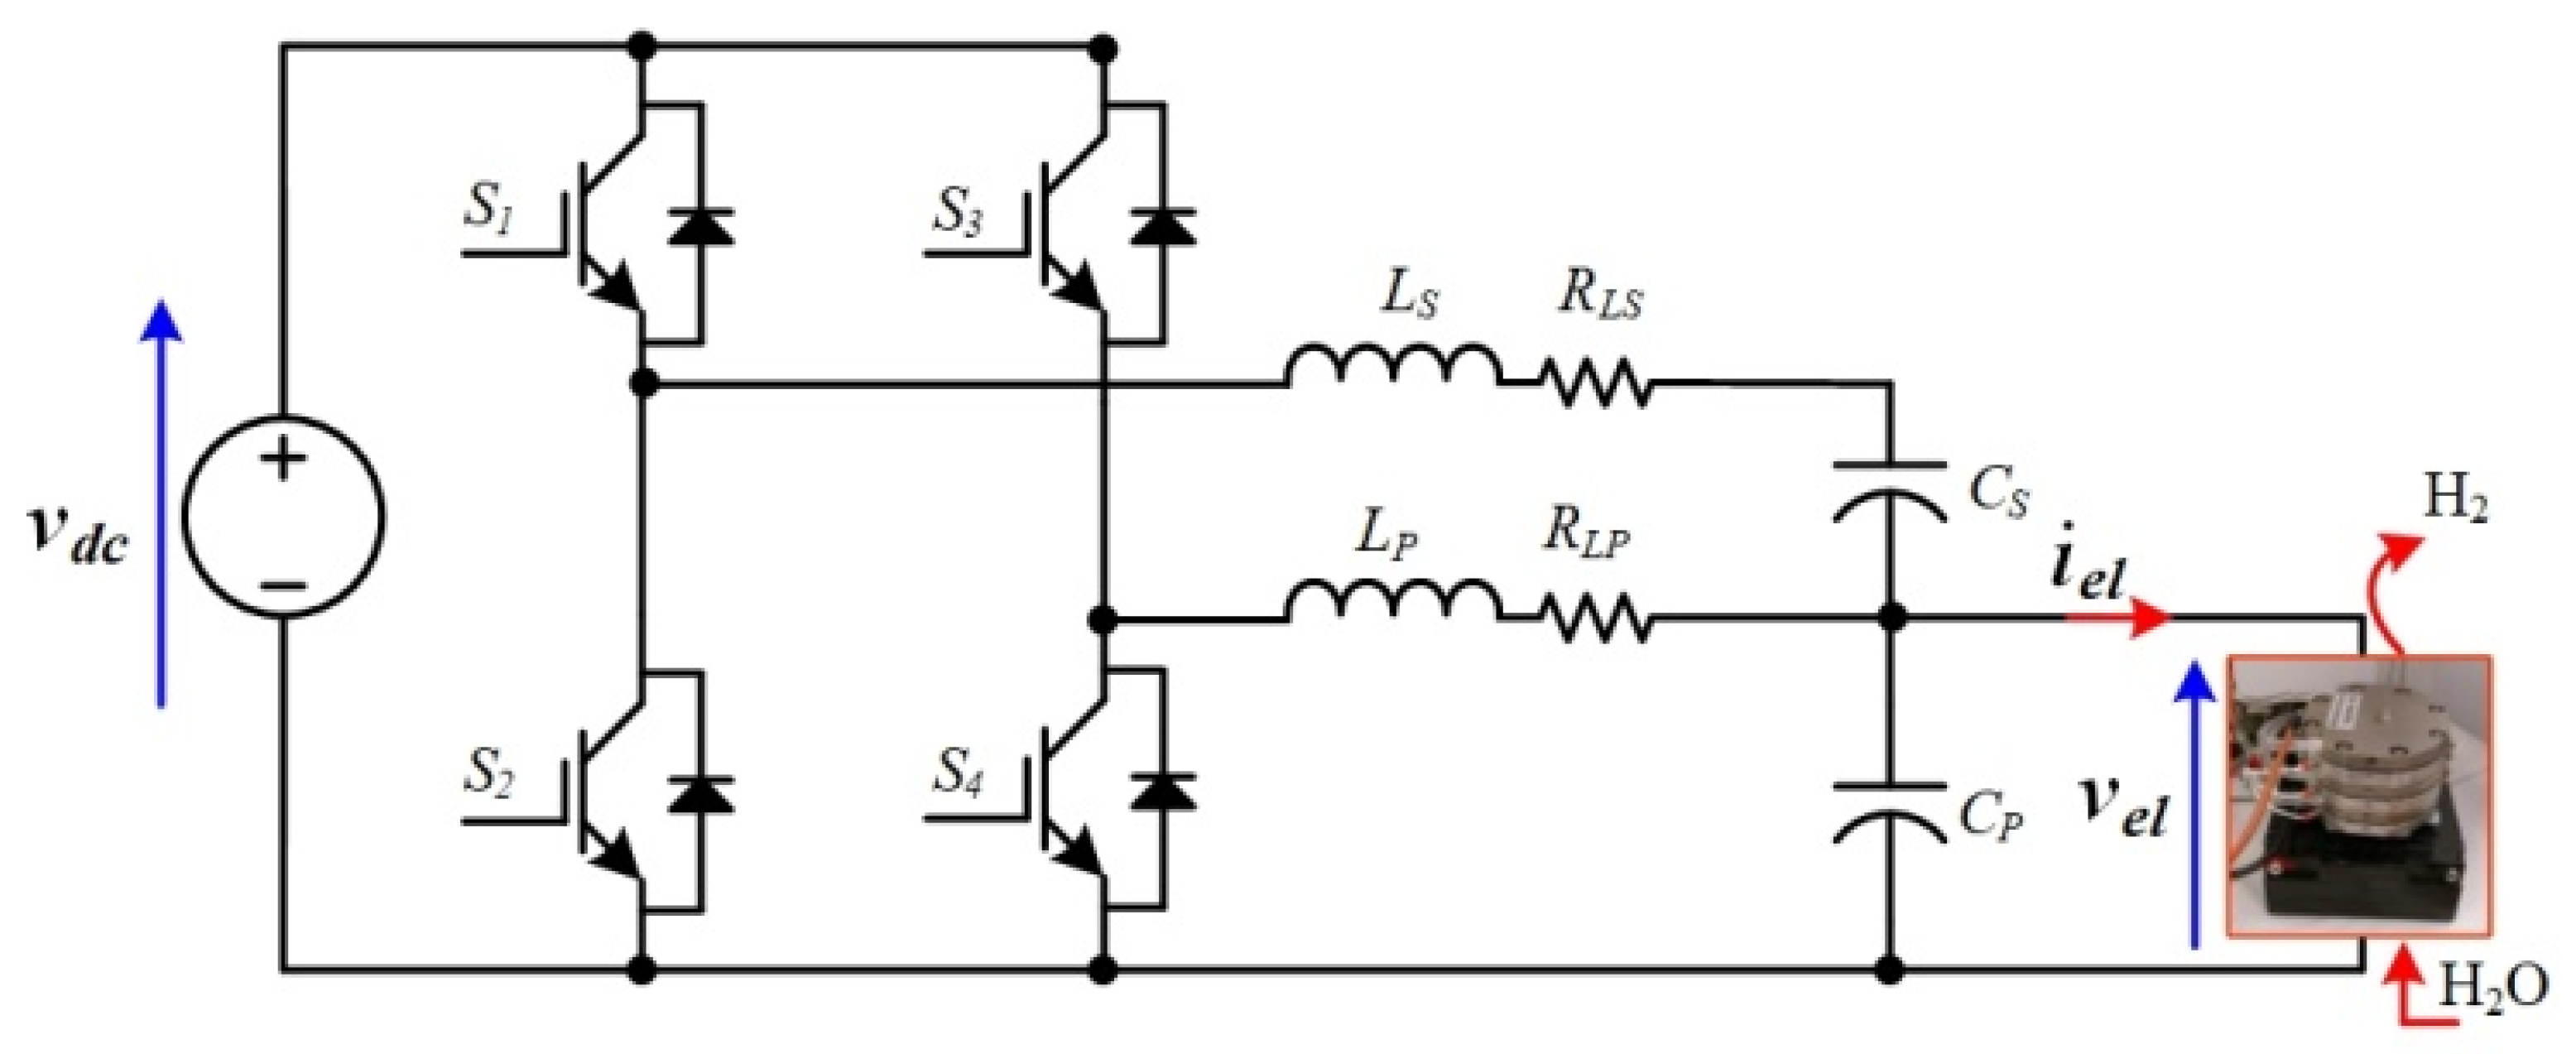
The equivalent model developed in Figure 19 has been used for the first time to design the controller of a suitable DC–DC converter to supply a PEMEL, namely a stacked interleaved buck converter (SIBC) as shown in Figure 21 [25]. Compared to a classic interleaved buck converter, the SIBC includes an additional capacitor Cs between the first and the second phase. The capacitor Cs allows blocking the DC component of the current flowing through the second phase. As a result, only the AC component of the current flows through the second phase. Besides, since a couple of power switches (i.e., S1 and S4, and S2 and S3) are controlled in an opposite way, only the DC current supplies the PEMEL. A low current ripple is one of the most important features required for the DC–DC converter to supply the electrolyzer. Indeed, as demonstrated in the literature, the current ripple leads up to the decrease of the energy efficiency of the electrolyzer [45,46].
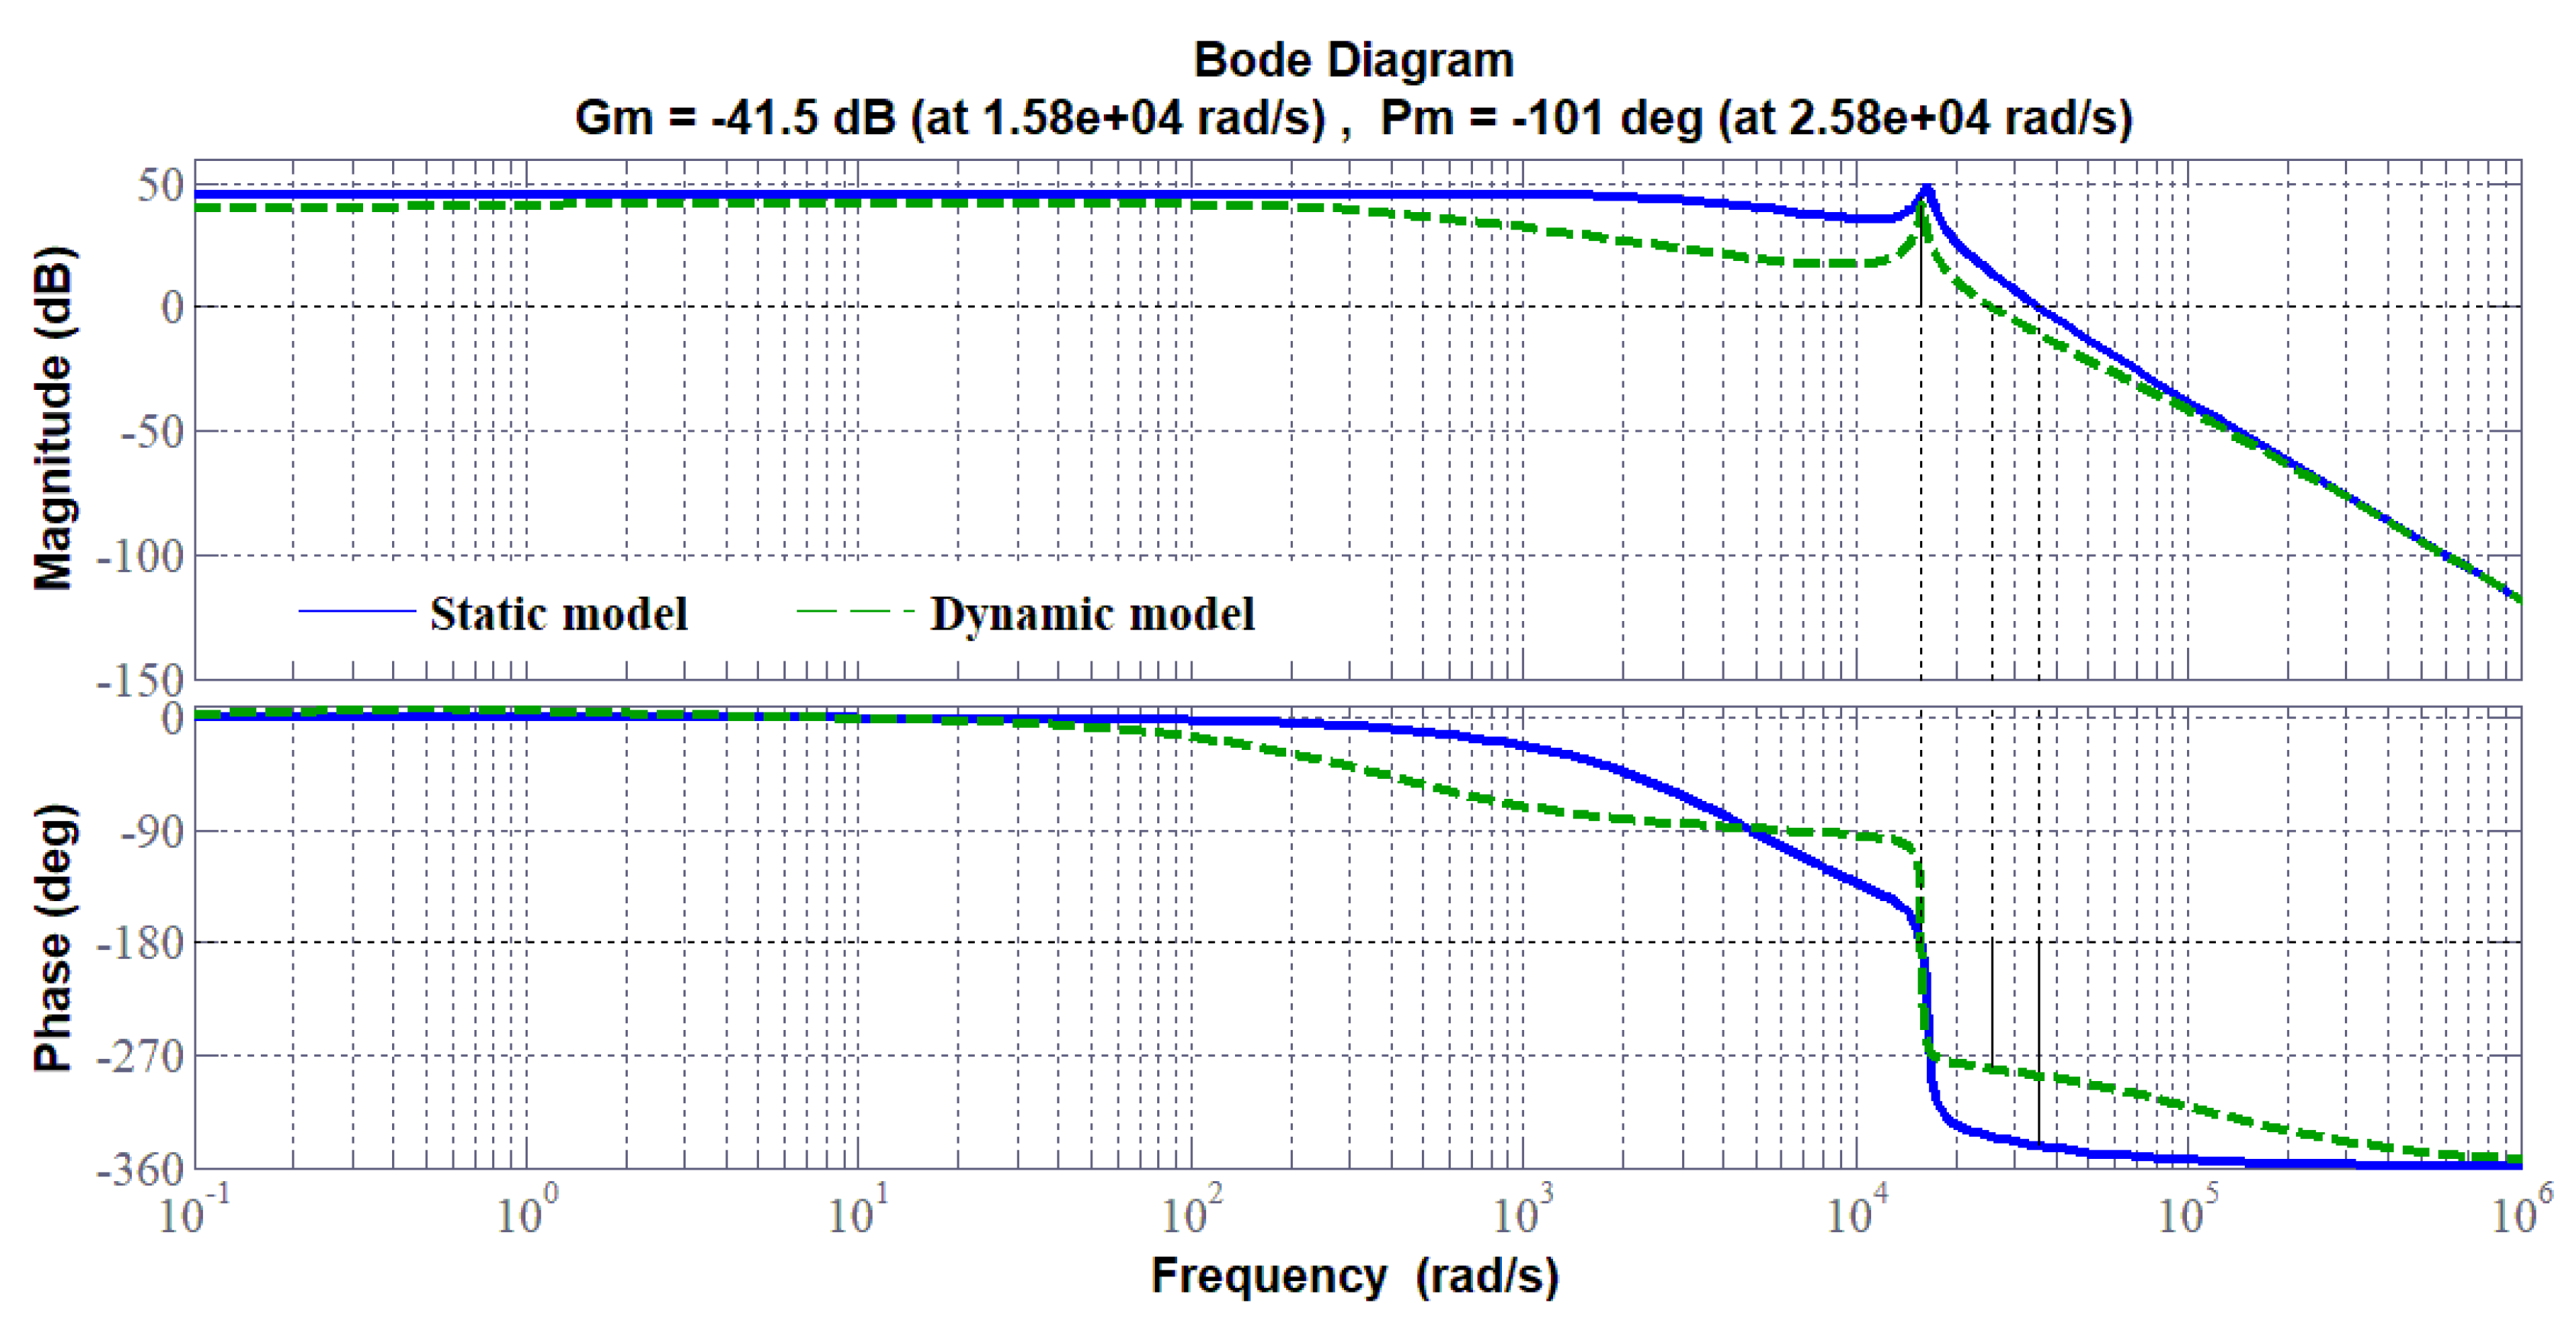
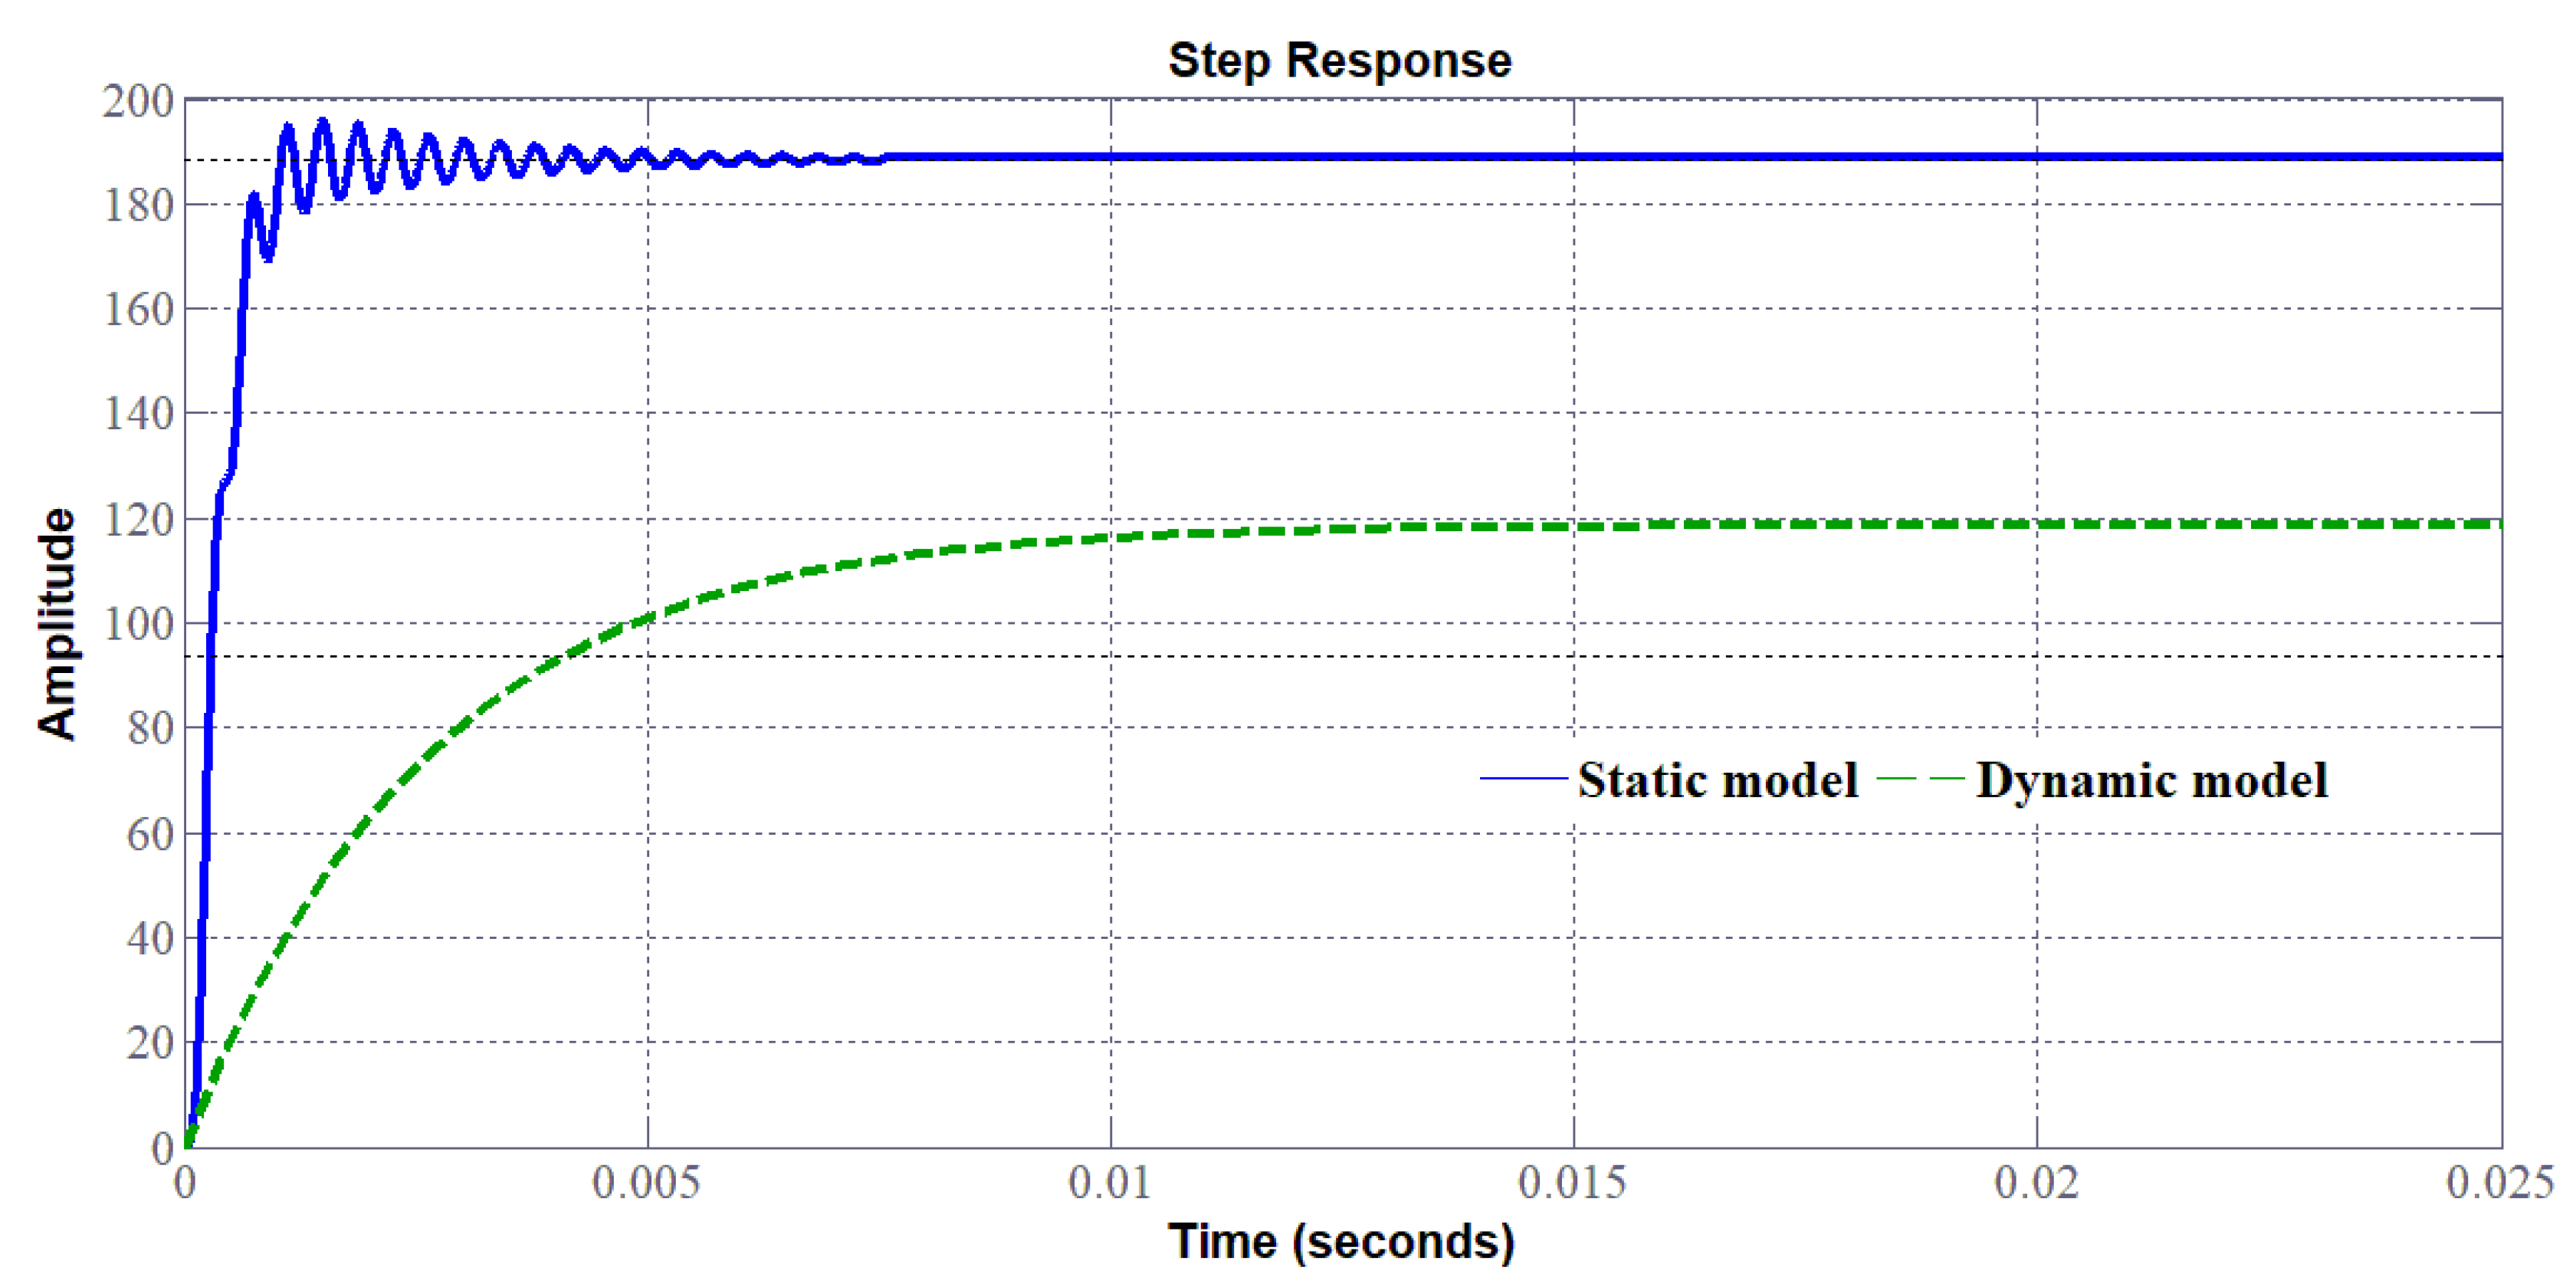
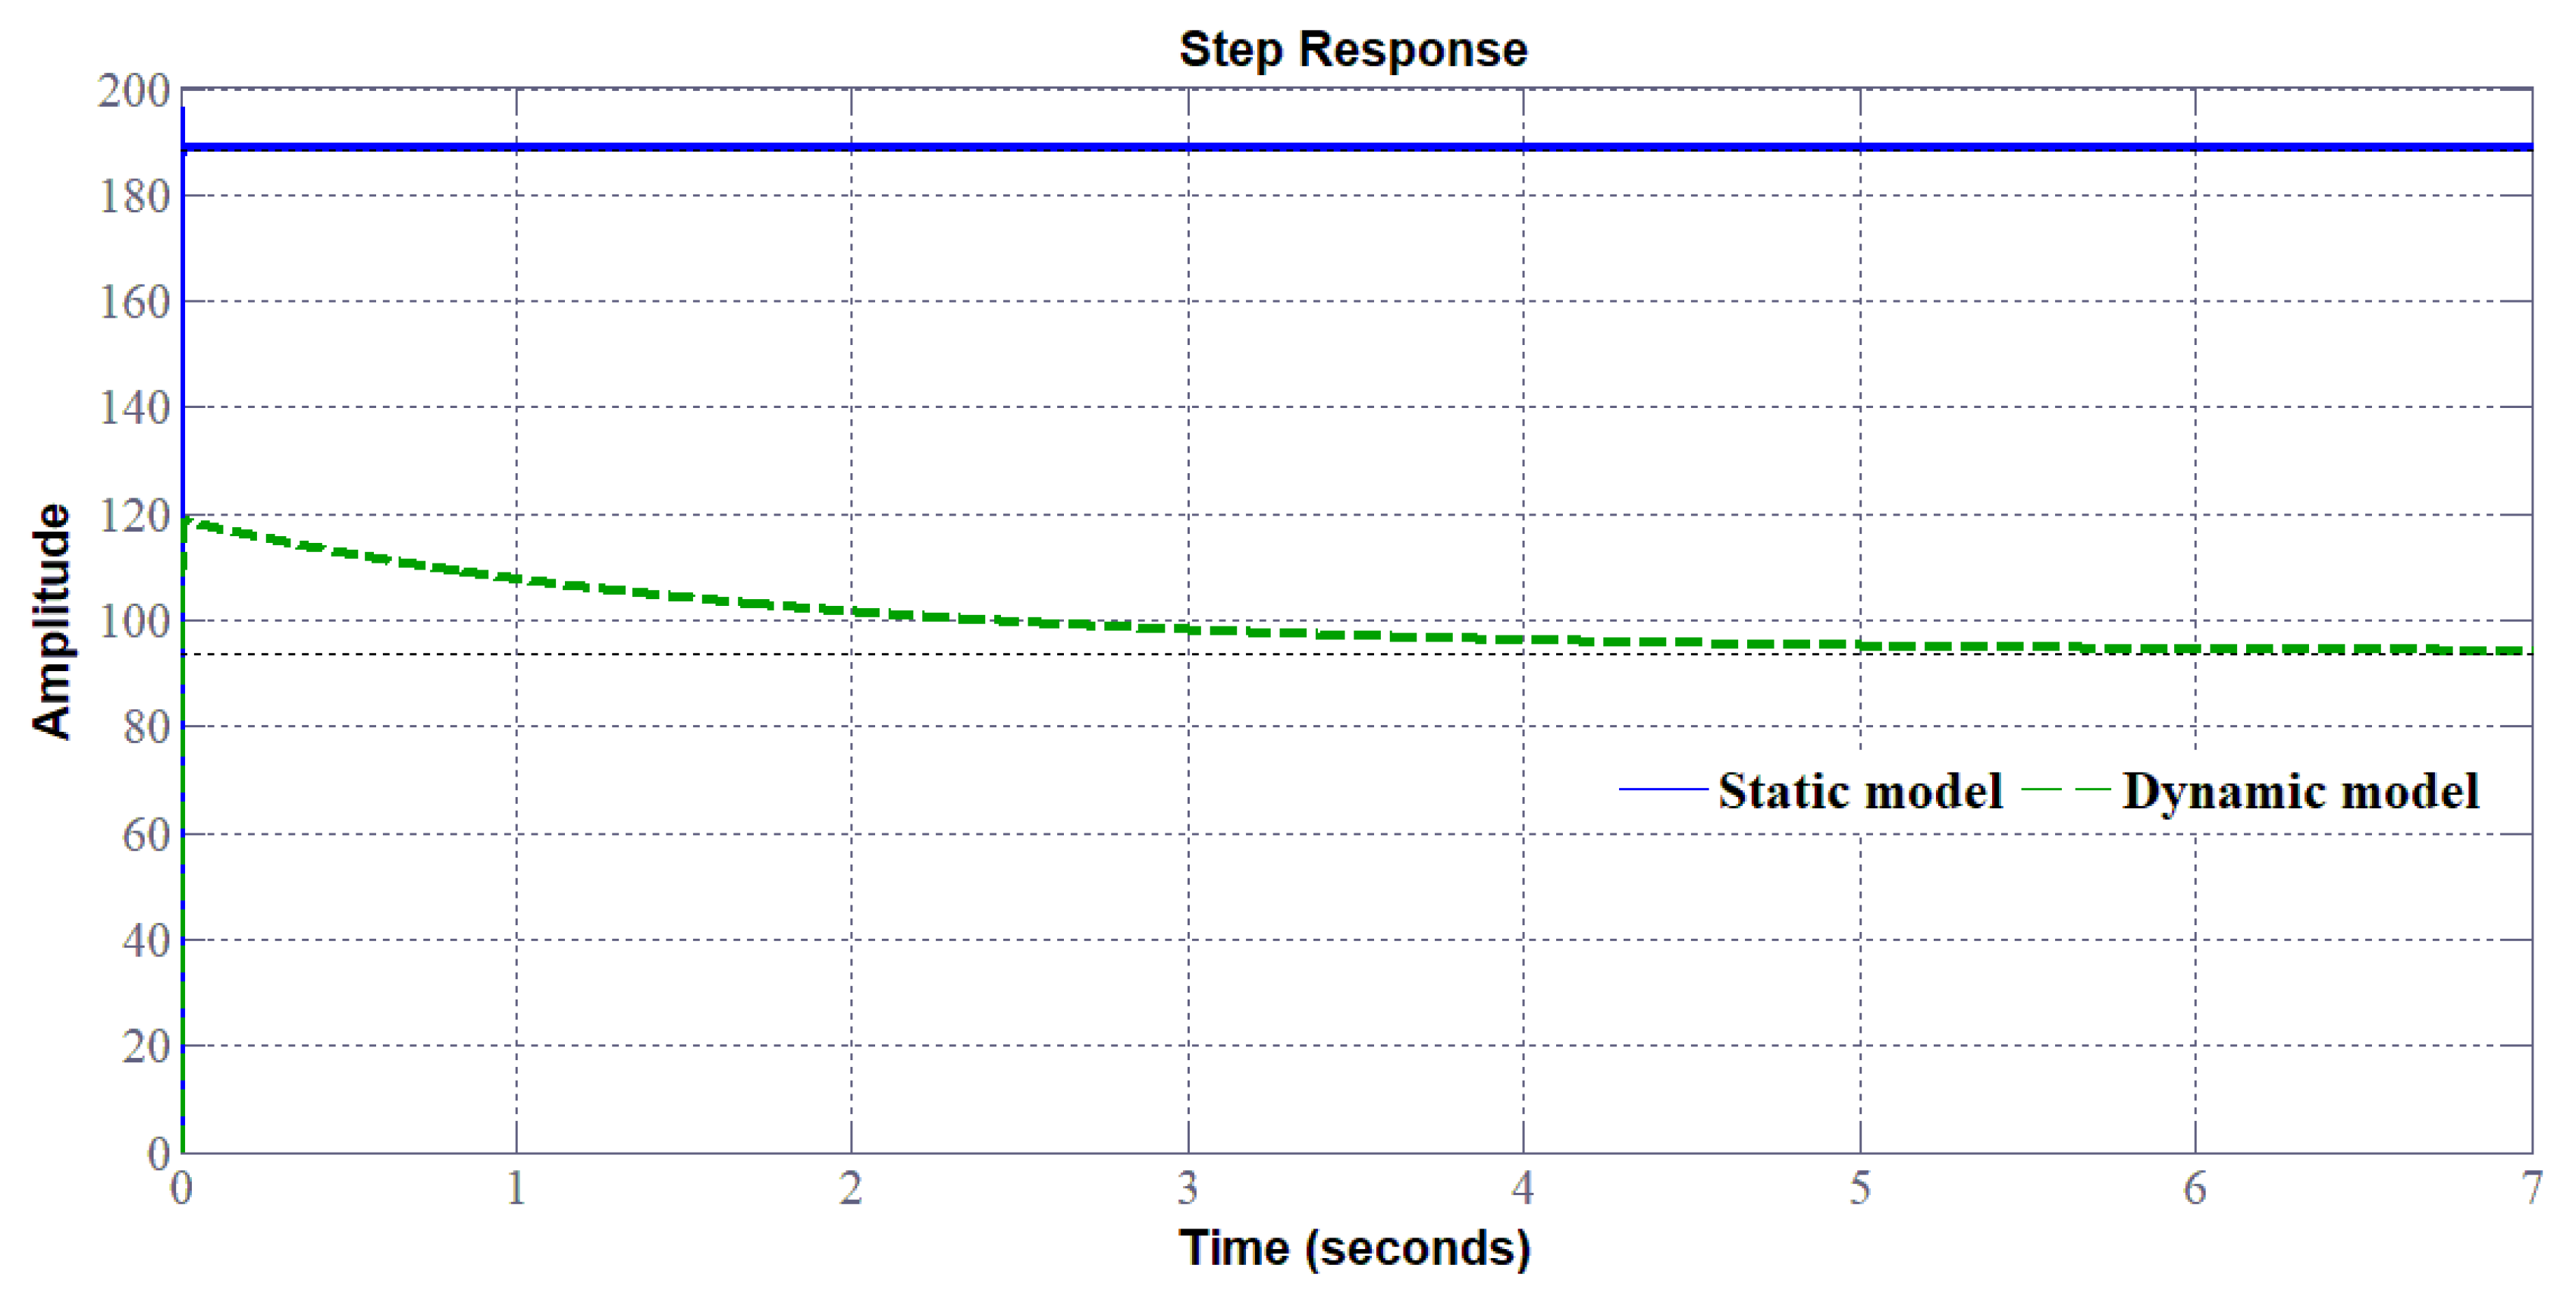
Based on the static and dynamic models, the bode diagrams of the transfer function (to control the stack voltage of the PEMEL) of the SIBC (Figure 22), and accordingly, the step response of the system (Figure 23) changes by considering either a static or a dynamic load. Besides, it can be seen in Figure 24 that the step response of the SIBC with a dynamic model is slower due to the anode reaction. As a result, the design and the tuning of the controller require an accurate model, such as the dynamic model presented in Section 3.3. To control PEM electrolyzers efficiently, overshoot must be avoided that may damage the electrolyzer and stability must be ensured without oscillation as highlighted in [25]. Besides, since PEM electrolyzers present slow dynamics, the rapidity is not the most important criterium to design controllers.
The different step responses demonstrate that adopting a simplified model such as the static one could lead to a wrong design of the controller. Indeed, the bode diagram of the converter with the static model shows a gain higher compared to the dynamic model. This implies the response with overshoot requiring a correction that would worsen the dynamic. Contrarily, the real response of the system corresponds to the dynamic model in which no overshoot occurs. It means that the dynamic of the PEMEL enforces the stability of the system; for this reason, it is crucial to take it into account. Besides, this issue is strictly tied to the use of RES since for stationary grid-supplied applications no input power variations occur and the voltage or current supplying the electrolyzer can be varied according to the quantity of hydrogen to be produced.

4. Conclusions

The goal of this article was to underline the importance of using power converters, particularly DC–DC converters, to interface a high DC bus voltage to a low DC voltage required for PEM electrolyzers. With renewable energy sources as supply, green hydrogen can be produced and blended to natural gas or employed in other clean applications. Besides, the modeling of the PEM electrolyzer is mandatory to develop controllers such as energy efficiency or hydrogen flow rate-based controls. In this article, three types of modeling have been investigated (i.e., resistive, static, and dynamic load) showing that the use of RES implies different design constraints compared to stationary grid-supplied converters for electrolyzers. It has been demonstrated that the dynamics play an important role to understand the behavior of the PEM electrolyzer in case of dynamic operating conditions. Indeed, the PEM electrolyzers can be coupled with renewable energy sources and are submitted to dynamic operations due to the weather conditions change. As a result, if these dynamics were taken into account in designing the controller, the performance of the system could be enhanced greatly making hydrogen more attractive also in carbon-based fuels.

Author Contributions

Conceptualization, B.Y., D.G., M.P., W.K., and M.H.; methodology, B.Y., D.G., M.P., W.K., and M.H.; validation, B.Y., D.G., and G.V.; investigation, B.Y., D.G., and G.V.; writing—original draft preparation, D.G., and G.V.; writing—review and editing, B.Y., D.G., and G.V. All authors have read and agreed to the published version of the manuscript.

Funding

This research received no external funding.

Acknowledgments

The authors would like to thank sincerely the French Embassy in Bangkok (Thailand) and Campus France in supporting Burin Yodwong’s Ph.D. thesis within the framework of the Franco-Thai scholarship program. Besides, the authors are very thankful to the GREEN laboratory of the Université de Lorraine and Thai-French Innovation Institute of King Mongkut’s University of Technology North Bangkok for their constant support in developing research cooperation between France and Thailand.

Conflicts of Interest

The authors declare no conflict of interest.

References

  1. Nikolaidis, P.; Poullikkas, A. A comparative overview of hydrogen production processes. Renew. Sustain. Energy Rev. 2017, 67, 597–611. [Google Scholar] [CrossRef]
  2. 2019 DOE Hydrogen and Fuel Cells Program Annual Merit Review and Peer Evaluation Report Released. Office of Energy Efficiency & Renewable Energy Home Page. Available online: https://www.energy.gov/eere/fuelcells/articles/2019-doe-hydrogen-and-fuel-cells-program-annual-merit-review-and-peer (accessed on 26 March 2020).
  3. Shiva, K.S.; Himabindu, V. Hydrogen production by PEM water electrolysis—A review. Mater. Sci. Energy Technol. 2019, 2, 442–454. [Google Scholar]
  4. Melaina, M.W.; Antonia, O.; Penev, M. Blending Hydrogen into Natural Gas Pipeline Networks: A Review of Key Issues; No. NREL/TP-5600-51995; National Renewable Energy Laboratory: Oak Ridge, TN, USA, 2013.
  5. Haines, M.; Polman, E.; Delaat, J. Reduction of CO2 emissions by addition of hydrogen to natural gas. Greenh. Gas Control Technol. 2005, 7, 337–345. [Google Scholar]
  6. David, M.; Ocampo-Martínez, C.; Sánchez-Peña, R. Advances in alkaline water electrolyzers: A review. J. Energy Storage 2019, 23, 392–403. [Google Scholar] [CrossRef] [Green Version]
  7. Rajeshwar, K.; McConnell, R.; Licht, S. Solar Hydrogen Generation; Springer: New York, NY, USA, 2008. [Google Scholar]
  8. Koponen, J.; Ruuskanen, V.; Kosonen, A.; Niemela, M.; Ahola, J. Effect of converter topology on the specific energy consumption of alkaline water electrolyzers. IEEE Trans. Power Electron. 2019, 34, 6171–6182. [Google Scholar] [CrossRef]
  9. Speckmann, F.; Bintz, S.; Birke, K. Influence of rectifiers on the energy demand and gas quality of alkaline electrolysis systems in dynamic operation. Appl. Energy 2019, 250, 855–863. [Google Scholar] [CrossRef]
  10. Ruuskanen, V.; Koponen, J.; Kosonen, A.; Niemelä, M.; Ahola, J.; Hämäläinen, A. Power quality and reactive power of water electrolyzers supplied with thyristor converters. J. Power Sources 2020, 459, 228075. [Google Scholar] [CrossRef]
  11. Mohammadi, A.; Mehrpooya, M. A comprehensive review on coupling different types of electrolyzer to renewable energy sources. Energy 2018, 158, 632–655. [Google Scholar] [CrossRef]
  12. Guilbert, D.; Collura, S.; Scipioni, A. DC/DC converter topologies for electrolyzers: State-of-the-art and remaining key issues. Int. J. Hydrogen Energy 2017, 42, 23966–23985. [Google Scholar] [CrossRef]
  13. Zhou, T.; Lu, D.; Fakham, H.; Francois, B. Power flow control in different time scales for a wind/hydrogen/super-capacitors based active hybrid power system. In Proceedings of the 13th International Power Electronics and Motion Control Conference, Poznan, Poland, 1–3 September 2008. [Google Scholar]
  14. Şahin, M.; Okumuş, H.; Aydemir, M. Implementation of an electrolysis system with DC/DC synchronous buck converter. Int. J. Hydrogen Energy 2014, 39, 6802–6812. [Google Scholar] [CrossRef]
  15. Chandrasekhar, P.; Rama Reddy, S. Performance of soft-switched DC-DC resonant converter for Electrolyzer. In Proceedings of the 4th International Symposium on Resilient Control Systems, Boise, ID, USA, 9–11 August 2011. [Google Scholar]
  16. Gautam, D.; Bhat, A. A comparison of soft-switched DC-to-DC converters for electrolyzer application. IEEE Trans. Power Electron. 2013, 28, 54–63. [Google Scholar] [CrossRef]
  17. Alavi, O.; Hooshmand Viki, A.; Tavakoli Bina, M.; Akbari, M. Reliability assessment of a stand-alone wind-hydrogen energy conversion system based on thermal analysis. Int. J. Hydrogen Energy 2017, 42, 14968–14979. [Google Scholar] [CrossRef]
  18. Zorica, S.; Vukšić, M.; Betti, T. Design considerations of the multi-resonant converter as a constant current source for electrolyser utilisation. Int. J. Electr. Power Energy Syst. 2019, 111, 237–247. [Google Scholar] [CrossRef]
  19. Albarghot, M.; Rolland, L. Comparison of experimental results with simulation of a PEM Electrolyzer powered by a horizontal wind turbine. In Proceedings of the International Conference of Electrical and Electronic Technologies for Automotive 2017, Torino, Italy, 15–16 June 2017. [Google Scholar]
  20. Atlam, O. An experimental and modelling study of a photovoltaic/proton-exchange membrane electrolyser system. Int. J. Hydrogen Energy 2009, 34, 6589–6595. [Google Scholar] [CrossRef]
  21. Atlam, O.; Kolhe, M. Equivalent electrical model for a proton exchange membrane (PEM) electrolyser. Energy Convers. Manag. 2011, 52, 2952–2957. [Google Scholar] [CrossRef]
  22. Muyeen, S.; Takahashi, R.; Tamura, J. Electrolyzer switching strategy for hydrogen generation from variable speed wind generator. Electr. Power Syst. Res. 2011, 81, 1171–1179. [Google Scholar] [CrossRef] [Green Version]
  23. Yodwong, B.; Guilbert, D.; Kaewmanee, W.; Phattanasak, M. Energy efficiency based control strategy of a three-level interleaved DC-DC buck converter supplying a proton exchange membrane electrolyzer. Electronics 2019, 8, 933. [Google Scholar] [CrossRef] [Green Version]
  24. Guilbert, D.; Vitale, G. Dynamic emulation of a pem electrolyzer by time constant based exponential model. Energies 2019, 12, 750. [Google Scholar] [CrossRef] [Green Version]
  25. Guilbert, D.; Sorbera, D.; Vitale, G. A stacked interleaved DC-DC buck converter for proton exchange membrane electrolyzer applications: Design and experimental validation. Int. J. Hydrogen Energy 2020, 45, 64–79. [Google Scholar] [CrossRef]
  26. Bessarabov, D.; Wang, H.; Li, H.; Zhao, N. PEM Electrolysis for Hydrogen Production; Taylor & Francis: Abingdon, UK, 2015. [Google Scholar]
  27. Schalenbach, M.; Carmo, M.; Fritz, D.; Mergel, J.; Stolten, D. Pressurized PEM water electrolysis: Efficiency and gas crossover. Int. J. Hydrogen Energy 2013, 38, 14921–14933. [Google Scholar] [CrossRef]
  28. Nafion™ Membranes, Dispersions, and Resins Home Page. Available online: https://www.fuelcellstore.com/fuel-cell-components/membranes/nafion (accessed on 28 March 2020).
  29. Falcão, D.; Pinto, A. A review on PEM Electrolyzer Modelling: Guidelines for beginners. J. Clean. Prod. 2020, 121184. [Google Scholar] [CrossRef]
  30. Liso, V.; Savoia, G.; Araya, S.S.; Cinti, G.; Kær, S.K. Modelling and experimental analysis of a polymer electrolyte membrane water electrolysis cell at different operating temperatures. Energies 2018, 11, 3273. [Google Scholar] [CrossRef] [Green Version]
  31. Scheepers, F.; Stähler, M.; Stähler, A.; Rauls, E.; Müller, M.; Carmo, M.; Lehnert, W. Improving the efficiency of PEM electrolyzers through membrane-specific pressure optimization. Energies 2020, 13, 612. [Google Scholar] [CrossRef] [Green Version]
  32. Millet, P.; Ranjbari, A.; de Guglielmo, F.; Grigoriev, S.; Auprêtre, F. Cell failure mechanisms in PEM water electrolyzers. Int. J. Hydrogen Energy 2012, 37, 17478–17487. [Google Scholar] [CrossRef]
  33. Shin, D.; Guiver, M.; Lee, Y. Hydrocarbon-based polymer electrolyte membranes: Importance of morphology on ion transport and membrane stability. Chem. Rev. 2017, 117, 4759–4805. [Google Scholar] [CrossRef]
  34. Vivas, F.; De las Heras, A.; Segura, F.; Andújar, J. A review of energy management strategies for renewable hybrid energy systems with hydrogen backup. Renew. Sustain. Energy Rev. 2018, 82, 126–155. [Google Scholar] [CrossRef]
  35. Abu-Rub, H.; Malinowski, M.; Al-Haddad, K. Power Electronics for Renewable Energy Systems, Transportation, and Industrial Applications; Wiley-IEEE Press: Hoboken, NJ, USA, 2014. [Google Scholar]
  36. Blaabjerg, F.; Liserre, M.; Ma, K. Power electronics converters for wind turbine systems. IEEE Trans. Ind. Appl. 2012, 48, 708–719. [Google Scholar] [CrossRef] [Green Version]
  37. Cirrincione, M.; Pucci, M.; Vitale, G. Growing neural gas (GNG)-based maximum power point tracking for high-performance wind generator with an induction machine. IEEE Trans. Ind. Appl. 2011, 47, 861–872. [Google Scholar] [CrossRef]
  38. Oliveira, D.; Reis, M.; Silva, C.; Colado Barreto, L.; Antunes, F.; Soares, B. A three-phase high-frequency semicontrolled rectifier for PM WECS. IEEE Trans. Power Electron. 2010, 25, 677–685. [Google Scholar] [CrossRef]
  39. Teichmann, R.; Bernet, S. A comparison of three-level converters versus two-level converters for low-voltage drives, traction, and utility applications. IEEE Trans. Ind. Appl. 2005, 41, 855–865. [Google Scholar] [CrossRef]
  40. Data for: Power Quality and Reactive Power of Water Electrolyzers Supplied with Thyristor Converters. Available online: http://dx.doi.org/10.17632/ds64k8jjjy.1#file-95f3fd89-f4d6-4922-816f-9d5e07c0191f (accessed on 23 April 2020).
  41. Ulleberg, O. Modeling of advanced alkaline electrolyzers: A system simulation approach. Int. J. Hydrogen Energy 2003, 28, 21–33. [Google Scholar] [CrossRef]
  42. da Costa Lopes, F.; Watanabe, E. Experimental and theoretical development of a PEM electrolyzer model applied to energy storage systems. In Proceedings of the 2009 Brazilian Power Electronics Conference, Bonito, Brazil, 28 September–2 October 2009. [Google Scholar]
  43. Ayivor, P.; Torres, J.; van der Meijden, M.; van der Pluijm, R.; Stouwie, B. Modelling of large size electrolyzer for electrical grid stability studies in real time digital simulation. In Proceedings of the 3rd International Hybrid Power Systems Workshop, Tenerife, Spain, 8–9 May 2018. [Google Scholar]
  44. Correa, J.; Farret, F.; Popov, V.; Simoes, M. Sensitivity analysis of the modeling parameters used in simulation of proton exchange membrane fuel cells. IEEE Trans. Energy Convers. 2005, 20, 211–218. [Google Scholar] [CrossRef]
  45. Ursúa, A.; Marroyo, L.; Gubía, E.; Gandía, L.; Diéguez, P.; Sanchis, P. Influence of the power supply on the energy efficiency of an alkaline water electrolyser. Int. J. Hydrogen Energy 2009, 34, 3221–3233. [Google Scholar] [CrossRef]
  46. Dobó, Z.; Palotás, Á. Impact of the current fluctuation on the efficiency of Alkaline Water Electrolysis. Int. J. Hydrogen Energy 2017, 42, 5649–5656. [Google Scholar] [CrossRef]
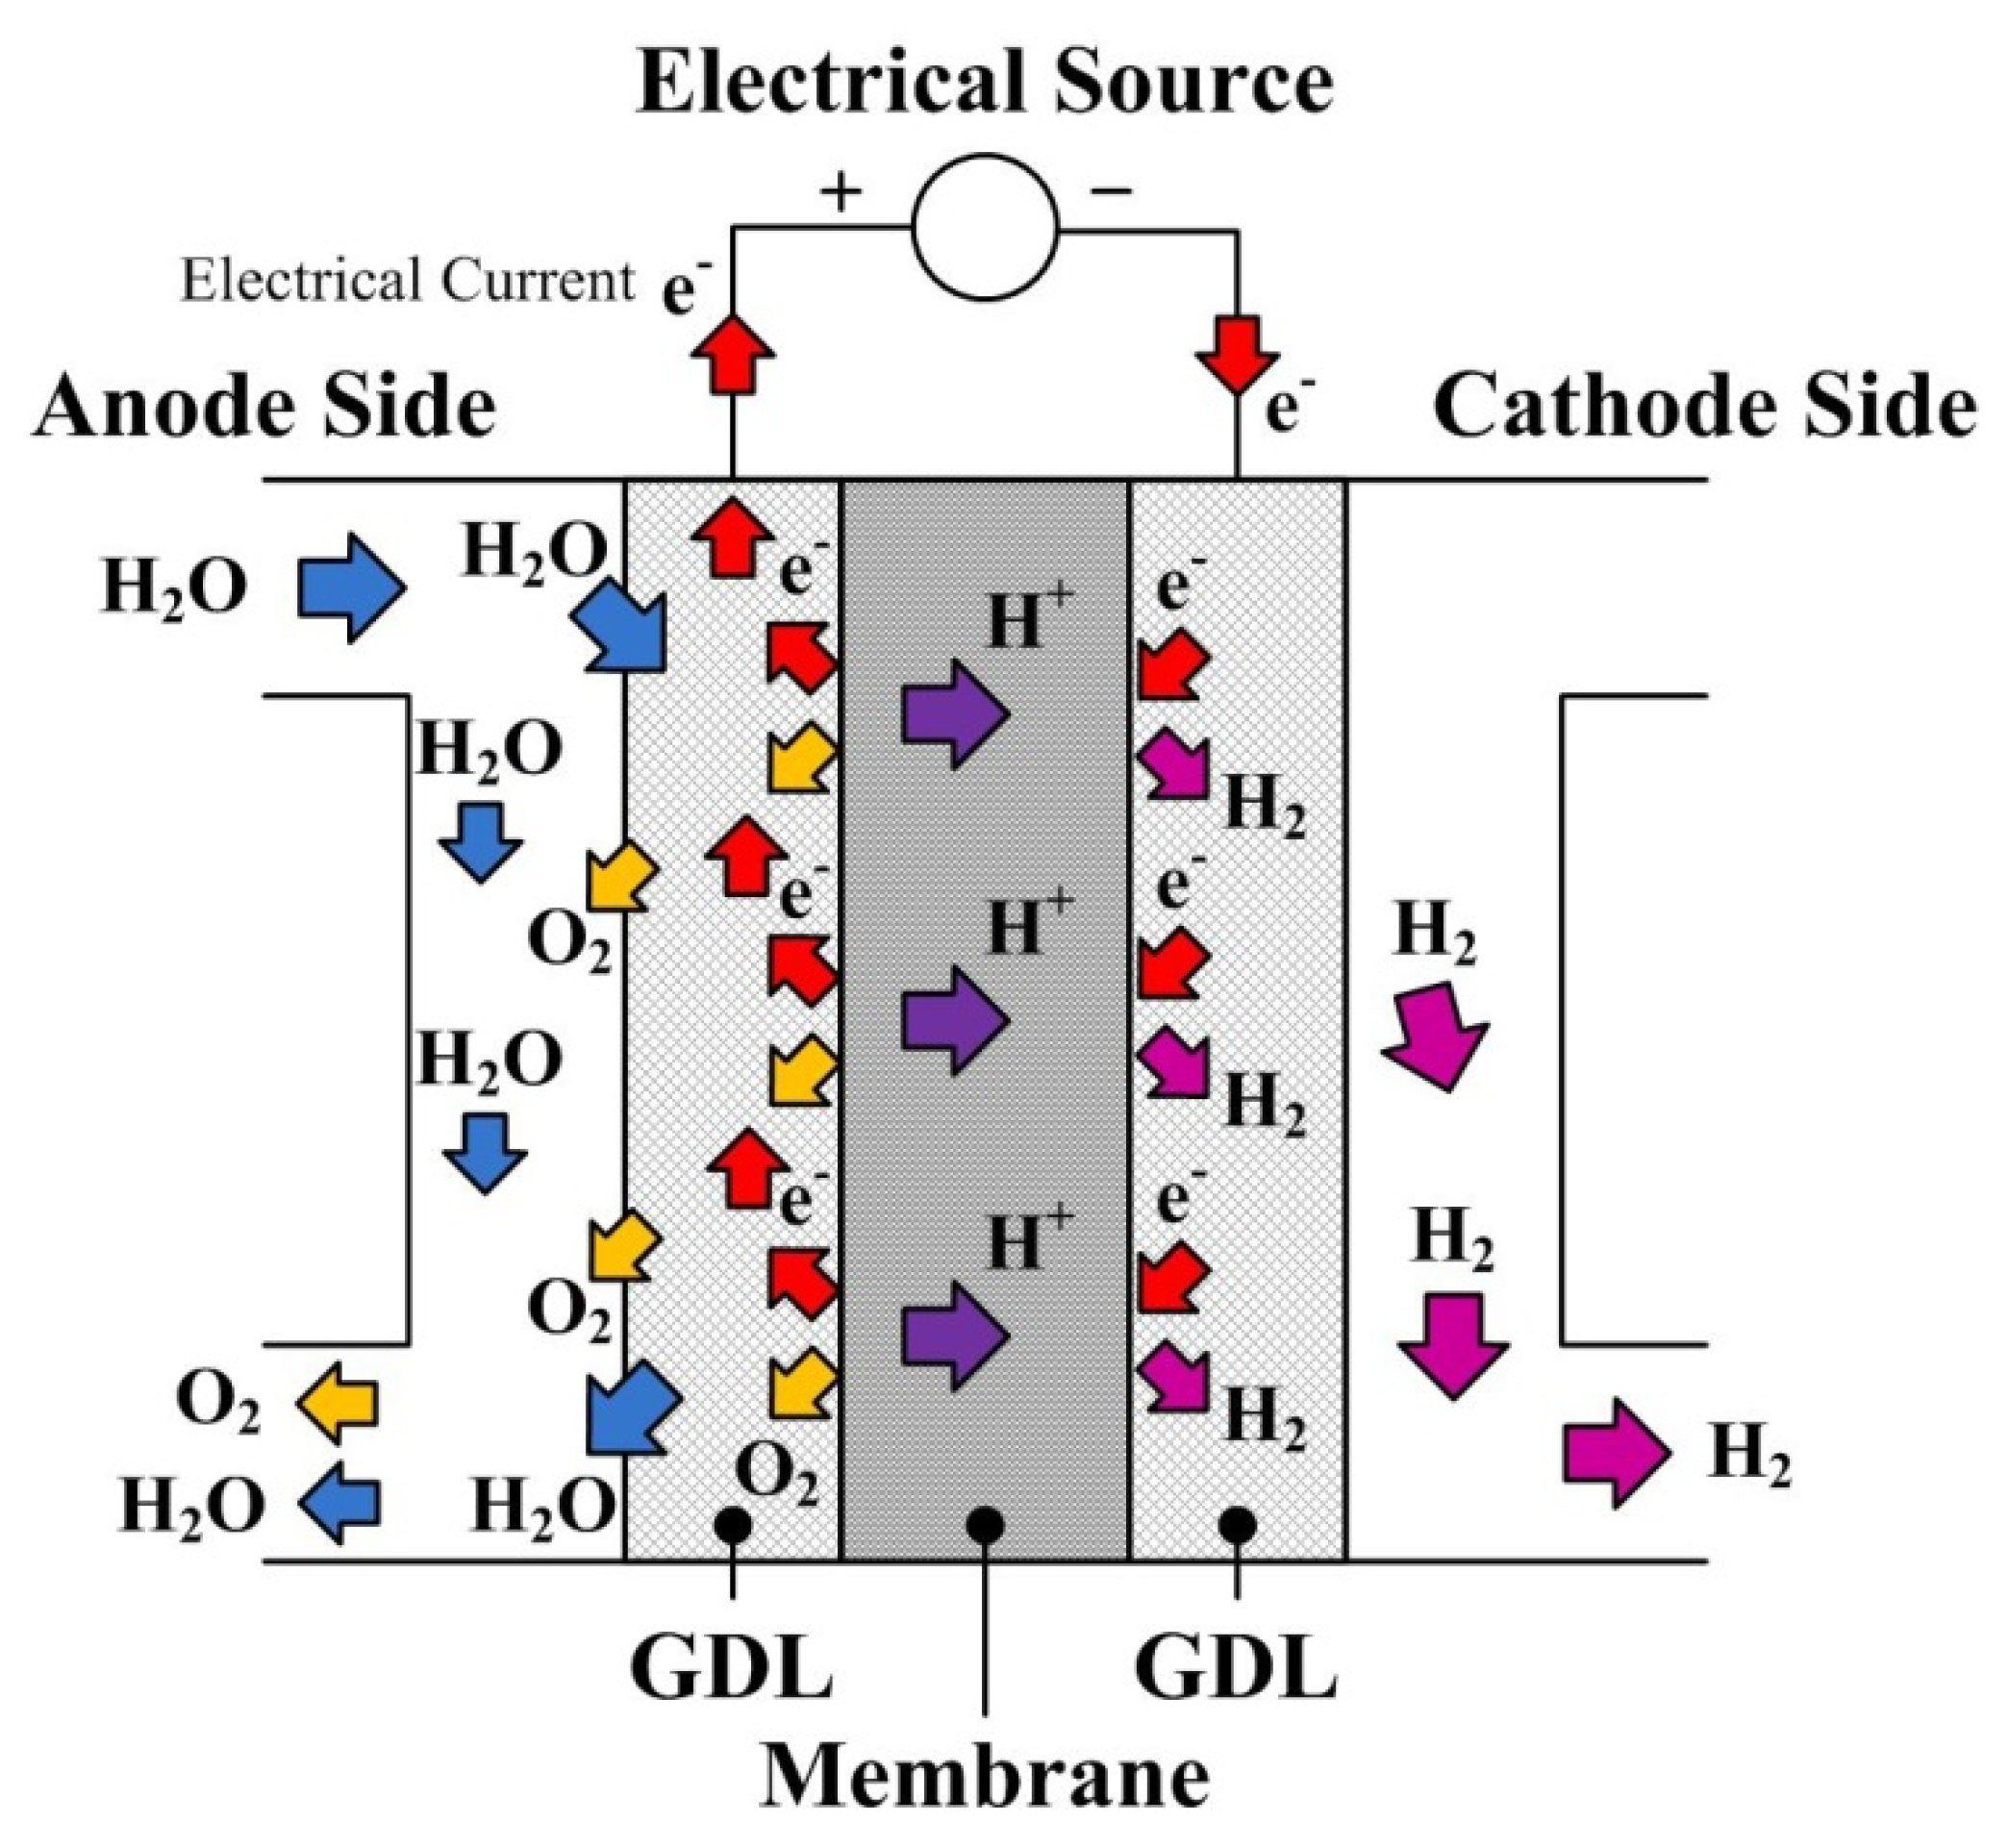
Figure 1. Principle of proton exchange membrane (PEM) electrolyzer.
Carbon 06 00029 g001
Figure 2. Cross-section of mass transport in a PEM electrolyzer [26].
Carbon 06 00029 g002
Figure 3. PEM electrolyzer system including power electronics.
Carbon 06 00029 g003
Figure 4. Hydrogen production systems supplied by solar energy.
Carbon 06 00029 g004
Figure 5. Hydrogen production systems supplied by wind energy with uncontrolled rectifier as passive front-end.
Carbon 06 00029 g005
Figure 6. Hydrogen production systems supplied by wind energy with front-end based on active rectifier.
Carbon 06 00029 g006
Figure 7. Hydrogen production systems supplied by wind energy with front-end based on semicontrolled rectifier.
Carbon 06 00029 g007
Figure 8. Hydrogen production systems supplied by wind energy with front-end based on multilevel rectifier.
Carbon 06 00029 g008
Figure 9. Hydrogen production systems with DC micro grid system.
Carbon 06 00029 g009
Figure 10. Hydrogen production systems connected to the power grid.
Carbon 06 00029 g010
Figure 11. Equivalent electric model by using a resistor.
Carbon 06 00029 g011
Figure 12. Static voltage-current curve of an alkaline electrolyzer (3 MW) [40].
Carbon 06 00029 g012
Figure 13. Equivalent resistive load according to the current [40].
Carbon 06 00029 g013
Figure 14. Resistance value variation according to PEMEL voltage.
Carbon 06 00029 g014
Figure 15. The I-V characteristic curve of a PEMEL with two different modeling (i.e., nonlinear and linear).
Carbon 06 00029 g015
Figure 16. Equivalent static electrical model of a proton exchange membrane electrolyzer (PEMEL) single cell.
Carbon 06 00029 g016
Figure 17. Investigation of dynamic operation of a PEMEL.
Carbon 06 00029 g017
Figure 18. PEMEL stack response according to a current dynamic profile (time scale: 5 s.div−1).
Carbon 06 00029 g018
Figure 19. Equivalent electric model of the dynamic operation of a PEMEL.
Carbon 06 00029 g019
Figure 20. Comparison of the voltage response between a static and a dynamic model [24].
Carbon 06 00029 g020
Figure 21. Stacked interleaved DC–DC buck converter connected to a PEMEL.
Carbon 06 00029 g021
Figure 22. Bode diagram of the transfer function of the stacked interleaved buck converter (SIBC) either with a static or a dynamic model.
Carbon 06 00029 g022
Figure 23. Step response of the SIBC either by considering a static or dynamic model.
Carbon 06 00029 g023
Figure 24. Slow response of the system with the dynamic model.
Carbon 06 00029 g024
Table 1. Specifications of the PEMEL.
ParametersValueUnit
Rated electrical power400W
Stack operating voltage 8V
Stack current range0–50A
Delivery output pressure 0.1–10.5bar
Cells number, N3-
Active area Section50cm2
Hydrogen flow rate at STP (Standard Temperature and Pressure, 20 °C and 1 bar)1slpm (standard liter per minute)
P = 1 bar, T = 20 °C