

Preparation of Silicon Oxide-Carbon Composite with Tailored Electrochemical Properties for Anode in Lithium-Ion Batteries

Abstract
:
1. Introduction
2. Materials and Methods
2.1. Materials
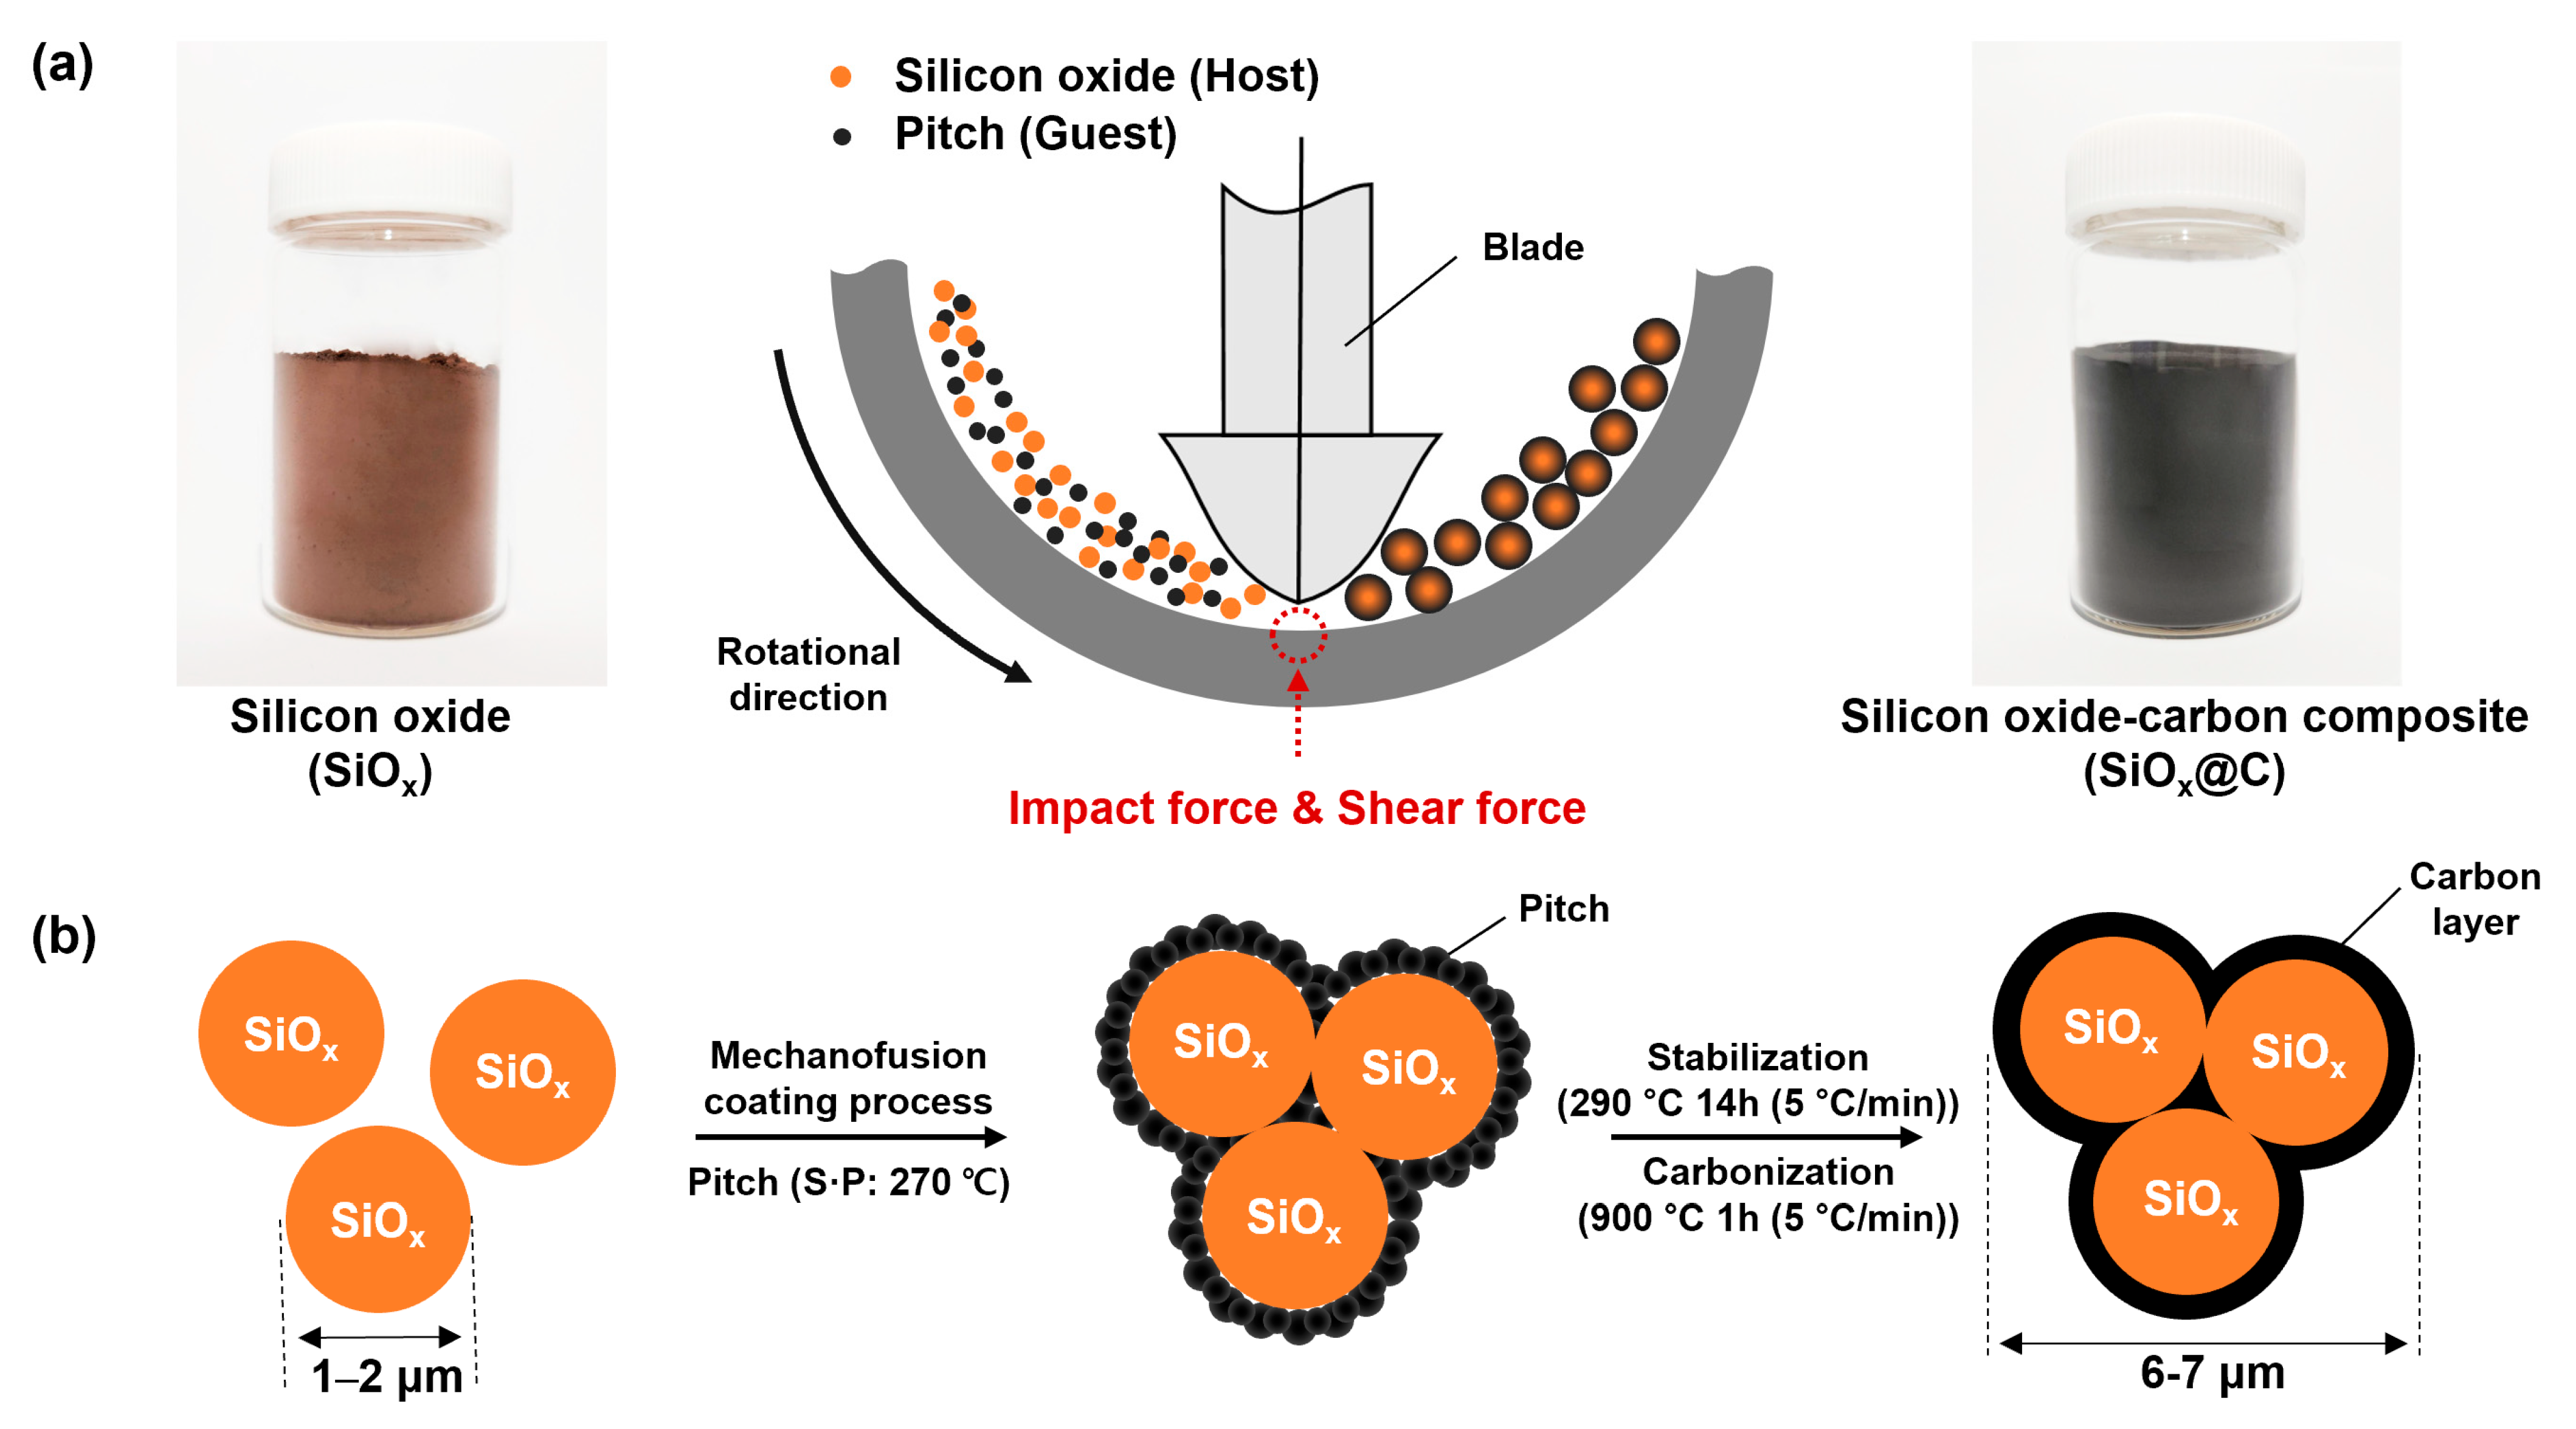
2.2. Fabrication of SiOx@C Composites
2.3. Fabrication of SiOx@C Composite Anode Half Cell
2.4. Characterizations
3. Results and Discussion
3.1. Mechanofusion-Derived SiOx@C Composites
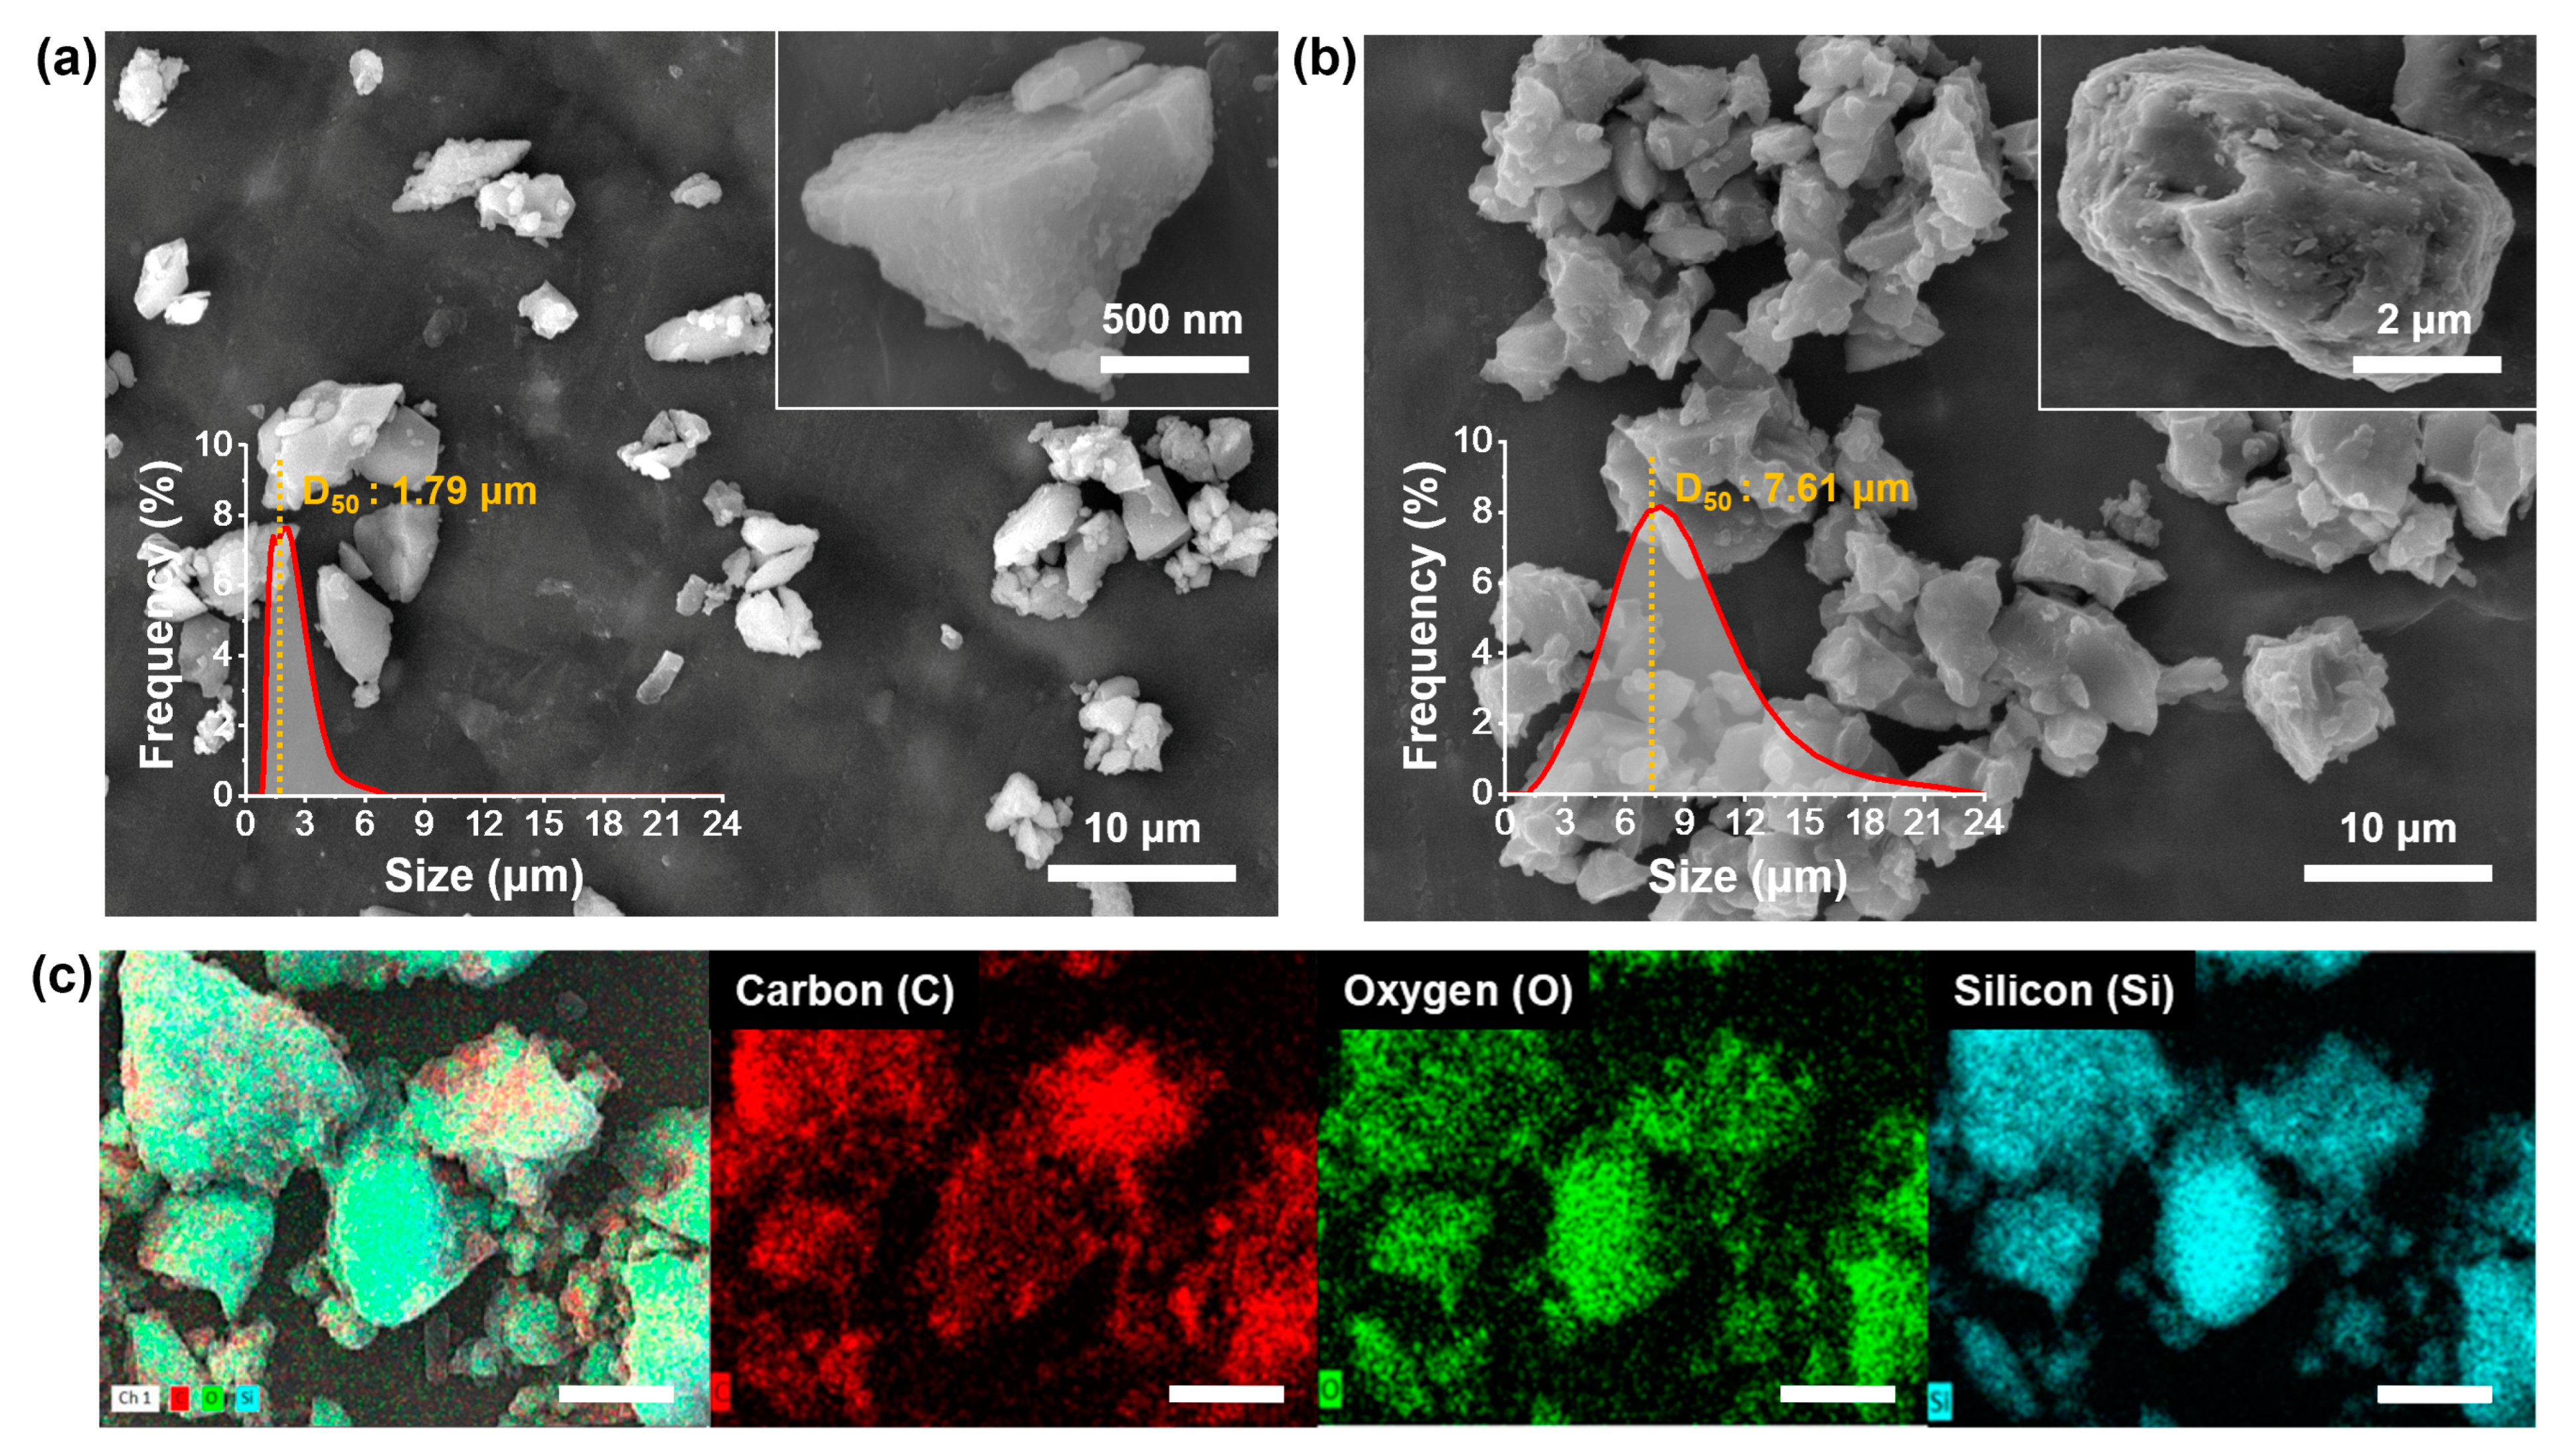
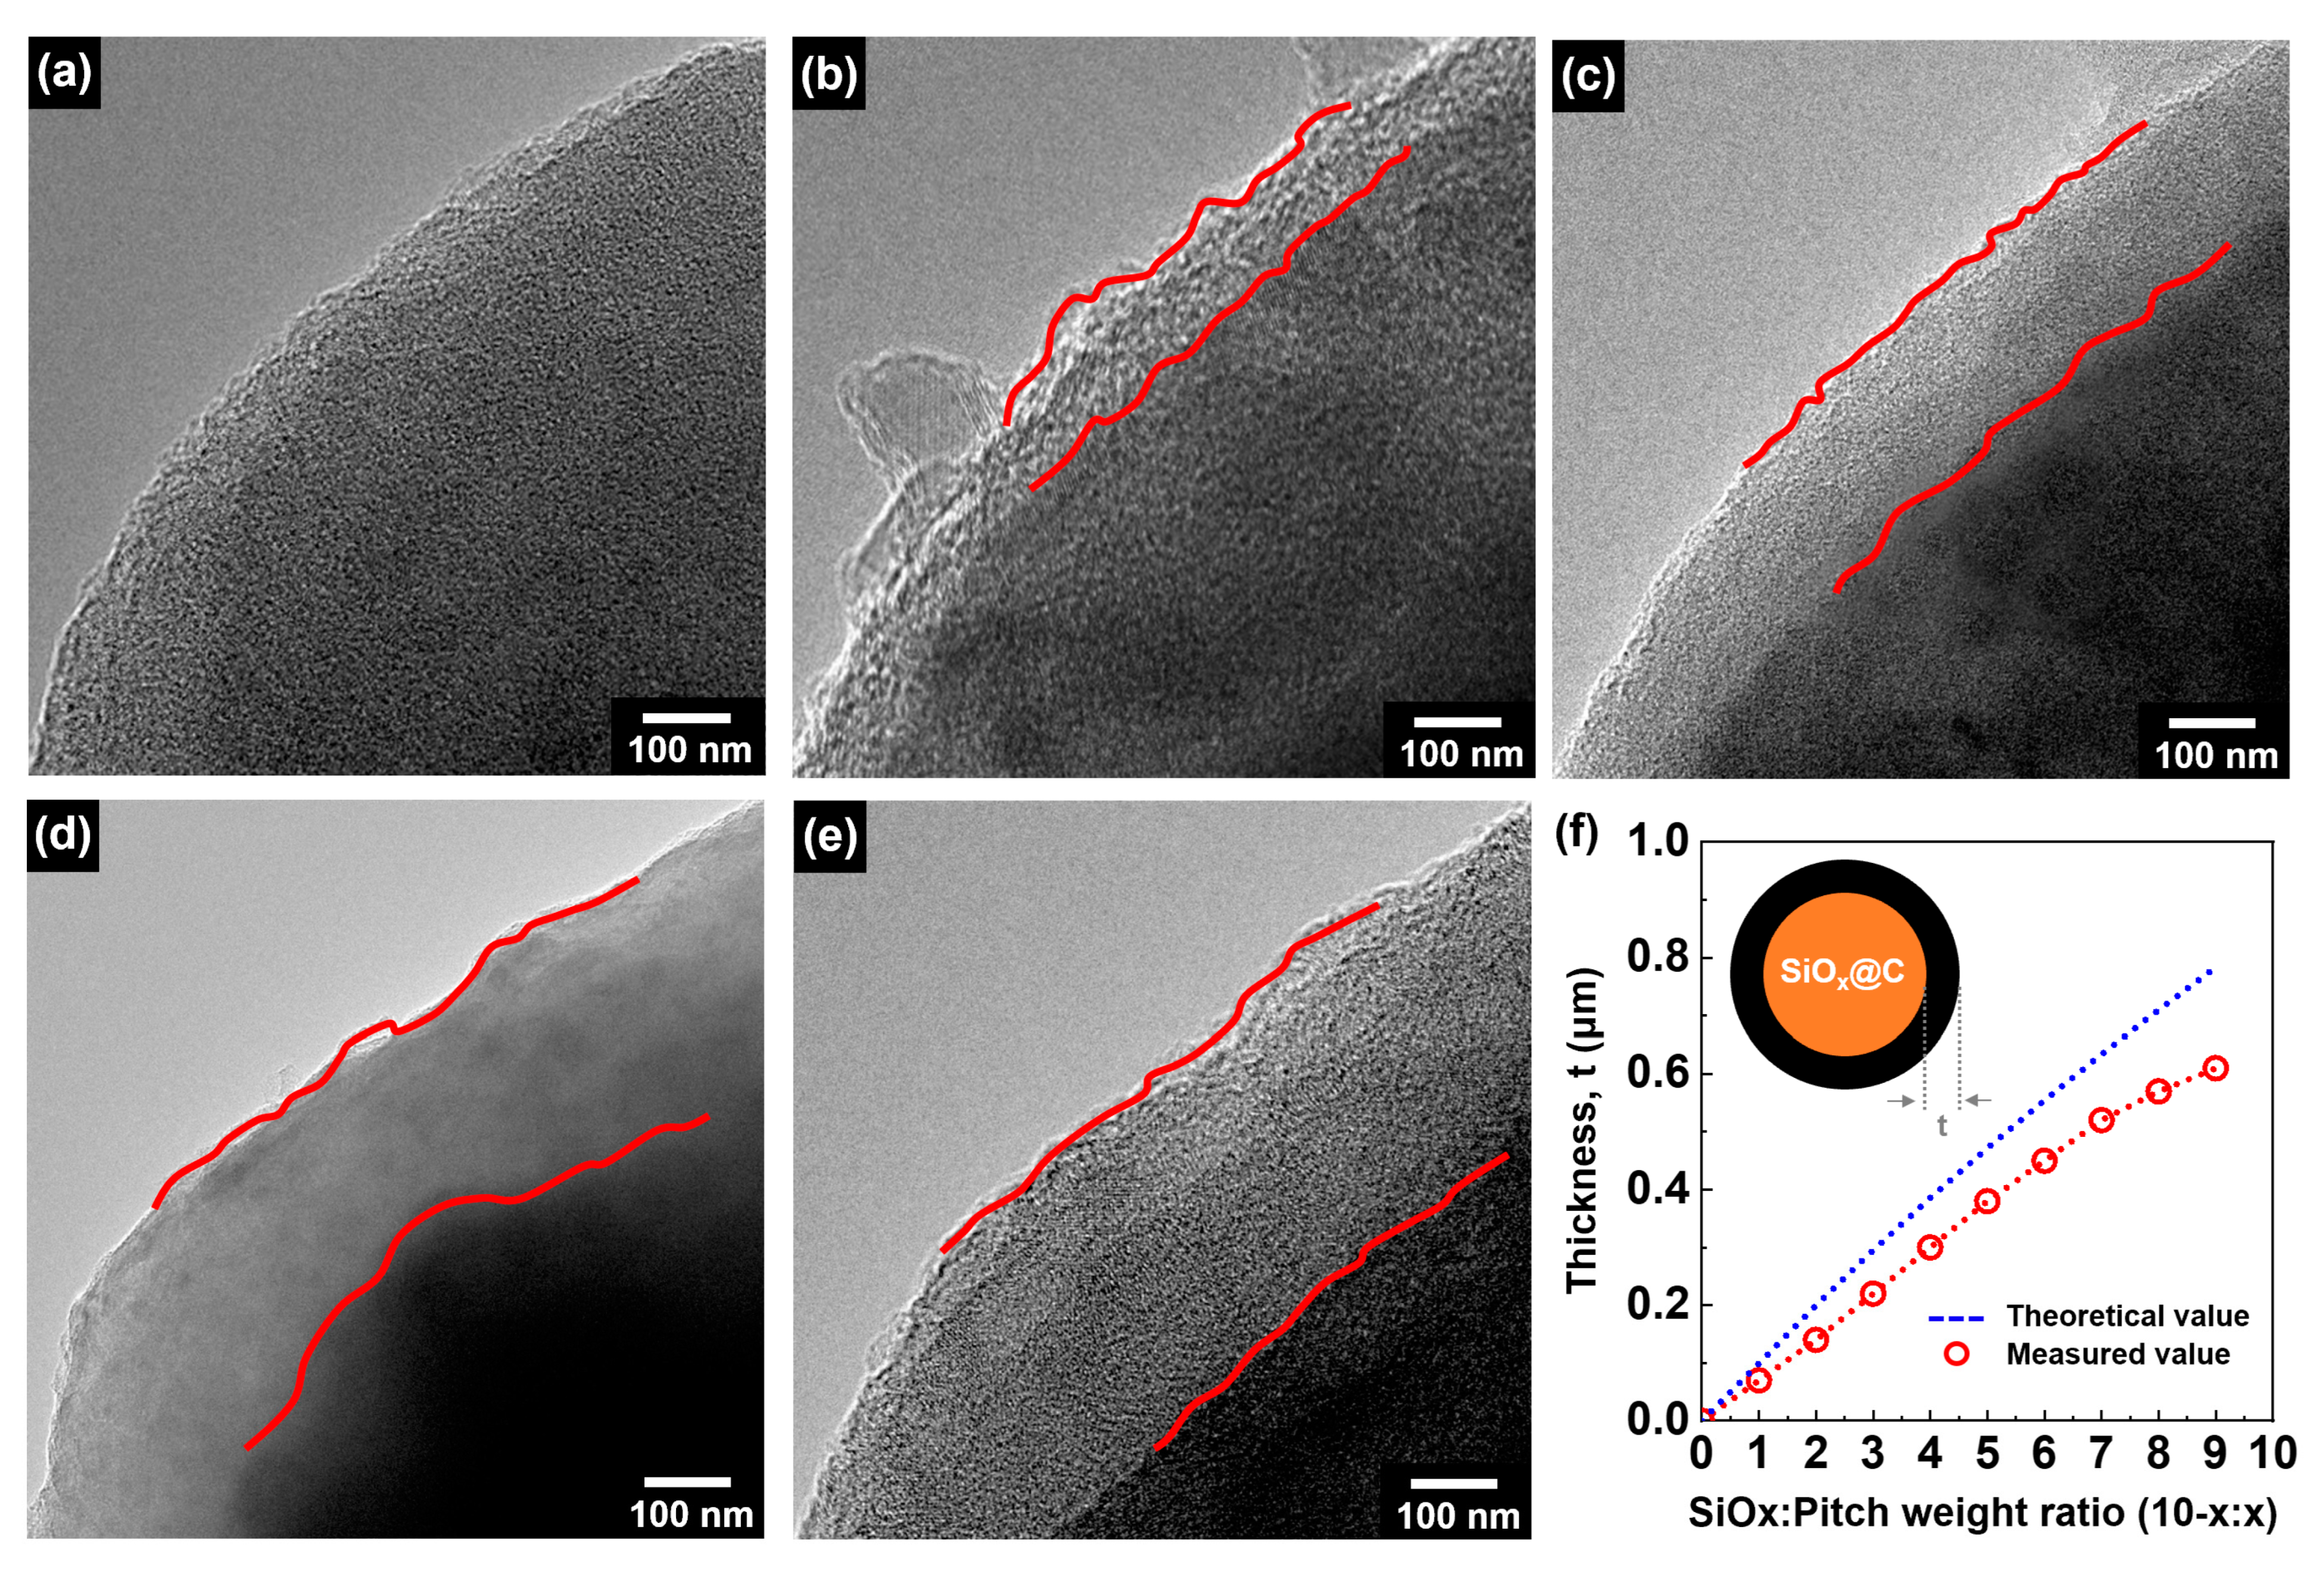
3.2. Characterization of SiOx@C Composites
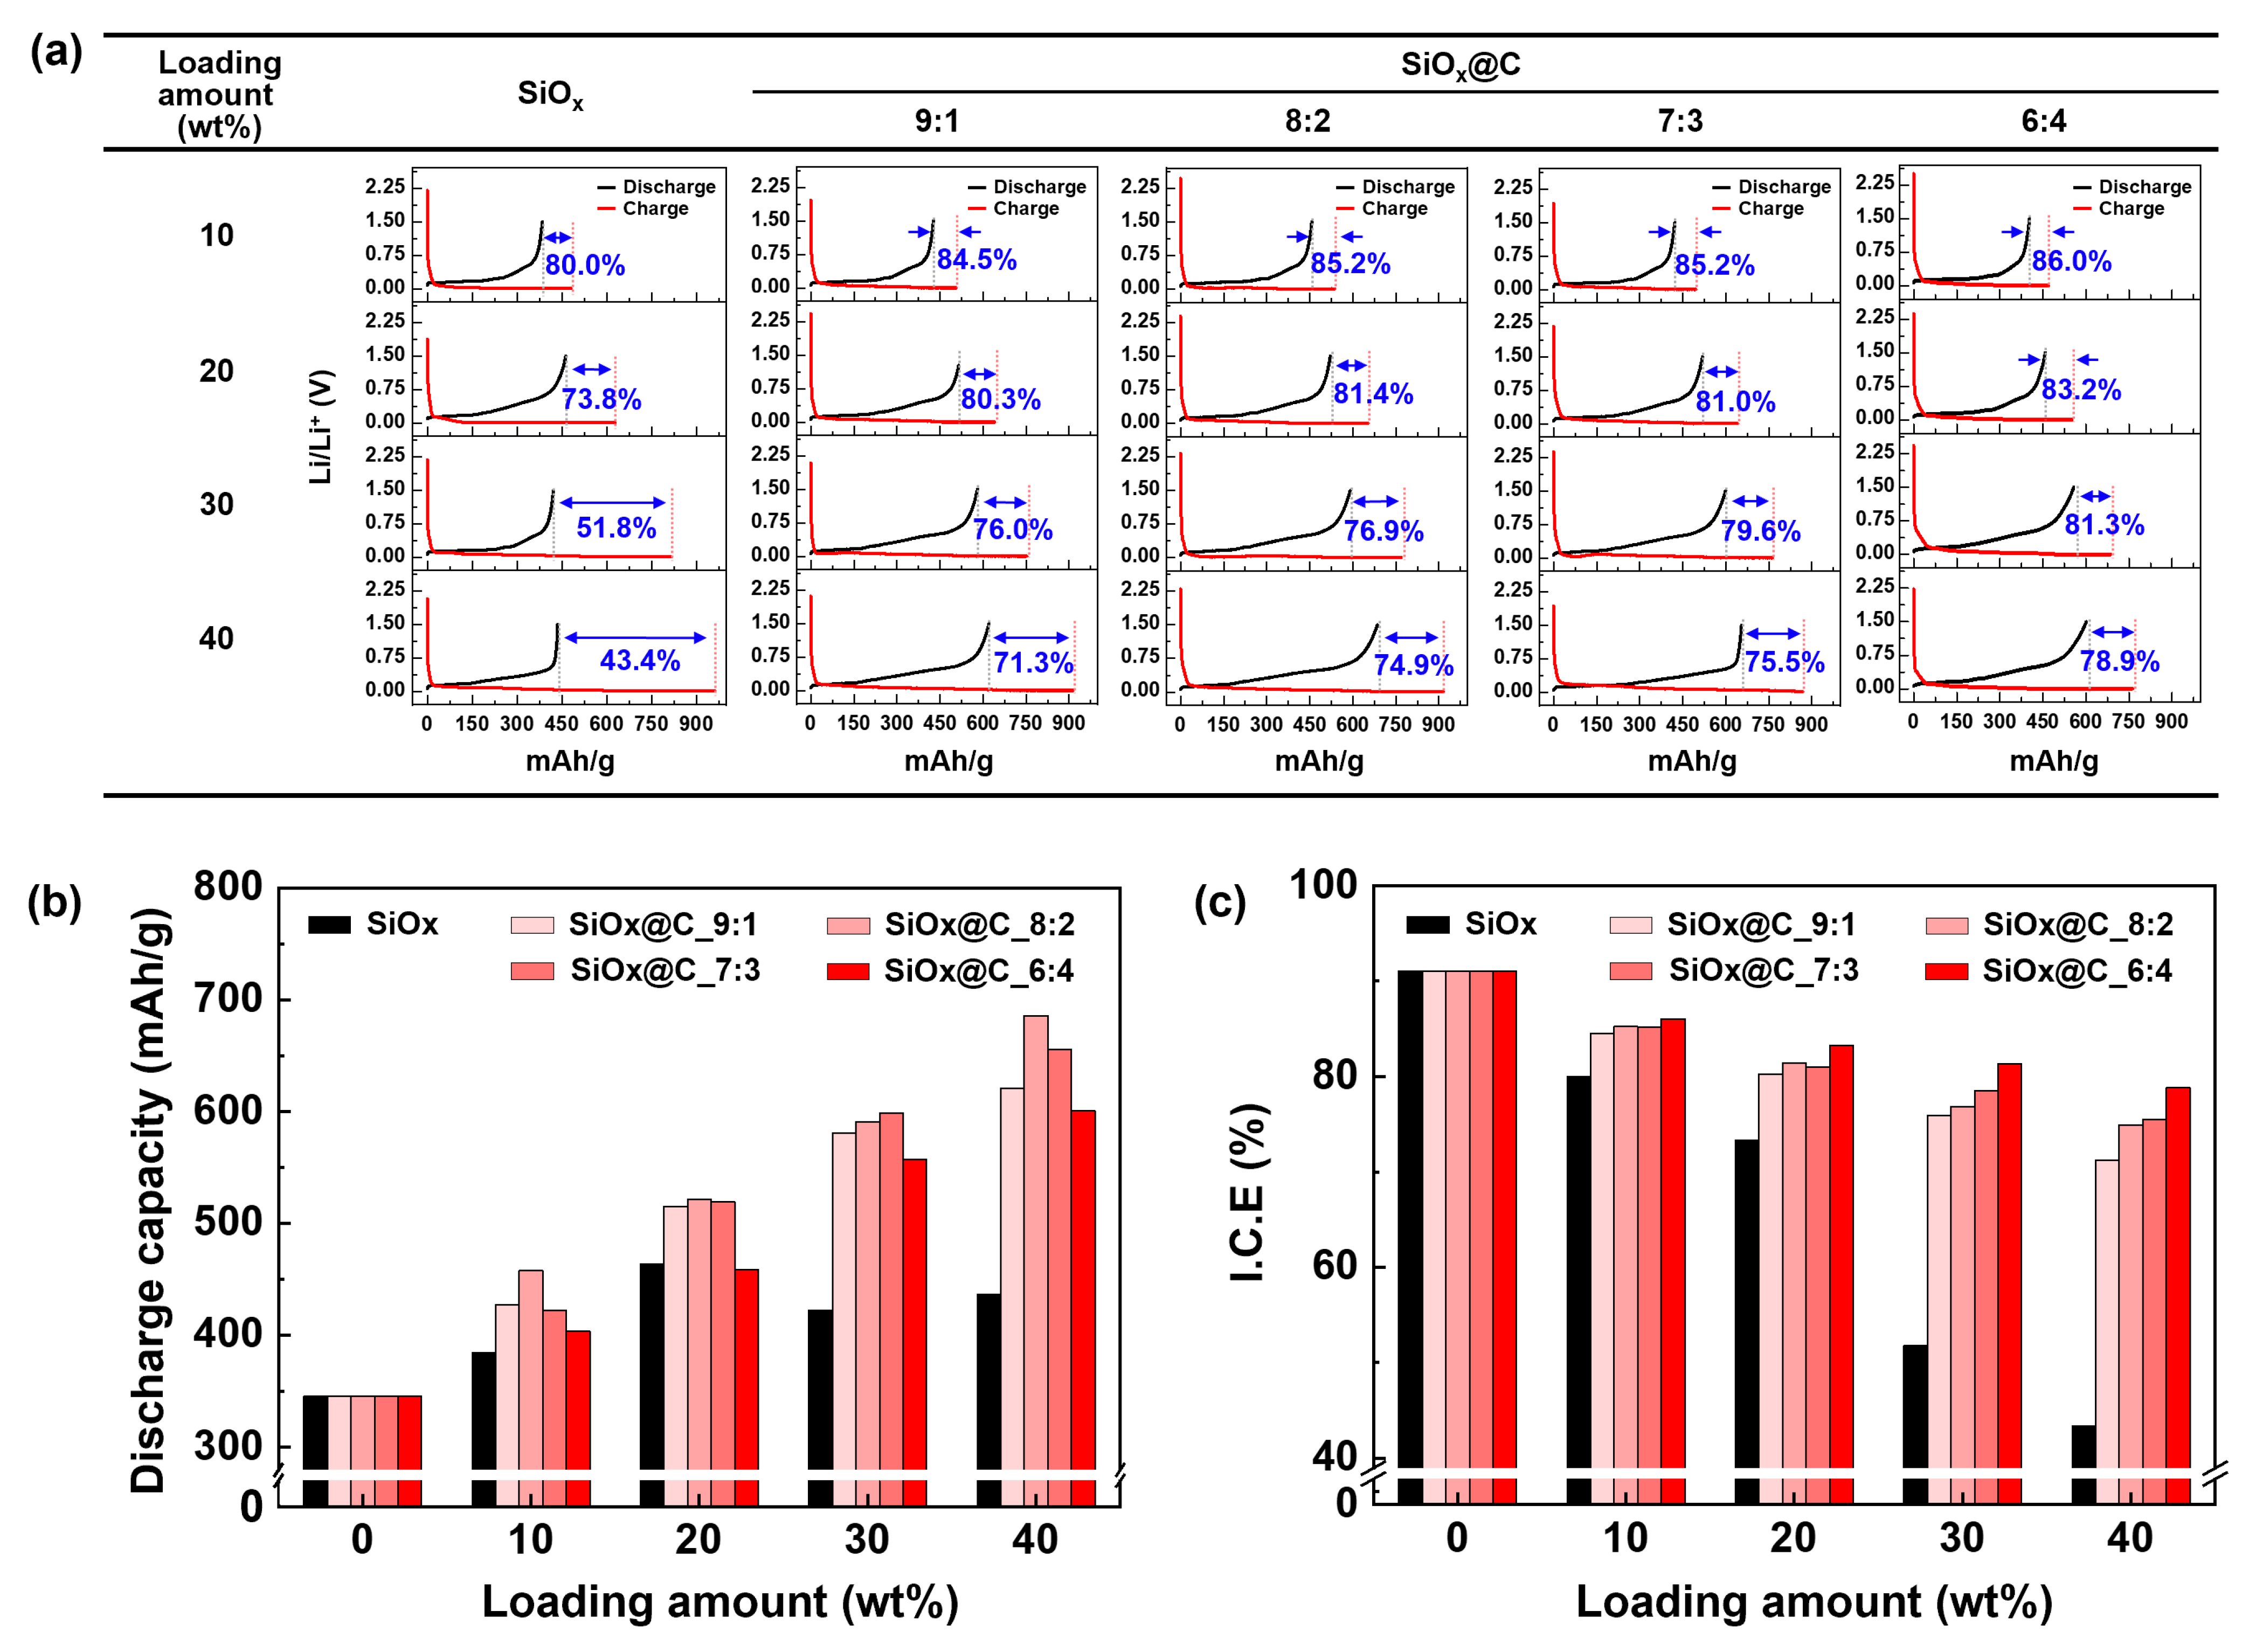
3.3. Battery Performance Evaluation of SiOx@C Composite Anode
4. Conclusions
Supplementary Materials
Author Contributions
Funding
Data Availability Statement
Conflicts of Interest
References
- Jin, Y.; Li, S.; Kushima, A.; Zheng, X.; Sun, Y.; Xie, J.; Sun, J.; Xue, W.; Zhou, G.; Wu, J.; et al. Self-healing SEI enables full-cell cycling of a silicon-majority anode with a coulombic efficiency exceeding 99.9%. Energy Environ. Sci. 2017, 10, 580–592. [Google Scholar] [CrossRef]
- Liu, N.; Liu, J.; Jia, D.; Huang, Y.; Luo, J.; Mamat, X.; Yu, Y.; Dong, Y.; Hu, G. Multi-core yolk-shell like mesoporous double carbon-coated silicon nanoparticles as anode materials for lithium-ion batteries. Energy Storage Mater. 2019, 18, 165–173. [Google Scholar] [CrossRef]
- Xu, Q.; Sun, J.-K.; Yu, Z.-L.; Yin, Y.-X.; Xin, S.; Yu, S.-H.; Guo, Y.-G. SiOx Encapsulated in Graphene Bubble Film: An Ultrastable Li-Ion Battery Anode. Adv. Mater. 2018, 30, 1707430. [Google Scholar] [CrossRef] [PubMed]
- Liang, Y.; Ding, W.; Yao, B.; Zheng, F.; Smirnova, A.; Gu, Z. Mediating Lithium Plating/Stripping by Constructing 3D Au@Cu Pentagonal Pyramid Array. Batteries 2023, 9, 279. [Google Scholar] [CrossRef]
- Shi, L.; Pang, C.; Chen, S.; Wang, M.; Wang, K.; Tan, Z.; Gao, P.; Ren, J.; Huang, Y.; Peng, H.; et al. Vertical graphene growth on SiO microparticles for stable lithium ion battery anodes. Nano Lett. 2017, 17, 3681–3687. [Google Scholar] [CrossRef] [PubMed]
- Yu, H.; Wang, Y.; Jing, Y.; Ma, J.; Du, C.F.; Yan, Q. Surface Modified MXene-Based Nanocomposites for Electrochemical Energy Conversion and Storage. Small 2019, 15, 1901503. [Google Scholar] [CrossRef]
- Jia, L.; Zou, P.; Gao, X.; Zhao, Y.; He, M.H.; Engelhard, S.D.; Burton, H.; Wang, H.; Ren, X.; Li, Q.; et al. High-performance silicon anodes enabled by nonflammable localized high-concentraion electrolytes. Adv. Energy Mater. 2019, 9, 1900784. [Google Scholar] [CrossRef]
- Yi, R.; Zai, J.; Dai, F.; Gordin, M.L.; Wang, D. Dual conductive network-enabled graphene/Si–C composite anode with high areal capacity for lithium-ion batteries. Nano Energy 2014, 6, 211–218. [Google Scholar] [CrossRef]
- Shi, L.; Wang, W.K.; Wang, A.B.; Yuan, K.G.; Jin, Z.Q.; Yang, Y.S. Scalable synthesis of core-shell structured SiOx/nitrogen-doped carbon composite as a high-performance anode material for lithium-ion batteries. J. Power Sources 2016, 318, 184–191. [Google Scholar] [CrossRef]
- Guo, J.; Dong, D.; Wang, J.; Liu, D.; Yu, X.; Zheng, Y.; Wen, Z.; Lei, W.; Deng, Y.; Wang, J.; et al. Silicon-based lithium ion battery systems: State-of-the-art from half and full cell viewpoint. Adv. Funct. Mater. 2021, 31, 2102546. [Google Scholar] [CrossRef]
- Jiao, M.; Wang, Y.; Ye, C.; Wang, C.; Zhang, W.; Liang, C. High-capacity SiOx (0 ≤ x ≤ 2) as promising anode materials for next-generation lithium-ion batteries. J. Alloys Compd. 2020, 842, 155774. [Google Scholar] [CrossRef]
- Zhang, K.; Mao, H.; Gu, X.; Song, C.; Yang, J.; Qian, Y. ZIF-Derived Cobalt-Containing N-Doped Carbon-Coated SiOx Nanoparticles for Superior Lithium Storage. ACS Appl. Mater. Interfaces 2020, 12, 7206–7211. [Google Scholar] [CrossRef] [PubMed]
- Feng, K.; Li, M.; Liu, W.; Kashkooli, A.G.; Xiao, X.; Cai, M.; Chen, Z. Silicon-based anodes for lithium-ion batteries: From fundamentals to practical applications. Small 2018, 14, 1702737. [Google Scholar] [CrossRef] [PubMed]
- Jeong, H.S.; Kim, J.S.; Jo, K.I.; Choi, J.H.; Koo, J.S. Oriented wrinkle textures of free-standing graphene nanosheets: Application as a high-performance lithium-ion battery anode. Carbon Lett. 2021, 31, 277–285. [Google Scholar] [CrossRef]
- Park, M.; Lee, D.; Shin, S.; Kim, H.-J.; Hyun, J. Flexible conductive nanocellulose combined with silicon nanoparticles and polyaniline. Carbohydr. Polym. 2016, 140, 43–50. [Google Scholar] [CrossRef] [PubMed]
- Ren, W.-F.; Li, J.-T.; Huang, Z.-G.; Deng, L.; Zhou, Y.; Huang, L.; Sun, S.-G. Fabrication of Si Nanoparticles@ Conductive Carbon Framework@ Polymer Composite as High-Areal-Capacity Anode of Lithium-Ion Batteries. ChemElectroChem 2018, 5, 3258–3265. [Google Scholar] [CrossRef]
- Choi, S.; Kwon, T.-W.; Coskun, A.; Choi, J.W. Highly elastic binders integrating polyrotaxanes for silicon microparticle anodes in lithium ion batteries. Science 2007, 357, 279–283. [Google Scholar] [CrossRef] [PubMed]
- Xin, Y.; Pan, S.; Hu, X.; Miao, C.; Nie, S.; Mou, H.; Xiao, W. Engineering amorphous SnO2 nanoparticles integrated into porous N-doped carbon matrix as high-performance anode for lithium-ion batteries. J. Colloid Interface Sci. 2023, 639, 133–144. [Google Scholar] [CrossRef]
- Lee, S.J.; Kim, H.J.; Hwang, T.H.; Choi, S.; Park, S.H.; Deniz, E.; Jung, D.S.; Choi, J.W. Delicate Structural Control of Si–SiOx–C Composite via High-Speed Spray Pyrolysis for Li-Ion Battery Anodes. Nano Lett. 2017, 17, 1870–1876. [Google Scholar] [CrossRef]
- Wang, D.; Gao, M.; Pan, H.; Wang, J.; Liu, Y. High performance amorphous-Si@ SiOx/C composite anode materials for Li-ion batteries derived from ball-milling and in situ carbonization. J. Power Sources 2014, 256, 190–199. [Google Scholar] [CrossRef]
- Umeno, T.; Fukuda, K.; Wang, H.; Dimov, N.; Iwao, T.; Yoshio, M. Novel anode material for lithium-ion batteries: Carbon-coated silicon prepared by thermal vapor decomposition. Chem. Lett. 2001, 30, 1186–1187. [Google Scholar] [CrossRef]
- Mukhan, O.; Umirov, N.; Lee, B.-M.; Yun, J.-S.; Choi, J.-H.; Kim, S.-S. A Facile Carbon Coating on Mg-Embedded SiOx Alloy for Fabrication of High-Energy Lithium-Ion Batteries. Adv. Mater. Interfaces 2022, 21, 2201426. [Google Scholar] [CrossRef]
- Kim, D.S.; Kim, K.H.; Lim, C.H.; Lee, C.; Lee, Y.S. Carbon-coated SiOx anode materials via PVD and pyrolyzed fuel oil to achieve lithium-ion batteries with high cycling stability. Carbon Lett. 2022, 32, 321–328. [Google Scholar] [CrossRef]
- Xu, Q.; Sun, J.-K.; Yin, Y.-X.; Guo, Y.-G. Facile Synthesis of Blocky SiOx/C with Graphite-Like Structure for High-Performance Lithium-Ion Battery Anodes. Adv. Funct. Mater. 2018, 28, 1705235. [Google Scholar] [CrossRef]
- Zuo, X.; Zhu, J.; Müller-Buschbaum, P.; Cheng, Y.-J. Silicon based lithium-ion battery anodes: A chronicle perspective review. Nano Energy 2017, 31, 113–143. [Google Scholar] [CrossRef]
- Zhang, M.; Zhang, T.; Ma, Y.; Chen, Y. Latest development of nanostructured Si/C materials for lithium anode studies and applications. Energy Storage Mater. 2016, 4, 1–14. [Google Scholar] [CrossRef]
- Shaker, M.; Ghazvini, A.A.S.; Qureshi, F.R.; Reza, R. A criterion combined of bulk and surface lithium storage to predict the capacity of porous carbon lithium-ion battery anodes: Lithium-ion battery anode capacity prediction. Carbon Lett. 2021, 31, 985–990. [Google Scholar] [CrossRef]
- Cao, Y.; Hatchard, T.D.; Dunlap, R.A.; Obrovac, M.N. Mechanofusion-Derived Si-Alloy/Graphite Composite Electrode Materials for Li-Ion Batteries. J. Mater. Chem. A 2019, 7, 8335–8343. [Google Scholar] [CrossRef]
- Choi, J.-E.; Ko, S.; Jeon, Y.-P. Preparation of petroleum impregnating pitches from pyrolysis fuel oil using two-step heat treatments. Carbon Lett. 2019, 29, 369–376. [Google Scholar] [CrossRef]
- An, D.; Kim, K.H.; Lim, C.; Lee, Y.-S. Effect of kneading and carbonization temperature on the structure of the carbon block for thermally conductive bulk graphites. Carbon Lett. 2021, 31, 1357–1364. [Google Scholar] [CrossRef]
- Jo, M.; Sim, S.; Kim, J.; Oh, P.; Son, Y. Micron-Sized SiOx-Graphite Compound as Anode Materials for Commercializable Lithium-Ion Batteries. Nanomaterials 2022, 12, 1956. [Google Scholar] [CrossRef] [PubMed]
- Matthews, M.J.; Pimenta, M.A.; Dresselhaus, G.; Dresselhaus, M.S.; Endo, M. Origin of dispersive effects of the Raman D band in carbon materials. Phys. Rev. B 1999, 59, R6585. [Google Scholar] [CrossRef]
- Xu, M.; Tan, C. Defect Size Effect and Defect Band Conduction of Ultrathin Oxides After Degradation and Breakdown. Electron Device Lett. 2009, 30, 410–412. [Google Scholar]
- Xia, Y.; Yoshio, M.; Noguchi, H. Improved electrochemical performance of LiFePO4 by increasing its specific surface area. Electrochim. Acta 2006, 52, 240–245. [Google Scholar] [CrossRef]
- Wang, Z.Y.; Zhang, H.H.; Zhang, X.Y.; Wang, X.M.; Zhang, X. Yolk-shell porous Fe3O4@C anchored on graphene as anode for Li-ion half/full batteries with high rate capability and long cycle life. Compos. B Eng. 2022, 247, 110308. [Google Scholar] [CrossRef]
- Li, G.; Huang, L.-B.; Yan, M.-Y.; Li, J.-Y.; Jiang, K.-C.; Yin, Y.-X.; Xin, S.; Xu, Q.; Guo, Y.-G. An integral interface with dynamically stable evolution on micron-sized SiOx particle anode. Nano Energy 2020, 74, 104890. [Google Scholar] [CrossRef]
- Hernandha, R.F.H.; Rath, P.C.; Umesh, B.; Patra, J.; Huang, C.-Y.; Wu, W.-W.; Dong, Q.-F.; Li, J.; Chang, J.-K. Supercritical CO2-Assisted SiOx/Carbon Multi-Layer Coating on Si Anode for Lithium-Ion Batteries. Adv. Funct. Mater. 2021, 31, 2104135. [Google Scholar] [CrossRef]


| Sample | SiOx | SiOx@C Composite |
|---|---|---|
| SBET (1) (m2/g) | 9.06 | 6.00 |
| Vtotal (2) (cm3/g) | 0.021 | 0.096 |
| Micropore volume fraction (%) | 1.6 | 4.4 |
| Mesopore volume fraction (%) | 50.9 | 59.3 |
| Macropore volume fraction (%) | 47.5 | 36.3 |
| Average pore size (nm) (3) | 14.7 | 8.68 |
Disclaimer/Publisher’s Note: The statements, opinions and data contained in all publications are solely those of the individual author(s) and contributor(s) and not of MDPI and/or the editor(s). MDPI and/or the editor(s) disclaim responsibility for any injury to people or property resulting from any ideas, methods, instructions or products referred to in the content. |
© 2023 by the authors. Licensee MDPI, Basel, Switzerland. This article is an open access article distributed under the terms and conditions of the Creative Commons Attribution (CC BY) license (https://creativecommons.org/licenses/by/4.0/).
Share and Cite
Kim, S.J.; Ha, S.-J.; Lee, J.U.; Jeon, Y.-P.; Hong, J.-Y. Preparation of Silicon Oxide-Carbon Composite with Tailored Electrochemical Properties for Anode in Lithium-Ion Batteries. C 2023, 9, 114. https://doi.org/10.3390/c9040114
Kim SJ, Ha S-J, Lee JU, Jeon Y-P, Hong J-Y. Preparation of Silicon Oxide-Carbon Composite with Tailored Electrochemical Properties for Anode in Lithium-Ion Batteries. C. 2023; 9(4):114. https://doi.org/10.3390/c9040114
Chicago/Turabian StyleKim, Sang Jin, Seung-Jae Ha, Jea Uk Lee, Young-Pyo Jeon, and Jin-Yong Hong. 2023. "Preparation of Silicon Oxide-Carbon Composite with Tailored Electrochemical Properties for Anode in Lithium-Ion Batteries" C 9, no. 4: 114. https://doi.org/10.3390/c9040114