Article

Graphene and Nanoclay as Processing Aid Agents: A Study on Rheological Behavior in Polystyrene

1
Ecole de Technologie Supérieure, Department of Mechanical Engineering, Montreal, QC H3C 1K3, Canada
2
NanoXplore Inc., Montreal, QC H4R 2P2, Canada
*
Author to whom correspondence should be addressed.
Submission received: 31 May 2023 / Revised: 15 September 2023 / Accepted: 18 September 2023 / Published: 7 October 2023

Abstract

:
The effectiveness of layered particles as processing aid agents in molten polystyrene was studied. Three graphene grades and two clays of different lateral size were selected for this purpose. The morphologies of the composites were observed using scanning electron microscopy. Steady shear measurements were carried out and the Carreau–Yasuda model with yield stress was applied to the experimental results. A decrease in viscosity was observed at 2 wt.% of particle content for almost all composites. The most efficient particle for reducing viscosity was found to be graphene in a loose agglomerated configuration. Graphene and clay particles with similar dispersion states had a similar effect on the viscosity, inducing a decrease by 29% and 22%, respectively, suggesting comparable efficiency as processing aid agents. The observed decrease in viscosity is attributed to the phenomenon of superlubricity, which is a lubricating mechanism that is closely linked to the atomic structure of the particles.

1. Introduction

Processing thermoplastics requires the polymer to be molten at high temperatures, which needs a high amount of energy because of the poor thermal conductivity of those materials. To ease the process, some processing aid agents can be added to improve flowability, mold filing, and mold release, as well as to reduce shark skin and postpone gross melt fracture to significantly higher shear rates [1,2,3]. In other words, adding a processing aid agent, or lubricant, can help to increase output or decrease energy consumption during processing.
Several types of processing agents exist, such as fluoropolymers, stearates, and boron nitride [1]. Hexagonal boron nitride in particular was shown to reduce storage and loss moduli and melt fracture and head pressure in extrusion [2,3]. For example, the addition of only 0.05 wt.% of h-BN has been shown to decrease the transient shear viscosity and extensional stress growth of HDPE [4]. On the other hand, other studies showed an increase in complex viscosity upon the addition of 5 to 30 wt.% of h-BN in PEI and PEEK, indicating that low contents of h-BN are necessary to act as a processing aid [5,6]. As with many 2D particles, it is also a solid lubricant that can be encountered in tribology studies as it helps in reducing friction and wear between two parts [7,8].
Other layered nanoparticles of great interest in tribology are carbon-based fillers such as graphene, which is also a 2D layered nanoparticle. Their low-friction behavior was discovered in 1928 [9,10]. First attributed to low shear resistance between adjacent atomic layers, it is now believed to be due to what is called the superlubricity phenomenon. Indeed, the interlayer shear strength of graphite was estimated to be between 0.2 MPa and 7 GPa, values which are not reached during common rheological tests [11]. On the other hand, superlubricity, occurring when friction between two surfaces vanishes or nearly vanishes, depends on the angle between two particles and does not require high shear. More specifically, this variation in friction has been shown to depend on the commensurability of the contact surfaces [12,13]. It means that depending on the atomic structure of the two surfaces, there are angles between two particles, known as commensurate angles, for which the atomic structure is aligned, leading to friction, and there are also incommensurate angles where ultra-low friction, and thus superlubricity, can be achieved [14]. Because of this interesting capacity, graphite and graphene are nowadays used as solid lubricants as well as additives in oil and water for lubricating fluids. To our knowledge, graphene is not commonly used in molten polymers as a processing aid agent or lubricant, but it could be an interesting candidate given its tribological properties [15]. In addition, it would complement the unique combination of functionalities of graphene, such as high mechanical strength, electrical conductivity [16,17,18], UV resistance [19], piezoelectric response enhancement [20], as well as the valorization of recycled plastics and mixed plastic waste streams [21,22]. Furthermore, recent toxicity studies performed on few-layer graphene industrial grades produced by the mechanochemical exfoliation of graphite have much lower health and safety concerns than other nanocarbons such carbon nanotube and carbon black [23].
As of today, few papers deal with the possibility of using solid particles aside from boron nitride as processing aid agents in molten polymers [24,25,26,27]. Although Yang Bai et al. showed that the addition of 16 wt.% of graphite led to a significant decrease from 2.103 to 7.102 Pa.s of complex viscosity whereas the addition of 30 wt.% of BN did not decrease significantly the complex viscosity, this effect was not explicitly discussed in the paper [24]. Recently, graphite, multi-layered graphene oxide, and carbon nanotubes were shown to decrease the viscosity of molten polymers, thus improving flowability [25,26,27]. Ferreira et al. [25] concluded that it was the superlubricity ability which promoted slipping between loose agglomerates which in turn led to lower viscosity. In their work, graphite oxide and multilayered graphene oxide had the most efficient lubricant effect, whereas graphite did not significantly decrease the viscosity of the polyolefin matrices. It was attributed to the fact that the oxidation of graphite caused fragmentation in numerous pieces, which created incommensurate contacts that were less numerous in graphite.
This superlubricity phenomenon is not exclusive to graphene and has been shown to exist in other 2D particles such as Molybdenum disulfide or even mica [28,29]. In particular, clays have been shown to display the superlubricity phenomenon as well, even if it has been rarely discussed. In another study, it was briefly pointed out that adding different clays into PMMA led to a decrease in viscosity in molten state. However, the mechanism was not further investigated in that paper as it was not the main focus. The paper instead focused on the effect of nanoclay as a compatibilizer in PMMA/PS blends [30]. Still, clay could be an interesting candidate as a processing aid agent.
In this work, the effect of the addition of graphene of different lateral sizes on the viscosity of polystyrene (PS) was studied. First, the morphology of graphene composites was observed using scanning electron microscopy (SEM). The shear viscosity was then obtained using a rotational rheometer, and Carreau–Yasuda’s model with yield stress was applied to quantify the effect of the filler particles on the viscosity. Throughout the paper, this model will be called modified Carreau–Yasuda. Finally, the addition of montmorillonite and laponite, two smectic clays, was studied as well and compared to graphene.

2. Materials and Methods

2.1. Materials

In this study, a polystyrene (PS), grade StyronTM 685D from AM Styrenics, The Woodlands, TX, USA, was used as the matrix. Five different layered particles were added to it. First, GrapheneBlackTM 3X and GrapheneBlackTM 0X graphene grades from NanoXplore, Montreal, QC, Canada, were used and will be referred to as 3X and 0X, respectively. As a means of comparison, another grade of graphene (xGnP H-25) previously acquired from XG Sciences, currently owned by NanoXplore, was used as well. This graphene will be designed as graphene H throughout the paper. Finally, two layered clays were used: a laponite (L) and a montmorillonite (MMT), from BYK, Wesel, Germany. All the information regarding the particles used is reported in Table 1.

2.2. Processing

A masterbatch of PS with 10 wt.% of each filler was prepared by melt-mixing using a Haake Rheomix OS PTW16 twin-screw extruder (Thermo Fisher Scientific Inc., Waltham, MA, USA) at 220 °C in all zones. The screw speed was adjusted to 100 rpm for all compositions. Prior to the masterbatch extrusion, the nanoclay powders were dried to avoid the moisture effect during processing. Then, dilutions into PS composites with concentrations varying from 0 to 2 wt.% were prepared using an internal mixer at 220 °C and 100 rpm. Neat PS underwent the same process in order to have the same thermomechanical history as the composites.
The composites were compression molded into discs of 25 mm diameter and 1.2 mm thickness at 10 MPa and 200 °C for 10 min.
The composites were named Psparticle-concentration. For example, PS0X-2 is PS containing 2 wt.% of GrapheneBlack™ 0X.

2.3. Characterizations

The morphology was observed by scanning electron microscopy (SEM) using a Hitachi TM3000 SEM at an accelerating voltage of 15 kV. Discs were fractured at room temperature and coated with gold prior to observations.
Rheological data were obtained using a stress-controlled rheometer MCR 501 from Anton Paar; the tests were carried out at 200 °C and under a nitrogen atmosphere. Steady shear tests were obtained using a cone-plate geometry with an angle of 0.985° and a gap of 0.048 mm. The shear rate varied from 0.001 to 100 s−1 using a logarithmic ramp rate. For all formulations, three samples were tested to obtain a mean value of viscosity over the shear rate.
X-ray diffraction (XRD) was carried out using a PANalytical diffractometer, model X’Pert Pro, with a cobalt radiation source of wavelength of 0.179 nm. Samples were tested at ambient temperature with 2θ ranging from 5 to 70 °C. From the obtained diffractometers, Braag’s law (Equation (1)) can be used to calculate the interlayer spacing between graphene sheets.
d = n λ 2 s i n θ
where λ is the X-ray wavelength in nanometers (nm), θ is the scattering angle, and n the diffraction order.

3. Results and Discussion

3.1. Morphology of Graphene Composites

In order to study the effect of graphene nanoplatelets’ average lateral size on the viscosity of a molten polymer matrix, three graphenes of different lateral sizes were used. To evaluate the dispersion state of the different particles in the prepared composites, XRD and SEM were performed on rheology disks in order to draw appropriate conclusions.
XRD was carried out on samples containing 2 wt.% of each graphene. The results are reported in Table 2. A sharp peak at 30.9 ° corresponding to the (002) Bragg reflection of graphene platelets was observed on the diffractograms. Using Braag’s law (1), the interlayer spacing was calculated to be 0.335 nm for each one of the samples, which is the same as graphite commonly found in the literature [31,32,33]. As the primary particles of graphene 0X and 3X were originally in stacks of 6 to 10 layers (supplier information), it indicates no exfoliation during extrusion. In order to visualize and conclude on the dispersion state of graphene, SEM imaging was used.
Figure 1 shows the morphology of polystyrene (PS) containing 2 wt.% of graphene 0X, graphene 3X, and graphene H. It was observed that graphene 0X tended to form loose agglomerates and create a rich area in the sample, as shown in Figure 1b. The whole image is a graphene-rich area with tightly packed and randomly oriented flakes. Aside from these areas, there were also well-distributed graphene regions (see Figure 1a). In the case of graphene 3X (Figure 1c) and graphene H (Figure 1d), the distribution was visually more homogeneous even if the size of platelets was larger on average.
Graphene is an allotrope of carbon where sp2 carbon atoms are arranged in a honeycomb lattice structure. Graphene structure is very stable and can be considered as the minimal unit of carbon materials [34]. π-π interaction, a type of Van der Waals force, is known to hold graphene sheets together at a distance of 0.335 nm [35,36]. Given that polystyrene has a mer unit containing an aromatic ring, a mechanism of interaction with graphene through π-π and CH-π interactions is possible [37]. However, the density in aromatic rings in PS is less than in graphene given that they are more spaced out by the carbon main chain of the macromolecule. This may explain why graphene keeps agglomerating instead of dispersing in PS.
In each sample, the average lateral size of the particles or the flakes, composed of few individual particles, was measured over fifty units. The values are reported in Table 3. In the case of graphene 3X, the flakes distributed in PS are larger, with a D50 of 12.6 µm, compared to 8.3 µm for 0X. However, the 3X was overall more homogeneously distributed: there were no rich phases nor poor phases in PS3X-2. Graphene H resulted in a dispersion and distribution similar to the one of graphene 3X even if graphene H had the largest initial particle size (25 µm as given by supplier in Table 1). In PS, graphene H is fairly well distributed, with a D50 of 9.6 µm, which is lower than the one of graphene 3X. However, the D90 of PSH-2 is higher than the one of PS3X-2. By taking into account their initial particle size reported in Table 1 and SEM images reported in Figure 1, it seems that the smallest graphene particles, i.e., graphene 0X, tend to form a less homogeneous distribution and more graphene-rich areas covered with loose agglomerates.
In order to associate the lubricant effect and the morphology, the viscosity of each composite was measured using a rotational rheometer and is discussed below.

3.2. Effect of Graphene on Shear Viscosity

Figure 2 compares the viscosity as a function of shear rate obtained in steady shear for all composites containing 0 to 5 wt.% of graphene 0X, 3X, and H. It can be seen that the shape of the curve depends on the graphene content. For low contents, the viscosity is similar to the one of neat PS. But more significant changes in the shape of the curve are observed with increasing graphene loadings.
To better quantify the effect of graphene on the viscosity curve, Carreau–Yasuda’s model can be used. This model is used widely for shear-thinning polymers and can be fitted to the shear viscosity with the following expressions:
η = η + η 0 η 1 + λ γ ˙ a n 1 a
η = η 0 1 + λ γ ˙ a n 1 a
where η is the viscosity at infinite shear, η0 the zero-shear viscosity, λ the relaxation time, n the power law index, and a the Yasuda parameter. The fit is made so that all parameters should be positive or equal to zero. More specifically, n is fixed to 0 and 0 ≤ λ ≤ 10.
Equation (2) is the original Carreau–Yasuda’s model developed in 1979 widely used to describe the shear-thinning behavior of most thermoplastic polymers [38]. In most cases, η can be set to zero as the second plateau value of the viscosity, as a very high shear rate is difficult to reach experimentally. Simplifying the expression of Carreau–Yasuda leads to Equation (2), which can be fitted to the pure matrix or composites of low contents. It adequately describes the plateau region at low shear rates followed by the shear-thinning region at higher shear rates. The most interesting parameters for this study are the zero-shear viscosity, η0, and the relaxation time, λ. The zero-shear viscosity corresponds to the plateau value at low shear rates, which is used as a viscosity reference value for polymers. In this paper, the evaluation of the lubricant effect was performed by studying the reduction in zero-shear viscosity. The relaxation time is also of interest, as the presence of particles will affect the relaxation behavior of the molten polymer matrix.
However, Equation (3) does not take into account the increase at low shear rates that can be observed at a higher graphene content. To take this effect into account, Vergnes proposed adding an apparent yield stress, σ0 [39]. Even though this previous work was conducted on the model for oscillatory shear, mathematically, the same can be done for the model in the case of steady shear.
The model becomes:
η = σ 0 γ ˙ + η 0 1 + λ γ ˙ a n 1 a
This apparent yield stress is an indicator of the presence of a stiff nanoparticle network which dominates the response at low shear rates [39,40,41].
The zero-shear viscosities, obtained by fitting the modified Carreau–Yasuda model to the shear viscosities of the graphene composites, are reported in Figure 3. At 1 wt.%, the zero-shear viscosities of the composites are similar to those of neat PS, indicating that graphene has no significant effect at this content.
At 5 wt.%, the viscosities of 3X and 0X composites are higher than those of neat PS. In this case, the graphene platelets are numerous enough to increase the viscosity as commonly observed in many other composites, which was predicted by Einstein to scale with particle volume fraction [42].
However, at 2 wt.%, the viscosities of composites containing graphene 0X and 3X are consistently lower than those of neat PS, while the decrease due to graphene H seems to be less significant. It can be concluded that there is a processing aid effect occurring at an optimal graphene concentration and that the efficiency of the particles, i.e., their ability to decrease viscosity, depends on the graphene used. As shown by SEM imaging, the distribution of graphene 0X is less homogeneous compared to the other graphene grade and forms significantly, yet it is the most efficient at decreasing viscosity. Also, graphene 3X was shown to agglomerate less than 0X but more than H. As graphene 3X has a lubricant effect in between 0X and H, it leads to the idea that the state of dispersion combined with the actual agglomerates’ size may be the key factor to control the lubricant effect.
Ferreira et al. [25,43] suggested that the superlubricity property of graphene and graphite plays a role in the reduction in viscosity. As discussed in the introduction, graphene, like many other 2D particles, is known to exhibit this superlubricity effect, which makes it a suitable lubricant in diverse applications. Superlubricity is when friction vanishes or nearly vanishes, and it is currently believed to be due to the atomic structure of graphene. As illustrated in Figure 4, when two flakes are in commensurate contact, i.e., at angles of 0°, 60°, 120°, 180°, 240°, and 300°, the flakes align in a structured manner, causing friction. When the flakes are in incommensurate contact (all other angles), the flakes’ structures do not align and there is slipping between the flakes. This is due to the 60 ° recurrence in the structure of the graphene layer. In a random distribution of graphene in a molten polymer, there is a much higher chance of being in incommensurate contact rather than commensurate contact. When particles slip suddenly, free volume increases, resulting in higher chain mobility and thus a lower viscosity.
It is worth mentioning that the π-π interactions discussed earlier seem to play an additional role at particular spatial arrangements, such as in the local friction phenomena described by the superlubricity theory. The presumptive additional noncovalent interaction could corroborate the superlubricity mechanism and be part of the explanation of why there is friction at specific angles.
In this study, the agglomeration of graphene seems to promote the lubricant effect, which is what was also observed in Ferreira et al.’s work [25]. It is believed that incommensurate contacts are promoted in between agglomerates rather than in between well-distributed particles. It can also be concluded that the concentration of graphene should be high enough to promote agglomeration but not so high as to create a particle network which would lead to an increase in viscosity. In terms of the size of graphene, in this case, the smallest initial lateral particle led to the bigger reduction in viscosity because it was more prone to agglomeration and not creating a network. Also, at the same weight of particles, the efficiency of slipping may be more significant for smaller particles, as the number of particles, and thus the quantity of slipping, will be greater.
Aside from the zero-shear viscosity, two other parameters from the modified Carreau–Yasuda model are of interest when investigating the effect of particles in a molten polymer matrix. The first one is the yield stress, σ0. This parameter allows the increase of viscosity to be taken into account at low shear rates only. It is commonly associated with the formation of a stiff particle network opposing the flow at low shear rates. At higher shear rates, the particle network can break, gradually releasing the particles that in time orient in the flow direction.
The yield stresses, obtained by fitting the modified Carreau–Yasuda model to the composite shear viscosities, are reported in Figure 5. It can be seen that even a minor increase in viscosity at low shear rates, as reported in Figure 2 for 2 wt.% of graphene 0X and H, induces a significant increase in yield stress. At 5 wt.%, graphene 3X induces the highest increase in yield stress, indicating that a stiff network of particles is created. It is expected that 5 wt.% of graphene H would lead to a significant increase in yield stress as well given its good distribution. It can be noticed that at 2 wt.% graphene 0X induces a decrease of viscosity as well as an increase in yield stress, indicating a competition between the lubricant effect and network stiffness in the viscosity curve.
Another interesting parameter to discuss is the relaxation time, λ. This parameter represents the transition between the Newtonian plateau and the power law behavior in shear viscosity. In other words, it is the transition between the entangled state and the disentanglement of polymer chains due to the flow [44]. In neat polymer matrices, entanglement and disentanglement states are known to depend on the molecular weight and polydispersity of the polymer chains. The relaxation times extracted from the fitting of the modified Carreau–Yasuda model on composites are reported in Figure 6. It can clearly be seen that adding 2 wt.% of graphene of any type decreases the relaxation time. It means that the addition of graphene leads to a faster relaxation of the polymer chains. It means that, while it is not obvious in Figure 2, the transition between the plateau region and power law behavior shifts from 16 s−1 to 50 s−1. Contrary to the reduction in viscosity, this decrease seems to be independent of the type of graphene added.
Of course, the addition of graphene cannot change the chain length, but it could help to disentangle molecular chains or increase free volume, as suggested in works where the incorporation of cross-linked PS nanoparticles to linear PS reduced viscosity [42,45]. In our case, the hypothesis that superlubricity is responsible for the viscosity decrease could be explained by the effect of increasing free volume: the sudden slipping of the graphene particles has the potential to create more free space, resulting in higher chain mobility and thus a smaller relaxation time.
Finally, the standard deviations of the zero-shear viscosity and yield stress are significantly larger in composites compared to neat PS. It is especially true for PS0X-2, where it was shown that the morphology is not homogeneous. It can also be noticed that for lower concentrations, the standard deviation is smaller, such as the PS standard deviation. The presence of loose agglomerates randomly distributed may be the key for obtaining the lubricant effect, but it leads to less stable measurements as well.
This superlubricity phenomenon is not exclusive to graphene and has been shown to exist in other 2D particles such as Molybdenum disulfide or even mica [28].

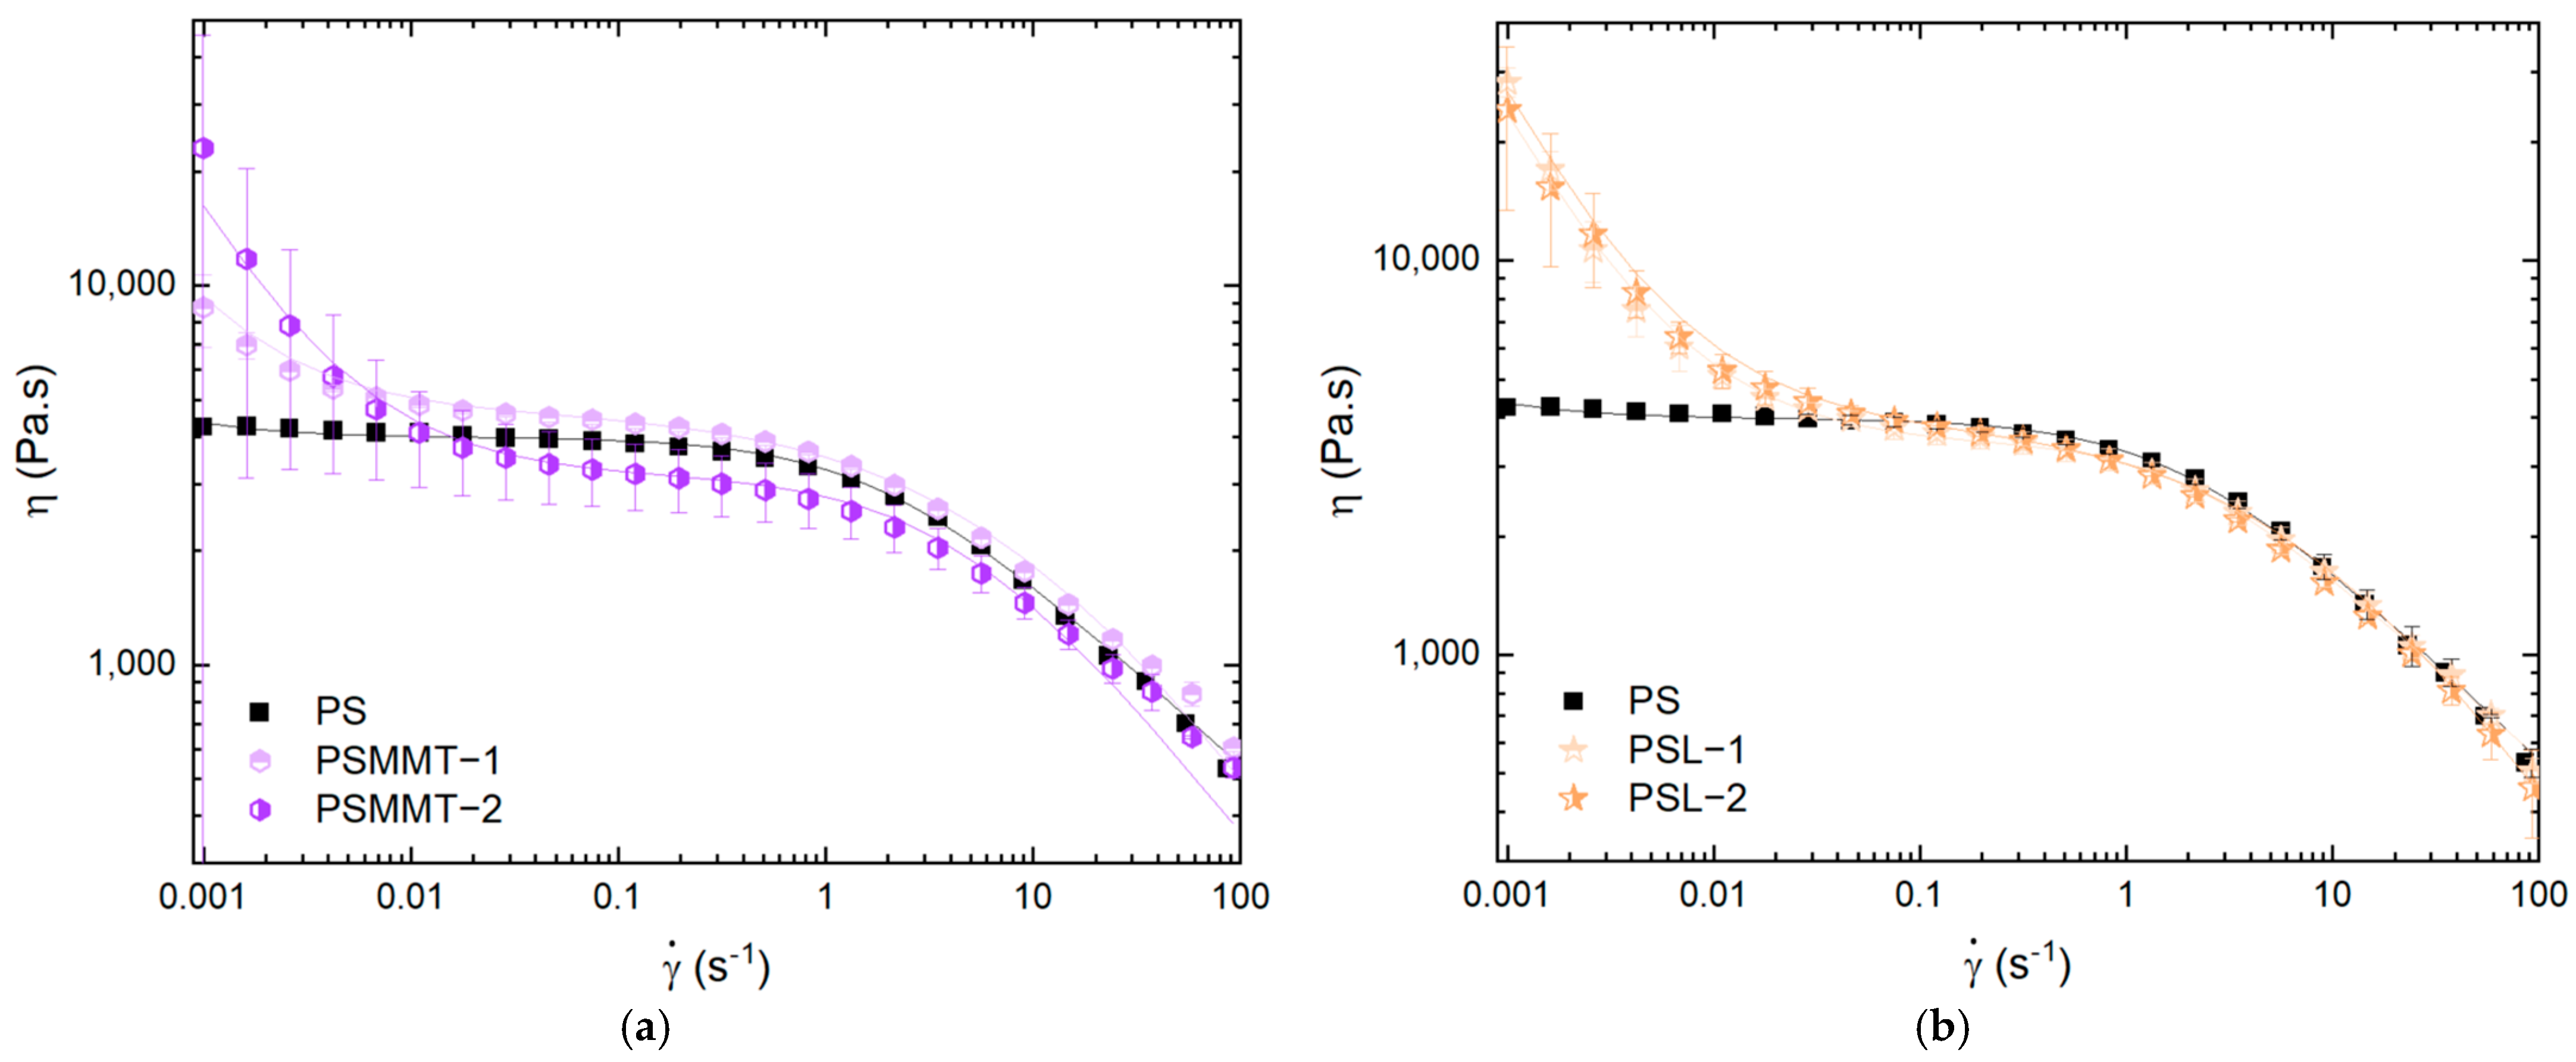
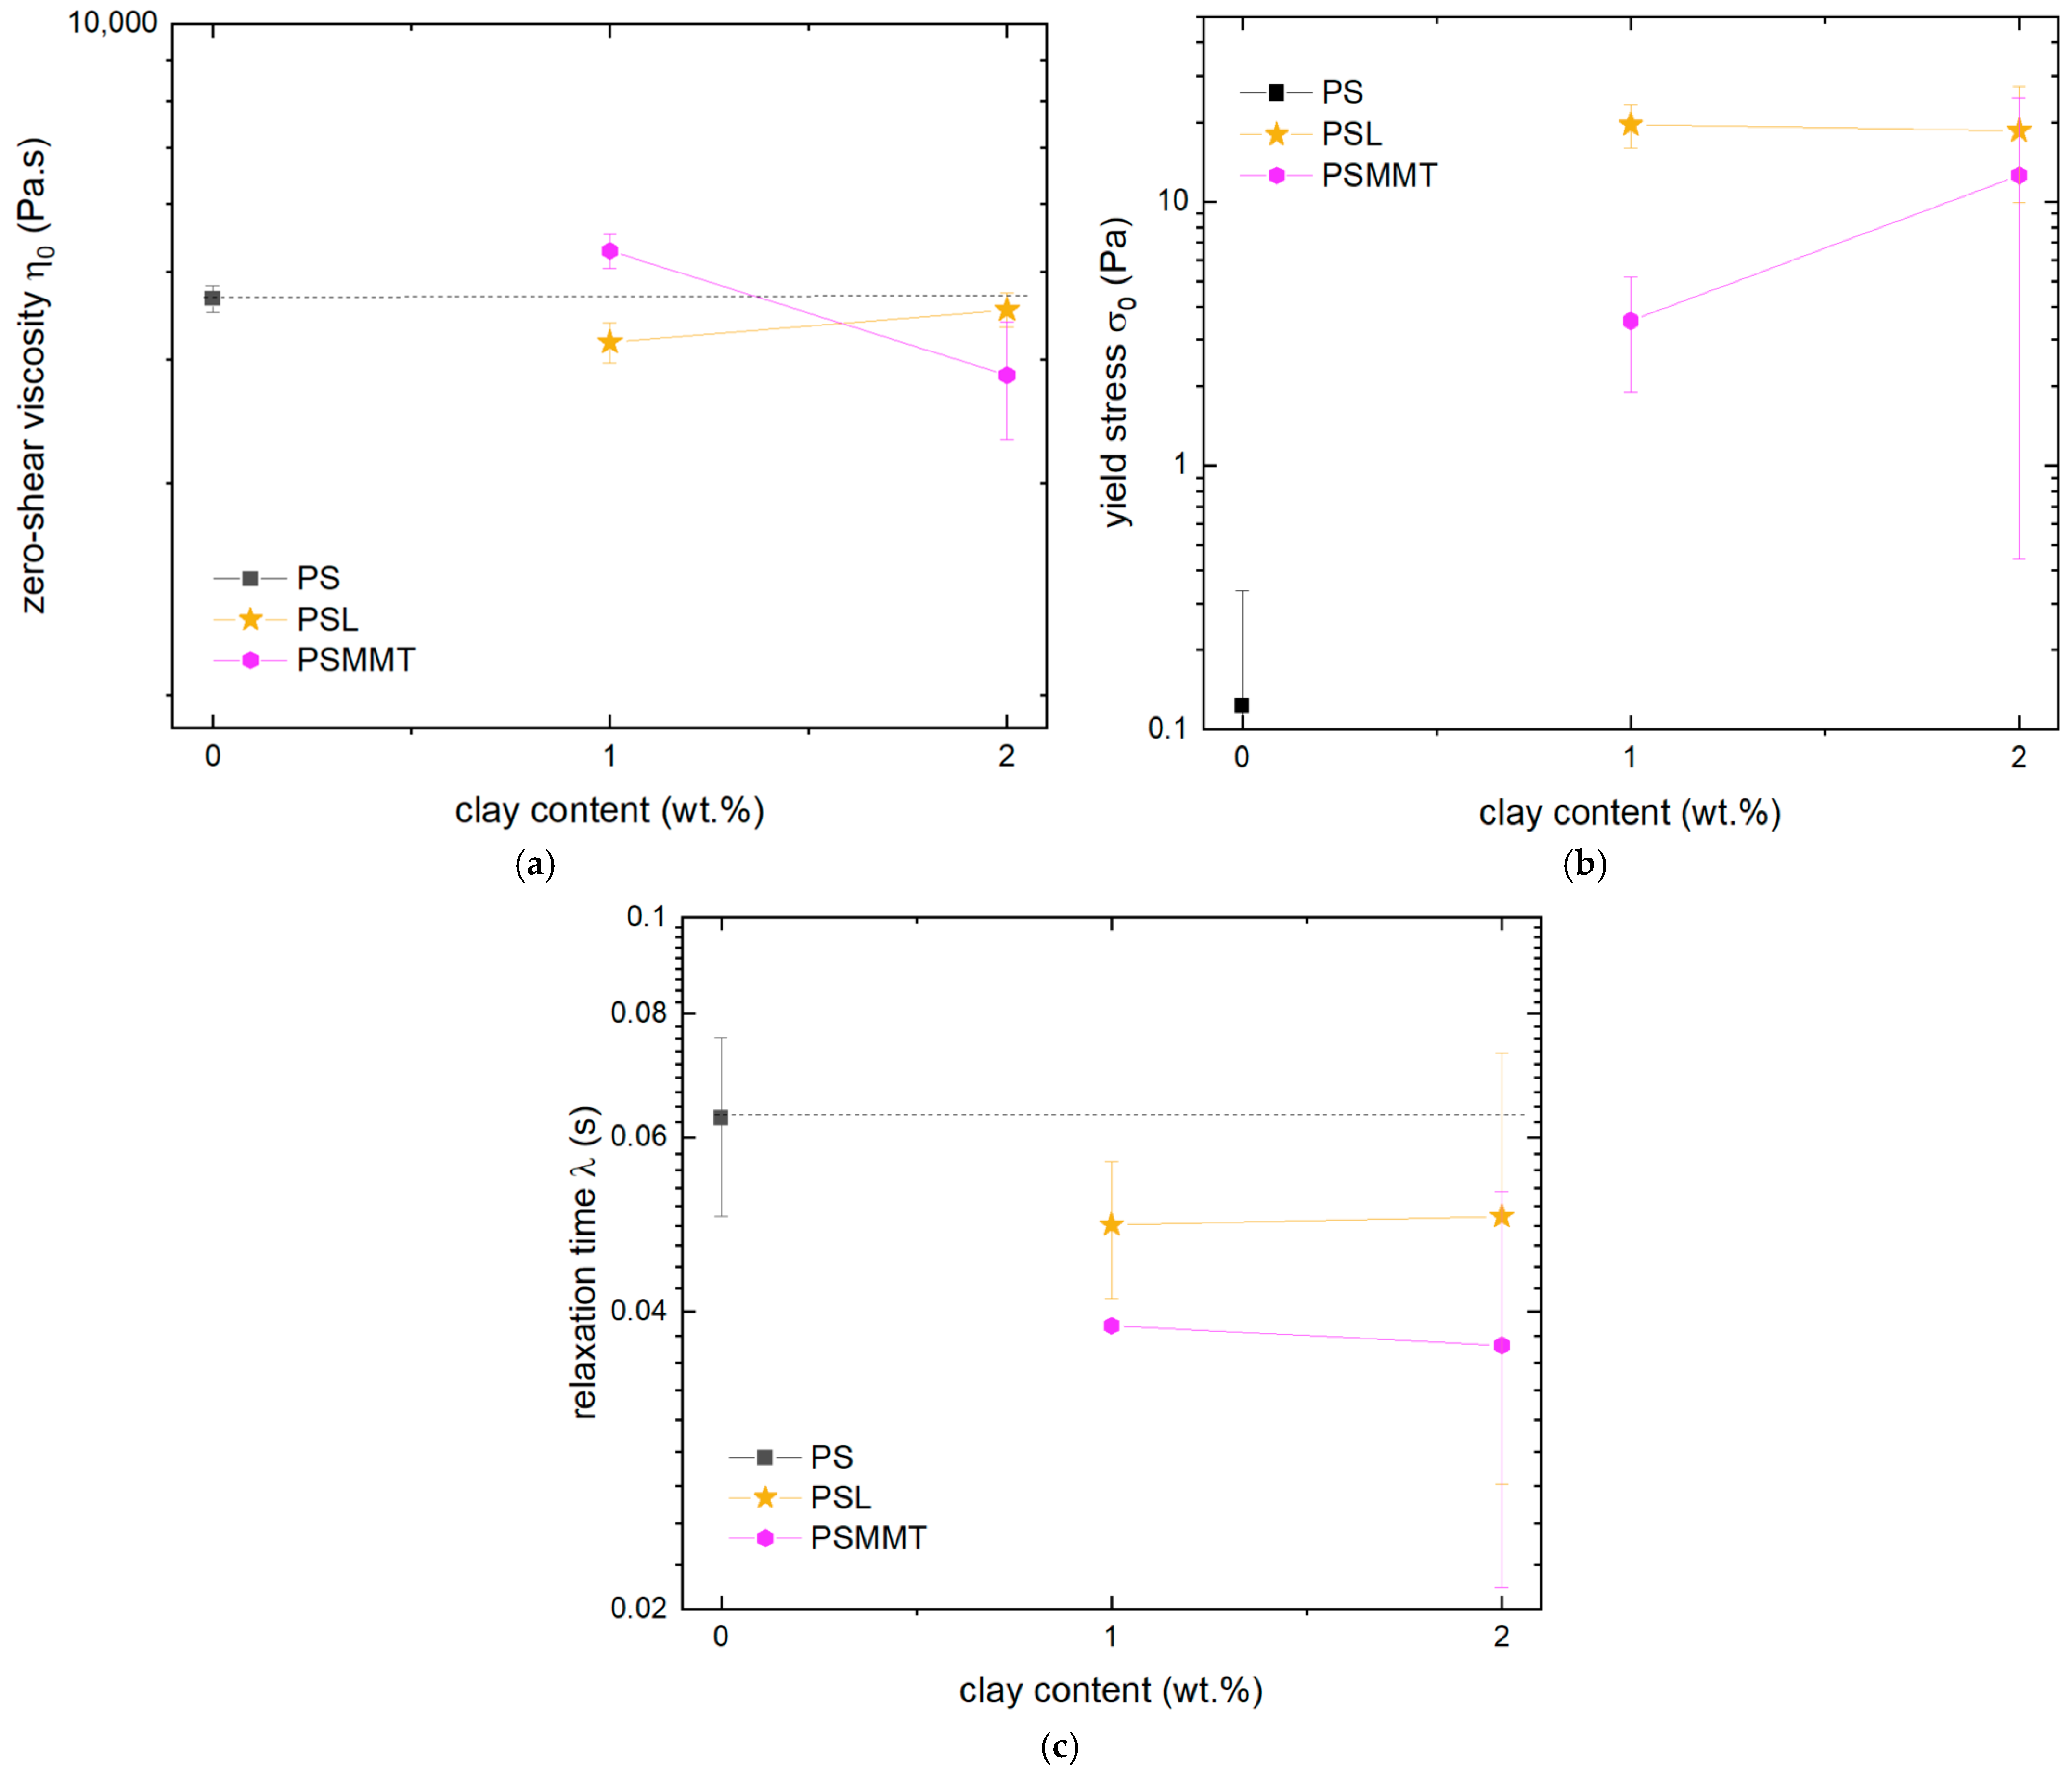
3.3. Effect of Smectic Clays on Shear Viscosity

Clays such as micas or smectites are sheet-like materials with a tetrahedral outer layer and they differ by their inner layers and interlayers. The outer layer is composed of a tetrahedral arrangement of oxygen atoms inside of which a Si, Al, or Fe atom is placed [46]. In particular, micas have been shown to display the superlubricity phenomenon because of the structure of their outer tetrahedral layer composed of SiO4 [28]. As all clays’ outer layers have the same structure composed of tetrahedra, the superlubricity effect due to the structure of the Si layer of mica should also be present in smectite clays such as montmorillonite or laponite.
Moreover, the structure of the base of the tetrahedra constitutes the outer layer that will be in contact with another clay particle. This structure is shown and compared to the one of graphene in Figure 7. Even if it is composed by oxygen atoms rather than carbon atoms, the structure is similar to graphene as it has the same 60° orientation recurrence. As a means of comparison for graphene and clays, Figure 7 presents two commensurate contacts: in AA stacking, so a perfect alignment (Figure 7a,d), and AB stacking, so a shifted alignment (Figure 7c,f). Those stackings correspond to commensurate contact angles of 0, 60, 180, 240, and 300°. Figure 7 also shows an example of incommensurate contact in Figure 7b,e. Because the structure is similar, it is believed that clays could also act as lubricants in molten polymer if the superlubricity phenomenon is really the main lubrification mechanism.
As a matter of fact, a previous work of Genoyer et al. [30] showed a decrease in the magnitude of the complex viscosity when montmorillonite (MMT) and laponite (L) were added in PMMA. The complex viscosities obtained by oscillatory shear in this study are shown in Figure 8, showing that some of the PMMA composites displayed this lubricant phenomenon.
In particular, 1 and 2 wt.% of MMT and L led to a significant decrease in viscosity by 10 to 12%, respectively. However, mMMT (modified montmorillonite) and mL (modified laponite) at the same concentrations led to an increase in viscosity. The only difference between neat clays (MMT and L) and modified clays (mMMT and mL) is the chemical modification. Clays are modified using di(hydrogenated tallow)dimethylammonium chloride, which intercalates in between the silicate sheets and helps to exfoliate and thus to improve the particles’ dispersion. Based on the analysis, it can be inferred that a higher degree of dispersion results in a decreased lubricating effect. Such an observation provides further evidence for the conclusion drawn for graphene and supports the idea that clays can also induce a lubricant effect.
As this previous study was carried out with a different polymer matrix and the rheological measurement was in oscillatory mode instead of the constant shear used in the present study, it was necessary to verify the clay’s ability in the exact same condition as graphene. To do so, MMT and L, which were the most efficient at reducing viscosity in the previous study, were added to the same PS matrix as the studied graphene grades and underwent the same processing history.
Figure 9 shows the steady shear viscosities of PS composites containing 1 and 2 wt.% of MMT and L. At first glance, it can be seen that the increase at low shear rates is more significant for clays, indicating that they produce a particle network with lower contents than graphene does.
To better assess the clays’ effect, the Carreau–Yasuda with yield stress model, Equation (3), was fitted to the shear viscosities. The zero-shear viscosities, relaxation times, and yield stresses obtained are reported in Figure 10. It can be seen that the viscosities are all close to those of neat PS; however, a slight decrease is achieved for 2 wt.% of MMT and 1 wt.% of L. The relaxation times of all composites are lower than those of neat PS. Finally, the yield stresses (Figure 10b) of those composites clearly indicate that a network of particles is created starting at 1 wt.% of L and 2 wt.% of MMT. Those results seem to point out a very good distribution of L which percolates at a lower content. Also, at 2 wt.% of MMT, the zero-shear viscosity decreases while the yield stress value increases, indicating a competition between the lubricant effect and network formation.
SEM was used to observe the dispersion state of MMT and L in PS, and the pictures are shown in Figure 11. The lateral size of the particles was measured, and it is reported in Table 4. L particles did aggregate, and the lateral size measured by SEM was larger than the one given by the supplier. Figure 11 illustrates some agglomerates of L and MMT found within the samples. The overall size of L agglomerates is smaller than for MMT as the D50 of PSL-2 is significantly lower than that of PSMMT-2. Contrary to the observations made in 0X composites, for both MMT and L composites, no rich zones of particles were encountered in the matrix.
In the case of clays such as montmorillonite and laponite, the layers are held together by dipole–dipole interactions of the hydrogen bonding, creating stronger interactions than other Van der Waals bonding. The clays’ outer layer in contact with the polymer is composed of a SiO4 tetrahedra structure with oxygen atoms on the outer line (see Figure 7), which enable the formation of hydrogen bonds. However, PS cannot form hydrogen bonds, so the interactions between PS and clays are limited to Van der Waals, which also explains clays’ tendency to agglomerate instead of dispersing in PS. To help dispersion in polymers, clay organic modification can be conducted by cation exchange with organic molecules [30]. However, chemical modification of the molecules was not considered in this work since a certain degree of particle agglomeration is a key factor for witnessing a lubricant effect.

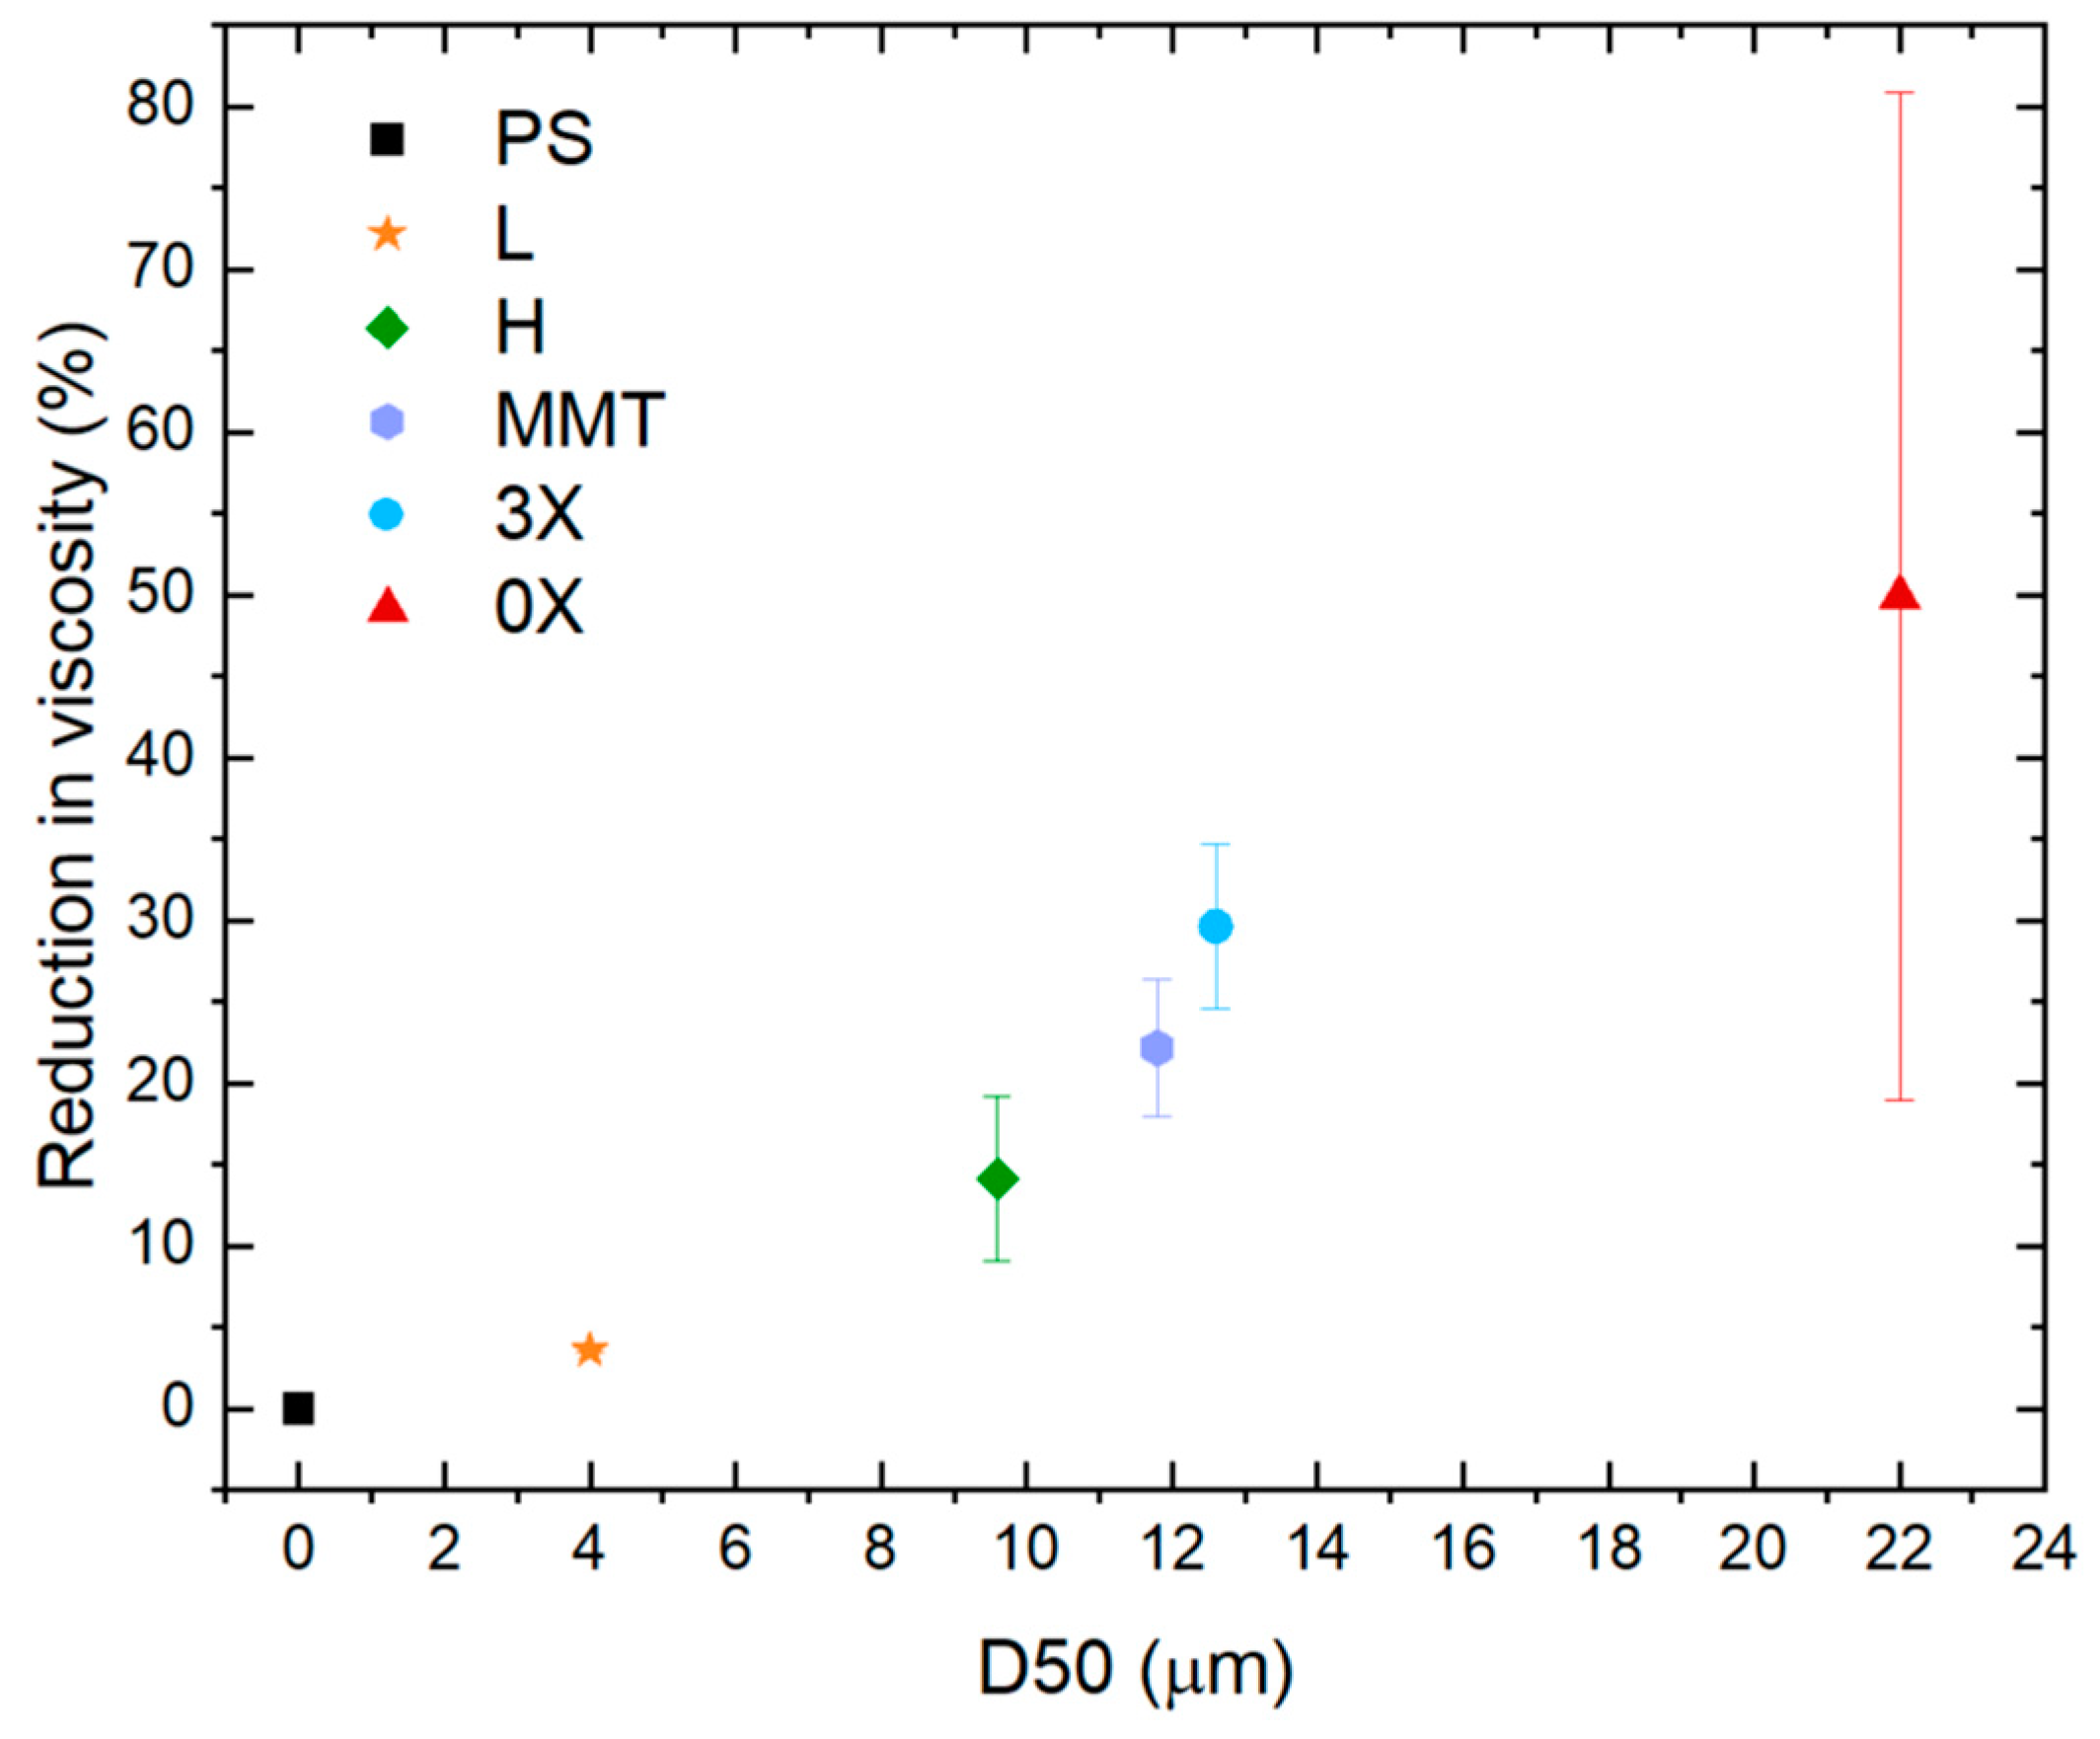
3.4. Comparison of Graphene and Clays

The reduction in zero-shear viscosities as a function of D50 for all composites at a content of 2 wt.% of particles is reported in Figure 12. As discussed previously, graphene 0X leads to the largest reduction in viscosity by 49%. Meanwhile, graphene 3X and MMT have a similar effect, leading to 29% and 22% reduction, respectively, and the least efficient lubricants are graphene H and L, which show no significant reduction in zero-shear viscosity.
By plotting those reductions in viscosity as a function of the D50 of the agglomerated particles, it becomes clear that the bigger the D50, the more reduction in viscosity. Indeed, graphene 3X and MMT lead to similar reductions in the viscosity of the PS matrix and similar D50 values of 12.6 µm and 11.8 µm. Graphene H and L have very different initial primary particle lateral sizes of 25 µm and 0.03 µm, but as their D50s are the two lowest D50s of the group with 9.6 and 4.0 µm, respectively, their efficiency as processing aids is also the lowest.
To conclude, the composites with clays and graphene with a similar dispersion state have similar viscosity, thus confirming that the mechanism of lubrication is not linked to chemistry but rather to the structure and dispersion state of particles. Because of that, the superlubricity ability of such materials is a strong proposition. Indeed, as superlubricity is due to slipping between layered particles, an agglomerated state of those particles will promote the effect, because in an agglomerated state, particles are all close to one another without being strongly linked. Furthermore, random orientation, and thus a random contact angle, will enhance the superlubricity, as only a few specific angles induce friction, as described in Figure 4.
It can also be concluded that in this work, graphene was more suitable than clay as a lubricant because it was more susceptible to presenting randomly distributed agglomerations.

4. Conclusions

Introducing low contents of layered particles in polymer matrices reduces viscosity, enabling applications related to eased thermoplastics processing, energy savings, and improved process efficiency. In this study, we investigated the impact of adding graphene and clays with varying lateral sizes on the viscosity of a melted polymer matrix.
First, it was shown that the optimum particle concentration to reduce the viscosity of the molten polymer matrix was 2 wt.% for both graphene and clay. At higher contents, the creation of a strong particle network dominates the viscoelastic response, leading to a competition between the lubricant effect, i.e., a reduction in zero-shear viscosity, and the creation of a network, i.e., the increase at low shear rates represented by the yield stress.
Second, at the optimum concentration, it was found that the bigger the agglomerates of particles, the more significant the reduction in viscosity. Graphene 0X was the most efficient particle at reducing the viscosity on the PS system by 49% because this graphene tended to produce rich filler zones with many agglomerates in close contact during the melt-mixing process. Overall, it was shown that the percentage of viscosity reduction increases as a function of the agglomerates’ D50.
Finally, it was concluded that the lubricant effect mechanism of both graphene and clay particles is similar and likely to be a so-called superlubricity phenomenon. The phenomenon of superlubricity, where layered particles slide smoothly against each other, creates extra space between the particles, allowing the polymer chains to relax more quickly and resulting in lower zero-shear viscosity.

Author Contributions

Conceptualization, J.G., E.H., G.G. and N.M.; methodology, J.G., N.R.D. and E.D.; validation, J.G., E.H., E.D. and N.R.D.; formal analysis, J.G.; investigation, J.G.; resources, E.H., G.G., E.D., N.M. and N.R.D.; data curation, J.G.; writing—original draft preparation, J.G.; writing—review and editing, E.H., G.G., N.R.D., E.D. and N.M.; visualization, J.G.; supervision, E.H., G.G., N.R.D., E.D. and N.M.; project administration, E.H., G.G., E.D. and N.R.D.; funding acquisition, E.D. and N.R.D. All authors have read and agreed to the published version of the manuscript.

Funding

This research was funded by NanoXplore Inc.; Natural Sciences and Engineering Research Council, grant number CRDPJ 538482-18; PRIMA Quebec, grand number R18-46-001; Fonds de Recherche du Québec-Nature et Technologies, grant number 318813.

Institutional Review Board Statement

Not applicable.

Data Availability Statement

The author confirms that the data supporting the reported results can be found within the article. Raw data that support the findings of this work can be requested from the corresponding authors upon reasonable request.

Acknowledgments

The author would like to thank Catherine Dufour for the preliminary results obtained during her internship.

Conflicts of Interest

The authors declare no conflict of interest.

References

  1. Achilleos, E.C.; Georgiou, G.; Hatzikiriakos, S.G. Role of processing aids in the extrusion of molten polymers. J. Vinyl Addit. Technol. 2002, 8, 7–24. [Google Scholar] [CrossRef]
  2. Kazatchkov, I.B.; Yip, F.; Hatzikiriakos, S.G. The effect of boron nitride on the rheology and processing of polyolefins. Rheol. Acta 2000, 39, 583–594. [Google Scholar] [CrossRef]
  3. Yip, F.; Diraddo, R.; Hatzikiriakos, S.G. Effect of combining boron nitride with fluoroelastomer on the melt fracture of HDPE in extrusion blow molding. J. Vinyl Addit. Technol. 2000, 6, 196–204. [Google Scholar] [CrossRef]
  4. Adesina, A.A.; Nasser, M.S.; Hussein, I.A. Comparative Analysis of the Effect of Organoclay, Boron Nitride, and Fluoropolymer on the Rheology and Instabilities in the Extrusion of High Density Polyethylene. Int. J. Polym. Sci. 2015, 2015, 190537. [Google Scholar] [CrossRef]
  5. Gul, S.; Arican, S.; Cansever, M.; Beylergil, B.; Yildiz, M.; Okan, B.S. Design of Highly Thermally Conductive Hexagonal Boron Nitride- Reinforced PEEK Composites with Tailored Heat Conduction Through-Plane and Rheological Behaviors by a Scalable Extrusion. Appl. Polym. Mater. 2023, 5, 329–341. [Google Scholar] [CrossRef]
  6. Emre Bozkurt, Y.; Yıldız, A.; Turkarslan, O.; Sasal, F.N.; Cebeci, H. Thermally conductive h-BN reinforced PEI composites: The role of processing conditions on dispersion states. Mater. Today Commun. 2021, 29, 102854. [Google Scholar] [CrossRef]
  7. Çelik, O.N.; Ay, N.; Göncü, Y. Effect of nano hexagonal boron nitride lubricant additives on the friction and wear properties of AISI 4140 steel. Part. Sci. Technol. 2013, 31, 501–506. [Google Scholar] [CrossRef]
  8. Sagbas, B. Tribological performance of peek with green lubricant enhanced by nano hexagonal boron nitride powder. Ind. Lubr. Tribol. 2020, 72, 203–210. [Google Scholar] [CrossRef]
  9. Bragg, W. An Introduction to Crystal Analysis. Nature 1928, 122, 915–916. [Google Scholar]
  10. Liu, L.; Zhou, M.; Jin, L.; Li, L.; Mo, Y.; Su, G.; Tian, Y. Recent advances in friction and lubrication of graphene and other 2D materials: Mechanisms and applications. Friction 2019, 7, 199–216. [Google Scholar] [CrossRef]
  11. Liu, Z.; Zhang, S.M.; Yang, J.R.; YangLiu, J.Z.; Yang, Y.L.; Zheng, Q.S. Interlayer shear strength of single crystalline graphite. Acta Mech. Sin. 2012, 28, 978–982. [Google Scholar] [CrossRef]
  12. Dienwiebel, M.; Pradeep, N.; Verhoeven, G.S.; Zandbergen, H.W.; Frenken, J.W.M. Model experiments of superlubricity of graphite. Surf. Sci. 2005, 576, 197–211. [Google Scholar] [CrossRef]
  13. Dienwiebel, M.; Verhoeven, G.S.; Pradeep, N.; Frenken, J.W.M. Superlubricity of Graphite. Phys. Rev. Lett. 2004, 92, 126101. [Google Scholar] [CrossRef]
  14. Feng, X.; Kwon, S.; Park, J.Y.; Salmeron, M. Superlubric Sliding of Graphene Nano flakes on Graphene. ACS Nano 2013, 7, 1718–1724. [Google Scholar] [CrossRef]
  15. Karatas, E.; Gul, O.; Karsli, N.G.; Yilmaz, T. Synergetic effect of graphene nanoplatelet, carbon fiber and coupling agent addition on the tribological, mechanical and thermal properties of polyamide 6,6 composites. Compos. Part B Eng. 2019, 163, 730–739. [Google Scholar] [CrossRef]
  16. Kurusu, R.S.; Helal, E.; Moghimian, N.; David, E.; Demarquette, N. The Role of Selectively Located Commercial Graphene Nanoplatelets in the Electrical Properties, Morphology, and Stability of EVA/LLDPE Blends. Macromol. Mater. Eng. 2018, 303, 1–9. [Google Scholar] [CrossRef]
  17. Helal, E.; Kurusu, R.S.; Moghimian, N.; Gutierrez, G.; David, E.; Demarquette, N.R. Correlation between morphology, rheological behavior, and electrical behavior of conductive cocontinuous LLDPE/EVA blends containing commercial graphene nanoplatelets. J. Rheol. 2019, 63, 961–976. [Google Scholar] [CrossRef]
  18. Salari, M.; Sansone, N.D.; Razzaz, Z.; Taromsari, S.M.; Leroux, M.; Park, C.B.; Lee, P.C. Insights into synergy-induced multifunctional property enhancement mechanisms in hybrid graphene nanoplatelet reinforced polymer composites. Chem. Eng. J. 2023, 463, 142406. [Google Scholar] [CrossRef]
  19. Karimi, S.; Helal, E.; Gutierrez, G.; Moghimian, N.; Madinehei, M.; David, E.; Samara, M.; Demarquette, N.R. A review on graphene’s light stabilizing effects for reduced photodegradation of polymers. Crystals 2021, 11, 3. [Google Scholar] [CrossRef]
  20. Silibin, M.; Karpinsky, D.; Bystrov, V.; Zhaludkevich, D.; Bazarova, M.; Mirzadeh Vaghefi, P.; Marques, P.A.A.P.; Singh, B.; Bdikin, I. Preparation, Stability and Local Piezoelectrical Properties of P(VDF-TrFE)/Graphene Oxide Composite Fibers. C 2019, 5, 48. [Google Scholar] [CrossRef]
  21. Diallo, A.K.; Helal, E.; Gutierrez, G.; Madinehei, M.; David, E.; Demarquette, N.; Moghimian, N. Graphene: A multifunctional additive for sustainability. Sustain. Mater. Technol. 2022, 33, e00487. [Google Scholar] [CrossRef]
  22. Sultana, S.M.N.; Helal, E.; Gutiérrez, G.; David, E.; Moghimian, N.; Demarquette, N.R. Effect of Few-Layer Graphene on the Properties of Mixed Polyolefin Waste Stream. Crystals 2023, 13, 358. [Google Scholar] [CrossRef]
  23. Moghimian, N.; Nazarpour, S. The future of carbon: An update on graphene’s dermal, inhalation, and gene toxicity. Crystals 2020, 10, 718. [Google Scholar] [CrossRef]
  24. Bai, Y.; Zhou, S.; Lei, X.; Zou, H.; Liang, M. Enhanced thermal conductivity of polycarbonate-based composites by constructing a dense filler packing structure consisting of hybrid boron nitride and flake graphite. J. Appl. Polym. Sci. 2022, 139, e52895. [Google Scholar] [CrossRef]
  25. Ferreira, E.H.C.; Andrade, R.J.E.; Fechine, G.J.M. The ‘Superlubricity State’ of Carbonaceous Fillers on Polyethylene-Based Composites in a Molten State. Macromolecules 2019, 52, 9620–9631. [Google Scholar] [CrossRef]
  26. Muñoz, P.A.R.; de Oliveira, C.F.P.; Amurin, L.G.; Rodriguez, C.L.C.; Nagaoka, D.A.; Tavares, M.I.B.; Domingues, S.H.; Andrade, R.J.E.; Fechine, G.J.M. Novel improvement in processing of polymer nanocomposite based on 2D materials as fillers. Express Polym. Lett. 2018, 12, 930–945. [Google Scholar] [CrossRef]
  27. Vega, J.F.; Martinez-Salazar, J.; Trujillo, M.; Arnal, M.L.; Muller, A.J.; Bredeau, S.; Dubois, P. Rheology, processing, tensile properties, and crystallization of polyethylene/carbon nanotube nanocomposites. Macromolecules 2009, 42, 4719–4727. [Google Scholar] [CrossRef]
  28. Hirano, M.; Shinjo, K. Superlubricity and frictional anisotropy. Wear 1993, 168, 121–125. [Google Scholar] [CrossRef]
  29. Claerbout, V.E.P.; Polcar, T.; Nicolini, P. Superlubricity achieved for commensurate sliding: MoS 2 frictional anisotropy in silico. Comput. Mater. Sci. 2019, 163, 17–23. [Google Scholar] [CrossRef]
  30. Genoyer, J.; Demarquette, N.R.; Soulestin, J. Effect of clay particles size and location on coalescence in PMMA/PS blends. J. Rheol. 2019, 63, 883–893. [Google Scholar] [CrossRef]
  31. Seehra, M.S.; Geddam, U.K.; Schwegler-Berry, D.; Stefaniak, A.B. Detection and quantification of 2H and 3R phases in commercial graphene-based materials. Carbon 2015, 95, 818–823. [Google Scholar] [CrossRef]
  32. Kim, T.H.; Jeon, E.K.; Ko, Y.; Jang, B.Y.; Kim, B.S.; Song, H.K. Enlarging the d-spacing of graphite and polarizing its surface charge for driving lithium ions fast. J. Mater. Chem. A 2014, 2, 7600–7605. [Google Scholar] [CrossRef]
  33. Low, I.; Albetran, H.M.; Degiorgio, M. Structural Characterization of Commercial Graphite and Graphene Materials. J. Nanotechnol. Nanomater. 2020, 1, 23–30. [Google Scholar]
  34. Jian, M.Q.; Xie, H.H.; Xia, K.L.; Zhang, Y.Y. Challenge and Opportunities of Carbon Nanotubes. In Industrial Applications of Carbon Nanotubes; Peng, H., Li, Q., Chen, T., Eds.; Elsevier Inc.: Amsterdam, The Netherlands, 2017; pp. 433–476. [Google Scholar]
  35. Pérez, E.M.; Martín, N. π-π Interactions in carbon nanostructures. Chem. Soc. Rev. 2015, 44, 6425–6433. [Google Scholar] [CrossRef] [PubMed]
  36. Georgakilas, V.; Tiwari, K.; Kemp, K.C.; Perman, J.A.; Bourlinos, A.B.; Kim, K.S.; Zboril, R. Noncovalent Functionalization of Graphene and Graphene Oxide for Energy Materials, Biosensing, Catalytic, and Biomedical Applications. Chem. Rev. 2016, 116, 5464–5519. [Google Scholar] [CrossRef] [PubMed]
  37. Apátiga, J.L.; Del Castillo, R.M.; Del Castillo, L.F.; Calles, A.G.; Espejel-Morales, R.; Favela, J.F.; Compan, V. Non-covalent interactions on polymer-graphene nanocomposites and their effects on the electrical conductivity. Polymers 2021, 13, 1714. [Google Scholar] [CrossRef]
  38. Macosko, C.W. Rheology: Principles, Measurements, and Applications; Wiley-VCH: New York, NY, USA, 1994. [Google Scholar]
  39. Vergnes, B. The use of apparent yield stress to characterize exfoliation in Polymer Nanocomposites. Int. Polym. Process. 2011, 26, 229–232. [Google Scholar] [CrossRef]
  40. Lertwimolnun, W.; Vergnes, B. Influence of compatibilizer and processing conditions on the dispersion of nanoclay in a polypropylene matrix. Polymer 2005, 46, 3462–3471. [Google Scholar] [CrossRef]
  41. Genoyer, J.; Lentzakis, H.; Demarquette, N.R. Effect of the addition of cellulose filaments on the relaxation behavior of thermoplastics. J. Rheol. 2021, 65, 779–789. [Google Scholar] [CrossRef]
  42. Mackay, M.E.; Dao, T.T.; Tuteja, A.; Ho, D.L.; Van Horn, B.; Kim, H.; Hawker, C.J. Nanoscale effects leading to non-einstein-like decrease in viscosity. Nat. Mater. 2003, 2, 762–766. [Google Scholar] [CrossRef]
  43. Ferreira, E.H.C.; de Lima, L.P.; Fechine, G.J.M. The ‘Superlubricity State’ of Carbonaceous Fillers on Polymer Composites. Macromol. Chem. Phys. 2020, 52, 9620–9631. [Google Scholar]
  44. Dealy, J.M.; Wang, J. Melt Rheology, and Its Applications in the Plastics Industry; Springer: Berlin/Heidelberg, Germany, 2013. [Google Scholar]
  45. Tuteja, A.; Mackay, M.E.; Hawker, C.J.; Van Horn, B. Effect of ideal, organic nanoparticles on the flow properties of linear polymers: Non-einstein-like behavior. Macromolecules 2005, 38, 8000–8011. [Google Scholar] [CrossRef]
  46. Brigatti, M.F.; Galán, E.; Theng, B.K.G. Structure and Mineralogy of Clay Minerals. In Developments in Clay Science; Bergaya, F., Lagaly, G., Eds.; Elsevier Inc.: Amsterdam, The Netherlands, 2013; Volume 5, pp. 21–81. [Google Scholar]
Figure 1. Scanning electron microscopy images of PS with 2 wt.% of (a) graphene 0X (dispersed phase), (b) graphene 0X (agglomerated phase), (c) graphene 3X, (d) graphene H. Platelets are indicated by arrows and circles.
Carbon 09 00096 g001
Figure 2. Steady shear viscosity as a function of shear rate of (a) PS0X, (b) PS3X, and (c) PSH composites at 200 °C. Lines represent the fitting of modified Carreau–Yasuda model.
Carbon 09 00096 g002
Figure 3. Zero-shear viscosity, η0, obtained by fitting the modified Carreau–Yasuda model to the shear viscosities of composites containing graphene 0X, 3X, and H.
Carbon 09 00096 g003
Figure 4. Superlubricity phenomenon in graphene as a function of flake-to-flake angle, θ. Flake 1 in black, flake 2 in gray. One carbon of flake 2 is in red as a reference point.
Carbon 09 00096 g004
Figure 5. Yield stress, σ0, obtained by fitting the modified Carreau–Yasuda model to the shear viscosities of composites containing graphene 0X, 3X, and H.
Carbon 09 00096 g005
Figure 6. Relaxation time, λ, obtained by fitting the modified Carreau–Yasuda model to the shear viscosities of composites containing graphene 0X, 3X, and H.
Carbon 09 00096 g006
Figure 7. Two outer layers of (a) graphene and (d) clays in commensurate contact, AA stacking. Two outer layers of (b) graphene and (e) clay in incommensurate contact. Two outer layers of (c) graphene and (f) clay in commensurate contact, AB stacking.
Carbon 09 00096 g007
Figure 8. Magnitude of complex viscosities at 0.1 rad/s and 200 °C of PMMA containing 0 to 5 wt.% of clay particles: montmorillonite (MMT), modified montmorillonite (mMMT), laponite (L), and modified laponite (mL) [30].
Carbon 09 00096 g008
Figure 9. Steady shear viscosity as a function of shear rate of (a) PSMMT and (b) PSL composites. Lines represent the fitting of modified Carreau–Yasuda model to shear viscosities.
Carbon 09 00096 g009
Figure 10. (a) Zero-shear viscosities, (b) yield stresses, and (c) relaxation times obtained by fitting modified Carreau–Yasuda model to shear viscosities of PS composites containing MMT and L.
Carbon 09 00096 g010
Figure 11. Scanning electron microscopy images of PS with 2 wt.% of (a) MMT and (b) L.
Carbon 09 00096 g011
Figure 12. Reduction in zero-shear viscosity of composites containing 2 wt.% of particles as a function of the D50 of agglomerates measured by SEM. The point at 0 µm corresponds to neat PS.
Carbon 09 00096 g012
Table 1. Properties of graphenes and clays.
Type of ParticleSupplierGradeAbbreviationPrimary Particle Lateral Size (µm) *
GrapheneNanoXplore Inc.GrapheneBlackTM 3X3X1–2
GrapheneBlackTM 0X0X0.5–1
XG Sciences Inc.xGnP H-25H25
MontmorilloniteBYKCloisite Na+MMT<25
LaponiteLaponite RDL0.030
* values reported by supplier.
Table 2. XRD results.
2θ (°C)Interlayer Spacing (nm)
PS0X−230.990.335
PS3X−230.990.335
PSH−230.940.335
Table 3. Size of agglomerations of graphene 0X, 3X, and H in PS observed using SEM.
SampleD50 (µm)D90 (µm)
PS0X-28.3 *15.6 *
>22 **>55 **
PS3X-212.640.1
PSH-29.648.8
* in dispersed area; ** in highly agglomerated area.
Table 4. Size of agglomerates of MMT and L in PS observed using SEM.
SampleD50 (µm)D90 (µm)
PSMMT−211.835.2
PSL−24.037.2
Disclaimer/Publisher’s Note: The statements, opinions and data contained in all publications are solely those of the individual author(s) and contributor(s) and not of MDPI and/or the editor(s). MDPI and/or the editor(s) disclaim responsibility for any injury to people or property resulting from any ideas, methods, instructions or products referred to in the content.

