Abstract
To explore the effects of various potassium fertilizer dosages on sweet potatoes, field experiments were conducted in 2018 and 2019 using a randomized block design. In the experiment, the control (completely blank, no fertilizer), KS0 (potassium blank, no potassium fertilizer), KS100 (100 kg K2O ha−1), KS200 (200 K2O ha−1), and KS300 (300 K2O ha−1) treatments were set up. The application of potassium fertilizer increased the potassium content of sweet potato plants, thereby increasing the chlorophyll content, net photosynthetic rate, and the fluorescence chlorophyll parameters. It also increased the amylose content in tuber roots to increase the total starch content and yield of sweet potatoes. Specifically, the KS200 treatment significantly improved the soil potassium content, potassium absorption, potassium agronomic efficiency, and potassium recovery efficiency. Compared with the other treatments, the yield and net profit of the KS200 treatment increased by 0.89–27.05% and 2.34–30%, respectively, on average, over two years. Based on factors such as sweet potato yield and starch content, the recommended amount of potassium fertilizer was 200 kg ha−1, which has significant economic benefits and theoretical value.
1. Introduction
Sweet potato is an essential crop in China because of its resistance to thin and barren soil, wide adaptability, and significance as an industrial and health-food raw material [1]. Recently, with the rapid development of China’s national economy, sweet potato—positioned as a healthy food and new energy crop—has attracted extensive attention and promoted the development of the sweet potato industry [2,3]. In some regions, planting sweet potatoes has become one of the main ways for farmers to increase production and income [4]. Continuous stability and improvement of sweet potato production are crucial for the sustainable development of agriculture and related industries [5]. The enormous market demand has increased the demand for high-yield cultivation of sweet potatoes.
Sweet potato has a high demand for potassium [6,7], higher than that for nitrogen and phosphorus during the whole growth period, with the most significant demands occurring during tuber expansion [8]. A high yield was ensured by potassium fertilization of a reasonable quantity. Potassium acts as an activator throughout the whole life cycle of sweet potatoes [9]. Especially for various enzymes in sweet potatoes, potassium can improve the photosynthesis ability of sweet potato leaves, the transportation of light and products, the plant’s resistance to adversity, and the plant’s resistance and tolerance to adverse environments [10]. Potassium is also used as a lubricant for carbohydrate transfer and distribution between sink and source organs of crops. A proper potassium supply can regulate the T/R value of sweet potatoes and promote the transfer of photosynthetic products to root tubers [11]. Increasing the application of potassium fertilizer can improve the production capacity of sources that provide photosynthetic products, improve the distribution rate of dry matter in root tubers, and increase dry matter production and root tuber yield.
Potassium resources are extremely deficient in China [12]. Although potassium is the most abundant element in the soil, it is one of the most active nutrients. The total potassium content in the soil is generally 1.1–2.5%; the highest is approximately 3% [13]. Compared with total nitrogen and total phosphorus, the soil’s total potassium is approximately nine times higher, but most of this potassium cannot be fully absorbed and utilized by plants [14]. The content of available potassium that can be absorbed and utilized by plants accounts for only approximately 2% of the total potassium content [15]. In China, poor potassium nutrition and low potassium application amounts of crops have become critical factors limiting the stable yield and quality improvement of crops.
With the increase in nitrogen and phosphorus fertilizers, multiple cropping indexes, and yield per unit area, malnutrition symptoms have emerged in north China, with potassium imbalance being one of the most prominent problems [16]. Therefore, we should focus on the application of potassium fertilizer in sweet potato production. However, the low utilization rate of potassium in agricultural production not only causes a waste of resources and economic losses but also fails to maximize the effect of potassium on crop yield [17]. Improving potassium fertilizer utilization and reducing fertilizer costs have become urgent problems in sweet potato production.
Hence, the objective of this study is to investigate the effects of potassium fertilizer dosages on (i) photosynthetic characteristics, (ii) potassium-use efficiency, (iii) soil-available potassium, (iv) starch content and yield of sweet potato, and (v) economic benefits. This study attempts to elucidate the physiological and biochemical reasons for potassium nutrition to increase sweet potato yield and provides a theoretical basis for the high-yield cultivation of sweet potatoes.
2. Materials and Methods
2.1. Experimental Site and Material
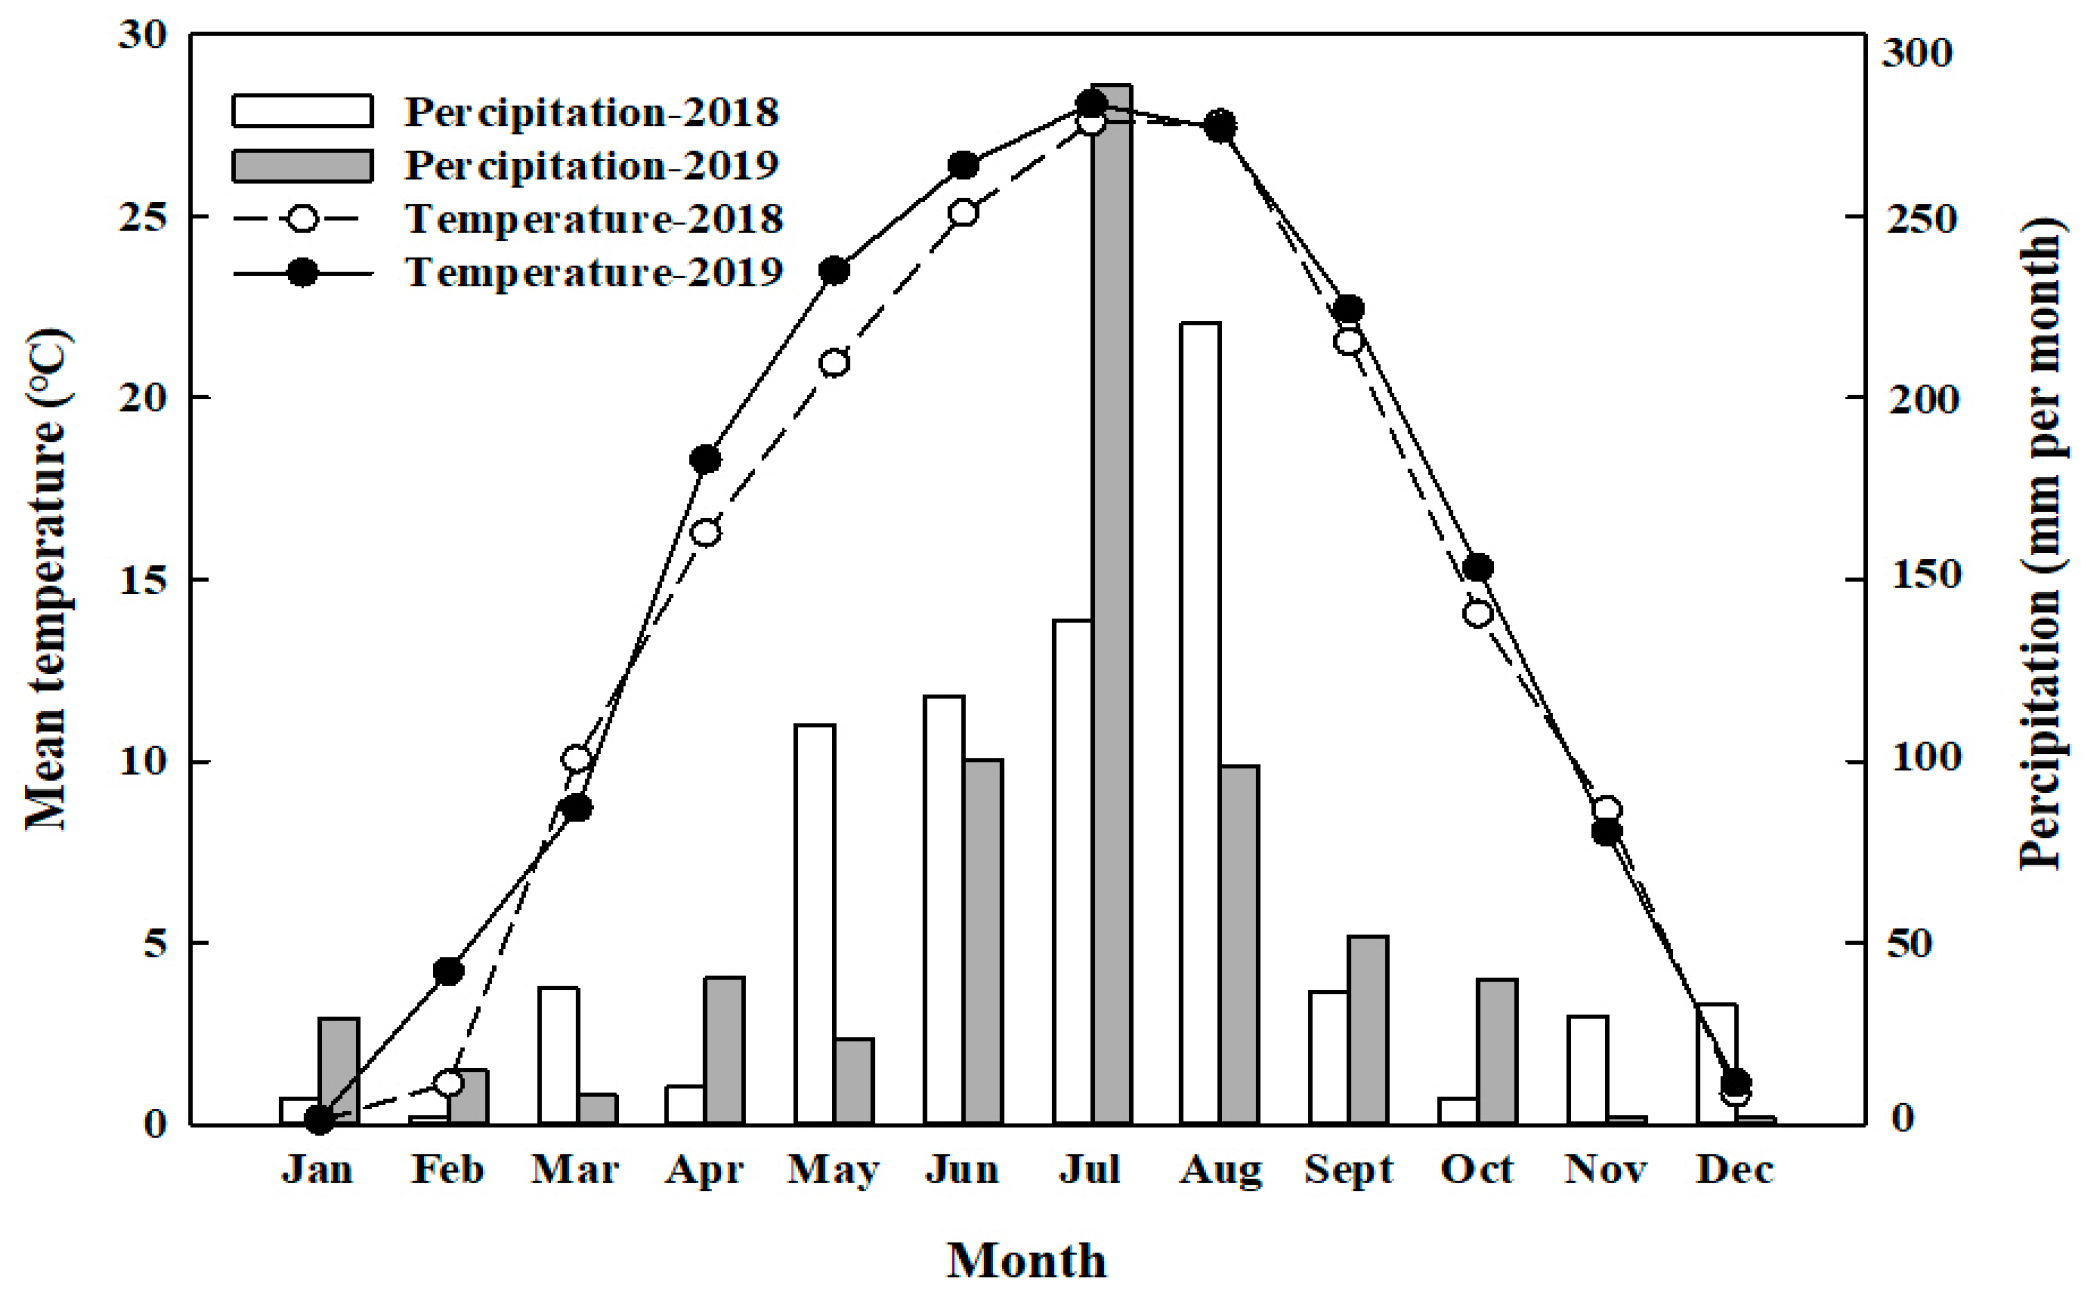
The experimental site was in Xiangyang Village, Yishui County, Linyi City, Shandong Province, China (N 35°47′21″; E 118°41′37″) in 2018 and 2019. This area has a warm, temperate monsoon climate with concentrated precipitation (Figure 1). The rainfall is concentrated from July to September, and the annual average temperature is 12–14 °C. Before planting sweet potatoes, 0–20 cm soil samples were collected using the 5-point method in the experimental plot to determine the basic soil sample properties (Table 1).
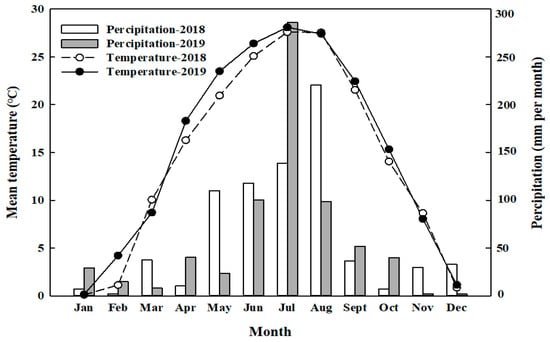
Figure 1.
Weather data.

Table 1.
Part properties of the tested soil before sweet potato planting.
The planted sweet potato variety was “Jishu 22”. The tested fertilizers included controlled-release fertilizers and other conventional fertilizers. The controlled-release fertilizer was controlled-release urea (CRU, N 42%, nutrient release almost reached three months in 25 °C static water) provided by the Kingenta Ecological Engineering Group Co., Ltd., Linyi, China. Other conventional fertilizers included urea (N, 46%), potassium sulfate (KS) (K2O, 50%), and calcium superphosphate (P2O5, 14%).
2.2. Experimental Design
The field experiment had a random block arrangement design with four repetitions, and the fourth repetition was used as the rooting and seed testing area. In the experiment, the control (completely blank, no fertilizer), KS0 (potassium blank, no potassium fertilizer), KS100 (100 K2O ha−1), KS200 (200 K2O ha−1), and KS300 (300 K2O ha−1) treatments were set up (Table 2). The N and P2O5 application amounts were 100 and 90 kg ha−1, respectively. The fertilizer was spread once before the ridge, the ridge distance was 90 cm, and the transplanting interval of the sweet potato seedlings was 23 cm.
Table 2.
Experimental design and fertilizers used in five treatments.
In the experiment, the planting density was 50,000 plants ha−1, the plant spacing was 0.25 m, the ridge spacing was 0.8 m, and the plot area was 50.4 m2 (9 m long and 5.6 m wide). When the sweet potato seedlings grew to 3–4 nodes, they were transplanted, and 2 nodes were transplanted into the soil. Other agronomic management measures were implemented according to the local agronomic practices.
2.3. Sampling and Measurement
Sweet potatoes were planted on 23 May 2018 and 20 May 2019. Soil and plant samples were collected at the root and tuber forming stage (50 days after planting), stem and leaf growth stage (100 days after planting), and harvest stage (150 days after planting) in 2019.
Soil samples were collected at 0–20 cm, and a 5-point sampling mode was adopted (two sampling points for the fertilizer line, two for the crop line, and one for the non-planting line). The NO3−-N and NH4+-N contents of the soil (0.01 mol L−1 CaCl2 extraction) were determined using an AA3 continuous flow analyzer (Bran-Luebbe, Norderstedt, Germany). After the remaining soil was dried, it was milled with 2 and 0.25 mm sieves, and the soil total nitrogen (semi-micro Kjeldahl method), available phosphorus (pH 8.5, 0.5 mol L−1 NaHCO3 extraction, molybdenum blue colorimetry), and available potassium content (1 mol L−1 NH4OAc extraction, flame method) were determined [18].
SPAD values were measured using a hand-held chlorophyll meter (SPAD-502, Minolta, Tokyo, Japan). A Li-6400 portable photosynthetic apparatus (LI-COR, Lincoln, NE, USA) was used for analysis. Between 9:00 a.m. and 10:00 a.m., during the bell period of sunny and cloudless weather, we randomly selected five fully expanded functional leaves from each plot to measure the net photosynthetic rate (Pn). The fluorescence parameters of chlorophyll, including the primary light energy conversion efficiency (Fv/Fm), non-photochemical quenching coefficient (qN), photochemical quenching coefficient (qP), and effective quantum yield of PSII photochemistry (ΦPSII), were measured using an FMS2 portable fluorescence system (Hansatech Instruments, King’s Lynn, Norfolk, UK).
At the harvest time of the sweet potato, four places were randomly selected for each treatment. Each place was 9 m2 for recording the yield, which was recorded as the dry weight. Approximately 300 g of dry sweet potato was washed and cut into small pieces before blending into a uniform paste with a blender. The slurry was poured into a 100-mesh yarn bag, washed thrice in 0.5 L of water, and passed through a 100-mesh sieve, which stood for 12 h. The final step was to dry the precipitated starch in an oven at 50 °C for 24 h. The dried starch was ground and passed through a 100-mesh sieve. The starch content was analyzed using the enzyme method, and each sample was analyzed thrice. Using purified amylose as the standard sample, the amylose content was determined using iodine potassium iodide dual-wavelength colorimetry [19]. The amylopectin content was calculated as the difference between the total starch and amylose contents.
The fresh weights of the stem and leaf from the overground parts and roots in the underground part were recorded. After days 50, 100, and 150 of planting, four places were randomly selected for each treatment, and each place was 9 m2 for yield recording. The overground stems and leaves were chopped and mixed evenly. Approximately 200 g of fresh samples were weighed and baked to constant weight at 80 °C. The root of the block was cut into granules and mixed evenly. Approximately 150 g of the sample was dried using the same method used to determine the dry matter weight. The potassium content of the plant was digested using H2SO4-H2O digestion and flame photometry. Finally, the potassium recovery efficiency (KRE) and potassium agronomic efficiency (KAE) were calculated [20]. Excel 2010 and SAS 8.0 were used to complete the relevant data processing and statistical analysis, ANOVA was used to compare the significant treatment differences, and SigmaPlot software version 10 was used to draw figures.
3. Results
3.1. Photosynthesis of Sweet Potato
The control treatment had the lowest SPAD and net photosynthetic rate (Pn) in both years (Table 3). However, there was no significant potassium fertilizer dosage × year interaction effect on SPAD and Pn. Compared with the KS0 treatment, the SPAD and Pn of the leaves in each potassium fertilizer treatment increased. The SPAD value and net photosynthetic rate of the sweet potato leaves were significantly enhanced with an increased potassium fertilizer dosage, and the highest treatment was KS200. Furthermore, no significant difference existed between the KS200 and KS300 treatments, but these were markedly higher than that of the KS100 treatment. Simultaneously, the SPAD value and Pn of the sweet potato leaves increased with an increasing potassium application, indicating that the increasing potassium application could delay the senescence of leaves, and the higher chlorophyll content and Pn of leaves ensured a continuous supply of photosynthetic products required for starch synthesis in roots.
Table 3.
The SPAD and photosynthesis parameter of sweet potato in 2018 and 2019.
As revealed in Table 4, each potassium treatment increased the primary light energy conversion efficiency (Fv/Fm), photochemical quenching coefficient (qP), and effective quantum yield of PSII photochemistry (ΦPSII) of leaves and decreased the non-photochemical quenching coefficient (qN) compared with the KS0 treatment on day 100 after transplant. At day 150 after transplanting, sweet potato leaves had senescence and abscission, and these parameters were significantly lower than those on day 100. The Fv/Fm, ΦPSII, and qP values of sweet potato increased, whereas the qN value decreased with increasing potassium fertilizer dosage. The KS200 and KS300 treatments delayed the senescence of leaves and ensured a continuous supply of photosynthetic products required for starch synthesis over two years.
Table 4.
The fluorescence chlorophyll parameters of sweet potato in 2018 and 2019.
3.2. Soil-Available Potassium
The content of soil-available potassium in each treatment decreased gradually during the growth period, with the control treatment having the lowest soil-available potassium content (Table 5). With increasing potassium fertilizer dosage, the soil-available potassium content increased significantly, and the KS300 treatment had the highest available potassium content. No difference existed in the available potassium content between the control and KS0 treatments, indicating that potassium fertilizer was the decisive factor for the increase in the available potassium content in the soil, whereas N and P fertilizers did not contribute to this increase.
Table 5.
The soil-available potassium content of sweet potato in 2018 and 2019.
3.3. Potassium Uptake and Potassium-Use Efficiency
Compared with the KS0 treatment, the potassium uptake of the potassium fertilizer treatments markedly increased, and the control treatment was the lowest during 2018 and 2019 (Table 6). With an increase in the potassium fertilizer dosage, the uptake of potassium in each growth stage of sweet potato exhibited an upward trend, and a significant difference was observed between the various potassium application treatments. Furthermore, the potassium agronomy efficiency (KAE) and potassium recovery efficiency (KRE) exhibited a similar trend. The KS200 treatment improved the KAE and the KRE compared with the KS100 and KS300 treatments. There was no significant potassium fertilizer dosage × year interaction effect on the potassium uptake, KAE, and KRE. In general, the KS200 treatment had the best performance on the potassium uptake and potassium-use efficiency.
Table 6.
The potassium uptake, potassium agronomy efficiency (KAE), and potassium recovery efficiency (KRE) of sweet potato in 2018 and 2019.
3.4. The Dry Biomass, T/R, and Yield
The potassium fertilizer dosage, year, and their interaction markedly affected the dry biomass, T/R, and yield of sweet potatoes in both years (Table 7), with the control treatments having the lowest values. Compared with the KS0 treatment, the overground and underground biomass of sweet potatoes in each growth period could be increased by applying potassium. At day 50 after transplanting, the T/R value (ratio of overground biomass to underground biomass) decreased with an increase in the potassium application, indicating that the potassium application benefits the tuber’s early expansion during the root initiation and tuber formation. The T/R value increased with the potassium application rate on day 100 after transplanting, indicating that the potassium application benefits the establishment of the overground source organs during this period. On day 150 after transplanting (harvest period), the T/R value decreased with an increase in the potassium application, indicating that the potassium application was beneficial to the movement of dry matter from the upper part to the lower part of the ground in the later stage of sweet potato block expansion, which promoted the expansion of the sweet potato block. The yield of sweet potato increased with an increase in the potassium fertilizer dosage. The yields of KS200 were the highest in both years, but no significant difference existed between KS200 and KS300.
Table 7.
The dry biomass, T/R, and yield of sweet potato under different treatments during the 2018 and 2019 growing seasons.
3.5. The Starch Index and Net Profit
The potassium fertilizer dosage significantly improved the starch index compared with that of the control and KS0 treatments (Table 8). However, there was no significant potassium fertilizer type × FA rate interaction effect on amylopectin content and amylose/amylopectin ratio. Compared with the KS0 treatment, the starch yields of KS200 and KS300 increased by 16.5–28.8% in 2018 and 15.9–23.5% in 2019. With an increase in the potassium fertilizer dosage, the total starch content of sweet potatoes significantly increased. Increasing the potassium fertilizer application can significantly increase the amylose content and amylose/amylopectin ratio.
Table 8.
The starch content of sweet potato in 2018 and 2019.
The average annual income, cost, and net profit of the various treatments in 2018 and 2019 were calculated, and the value of the control treatment was the lowest (Table 9). The net profit of KS200 was higher than that of KS100 and KS300. Compared with the KS0 treatment, the net profit of the potassium fertilizer treatments increased significantly with an increase in the potassium dosage. The KS200 treatment had the highest net profit in two years, which was 31% higher in 2018 and 29% higher in 2019 than the control treatment. Overall, the KS200 treatment provided the greatest economic benefits.
Table 9.
Mean annual revenue, costs, and net profits from different treatments in 2018 and 2019.
4. Discussion
4.1. Plant Photosynthesis
Photosynthesis is an essential component of the sweet potato metabolism. Photosystem II (PSII) is a sensitive component, where the function of the PSII reaction center is the key link that limits the regular operation of photosynthesis and the utilization of light energy [21]. Chlorophyll fluorescence induction dynamics of leaves can easily and quickly reflect the functional changes of the PSII reaction center, electron donor side, and receptor side [22]. By studying photosynthetic characteristics and chlorophyll fluorescence dynamics, one can understand the absorption, conversion, and utilization efficiency of the photosynthetic system of sweet potatoes at the micro level. In this study, the values of SPAD, chlorophyll fluorescence, and photosynthetic parameters in the potassium fertilizer treatments were markedly higher than those in the control and KS0 treatments. In general, based on their higher photosynthetic parameters, the KS200 and KS300 treatments delayed leaf senescence, significantly improving the SPAD and Pn values compared with the KS100 treatment. However, no significant difference was observed between the KS200 and KS300 treatments, indicating that the improvement in leaf photosynthesis with increasing potassium dosage was limited [23].
4.2. Potassium Uptake and Potassium-Use Efficiency
The amount of potassium absorbed by sweet potatoes gradually increases with the formation of sweet potato tuber roots, and the appropriate potassium is crucial for starch formation [24,25]. Consequently, it is necessary to ensure a sufficient supply of potassium for sweet potatoes to obtain a high quality and yield. The present study demonstrated that the application of potassium fertilizer significantly increased the potassium accumulation rate of sweet potato plants, advanced the maximum rate of potassium accumulation time, increased the amount of potassium accumulation, and increased the amount of dry matter accumulation. The potassium uptake of KS200 was significantly higher than that of KS100 and even better than that of KS300, especially in the later growth periods of sweet potatoes. Moreover, excessive application of potassium leads to extravagant absorption of potassium and decreases the potassium-use efficiency [26].
Appropriate potassium uptake guarantees a high efficiency of potassium fertilizer use. High potassium fertilizer-use efficiency indicates efficient potassium fertilizer application, leading to a high yield [27]. Many parameters describe fertilizer-use efficiency, such as the apparent utilization rate of fertilizer, harvest index of fertilizer elements, fertilizer efficiency coefficient, agronomic-use efficiency, partial productivity, and crop production coefficient [28]. The present study used the KAE and KRE. The KAE and KRE of the KS200 treatment were significantly higher than those of KS100 and KS300, which might be due to the appropriate potassium uptake [29]. Moreover, even if the potassium uptake of KS300 was higher than that of KS100, KAE and KRE were lower, which might be caused by the high potassium fertilizer dosage input.
4.3. Yield and Starch Index of Sweet Potato
The application of potash fertilizer can significantly promote the expansion of potato blocks, thus increasing their weight of potato blocks [30]. The long-term absence of potash fertilizer delays the expansion period of potato blocks, reduces daily weight gain, and decreases the yield of fresh potatoes [31]. In this study, compared with the potassium fertilizer treatments, no potassium treatment could improve the T/R ratio, but the dry matter yield per unit area significantly decreased. Increasing the application of the potassium fertilizer dosage can simultaneously improve the distribution ratio of dry matter in tuber roots, effectively restrain the excessive growth of stem and leaf on the ground, and boost the tuber root yield.
Starch content is a critical factor that restricts sweet potato yield, which is not only affected by water, temperature, and light but also regulated by potassium nutrients [32]. In this study, increasing the application of the potassium fertilizer dosage had little effect on the amylopectin content of sweet potato, mainly by increasing the amylopectin content of sweet potato varieties and increasing the amylose/amylopectin ratio [33]. Starch biosynthesis involves the following three processes. (1) the production of adenosine diphosphate glucose; (2) the synthesis of amylopectin under the catalysis of free starch synthetase; (3) the synthesis of amylose under the catalysis of bound starch synthetase [34]. Potassium application increases amylose content by increasing the activity of bound starch synthetase, which may be one of the physiological reasons for the potassium fertilizer application to regulate the starch content of sweet potatoes [35]. Furthermore, the effects of various potassium fertilizer dosages on the starch index were insignificant, and the effects of genetic regulation on the starch index might be greater than those of fertilization [36].
5. Conclusions
In summary, the application of potassium fertilizer increased the potassium content in sweet potato plants, thereby increasing the chlorophyll content, activity of photosystem II, net photosynthetic rate, amylose content in tuber roots, and total starch content and yield of sweet potato. The KS200 treatment increased the soil potassium content, potassium uptake, KAE, and KRE. Furthermore, the net profit in the KS200 treatment also increased by 3.18–31.11% in 2018 and 1.49–28.89% in 2019 compared with that in the other treatments. According to the factors of sweet potato yield and starch content, the recommended dosage of potassium fertilizer is 200 kg ha−1, which has significant economic benefits and theoretical value.
Author Contributions
X.Y. and J.G. conceived and designed the experiments. Z.L. and X.Y. wrote the manuscript. S.L., X.H. and Q.L. analyzed the data. H.L., Y.L. and Q.Z. (Qingping Zhang) were involved in the related discussion. Q.Z. (Qichao Zhao) improved the English proficiency. All authors have read and agreed to the published version of the manuscript.
Funding
This research was funded by the National Natural Science Foundation of China (32202601/42007091/42077061), Shandong Provincial Natural Science Foundation, China (ZR2020QC163), Key Research and Development Program of Shandong Province (2022SFGC0305), and the Project of Young Innovation Team in the Universities of Shandong Province (2023KJ218).
Data Availability Statement
Data are contained within the article.
Acknowledgments
We thank the Home for Researchers editorial team (www.home-for-researchers.com) (accessed on 1 December 2023) for language editing services.
Conflicts of Interest
The authors declare no conflict of interest.
References
- Lai, J.H.; Liu, T.K.; Liu, B.; Kuang, W.G.; Song, S.L. First report of curvularia plantarum causing leaf spot on sweet potato (Ipomoea batatas L.) in China. Plant Dis. 2022, 106, 1. [Google Scholar] [CrossRef] [PubMed]
- Guo, J.J.; Liu, L.Z.; Lian, X.J.; Li, L.; Wu, H. The properties of different cultivars of Jinhai sweet potato starches in China. Int. J. Biol. Machromol. 2014, 67, 1–6. [Google Scholar] [CrossRef] [PubMed]
- Motsa, N.M.; Modi, A.T.; Mabhaudhi, T. Sweet potato (Ipomoea batatas L.) as a drought tolerant and food security crop. S. Afr. J. Sci. 2015, 111, 1–8. [Google Scholar] [CrossRef] [PubMed]
- Jia, R.X. Weather shocks, sweet potatoes and peasant revolts in historical China. Econ. J. 2014, 124, 92–118. [Google Scholar] [CrossRef]
- Liu, Q.C. Sweet potato omics and biotechnology in China. Plant Omics. 2011, 4, 295–301. [Google Scholar]
- Lamaro, G.P.; Tsehaye, Y.; Girma, A.; Vannini, A.; Fedeli, R.; Loppi, S. Evaluation of Yield and Nutraceutical Traits of Orange-Fleshed Sweet Potato Storage Roots in Two Agro-Climatic Zones of Northern Ethiopia. Plants 2023, 12, 1319. [Google Scholar] [CrossRef] [PubMed]
- Lamaro, G.P.; Tsehaye, Y.; Girma, A.; Vannini, A.; Fedeli, R.; Loppi, S. Essential Mineral Elements and Potentially Toxic Elements in Orange-Fleshed Sweet Potato Cultivated in Northern Ethiopia. Biology 2023, 12, 266. [Google Scholar] [CrossRef] [PubMed]
- Liu, M.; Zhang, A.J.; Chen, X.G.; Jin, R.; Li, H.M.; Tang, Z.H. The effect of potassium deficiency on growth and physiology in sweet potato (Ipomoea batatas L.) during early growth. Hort. Sci. 2017, 52, 1020–1028. [Google Scholar]
- Wang, J.D.; Zhu, G.P.; Dong, Y.; Zhang, H.; Rengel, Z.; Ai, Y.C.; Zhang, Y.C. Potassium starvation affects biomass partitioning and sink-source responses in three sweet potato genotypes with contrasting potassium-use efficiency. Crop Pasture Sci. 2018, 69, 506–514. [Google Scholar] [CrossRef]
- Nascimento, S.M.C.; Ceclio-Filho, A.B.; Silva, A.S.N.D.; Vargas, P.F. Carotene yield in sweet potato after potassium and phosphorus fertiliser application. Rev. Caatinga 2019, 32, 851–857. [Google Scholar] [CrossRef]
- Zhang, S.H.; Wang, H.D.; Fan, J.L.; Zhang, F.C.; Cheng, M.H.; Yang, L.; Ji, Q.Y.; Li, Z.J. Quantifying source-sink relationships of drip-fertigated potato under various water and potassium supplies. Field Crops Res. 2022, 285, 108604. [Google Scholar] [CrossRef]
- Song, X.D.; Liu, F.; Wu, H.Y.; Cao, Q.; Zhang, G.L. Effects of long-term K fertilization on soil available potassium in east China. Catena 2020, 188, 104412. [Google Scholar] [CrossRef]
- Chen, X.Q.; Li, T.; Lu, D.J.; Cheng, L.; Zhou, J.M.; Wang, H.Y. Estimation of soil available potassium in chinese agricultural fields using a modified sodium tetraphenyl boron method. Land Degrad. Dev. 2020, 31, 1737–1748. [Google Scholar] [CrossRef]
- Zhu, X.D.; Li, Z.H.; Guo, L.X.; Lu, J.W.; Cong, R.H.; Ren, T.; Li, X.K. Main driving factors and responses to increase in soil available potassium in the yangtze river basin over the past 30 years. Land Degrad. Dev. 2021, 32, 4484–4493. [Google Scholar] [CrossRef]
- Li, C.Z.; Zhao, X.L.; Liu, X.W.; Lu, D.J.; Chen, X.Q.; Wang, H.Y.; Zhou, J.M. Rice and wheat yield and soil potassium changes in response to potassium management in two soil types. Nutr. Cycl. Agroecosystems 2020, 117, 121–130. [Google Scholar] [CrossRef]
- Zhang, J.; Balkovič, J.; Azevedo, L.B.; Skalský, R.; Bouwman, A.F.; Xu, G.; Wang, J.Z.; Xu, M.G.; Yu, C.Q. Analyzing and modelling the effect of long-term fertilizer management on crop yield and soil organic carbon in China. Sci. Total Environ. 2018, 627, 361–372. [Google Scholar] [CrossRef]
- Wang, H.D.; Wu, L.F.; Wang, X.K.; Zhang, S.H.; Cheng, M.H.; Feng, H.; Fan, J.L.; Zhang, F.C.; Xiang, Y.Z. Optimization of water and fertilizer management improves yield, water, nitrogen, phosphorus and potassium uptake and use efficiency of cotton under drip fertigation. Agric. Water Manag. 2021, 245, 106662. [Google Scholar] [CrossRef]
- Zheng, W.; Sui, C.; Liu, Z.; Geng, J.; Tian, X.; Yang, X.; Zhang, M. Long-term effects of controlled-release urea on crop yields and soil fertility under wheat-corn double cropping systems. Agron. J. 2016, 108, 1703–1716. [Google Scholar] [CrossRef]
- Deng, F.; Yang, F.; Li, Q.P.; Zeng, Y.L.; Li, B.; Zhong, X.Y.; Lu, W.; Wang, L.; Chen, H.; Ren, W.H. Differences in starch structural and physicochemical properties and texture characteristics of cooked rice between the main crop and ratoon rice. Food Hydrocolloid. 2021, 116, 106643. [Google Scholar] [CrossRef]
- Chen, J.Q.; Guo, Z.D.; Chen, H.N.; Yang, X.Y.; Geng, J.B. Effects of different potassium fertilizer types and dosages on cotton yield, soil available potassium and leaf photosynthesis. Arch. Agron. Soil Sci. 2021, 67, 275–287. [Google Scholar] [CrossRef]
- Torabi, S.; Umate, P.; Manavski, N.; Plöchinger, M.; Kleinknecht, L.; Bogireddi, H.; Herrmann, R.G.; Wanner, G.; Schröder, W.P.; Meurer, J. PsbN is required for assembly of the photosystem ii reaction center innicotiana tabacum. Plant Cell 2014, 26, 1183–1199. [Google Scholar] [CrossRef] [PubMed]
- Murphy, C.D.; Ni, G.; Li, G.; Barnett, A.; Xu, K.; Grant-Burt, J.; Liefer, J.D.; Suggett, D.J.; Campbell, D.A. Quantitating active photosystem ii reaction center content from fluorescence induction transients. Limnol. Oceanogr. Meth. 2017, 15, 54–69. [Google Scholar] [CrossRef]
- Jaiswal, V.P.; Shukla, S.K.; Sharma, L.; Singh, I.; Pathak, A.D.; Nagargade, M.; Ghosh, A.; Gupta, C.; Gaur, A.; Awasthi, S.K.; et al. Potassium influencing physiological parameters, photosynthesis and sugarcane yield in subtropical India. Sugar Tech 2021, 23, 343–359. [Google Scholar] [CrossRef]
- Guo, K.; Liu, T.X.; Xu, A.H.; Zhang, L.; Bian, X.F.; Wei, C.X. Structural and functional properties of starches from root tubers of white, yellow, and purple sweet potatoes. Food Hydrocolloid. 2018, 89, 829–836. [Google Scholar] [CrossRef]
- Gao, Y.; Tang, Z.H.; Xia, H.Q.; Sheng, M.F.; Liu, M.; Pan, S.Y.; Li, Z.Y.; Liu, J.R. Potassium fertilization stimulates sucrose-to-starch conversion and root formation in sweet potato (Ipomoea batatas L.). Int. J. Mol. Sci. 2021, 22, 4826. [Google Scholar] [CrossRef] [PubMed]
- Li, Q.; Kuo, Y.W.; Lin, K.H.; Huang, W.; Deng, C.; Ye, K.W.; Chen, S.P. Piriformospora indica colonization increases the growth, development, and herbivory resistance of sweet potato (Ipomoea batatas L.). Plant Cell Rep. 2021, 40, 339–350. [Google Scholar] [CrossRef] [PubMed]
- Sultana, T.; Chowdhury, A.H.; Saha, B.K.; Rahman, A.; Chowdhury, T.; Sultana, R. Response of aloe vera to potassium fertilization in relation to leaf biomass yield, its uptake and requirement, critical concentration and use efficiency. J. Plant Nutr. 2021, 44, 2081–2095. [Google Scholar] [CrossRef]
- Limeneh, D.F.; Beshir, H.M.; Mengistu, F.G. Nutrient uptake and use efficiency of onion seed yield as influenced by nitrogen and phosphorus fertilization. J. Plant Nutr. 2020, 43, 1229–1247. [Google Scholar] [CrossRef]
- Liu, C.K.; Tu, B.J.; Wang, X.; Jin, J.; Li, Y.S.; Zhang, Q.Y.; Liu, X.B.; Ma, B.L. Potassium translocation combined with specific root uptake is responsible for the high potassium efficiency in vegetable soybean. Crop Pasture Sci. 2020, 70, 516–525. [Google Scholar] [CrossRef]
- Farooque, A.A.; Zare, M.; Abbas, F.; Bos, M.; Esau, T.; Zaman, Q. Forecasting potato tuber yield using a soil electromagnetic induction method. Eur. J. Soil Sci. 2020, 71, 880–897. [Google Scholar] [CrossRef]
- Gaj, R.; Borowski-Beszta, J. Effects of foliar fertilization with potassium and micronutrients on potato yield and quality. Eur. J. Hortic. Sci. 2020, 85, 394–400. [Google Scholar] [CrossRef]
- Yang, S.T.; Liu, X.J.; Qiao, S.; Tan, W.F.; Li, M.; Feng, J.Y.; Zhang, C.; Kang, X.; Huang, T.B.; Zhu, Y.L.; et al. Starch content differences between two sweet potato accessions are associated with specific changes in gene expression. Funct. Integr. Genomic. 2018, 18, 613–625. [Google Scholar] [CrossRef] [PubMed]
- Ratuszniak, E.; Kubas, A. Research on size of starch grains in different potato cultivars for the possibility of reduction of environment pollution with wastes from starch production. Rocz. Ochr. Srodowiska 2020, 12, 409–418. [Google Scholar]
- Takiko, S.; Motoyasu, O.; Tatsuro, H.; Sun-Hyung, K. Increase of amylose content of sweetpotato starch by RNA interference of the starch branching enzyme II gene (IbSBEII). Plant Biotechnol. 2006, 23, 85–90. [Google Scholar]
- Flis, B.; Zimnoch-Guzowska, E.; Mankowski, D. Correlations among yield, taste, tuber characteristics and mineral contents of potato cultivars grown at different growing conditions. J. Agric. Sci. 2012, 4, 197–207. [Google Scholar] [CrossRef]
- Zhang, L.L.; Yang, Y.; Li, X.H.; Li, X.N.; Zhang, H.J.; Zhang, Z.; Xu, Y.H. Starch flocculation by the sweet potato sour liquid is mediated by the adhesion of lactic acid bacteria to starch. Front. Microbiol. 2017, 8, 1412. [Google Scholar] [CrossRef]
Disclaimer/Publisher’s Note: The statements, opinions and data contained in all publications are solely those of the individual author(s) and contributor(s) and not of MDPI and/or the editor(s). MDPI and/or the editor(s) disclaim responsibility for any injury to people or property resulting from any ideas, methods, instructions or products referred to in the content. |
© 2024 by the authors. Licensee MDPI, Basel, Switzerland. This article is an open access article distributed under the terms and conditions of the Creative Commons Attribution (CC BY) license (https://creativecommons.org/licenses/by/4.0/).