Article

Layout of Suspension-Type Small-Sized Dehumidifiers Affects Humidity Variability and Energy Consumption in Greenhouses

1
Department of Smart Agricultural Systems, Graduate School, Chungnam National University, Daejeon 34134, Republic of Korea
2
Department of Agricultural and Industrial Engineering, Hajee Mohammad Danesh Science and Technology University, Dinajpur 5200, Bangladesh
3
Department of Agricultural Machinery Engineering, Graduate School, Chungnam National University, Daejeon 34134, Republic of Korea
4
Shinan Green-Tech Co., Ltd., Suncheon 58027, Republic of Korea
*
Author to whom correspondence should be addressed.
Horticulturae 2024, 10(1), 63; https://doi.org/10.3390/horticulturae10010063
Submission received: 23 November 2023 / Revised: 5 January 2024 / Accepted: 6 January 2024 / Published: 8 January 2024

Abstract

:
In greenhouse management, maintaining optimal humidity is essential for promoting plant growth, including photosynthesis, and preventing diseases and pests. Addressing spatial variability requires sensor-based monitoring for informed decisions on humidification systems, particularly for small, and suspension-type dehumidifiers. This study aims to assess the impact of various layouts of small-sized suspension-type dehumidifiers on vertical, spatial, and temporal humidity variability, along with energy consumption in a greenhouse. During experiments in a 648 m³ (18 m × 6 m × 6 m) plastic greenhouse, dehumidifiers were placed at four different layouts: one at the center (Layout 1), one on each side (Layout 2), two units at the center facing opposite directions (Layout 3), and two units on one side facing the center (Layout 4). Temperature and humidity (TH) sensors were connected to a microcontroller, facilitating wireless data acquisition, storage, and remote monitoring. The actuator was controlled through a relay module, and current sensors monitored power consumption. Spatial interpolation and mapping were employed using mapping software. These layouts reduced humidity from 89.30% to 51.10%, with Layout 2 displaying the most consistent humidity distribution. Water removal efficiency varied among layouts, with Layout 2 exhibiting the highest (61.15 L) and overall performance of 50%, while Layouts 1, 3, and 4 exhibited lower efficiencies of 40%, 44%, and 49%, respectively. Power consumption ranged from 0.506 to 0.528 kW for the dehumidifier and 0.242 to 0.264 kW for the fan. The findings highlighted that positioning the dehumidifier on both sides, facing towards the center (Layout 2), resulted in the most uniform humidity control within the greenhouse. The optimal layout of small suspension-type dehumidifiers in greenhouses would significantly improve humidity control, promoting plant growth.

1. Introduction

Humidity control is an important aspect of managing greenhouses as excessive humidity, along with condensation, can lead to fungal diseases and damage to crops [1]. Proper greenhouse humidity management is regarded as a crucial factor for several reasons [2]. First, it ensures optimal plant growth conditions, including healthy growth and photosynthesis [3]. Second, it assists in disease and pest prevention, reducing the reliance on chemical treatments, enhances energy efficiency, and preserves greenhouse structural integrity by preventing excessive moisture-related damage [4]. The main concern of greenhouse cultivation is to make a favorable microclimate, maintaining a favorable level of environmental variables [2]. The traditional method of controlling humidity using heating, ventilation, and air conditioning consumes significant energy [3,4,5]. To address this, various energy-saving humidity control systems have been developed, but achieving uniform humidity remains a challenge [6,7].
Research on humidity-control techniques began in the 1940s to determine the best humidity range for crop growth and prevent crop damage [8]. Several dehumidification systems, such as liquid desiccant, solar desalination, and compressor-type systems, have been explored to maintain a healthy greenhouse environment [9,10,11,12,13,14,15]. While large greenhouses often use high-energy-consuming dehumidifiers, small dehumidifiers offer more uniform humidity distribution [16]. Some multipole-independent control techniques with dehumidifiers have been introduced for large greenhouses to manage different zone environments effectively [17].
The challenges posed by spatial and vertical variability in humidification inside the greenhouse need the implementation of sensor-based humidity monitoring systems at various points [18]. These issues arise due to the diverse microclimates present within the greenhouse environment. To address these challenges, humidity levels must be measured at various points throughout the greenhouse using specialized sensors [18]. Passive humidity measurement techniques involve strategically positioning sensors at different locations and heights within the greenhouse structure. Sensors placed strategically throughout the greenhouse passively measure humidity levels, providing essential data for effective humidity control [19]. These sensors enable the detection of spatial variations, identifying areas where humidity may be excessively high or low, and facilitate vertical monitoring to assess variations at different heights within the greenhouse. By collecting passive humidity data at multiple points, greenhouse operators can make informed decisions regarding the activation or adjustment of humidification systems, ensuring a more uniform and optimal humidity distribution that promotes consistent plant growth and minimizes the risk of humidity-related issues such as mold, diseases, or uneven crop development [19].
Humidity response and variability significantly impact humidity uniformity in crop growth [18]. Various techniques have been studied to achieve uniform humidity distribution, including improving natural ventilation efficiency [19]. An essential aspect of this effort involves understanding how humidity responds over time and across different layers and planes [20,21,22]. In the context of assessing humidity distributions under diverse conditions, this research focuses on investigating various dehumidifier positions. The aim was to evaluate the performance of two dehumidifiers strategically placed to provide valuable insights essential for the effective management of greenhouse environments. Therefore, in this research, different positions of dehumidifiers were considered to evaluate the performance of two dehumidifiers and that could provide useful key outcomes for the management of the greenhouse environment.
To measure the impact of various component placements, Kempkes and Van de Braak [23], as well as Kempkes et al. [24], examined environmental uniformity. The regional distribution of temperature and relative humidity was studied by Ahmed et al. [25] and Al-Helal et al. [26] in several greenhouses. To assess the humidity distribution across time, the humidity response is essential [26]. To determine the humidity distribution under varying circumstances, it is necessary to evaluate the humidity level in various layers and planes [27]. As a result, the humidity condition for dehumidifier operation for different positions, which is normally utilized to study distinct layers on spatial and vertical planes, was used to investigate humidity responsiveness and variability.
Vapor-compression [28] and desiccant dehumidifier [29] are two of the more modern dehumidifying methods employed. Most greenhouses have room for one or two of the standard dehumidifiers. This kind of dehumidifier requires a large space, and a high level of electricity (5–20 kW), and is costly. This research, however, made use of a condensation mechanism. The primary benefits of this method lie in the use of small, safe, low-power (0.5 kW), and silent technology that has a major effect on dehumidifying the environment. A combination of different layouts of dehumidifiers can uniformly control the greenhouse environment. Dehumidifiers of this size were originally designed to supplement greenhouse watering systems by extracting moisture from the air [30].
A suspension-type small-sized dehumidifier is preferred over a traditional big-sized dehumidifier within a medium-sized greenhouse for several compelling reasons. Initially, the passive construction of a suspension-type dehumidifier allows it to be conveniently hung at an elevated position within the greenhouse [31]. This positioning takes advantage of the natural tendency of humid air to rise, effectively capturing moisture where it is most concentrated, near the canopy level where plants transpire the most. In contrast, traditional big-sized dehumidifiers are often floor-mounted, resulting in less efficient moisture removal as they struggle to extract humidity from the lower regions of the greenhouse [32]. Then, the small size and suspension placement of dehumidifiers reduce the obstruction of valuable floor space in the greenhouse, providing more room for plant cultivation. Traditional big-sized dehumidifiers, due to their bulk, consume a significant portion of the greenhouse floor area, limiting plant placement and potentially hindering the uniform distribution of light and air [33]. Furthermore, the compact nature of suspension-type dehumidifiers facilitates easier maintenance and servicing, as they can be accessed without the need for extensive disassembly or disruption to the greenhouse environment [33]. Conversely, larger traditional dehumidifiers may require substantial effort and time for maintenance, potentially causing downtime in critical periods of plant growth [33].
The positioning of a suspension-type dehumidifier within greenhouses is a crucial factor [34]. The strategic placement of the dehumidifier at an optimal height within the greenhouse takes advantage of the natural tendency of humid air to rise [35]. This passive layout allows the dehumidifier to effectively target and extract moisture from the air where it is most concentrated, typically near the canopy level where plants transpire the most [36]. By doing so, it promotes a more uniform and controlled humidity environment, which is essential for plant health and productivity.
The objective of this research was to evaluate the effects of the layout of a small-sized suspension-type dehumidifier on humidity variability and energy consumption in a greenhouse.

2. Materials and Methods

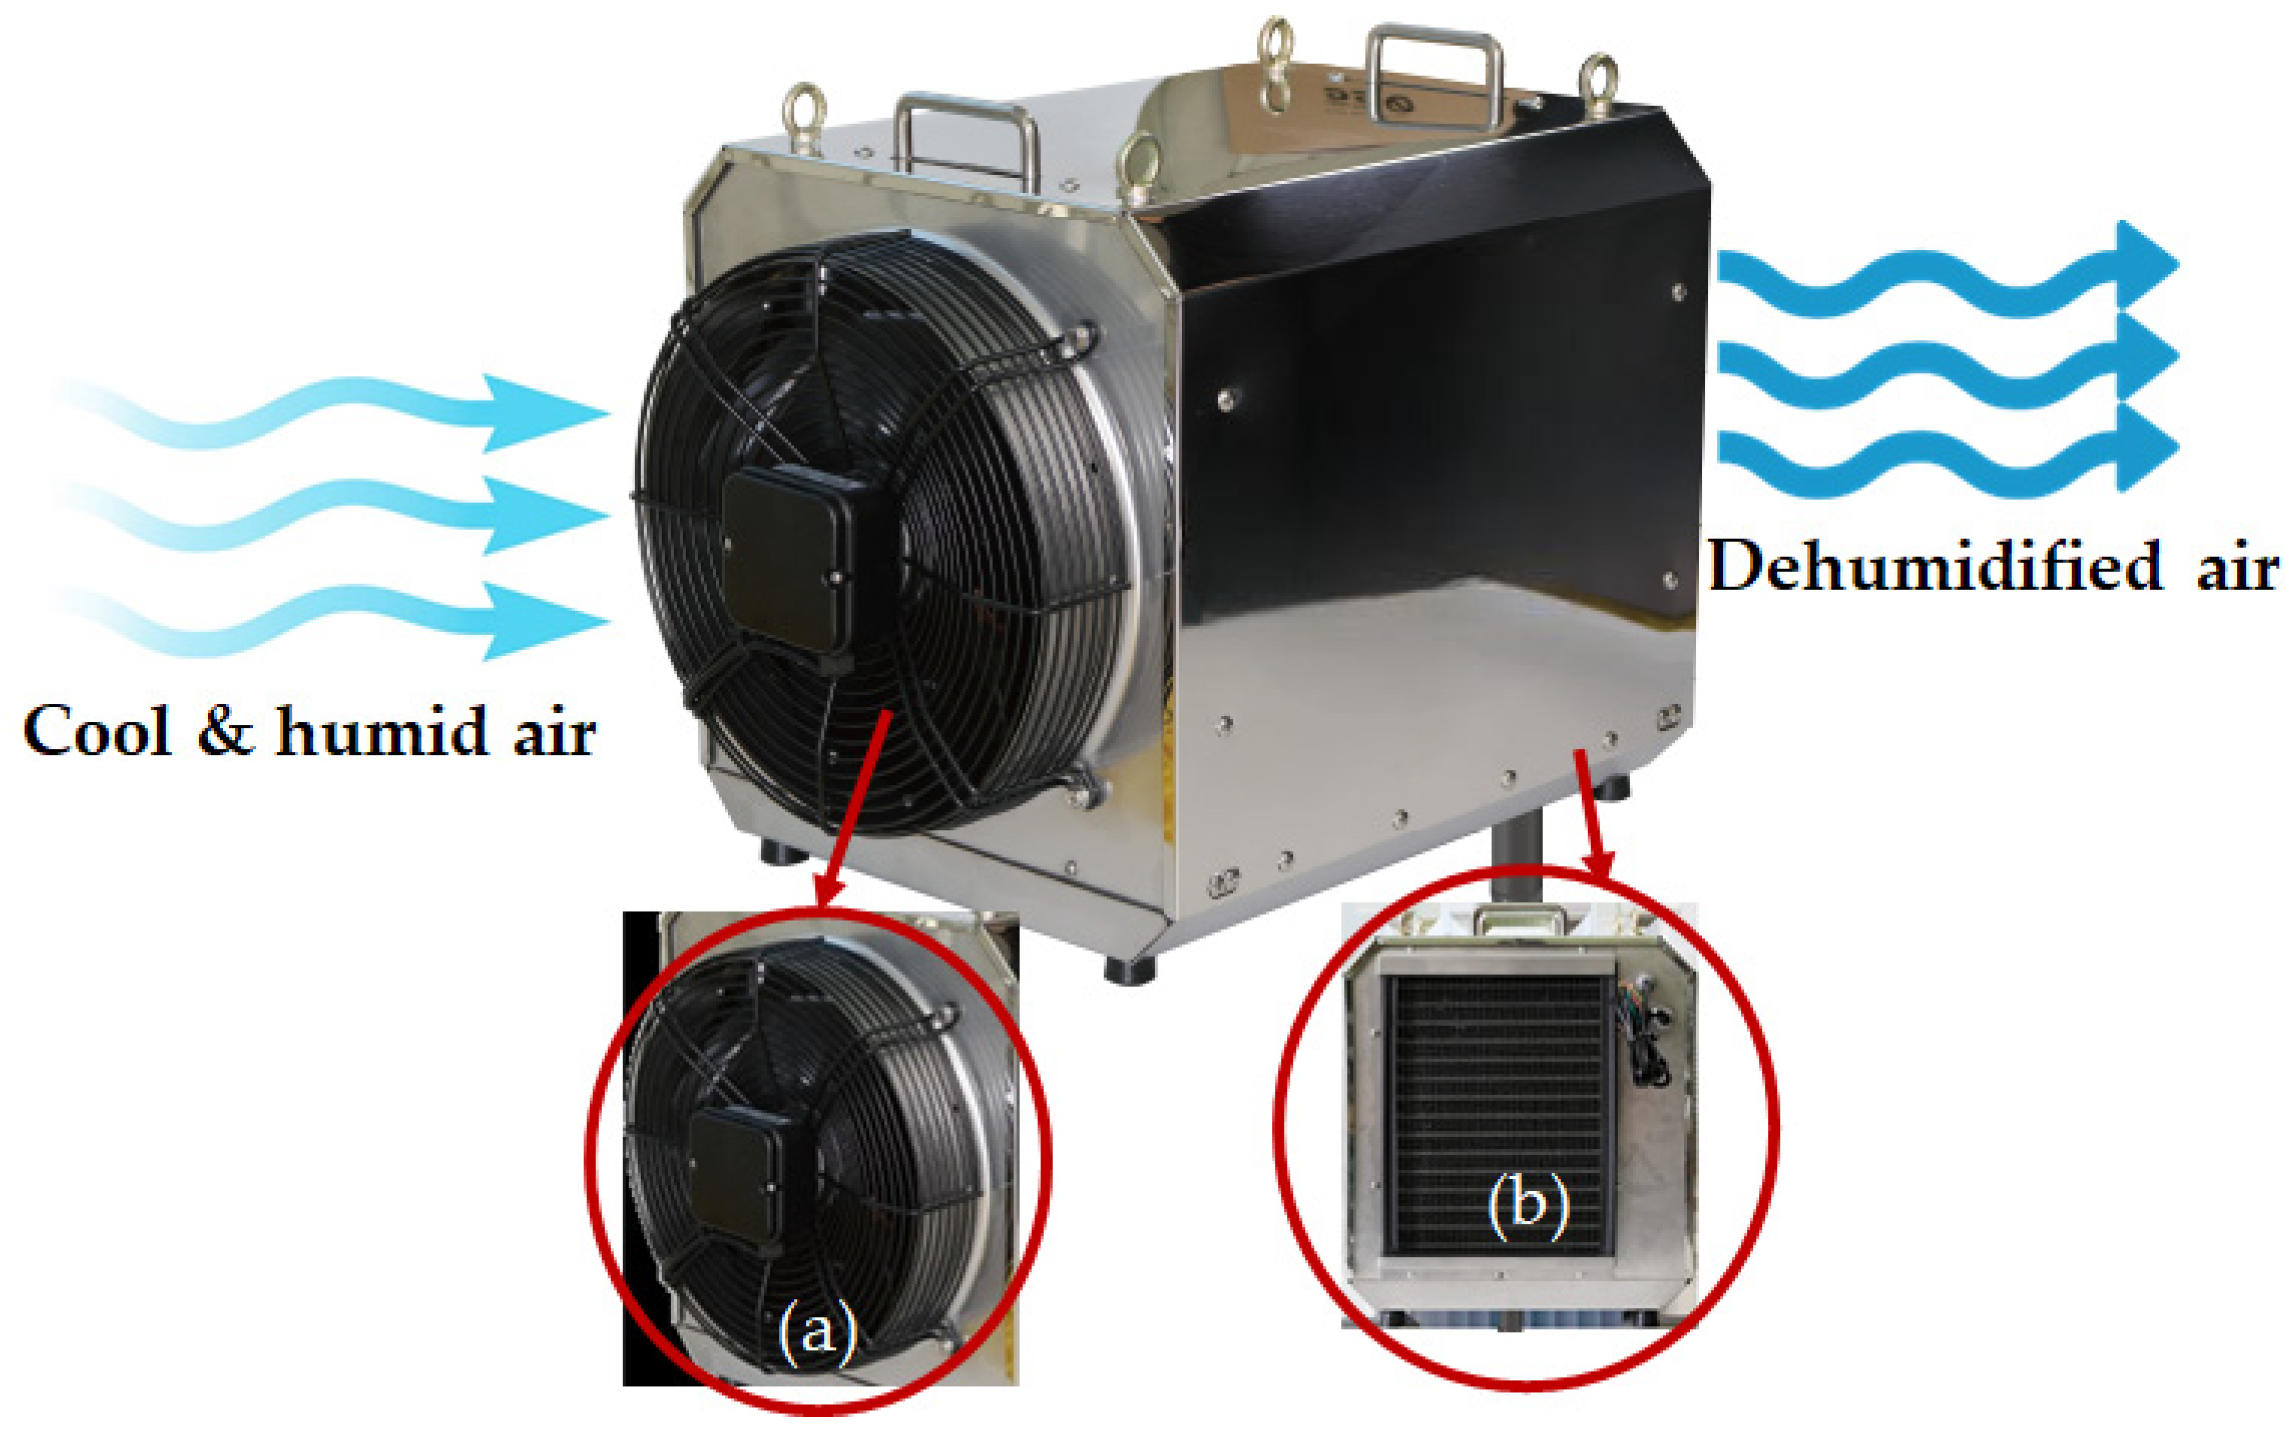
2.1. Structure and Working Principle of the Dehumidification Module

A prototype of a dehumidifier under construction, utilized in this study, consisted of a dehumidifier module and a fan, as illustrated in Figure 1. These components were assembled in series inside a cylindrical casing. The dehumidifier module operated on the condensation type, consuming 0.560 kW during operation. The specifications of the dehumidifier are detailed in Table 1. The fins of the dehumidifier were coated with aluminum to make it better to form water droplets. The fin pitch of the condenser evaporator is 1.2 mm with coil specifications of Ø × 2R × 14S × 190EL and Ø × 2R × 12S × 190EL.
Figure 2 illustrates the dehumidification process using a flow diagram, outlining the operational principle of a suspension-type dehumidifier with a fan (0.1 kW). The dehumidifying method involves removing humidity from the air by cooling it below the dew point, which causes the humidity (condensation) to drop out. Condensation air dehumidifiers are used in this method. The main elements of the dehumidifier include an extractor fan, a compressor (0.6 kW), heat exchangers (condenser and evaporator), and an extractor element. The extractor fan forces humid air to flow through the heat exchangers. The evaporator temperature is maintained to be lower than the dew point temperature, which causes the dropping out (condensation) of the steam contained in the air on the evaporator walls. The condensed water is gathered in a dehumidifier tank and removed to a sewage system or discarded outside. After passing through the evaporator, the cooled dried air flows through the condenser and is released into the greenhouse. The amount of water contained in the air effectively decreases as the operation time of machines increases in a closed room.
The dehumidification process depicted in Figure 2 involves the intake of humid air, cooling and condensing the vapor to remove water, and ultimately producing dry air as the output from the dehumidifier. The process begins with humid air from the greenhouse entering the dehumidifier at point 1. As the air is cooled, vapor condensation begins, and this phase continues until point 2. During this condensation process, water is effectively removed from the air. At point 3, the air is further condensed by the condenser, resulting in the final dehumidified air. Subsequently, the dehumidifier releases dry air as the output.

2.2. Temperature and Humidity Sensor and Actuator Interface

In this experiment, temperature, and humidity (TH) sensors (Model: the AM2305 (DHT22), Aosong Electronic Co., LTD., Guangzhou, China.), were chosen for functional control of the dehumidifier. The decision to use this sensor was based on several major specifications that made it suitable for the application. First, the TH sensor had a wide measuring range, capable of accurately detecting temperature variations from −40 °C to 80 °C and humidity levels from 0% to 100%. This broad range allowed it to perform effectively in various environmental conditions. Second, the high accuracy with ±0.5 °C temperature and ±1% humidity ensured precise measurements, which was crucial for monitoring and controlling the operation of the dehumidifier accurately. Third, the sensor offered a digital output signal, making it easy to interface with the control system of the dehumidifier. This digital output simplified data processing and integration into the experimental setup. Furthermore, the TH sensor operated within a suitable input power range of 3.5–5.5 V, which was likely compatible with the power supply used in the experiment.
The primary objective was to monitor and control the temperature and humidity levels inside a greenhouse using TH sensors. These sensors were connected to a microcontroller (Model: Raspberry Pi 4, Raspberry Pi Foundation, Cambridge, United Kingdom), which acts as the central processing unit for data acquisition and storage. The entire setup was connected through a Wi-Fi network, enabling wireless communication between the components. The TH sensors were interfaced with the microcontroller using three pins: Voltage, Ground, and Signal. The communication protocol between the Raspberry Pi and the TH sensors was based on a specific sequence of signals. To initiate data exchange, the microcontroller sends a start signal to the TH sensor by pulling the Signal pin low. Upon detecting this start signal, the TH sensor was prepared to respond and provide the requested data. The TH sensor transmits data using a specific signal pattern for each bit: a 50 µs low signal represents Bit 0, and a 70 µs low signal represents Bit 1. This encoding method enables the sensors to send temperature and humidity readings efficiently to the Microcontroller.
Sensor data were collected with a frequency of 4 Hz, whereas the data was logged in the computer at a frequency of 1 Hz by averaging every 4 data to minimize the error. The power consumption and the required time for the humidity changes were recorded in the microcontroller. After collecting the data, the Savitzky-Golay filter was applied to remove the noise from the data [31]. The data was then stored on the microcontroller as CSV file format. To enable remote access and monitoring, the microcontroller is configured to transmit the stored data to mobile devices using the Virtual Network Computing (VNC) (Olivetti & Oracle Research Lab, Cambridge, UK) protocol. This allows users to access real-time data and control the greenhouse environment from anywhere through their mobile devices.
Figure 3 represents the physical connections and layout of the components, and illustrates how the TH sensors and Wi-Fi network are interconnected to form a coherent wireless sensor network for greenhouse monitoring and control. By employing this setup, the structure provided an efficient and reliable wireless sensor network (WSN) for the greenhouse. The microcontroller can activate or deactivate actuators such as fans, heaters, and dehumidifiers through an actuator controller to maintain the desired environmental conditions.
The primary purpose of this setup was to create a sophisticated greenhouse environment control system. Figure 3 illustrates the relay module working process and the setup, where the relay module interfaces with the microcontroller. The relay module acts as a switch to turn on or off the actuators based on distinct temperature and humidity levels. A logic was set in the Python program to operate the module until the average temperature of 27 TH sensor nodes reached the desired level, and a relay was used as a switch to control the dehumidifier. By monitoring the greenhouse environment, the microcontroller can activate the relay module when the temperature or humidity goes beyond the desired range, ensuring optimal growing conditions.
The evaluation of the performance of the dehumidifier with a heating module was conducted through the recording of the ON/OFF signal in the context of predefined environmental control variables illustrated in Figure 4. The dehumidifier module was configured to maintain a humidity level of 60% or higher, while the heating module was set to activate when the temperature within the greenhouse fell below 10 °C. The initiation of the heating module occurred in response to a temperature drop below the specified threshold. Simultaneously, if the humidity level surpassed 60%, the dehumidifier module would be activated independently. The operational parameters, including fan activity, were adjusted to sustain optimal humidity and temperature levels. The control algorithm employed in this experiment is depicted in Figure 4, illustrating the orchestrated activation of the dehumidifier and heating modules to uphold the desired environmental conditions.
Additionally, a current sensor was incorporated into the system to monitor the electricity consumption of the actuators. The current sensor provides data in Ampere (A), which was converted to power (kW) using Equation (1).
P = V × A
where, P is power (kW), V is voltage, and A is ampere.
The data acquired from the current sensor, as well as the relay module, are transferred to the Raspberry Pi and stored in CSV file format, which can be accessed remotely through the VNC protocol.

2.3. Experimental and Analytical Procedures

2.3.1. Experimental Site Description (Greenhouse), Sensor Locations, and Dehumidifier Layouts

The experiment took place within a plastic-covered and steel-framed greenhouse under non-crop conditions, situated in the Chungnam National University (CNU) research field in the Republic of Korea. The greenhouse had a total area of 648 m3, with dimensions of 18 m in length, 6 m in width, and a height of 6 m. The specific coordinates of the location are 36.368814° N latitude and 127.354000° W longitude. The duration of the experiment spanned from 17 July 2022 to 18 July 2022. GPS location and pictorial view of the greenhouse are shown in Figure 5a,b.
On 17 July 2022, Daejeon experienced light rain with a temperature ranging from 21 °C to 31 °C. The night was relatively cooler at 22 °C, the evening at 27 °C, and the morning at 23 °C. The cloud cover was expected to be 97%, and there was a minimal rainfall of 0.1 mm. The real feel temperature was estimated to be 31 °C. Moving on to Monday, 18 July 2022, moderate rain was anticipated, and temperatures ranged from 21 °C to 25 °C.
The night, evening, and morning temperatures were 22 °C, 23 °C, and 21 °C respectively. Cloud cover was expected to be at 100%, and a significant rainfall of 10.26 mm was forecasted. The real feel temperature for the day was projected to be 26 °C [37].
For experimental data collection, which included 27 temperature and humidity sensor modules, uniformly placed at three sections of the greenhouse with nine modules at the top, middle, and bottom layouts of each section. Sensor-to-sensor distance was 1.5 m from all sides, as illustrated in Figure 6a. The selection of vertical sensor distances within a greenhouse, specifically at 1.5 m, 3 m, and 4.5 m, was driven by the unique growth characteristics of the cultivated plants and the critical humidity range for an optimal plant growth environment [32]. Considering the growth patterns of tomato, pepper, and eggplant plants, which typically range from 0.5 to 3 m in height, with the majority growing within the 1-to-1.5 m range, the chosen sensor heights correspond to different tiers of plant growth [33,34]. Experiments were performed under the same control unit and operating parameter. Figure 6b shows a schematic diagram of the sensor node layout in the experimental greenhouses.
The performance of the dehumidifiers was assessed across different installation layouts, including a central position (Layout 1), one on each side facing the center (Layout 2), two units placed at the center facing opposite directions towards the sides (Layout 3), and two units on one side facing the center (Layout 4). These layouts are illustrated in Figure 7, where the red arrows indicate the flow of the dehumidified air. The dehumidifier was run for three hours for each setup condition (From 9 a.m. to 12 p.m. and from 2 p.m. to 5 p.m.). After conducting one set experiment, the greenhouse was left for 2 h to make the greenhouse environment in normal condition. Figure 8 shows pictorial views of the experimental conditions in a greenhouse where red circles indicate the sensors and red boxes indicate the DAQ and dehumidifier used for the experiments.

2.3.2. Data Collection and Analytical Procedures

Assessing dehumidification response time and efficiency across layouts is essential for optimizing greenhouse operations, and ensuring the health and productivity of crops, all while promoting environmental sustainability. Dehumidification response time was assessed by varying dehumidifier layouts to investigate the efficiency of water removal, with notable variations observed across layouts. Theoretical projections, based on Equation (2), anticipated an average water removal efficiency per hour, but practical experimentation was also measured.
For spatial and variability analysis, sensor data was analyzed using mapping software (Surfer 2023; Golden Software, LLC; Golden, CO, USA) according to the different planes to determine the uniformity of the humidity. The data was arranged according to the sensors’ placement for each plane. Layouts of the sensors were also assigned plane-wise in a spreadsheet and saved as a comma-separated values (CSV) file.
The Inverse Distance Weighted (IDW) [35] method was used as an analytical tool in this study. This method investigated the humidity distribution for the dehumidifier modules at the top, middle, and bottom horizontal layers. The differences between the top and bottom, middle and top, and middle and bottom layers were evaluated, and then the average difference was calculated from these results. This method was applied to all dehumidifier data acquired from the experiments.
The dehumidification efficiency (DE) of the dehumidifier is expressed as a percentage and is calculated by dividing the amount of moisture removed (MR) by the total power consumption (P) during its operation and then multiplying by 100 which was represented in Equation (2) [38]. Besides, the MR was calculated based on the volume of the greenhouse air (Vin), the difference between the indoor relative humidity inside the greenhouse (hin), and the desired relative humidity inside the greenhouse (hd), for a specified dehumidification time (t) in seconds which was illustrated in Equation (3) [39]. By utilizing these Equations, we can quantitatively assess the performance of the dehumidifier in terms of moisture removal rate and energy efficiency.
DE = MR P × 100
where DE is the dehumidification efficiency of the dehumidifier, expressed as a percentage. Moisture removed (MR) is the amount of moisture removed by the dehumidifier, measured in kilograms (kg). Total power consumption (P) is the total electrical power consumed by the dehumidifier during its operation, measured in kW.
  MR = V in × h in h d 3600 × t
where, MR is the water removal rate, measured in kilograms per hour (kg/h). Vin is the volume of the greenhouse, measured in cubic meters (m³). hin is the indoor relative humidity inside the greenhouse (%). hd is the desired relative humidity inside the greenhouse (%). t is the dehumidification time for which the dehumidifier operates, measured (s).
The methodology aimed to determine the optimal position for greenhouse dehumidification by assessing energy consumption across different dehumidifier layouts. Different dehumidifier layouts within the greenhouse were selected and systematically altered to investigate the influence of layout on energy consumption. Energy consumption data were collected for each layout. The data were analyzed to assess the energy consumption associated with each layout, allowing for a comparative evaluation of their effectiveness in dehumidifying the greenhouse environment. The layout exhibiting the lowest energy consumption and, thus, the most suitable position for greenhouse dehumidification was determined based on the analysis results.

3. Results and Discussions

3.1. Dehumidification Response Time by Dehumidifier Layout

The efficiency of water removal exhibited notable variations based on their corresponding layouts. As depicted in Figure 9, the most substantial water removal transpired at Layout 2, with a volume of 61.15 L, compared to the outcomes for Layout 3 (57.23 L), Layout 4 (56.29 L), and Layout 1 (53.70 L).
In accordance with Equation (1), the theoretical projection anticipated an average water removal efficiency of 30 L per hour. However, practical experimentation disclosed a significantly reduced efficacy, approaching nearly half of the projected performance. This disparity can be attributed to the employment of a plastic greenhouse, which posed challenges in maintaining a perfectly airtight environment.
Remarkably, the performance of the dehumidifier proved to be particularly impactful when scrutinized individually for each layout. Layout 2 emerged as the frontrunner, boasting an impressive performance of 50%. Conversely, Layout 1 and Layout 3 yielded a comparatively modest 40% efficiency, while Layout 4 exhibited a respectable 44% efficiency. These findings underscore the variability in the dehumidifier’s effectiveness based on distinct layouts within the environment.
The accuracy of different dehumidifier setup layouts was assessed through post-hoc tests, employing a Bonferroni-corrected alpha level of 0.0125 to address multiple comparisons. Significant differences in water removal and required time were revealed between specific pairs of methods in the conducted tests (Table 2). A notable distinction was found between Layout 1 (L1) and Layout 2 (L2) in terms of water removed (p = 0.005) and required time (p = 0.0106), signifying significant differences in performance. Similarly, Layout 2 (L2) and Layout 3 (L3) exhibited significant differences in both water removal (p = 0.003) and required time (p = 0.0093). However, Layout 1 (L1) did not exhibit significant differences from Layout 3 (L3) in either water removal (p = 0.14) or required time (p = 0.0721). Moreover, no significant differences were detected between Layout 1 (L1) and Layout 4 (L4) or between Layout 3 (L3) and Layout 4 (L4) concerning water removal or required time. These findings offer insights into the specific variations in performance among the layout configurations but Layout 2 outperformed other layouts in terms of water removal and time efficiency. The reliability of these observed differences was ensured by the Bonferroni-corrected post-hoc test with its adjusted alpha level.

3.2. Spatial and Vertical Variability by Dehumidifier Layout

The initial environmental condition was meticulously recorded before starting dehumidifiers on each layout and a statistical summary was generated. Table 3 represents the statistical summary of the humidity level of the greenhouse at the initial condition for each layout.
The mean humidity values for Layout 1, Layout 2, Layout 3, and Layout 4 were found to be 78.06, 77.94, 78.58, and 77.76, respectively, at the initial condition. Additionally, the median humidity values for Layout 1, Layout 2, Layout 3, and Layout 4 were recorded as 78.40, 78.10, 78.70, and 77.50, respectively for the initial condition. In Table 3, the standard deviation values for Layout 1, Layout 2, Layout 3, and Layout 4 were found to be 3.71, 3.28, 3.74, and 4.25, respectively at initial condition. Furthermore, the minimum and maximum humidity values for each layout were recorded in Table 3. For instance, the minimum humidity values for Layout 1, Layout 2, Layout 3, and Layout 4 were 70.90, 70.20, 71.90, and 69.90, respectively. These values represent the lowest recorded humidity levels. On the other hand, the maximum humidity values for the respective layouts were found to be 85.90, 85.90, 87.30, and 89.30, representing the highest recorded humidity levels. This baseline data is crucial for evaluating the performance of the dehumidifiers in achieving uniform humidity levels during their operation.
Table 3 provided a comprehensive overview of humidity levels within the greenhouse after dehumidification, highlighting variations and central tendencies at different layouts. Figure 10 provides a distribution of humidity data after dehumidification at different layouts.
The provided data highlights the humidity characteristics across four distinct layouts within a greenhouse at its initial condition. Layout 1 exhibits an average humidity of 69.17%, with a median of 68.75%. The humidity levels in this area vary with a standard deviation of 3.82, indicating a relatively moderate spread around the mean. The humidity ranges from a minimum of 57.50% to a maximum of 80.70%, suggesting fluctuations within this range. Layout 2 displays an average humidity of 61.54%, closely aligned with its median value of 62.10%. The humidity data at this layout showcases lower variability as denoted by a standard deviation of 2.54. The humidity readings range from a minimum of 51.10% to a maximum of 69.30%, illustrating a narrower span compared to some other layouts. Moving to Layout 3, the average humidity registers at 69.85%, and the median stands at 69.50%. The standard deviation, measuring at 3.00, signifies relatively consistent humidity readings around the average. The recorded humidity ranges from a minimum of 60.30% to a maximum of 79.80%, indicating a less extensive variability in comparison to Layout 1. Lastly, Layout 4 demonstrates an average humidity of 68.58%, with a median of 67.90%. The standard deviation for this layout is higher at 4.25, implying a broader spread in humidity values. The humidity levels vary between a minimum of 56.20% and a maximum of 79.30%, suggesting noticeable fluctuations within this range.
The analysis of the provided data reveals distinct humidity patterns across the specified layouts within the greenhouse. Layout 1 displays relatively higher average and maximum humidity, along with moderate variability. Layout 2 indicates lower average humidity, with narrower variability.
Layout 3 showcases higher average humidity with consistent readings. Layout 4 demonstrates moderate average humidity and a wider range of variability. These insights provide valuable information about the humidity distribution at different locations within the greenhouse under initial conditions.
The statistical summary of humidity standard deviations for the different layouts within the greenhouse reveals variations in humidity consistency. Among the layouts, Layout 2 exhibits the lowest standard deviation of 2.54, indicating relatively stable and consistent humidity levels. In contrast, Layout 4 records the highest standard deviation of 4.25, implying a wider dispersion of humidity values and greater variability. Layouts 1 and 3 fall in between, with standard deviations of 3.82 and 3.00, respectively, suggesting moderate fluctuations in humidity. Overall, these standard deviation values provide insights into the degree of humidity variability at each layout, assisting in assessing the uniformity and predictability of humidity distribution within the greenhouse.
Throughout the experimental period, variations in humidity were observed across different layers and layouts. As depicted in Figure 11, the blue line illustrates that at Layout 1, humidity changes exhibited an 11–15% variability among layers following dehumidification. Meanwhile, the orange line representing Layout 2 showcased a narrower range of 8–10% variability among layers post-dehumidification. For Layout 3 (depicted by the green line) and Layout 4 (depicted by the red line), the variability among layers after dehumidification was 8–10% and 11–22% respectively. According to Figure 11, Layout 2 was found more uniform among each layer.
The analysis of humidity variability within the greenhouse takes into account both vertical and horizontal dimensions across various layouts. This comprehensive examination sheds light on the spatial fluctuations of humidity within each layout, facilitating an understanding of its distribution patterns within the greenhouse setting. The experiment follows a schedule where the dehumidifier module operates from 9:00 to 12:00, then resumes after a 2-h hiatus from 14:00 to 17:00 for two days.
The outcomes concerning vertical variability within the greenhouse post-dehumidification are depicted in Figure 12. Meanwhile, Figure 13 illustrates the horizontal variability of humidity during the experiment. Overall, the highest humidity level of 89% is recorded before dehumidification at the lower layer of the rear side of the greenhouse, while the lowest humidity level before dehumidification (70%) is observed at the upper layer of the front side. However, after dehumidification, the highest humidity level (79%) and the lowest humidity level (51%) are observed inside the greenhouse.
In the case of Layout 1, the contour map reveals that this configuration attains a degree of humidity control at the central area but falls short of ensuring uniformity towards the peripheries of the greenhouse. Humidity levels near the sides persistently remain relatively elevated. For this layout, humidity primarily accumulates at the crop height level within the greenhouse. In Layout 2, an improvement is observed compared to Layout 1. This arrangement effectively mitigates humidity both at the center and toward the sides. The contour map indicates a more evenly distributed humidity profile throughout the greenhouse. Like Layout 1, most of the humidity accumulates at the crop height level, but Layout 2 demonstrates a more uniform humidity distribution across all horizontal levels within the greenhouse. Layout 3 displays advancements relative to Layout 1. However, it falls short of achieving the level of uniform humidity control demonstrated by Layout 2. The contour map exhibits a reduction in humidity levels along the sides, but disparities in humidity distribution across the greenhouse persist. For this layout, humidity accumulates primarily at the crop height level, with partial influence reaching the uppermost layer of the greenhouse. Layout 4 exhibited the least effectiveness in establishing uniform humidity levels. The contour map highlights reduced humidity on one side of the greenhouse, while the opposite side and the center experience minimal impact. In this scenario, humidity accumulation is distributed across all levels within the greenhouse, with partial dehumidification achieved at each tier.
Based on the contour map analysis, it can be concluded that Layout 2 (dehumidifier placed at one on each side facing the center) is the most effective in achieving uniform humidity control throughout the greenhouse. It demonstrates the best distribution of humidity levels, ensuring a more consistent and suitable environment for plant growth. Layout 3 follows in second place, Layout 4 in third, and Layout 1 in fourth, respectively.

3.3. Energy Consumption by Dehumidifier Layout

The remote monitoring of the on/off signal was recorded to evaluate the performance of the dehumidifier. This signal, determined by a predefined environmental control variable, indicated the operational status of the dehumidifier. Figure 14 illustrates the on/off signal patterns observed during the experiment.
In Layout 1, the dehumidifier modules “on” signal remained consistently high from the beginning of the experiment. At 9:37 p.m., after 0.5 h, the “off” signal was activated, and then from 10:08 p.m. to 11:06 p.m., the “on” signal was turned on again. At 11:27 p.m., the “on” signal was activated once more and remained high until 11:50 p.m. After that, the “off” signal was triggered and persisted for the remainder of the operation. The fan signal corresponded to the dehumidifier signal, turning “on” and “off” accordingly, as depicted in Figure 14a. In Layout 2, the dehumidifier modules “on” signal remained consistently high from the beginning of the experiment. After 1.75 h (at 03:44 a.m.), the “off” signal was activated and remained high until 04:00 p.m. From 04:01 a.m. to 04:11 p.m., the “on” signal was turned on again. Subsequently, at 04:11 p.m., the “off” signal was triggered and remained high for the duration of the operation. The fan signal followed the dehumidifier signal, operating in sync with it, as illustrated in Figure 14b. In Layout 3, the dehumidifier modules “on” signal remained consistently high from the beginning of the experiment. After 2.0 h (at 10:57 a.m.), the “off” signal was activated and remained high until 11:17 a.m. From 11:18 a.m. to 11:53 a.m., the “on” signal was turned on again and remained high for the rest of the operation. The fan signal operated in synchronization with the dehumidifier signal (Figure 14c). In Layout 4, the dehumidifier modules “on” signal were consistently high from the beginning of the experiment. After 0.5 h (at 02:27 p.m.), the “off” signal was activated, and from 02:57 p.m. to 03:22 p.m., the “on” signal was turned on again. From 03:42 p.m., the “on” signal was triggered once more and remained high until 04:06 p.m. Afterward, at 04:27 p.m., the “on” signal turned high again and remained constant until 04:50 p.m. Subsequently, it was turned off and remained constant for the rest of the operation. The fan signal followed the dehumidifier signal, operating in sync with it (Figure 14d).
Continuous monitoring of the power consumption status offered insights into the desired performance levels of the actuators. Additionally, assessing the variable-rated power consumption status was beneficial in detecting hardware-related issues. In Layout 1, the power consumption of the fan ranged from 0.242 kW to 0.264 kW, while the power consumption of the dehumidifier varied from 0.506 to 0.528 kW. Figure 15a illustrates the power consumption status throughout the greenhouse experiment. The power consumption curve for different actuators, including the dehumidifier module and fan, demonstrates their power consumption rates corresponding to the on/off signals.
Similarly, in Layout 2, the fan exhibited power consumption in the range of 0.242 kW to 0.264 kW, and the dehumidifier power consumption varied from 0.506 kW to 0.528 kW. Figure 15b illustrates the power consumption status during the greenhouse experiment, with the power consumption curve depicting the rates for each actuator based on their on/off signals.
In Layout 3, the fan power consumption ranged from 0.242 kW to 0.264 kW, while the dehumidifier power consumption varied from 0.506 kW to 0.528 kW. Figure 15c illustrates the power consumption status throughout the greenhouse experiment, presenting the power consumption curves for the dehumidifier module and fan, corresponding to their on/off signals.
For Layout 4, both the fan and dehumidifier exhibited power consumption in the range of 0.242 kW to 0.264 kW and 0.506 kW to 0.528 kW, respectively. Figure 15d illustrates the power consumption status during the greenhouse experiment. The power consumption curve for the dehumidifier module and fan in coordination with their on/off signals.
This study demonstrated the effectiveness of using small-sized suspension-type dehumidifiers placed at different layouts within a greenhouse for site-specific humidity management. The results showed that the layout of the dehumidifier on both sides and facing toward the center (Layout 2) resulted in the most uniform humidity control across all layers of the greenhouse. This configuration not only reduced humidity levels at the center but also towards the sides, creating a balanced environment for optimal plant growth. The use of sensor data analysis for automated control of dehumidification and fan operation enhanced the efficiency of the system. The recorded power consumption and on/off signals provided insights into the performance of the actuators and hardware-related issues. Overall, this study provides valuable information for optimizing humidity control strategies in greenhouses, with a focus on energy efficiency and crop requirements.

4. Discussions

Significant variations in dehumidification response time were observed among layouts, with the highest water removal efficiency of 50% demonstrated by Layout 2, surpassing theoretical projections. The nuanced impact of layout configurations on dehumidifier performance was highlighted, particularly influenced by challenges posed by the imperfect airtight environment of the plastic greenhouse. Evaporator performance played a crucial role in maintaining dehumidifier efficiency, where a higher humidity ratio led to increased moisture removal rates, elevated dew point temperatures, and enhanced evaporator coefficient of performance.
Additionally, the maintenance of dehumidifier performance was found to be contingent on evaporator performance, as elucidated in previous research [35].
Insights into spatial and vertical variability in humidity across greenhouse layouts were gained through statistical summaries and contour map analyses. Layout 2 exhibited the lowest average humidity and narrowest variability, emerging as the most effective in achieving uniform humidity control. Subsequent dehumidification processes further emphasized Layout 2’s superiority, followed by Layout 3, Layout 4, and Layout 1. The analysis of vertical variability reinforced the efficacy of Layout 2, with the narrowest range of humidity variability among layers. Kempkes and Braak (2000) [23] reported similar findings, in their experiment to the uniformity of temperature inside the greenhouse. The number of dehumidifiers, fan speed, and direction are the primary concerns for providing sufficient dehumidification [39,40].
The investigation involved remote monitoring of the on/off signals to assess dehumidifier performance, revealing distinctive patterns in each layout, as illustrated in Figure 13 and Figure 14. In Layout 2, where the dehumidifier was positioned centrally and facing opposite directions, the on/off signals demonstrated consistent efficiency, indicating effective humidity control. The corresponding power consumption status in Figure 14b aligns with this, showcasing synchronized patterns for the dehumidifier module and fan. Layouts 3 and 4 exhibited variations in on/off signals and power consumption, while Layout 1 displayed comparatively higher on/off signal fluctuations. The study underscores the significance of layout configuration in influencing dehumidifier performance and the importance of continuous monitoring for insights into energy-efficient humidity control in greenhouse environments.
The discussion underscores the intricate interplay of layout configurations in influencing humidity distribution within the greenhouse. The passive form is maintained to present the findings, offering practical insights for optimizing dehumidification strategies in controlled environments for plant growth. The study also highlighted the potential for energy-efficient crop cultivation, and the comparison of power consumption with other greenhouse dehumidifiers in the literature indicated the proposed low-powered condensation cooling system’s ability to significantly reduce power consumption under varying climate conditions. Overall, the study provides valuable passive information for optimizing humidity control strategies, emphasizing energy efficiency and crop requirements.
Based on the observed variations in spatial and vertical humidity within the greenhouse, a recommended enhancement involves the introduction of dual dehumidifiers for each greenhouse configuration. However, before implementing such a modification in larger greenhouses with crops, it is imperative to conduct artificial simulations to assess the effectiveness of the proposed dehumidification strategy. Future research should focus on simulating the climatic conditions, accounting for factors such as water vapor transfer, air exchange processes, plant transpiration, condensation, and evaporation. Computational Fluid Dynamics (CFD) emerges as a valuable tool for modeling and predicting humidity conditions within greenhouses. Combining CFD simulations with real-world tests, including the utilization of the proposed dehumidifier, would provide crucial insights into optimal dehumidifier placement for varying crop conditions. Additionally, integrating solar modules into the greenhouse infrastructure could serve as the primary power source for sensors and dehumidifiers. This approach aligns to utilize low-powered dehumidifiers for solar-generated electricity and explore the potential deployment of Agri voltaic systems.

5. Conclusions

The evaluation of greenhouse performance by comparing the placement of dehumidifiers is essential for achieving uniform humidity distribution, which is crucial for healthy plant growth and preventing fungal diseases. In this research, different layouts of dehumidifiers were tested to assess their impact on greenhouse humidity management.
The study utilized a small-scale suspension-type dehumidifier with a heating module, which offers energy-efficient and effective humidity control. The results showed that Layout 2, where the dehumidifier was placed with two dehumidifiers placed at both sides facing towards the center, achieved the most uniform humidity distribution throughout the greenhouse. This layout demonstrated better performance in reducing humidity levels both at the center and towards the sides, ensuring a more consistent and suitable environment for plant growth. Layout 3, the center, facing opposite directions from the center to the sides, followed in second place in terms of uniformity.
To enhance the performance of dehumidifier automated control was employed for humidity control. The automated control-based dehumidifier effectively regulated the humidity levels, reducing energy consumption and ensuring robust environmental management. The integration of temperature-controlled fans further facilitated air circulation and maintained a suitable temperature for plant growth. The remote monitoring and control system allowed for efficient and convenient management of the greenhouse environment, ensuring optimal humidity and temperature levels for plant growth.
The combination of a strategically placed dehumidifier with automated control and temperature-controlled fans proved to be an efficient and effective approach for achieving uniform humidity distribution in a greenhouse. This research provides valuable insights for greenhouse management, offering potential energy savings and improved crop yields. However, further research and optimization are necessary to adapt the findings to different greenhouse sizes and crop types.

Author Contributions

Conceptualization, M.A.G. and S.-O.C.; methodology, M.A.G. and S.-O.C.; software, M.A.G. and M.S.K.; validation, M.S.K., M.A., M.S.N.K., M.N.R. and M.A.H.; formal analysis, M.A.G., M.A., M.S.N.K., M.N.R. and M.A.H.; investigation, M.A.G., M.S.K., G.-H.J. and S.-O.C.; resources, S.-O.C.; data curation, M.A., M.S.N.K., M.N.R. and M.A.H.; writing—original draft preparation, M.A.G.; writing—review and editing, M.A., M.S.N.K., M.N.R., G.-H.J. and S.-O.C.; visualization, M.A., M.S.K., M.A.H. and G.-H.J.; supervision, S.-O.C.; project administration, S.-O.C.; funding acquisition, S.-O.C. All authors have read and agreed to the published version of the manuscript.

Funding

This research was supported by the research fund of Chungnam National University.

Data Availability Statement

Data are contained within the article.

Conflicts of Interest

Geun-Hyeok Jang was employed by the company Shinan Green-tech Co. Ltd. The remaining authors declare that the research was conducted in the absence of any commercial or financial relationships that could be construed as a potential conflict of interest.

References

  1. Chantoiseau, E.; Migeon, C.; Chasseriaux, G.; Bournet, P.E. Heat-pump dehumidifier as an efficient device to prevent con-densation in horticultural greenhouses. Biosyst. Eng. 2016, 142, 27–41. [Google Scholar] [CrossRef]
  2. Hong, S.J.; Park, S.B.; Kang, N.R.; Kim, Y.J.; Chung, S.O. Performance evaluation of a 400 W precise window motor for glass houses. Korean J. Agric. Sci. 2017, 44, 595. [Google Scholar] [CrossRef]
  3. Zhang, G.; Fu, Z.; Yang, M.; Liu, X.; Dong, Y.; Li, X. Nonlinear simulation for coupling modeling of air humidity and vent opening in Chinese solar greenhouse based on CFD. Comput. Electron. Agric. 2019, 162, 337–347. [Google Scholar] [CrossRef]
  4. Tarr, S.T.; Souza, S.V.d.; Lopez, R.G. Influence of day and night temperature and radiation intensity on growth, quality, and economics of indoor green butterhead and red oakleaf lettuce production. Sustainability 2023, 15, 829. [Google Scholar] [CrossRef]
  5. Lee, S.; Song, M.J.; Oh, M.M. Effects of air anions on growth and economic feasibility of lettuce: A plant factory experiment approach. Sustainability 2022, 14, 15468. [Google Scholar] [CrossRef]
  6. Ghani, S.; Bakochristou, F.; ElBialy, E.M.A.A.; Gamaledin, S.M.A.; Rashwan, M.M.; Abdelhalim, A.M.; Ismail, S.M. Design challenges of agricultural greenhouses in hot and arid environments—A Review. Eng. Agric. Environ. Food 2019, 12, 48–70. [Google Scholar] [CrossRef]
  7. Islam, M.N.; Iqbal, M.Z.; Ali, M.; Jang, B.E.; Chowdhury, M.; Kabir, M.S.N.; Jang, S.H.; Chung, S.O. Performance evaluation of a suspension-type dehumidifier with a heating module for smart greenhouses. J. Biosyst. Eng. 2020, 45, 155–166. [Google Scholar] [CrossRef]
  8. Iqbal, M.Z.; Islam, M.N.; Kabir, M.S.N.; Gulandaz, M.A.; Reza, M.N.; Jang, S.H.; Chung, S.O. Comparison of heating modules for suspension-type multipoint temperature variability management in smart greenhouses. Smart Agric. Technol. 2023, 5, 100296. [Google Scholar] [CrossRef]
  9. Went, F.W. Plant growth under controlled conditions. II. Thermoperiodicity in growth and fruiting of the tomato. Am. J. Bot. 1944, 31, 135–150. [Google Scholar] [CrossRef]
  10. Orfi, J.; Galanis, N.; Laplante, M. Air humidification-dehumidification for a water desalination system using solar energy. Desalination 2007, 203, 471–481. [Google Scholar] [CrossRef]
  11. Xiong, Z.Q.; Dai, Y.J.; Wang, R.Z. Development of a novel two-stage liquid desiccant dehumidification system assisted by CaCl2 solution using exergy analysis method. Appl. Energy 2010, 87, 1495–1504. [Google Scholar] [CrossRef]
  12. Duong, X.Q.; Chung, J.D. Numerical analysis of a compressor type of dehumidifier: (I) Fluid Flow. Int. J. Air-Cond Refrig. 2017, 25, 1750011. [Google Scholar] [CrossRef]
  13. Rafiei, A.; Alsagri, A.S.; Mahadzir, S.; Loni, R.; Najafi, G.; Kasaeian, A. Thermal analysis of a hybrid solar desalination system using various shapes of cavity receiver: Cubical, cylindrical, and hemispherical. Energy Convers. Manag. 2019, 198, 111861. [Google Scholar] [CrossRef]
  14. Li, G.; Lu, L. Modeling, and performance analysis of a fully solar-powered stand-alone sweeping gas membrane distilla-tion desalination system for island and coastal households. Energy Convers. Manag. 2020, 205, 112375. [Google Scholar] [CrossRef]
  15. Liang, J.d.; Huang, B.H.; Chiang, Y.C.; Chen, S.L. Experimental investigation of a liquid desiccant dehumidification system integrated with shallow geothermal energy. Energy 2020, 191, 116452. [Google Scholar] [CrossRef]
  16. Liu, J.; Liu, X.; Zhang, T. Performance of heat pump driven internally cooled liquid desiccant dehumidification system. Energy Convers. Manag. 2020, 205, 112447. [Google Scholar] [CrossRef]
  17. Campen, J.B.; Bot, G.P.A. Design of a low-energy dehumidifying system for greenhouses. J. Agric. Eng. Res. 2001, 78, 65–73. [Google Scholar] [CrossRef]
  18. Chen, J.; Xu, F.; Tan, D.; Shen, Z.; Zhang, L.; Ai, Q. A control method for agricultural greenhouses heating based on com-putational fluid dynamics and energy prediction model. Appl. Energy 2015, 141, 106–118. [Google Scholar] [CrossRef]
  19. Zhao, Y.; Teitel, M.; Barak, M. Vertical temperature, and humidity gradients in a naturally ventilated greenhouse. J. Agric. Eng. Res. 2001, 78, 431–436. [Google Scholar] [CrossRef]
  20. Boulard, T.; Kittas, C.; Papadakis, G.; Mermier, M. Pressure field and airflow at the opening of a naturally ventilated greenhouse. J. Agric. Eng. Res. 1998, 71, 93–102. [Google Scholar] [CrossRef]
  21. Ould Khaoua, S.A.; Bournet, P.E.; Migeon, C.; Boulard, T.; Chassériaux, G. Analysis of greenhouse ventilation efficiency based on computational fluid dynamics. Biosyst. Eng. 2006, 95, 83–98. [Google Scholar] [CrossRef]
  22. Bojacá, C.R.; Gil, R.; Cooman, A. Use of geostatistical and crop growth modelling to assess the variability of greenhouse tomato yield caused by spatial temperature variations. Comput. Electron. Agric. 2009, 65, 219–227. [Google Scholar] [CrossRef]
  23. Mesmoudi, K.; Meguallati, K.H.; Bournet, P.E. Effect of the greenhouse design on the thermal behavior and microclimate distribution in greenhouses installed under semi-arid climate. Heat Transfer-Asian Res. 2017, 46, 1294–1311. [Google Scholar] [CrossRef]
  24. Kempkes, F.L.K.; van de Braak, N.J. Heating system layout and vertical microclimate distribution in chrysanthemum greenhouse. Agric. For. Meteorol. 2000, 104, 133–142. [Google Scholar] [CrossRef]
  25. Kempkes, F.L.K.; van de Braak, N.J.; Bakker, J.C. Effect of heating system layout on vertical distribution of crop temperature and transpiration in greenhouse tomatoes. J. Agric. Eng. Res. 2000, 75, 57–64. [Google Scholar] [CrossRef]
  26. Yang, T.; Mei, C.; Qian, S. Dynamic moisture sorption and humidity response inside the wooden space to cyclical changing external relative humidity. Wood Mater. Sci. Eng. 2023, 18, 1922–1932. [Google Scholar] [CrossRef]
  27. Abdulkarim, U.; Tijjani, B. Effect of Varying Aerosol Concentrations and Relative Humidity on Visibility and Particle Size Distribution in Urban Atmosphere. J. Atmos. Sci. Res. 2021, 4, 14–28. [Google Scholar] [CrossRef]
  28. Ahmed, H.A.; Tong, Y.X.; Yang, Q.C.; Al-Faraj, A.A.; Abdel-Ghany, A.M. Spatial distribution of air temperature and relative humidity in the greenhouse as affected by external shading in arid climates. J. Integr. Agric. 2019, 18, 2869–2882. [Google Scholar] [CrossRef]
  29. Al-Helal, I.; Alsadon, A.; Shady, M.; Ibrahim, A.; Abdel-Ghany, A. Diffusion characteristics of solar beams radiation trans-mitting through greenhouse covers in arid climates. Energies 2020, 13, 472. [Google Scholar] [CrossRef]
  30. Alhazmy, M.M. Power Estimation for air cooling and dehumidification using exergy analysis. Int. J. Exergy 2006, 3, 391–401. [Google Scholar] [CrossRef]
  31. Chen, W.D.; Vivekh, P.; Liu, M.Z.; Kumja, M.; Chua, K.J. Energy improvement and performance prediction of desiccant coated dehumidifiers based on dimensional and scaling analysis. Appl. Energy 2021, 303, 117571. [Google Scholar] [CrossRef]
  32. Milani, D.; Abbas, A.; Vassallo, A.; Chiesa, M.; Bakri, D.A. Evaluation of using thermoelectric coolers in a dehumidifica-tion system to generate freshwater from ambient air. Chem. Eng. Sci. 2011, 66, 2491–2501. [Google Scholar] [CrossRef]
  33. Kordestani, H.; Zhang, C. Direct use of the savitzky–golay filter to develop an output-only trend line-based damage detection method. Sensors 2020, 20, 1983. [Google Scholar] [CrossRef] [PubMed]
  34. Pakari, A.; Ghani, S. Airflow assessment in a naturally ventilated greenhouse equipped with wind towers: Numerical simulation and wind tunnel experiments. Energy Build. 2019, 199, 1–11. [Google Scholar] [CrossRef]
  35. Bustamante, N.; Acuña, J.F.; Valera, D.L. Effect of the height of the greenhouse on the plant-climate relationship as a deve lopment parameter in mint (Mentha spicata) crops in Colombia. Ing. Investig. 2015, 36, 6–12. [Google Scholar] [CrossRef]
  36. Roberts, E.A.; Sheley, R.L.; Rick, L. Using sampling and inverse distance weighted modelling for mapping invasive plants. West. N. Am. Nat. 2004, 64, 312–323. [Google Scholar]
  37. Korea Metrological Administration. Available online: https://www.kma.go.kr/eng/index.jsp (accessed on 17 July 2022).
  38. Ali, M.; Goovaerts, P.; Nazia, N. Application of Poisson kriging to the mapping of cholera and dysentery incidence in an endemic area of Bangladesh. Int. J. Health Geogr. 2006, 5, 45. [Google Scholar] [CrossRef] [PubMed]
  39. Roe, D.R.; Brooks, B.R. Improving the speed of volumetric density map generation via cubic spline interpolation. J. Mol. Graph. Model. 2021, 104, 107832. [Google Scholar] [CrossRef] [PubMed]
  40. Bynum, J.D.; Claridge, D.E. Energy performance analysis of a membrane dehumidification system. Int. J. Refrig. 2021, 127, 230–238. [Google Scholar] [CrossRef]
Figure 1. Overall structure of the suspension-type dehumidifier used in the study: dehumidifier (a) and fan (b).
Horticulturae 10 00063 g001
Figure 2. Flow diagram illustrating the working principle of the suspension-type dehumidifier: Evaporator (1), Compressor (2) and Condenser (3).
Horticulturae 10 00063 g002
Figure 3. TH sensor, relay, and current sensor working process with Raspberry Pi, and data acquisition and representation.
Horticulturae 10 00063 g003
Figure 4. Basic algorithm for controlling and data acquisition of actuator.
Horticulturae 10 00063 g004
Figure 5. Location and position of the experimental greenhouse: Geographic location (a), and pictorial view (b).
Horticulturae 10 00063 g005
Figure 6. Drawing showing key aspects of the experimental setup: (a) sensor placement and (b) schematic diagram of the experimental greenhouses.
Horticulturae 10 00063 g006
Figure 7. Different setup layouts of dehumidifiers in the greenhouse for experiments (red arrow indicates dehumidified air flow direction).
Horticulturae 10 00063 g007
Figure 8. Photos showing the experimental setup conditions in the greenhouse (red circles indicate the sensors and red boxes indicate the DAQ and dehumidifier).
Horticulturae 10 00063 g008
Figure 9. Water removed efficiency of the dehumidifier inside the greenhouse.
Horticulturae 10 00063 g009
Figure 10. Distribution of humidity data after dehumidification at different layouts (Bar indicates the concentration of humidity value at each point and line indicates the average value).
Horticulturae 10 00063 g010
Figure 11. Variability of humidity at different layers (height) in the greenhouse.
Horticulturae 10 00063 g011
Figure 12. Vertical variability of humidity inside the greenhouse for Layout 1 (a), Layout 2 (b), Layout 3 (c), and Layout 4 (d).
Horticulturae 10 00063 g012
Figure 13. Horizontal variability of humidity inside the greenhouse for Layout 1 (a), Layout 2 (b), Layout 3 (c), and Layout 4 (d).
Horticulturae 10 00063 g013
Figure 14. On/off signal for dehumidifier module, and fan at Layout 1 (a), Layout 2 (b), Layout 3 (c), and Layout 4 (d).
Horticulturae 10 00063 g014
Figure 15. Current sensor signal and power consumption of fan and dehumidifier at Layout 1 (a), Layout 2 (b), Layout 3 (c), and Layout 4 (d).
Horticulturae 10 00063 g015
Table 1. Specifications of the dehumidifier used in the study.
ItemSpecification
Product nameAgricultural suspension type dehumidifier
Product modelSGD-20S
CompanyShinan Green-tech Co. Ltd., Suncheon-si Jeollanam-do, Republic of Korea
UsageHorticultural greenhouse
TextureShed SUS304 (casing)
Fan specifications220 V/ 50–60 Hz/4P/105 W/IP54
Compressor specifications220 V/60 Hz/560 W
Table 2. Post-hoc test results for water removal and required time in different dehumidifier setup layouts.
MethodsWater Removed (L)Required Time (min)TestAlpha
p-Value (t Test)Significantp-Value (t Test)Significant
L1 vs L20.005Yes0.0106YesANOVA0.05
L1 vs L30.14No0.0721No
L1 vs L40.762No0.0927NoPost-hoc test0.01
L2 vs L30.003Yes0.0093Yes(Bonferroni corrected)
L2 vs L40.011Yes0.0483No
L3 vs L40.045No0.0373No
Table 3. Statistical summary of the greenhouse at the initial condition for each layout.
Statistical SummaryLayout 1Layout 2Layout 3Layout 4
InitialFinalInitialFinalInitialFinalInitialFinal
Mean78.0669.1777.9461.5478.5869.8577.7668.58
Median78.4068.7578.1062.1078.7069.5077.5067.90
Standard deviation3.713.823.282.543.743.004.254.25
Minimum70.9057.5070.2051.1071.9060.3069.9056.20
Maximum humidity85.9080.7085.9069.3087.3079.8089.3079.30
Disclaimer/Publisher’s Note: The statements, opinions and data contained in all publications are solely those of the individual author(s) and contributor(s) and not of MDPI and/or the editor(s). MDPI and/or the editor(s) disclaim responsibility for any injury to people or property resulting from any ideas, methods, instructions or products referred to in the content.

