Article

Low Nitrogen Availability in Organic Fertilizers Limited Organic Watermelon Transplant Growth

1
Texas A&M AgriLife Research and Extension Center at Dallas, 17360 Coit Road, Dallas, TX 75252, USA
2
Truck Crops Branch Experiment Station, Mississippi State University, 2024 Experiment Station Road, Crystal Springs, MS 39059, USA
*
Author to whom correspondence should be addressed.
Horticulturae 2024, 10(11), 1140; https://doi.org/10.3390/horticulturae10111140
Submission received: 5 October 2024 / Revised: 21 October 2024 / Accepted: 21 October 2024 / Published: 25 October 2024

Abstract

:
Fertilization guidelines for organic watermelon transplant production are rare. We investigated the effect of four commercial organic fertilizers and seven organic fertilizer blends, along with one conventional fertilizer (Peter’s Professional 20-20-20) on watermelon transplants. The four organic fertilizers were Nature Safe (fertilizer label: 7-7-7), Miracle-Gro (8-8-8), Dr. Earth fertilizer tea (4-4-4), and Drammatic (2-4-1). The seven blended organic fertilizers were created by supplementing Drammatic with nitrogen (N)-rich and/or potassium (K)-rich fertilizers to balance its N:phosphorus (P):K ratios. Watermelon ‘Jubilee’ was sown in organic substrate, and fertilizer treatments were applied weekly with a total of 0.4 g nitrogen/L substrate. Miracle-Gro and Drammatic had the highest N mineralization rate after 21 days and the highest inorganic N concentration, respectively, and resulted in the highest shoot dry weight among organic fertilizers. Miracle-Gro also resulted in the highest root dry weight. Dr. Earth fertilizer tea supplied the lowest N and P, and resulted in stunted transplants. Our results indicated that nitrate concentration was the most important factor influencing both shoot and root growth. Supplementing Drammatic with N-rich and/or K-rich fertilizers to balance its N:P:K ratio did not affect shoot and root dry weight. Combined, we concluded that nitrogen availability rather than nutrient balance is the key factor influencing watermelon transplant growth.

1. Introduction

Watermelon (Citrullus lanatus) is a popular fruit worldwide. The USA produced about 1.5 million tons of watermelon in 2022, with a production area of 37 thousand hectares (http://faostat.fao.org/ (accessed on 16 August 2024)). The wholesale price of watermelon steadily increased from USD 0.265/kg in 2010 to USD 0.370/kg in 2020, and reached USD 0.503/kg in 2022 (https://www.ers.usda.gov/data-products/fruit-and-tree-nuts-data (accessed on 16 August 2024)). One common practice of watermelon production is using transplants, instead of direct seeding in the field. With transplants, growers can sow seeds in a controlled environment when the outside soil temperature is still too low, thus extending the growing window for watermelon. Transplant production is especially important for seedless or triploid watermelon, since these seeds are expensive and often experience non-uniform and low germination [1,2,3].
The organic food market is growing rapidly in the USA. Consumers show growing interest in environmental sustainability and food safety, which has driven the rapid growth of the organic food market [4,5,6]. The 2021 Organic Survey conducted by the United States Department of Agriculture reported the sales of certified organic commodities at USD 11.2 billion in the USA, with food and horticulture crops accounting for over half of the total [7]. Manure, green manure, compost, cover crops, and byproducts of other agricultural activities, including slaughterhouse byproducts, mill byproducts, and fish scraps, are being used as organic fertilizers [8,9]. Organic fertilizers fulfill the promise of recycling and conserving nutrients, and offer environmental benefits, but also present challenges in nutrient management for growers.
The nutrient content of organic fertilizers varies wildly depending their sources, and it is hard to predict or modify, which may cause a mismatch between nutrient supply and crop demand [10,11,12]. Nutrient release from organic fertilizers often requires microbial activity. Thus, the slow-release nature of organic fertilizers potentially results in an insufficient nutrient supply during key crop growth stages [13]. This is particularly problematic for organic agriculture in indoor farms, where production cycles are typically short, and production intensity is high [8]. Furthermore, organic fertilizers may contain excessive or undesired elements, such as sodium or heavy metal, that cause salinity stress and/or metal toxicity on crops [10,14].
For organic watermelon production, obtaining healthy and uniform watermelon transplants is the critical first step. Organic watermelon growers often need to produce transplants themselves as organic watermelon transplants are hard to find in the market. This results in poor quality and uniformity. One approach to address this issue is through indoor farming. The concept and technology for producing high-quality transplants all year under closed production systems using electric lights, now known as indoor farming, existed three decades ago [15]. These systems also allow for disease- and pest-free transplant production. Temperature and irrigation recommendations are available for watermelon transplant production [16,17]. Thus, environmental control techniques for conventional transplant production are applicable for organic transplants, except for root zone fertility management. However, little research-based information is available for the organic fertility management of transplant production.
While fertilizer recommendations and guidelines are available for field watermelon production, for example [17], recommendations for organic transplants in indoor farming are rare. Understanding the factors influencing nutrient release from organic fertilizers is crucial for developing fertility management recommendations for organic watermelon transplants in indoor farming. A previous study tested the effect of three organic fertilizers on watermelon transplant growth in the laboratory: Sustane 4-6-4 (Sustane, a compost-based fertilizer), Nature Safe 7-7-7 from Darling Ingredients (Nature Safe, derived from corn steep liquor), and Drammatic O Organic Fertilizer with Kelp 2-4-1 (Drammatic, recycled fish scraps) [18]. They found that increasing the fertilizer rate up to 0.84 g nitrogen/L substrate increased the fresh and dry shoot weights of watermelon transplants for all fertilizers [18]. The best shoot growth was observed in the conventional fertilizer and Drammatic treatment at 0.84 g nitrogen/L, while 0.56 g nitrogen/L Sustane exhibited the best root growth. They also noted that the Drammatic treatment resulted in the lowest root growth compared to other fertilizers at the same nitrogen rate [18]. They hypothesized that the low root dry weight was possibly a result of high phosphorus and low potassium concentrations in Drammatic [18].
The previous literature suggests that low phosphorus supply increased the root:shoot ratio and enhanced rhizosphere acidification to increase phosphorus uptake [19,20]. Conversely, a high phosphorus supply often results in high shoot biomass and a lower root:shoot ratio [21,22], which are undesirable traits for transplants. Excessive phosphorus supply, on the other hand, did not result in a further increase in shoot growth, but often resulted in the ‘luxury uptake’ of phosphorus [22]. Phosphorus demand is species- and growth stage-specific [22,23,24]. The effect of potassium on crop growth has been less extensively studied than that of nitrogen and potassium [21]. A low potassium supply tends to decrease root and shoot biomass, but has a limited effect on the root:shoot ratio [21,25]. Whether the high shoot biomass and low root biomass of watermelon transplants, as observed in previous research [18], were a result of excessive phosphorus or low potassium content in Drammatic requires further study.
This study aimed to investigate the effects of different organic fertilizers on the growth and nutrient uptake of watermelon transplants. Specifically, we aimed to quantify the relationships between fertilizer nutrient composition, availability, other chemical characteristics, and transplant growth parameters. We also aimed to test the hypothesis that high phosphorus and low potassium concentrations in Drammatic reduced the root dry weight of watermelon transplants. Additionally, the effectiveness of manipulating the N:P:K ratio of organic fertilizers by supplementing Drammatic with organic N-rich and/or P-rich fertilizers on transplants will also be determined. This research provides valuable insights to help develop fertilization recommendations for organic watermelon transplant production in indoor farming.

2. Materials and Methods

2.1. Plant Materials and Growth Conditions

Watermelon seeds (cv Jubilee; SEEDWAY, LLC., Hall, NY, USA) were sown in 72-cell trays filled with organic peat-based germination substrate without starter fertilizer (customized OM2; Berger, Saint-Modeste, QC, Canada). The experiment was replicated twice in time. For replications 1 and 2, sowing dates were 17 October and 30 October 2023, respectively. The trays were then covered with humidity domes until ~50% germination (3 days after sowing, 3 DAS). Light was provided by full spectrum LED lights (Ray44 PhysioSpec Indoor; Fluence, Austin, TX, USA) at 191.0 ± 23.0 µmol·m−2·s−1 (mean ± standard deviation) with a 16-h photoperiod for both replications. The temperature was 28.0 ± 1.2 °C during the 1st replication and 27.9 ± 1.1 °C during the 2nd replication. The relative humidity of the growth room was 76.2% ± 14.0% and 71.0% ± 15.4% during replications 1 and 2, respectively.

2.2. Fertilizer Teatments

A total of 12 treatments were created to test the effect of different types of organic fertilizer on watermelon transplant growth, and to test the hypothesis that the low root dry weight and high shoot dry weight of watermelon transplants fertilized by Drammatic were a result of the high phosphorus and/or low potassium content of Drammatic [18] (Table 1). We used one conventional fertilizer as a reference (Peter’s Professional 20-20-20; ICL Group Ltd., Tel Aviv, Israel) and four organic fertilizers (Nature Safe, Miracle-Gro, Dr. Earth, and Drammatic), three of which have the same N:P:K ratio as the conventional fertilizer. The conventional fertilizer has 20% nitrogen (N), 8.7% phosphorus (P), and 16.6% potassium (K) by weight. Among organic fertilizers, Nature Safe (Nature Safe 7-7-7; Darling Ingredients Inc., Irving, TX, USA) is derived from corn steep liquor. Miracle-Gro (Performance Organics Blooms 8-8-8; The Scotts Miracle-Gro Company, Marysville, OH, USA) is derived from hydrolyzed soy protein (main N source), rock phosphate and bone meal (main P sources), and muriate of potash (KCl mineral, main K source). Dr. Earth (Premium Gold All Purpose Fertilizer 4-4-4; Dr. Earth Inc., Winters, CA, USA) is derived from alfalfa meal and feather meal (the main N sources), bone meal and fishbone meal (the main P sources), and potassium sulfate (the main K source). The fourth organic fertilizer, Drammatic (Dramm Corporation, Manitowoc, WI, USA), has a different N:P:K ratio compared to conventional fertilizer. Details of these four organic fertilizers can be found in Supplemental Table S1. It is worth noting that Dr. Earth, which is a solid fertilizer, was applied as a fertilizer tea by mixing with water at a rate of 0.05 g/mL (similar to the rate recommended by the manufacturer), stirring for 1 min, letting it sit for 24 h, discarding the solid portion by filtering it through filter paper (Fisherbrand P8; Fisher Scientific, Hampton, NH, USA), and diluting it to 1 L before applying. Hereafter, treatments 1 to 5 will be referred to as ‘commercial fertilizers’.
Treatments 6 to 12 were customized fertilizer blends based on Drammatic, which will be referred to as ‘Drammatic-based fertilizer blends’ hereafter (Table 1). For treatments 6 and 7, we supplemented Drammatic with two N-rich organic fertilizers to decrease the high P concentration in Drammatic. Both FertilGold Soil 5-0-0 and Nature Safe 15-0-1 have a high N content relative to P and K, and will be referred to as N1 and N2, respectively. Therefore, Drammatic+N1 and Drammatic+N2 had the same N:P as the conventional fertilizer but were lower in K. These two blends aimed to test if the lower root biomass observed in the previous study by [18] was a result of high phosphorus concentration. Three organic fertilizers rich in K were used: Langbeinite 0-0-21.5 (K1), Potassium Sulfate 0-0-50 (K2), and CytoPlus 0-0-7.5 (K3). For treatments 8 and 9, we supplemented Drammatic with K1 (Drammatic+K1) or K3 (Drammatic+K3) to create two fertilizer blends with the same N:K ratio as conventional fertilizer, but had a higher P concentration. These two treatments were designed to test if the reduction in root dry weight was a result of a lack of potassium. We also created three fertilizer blends (treatments 10 to 12), Drammatic+N1+K1, Drammatic+N1+K2, and Drammatic+N1+K3, which had the same N:P:K ratio as conventional fertilizer. More details of the supplemental organic fertilizers can be found in Supplemental Table S2.
The total N rate was 0.4 g/L substrate for all fertilizer treatments. We estimated 4 L substrate was needed to fill the cells of one tray. Therefore, the N rate was 1.6 g/tray or 22.22 mg/plant. The rates of individual fertilizers and the P and K rates based on fertilizer labels are shown in Table 1. Fertilizers were divided into 3 applications through the growing cycle. The 1st application was a quarter of the total rates at one week after sowing (after all seeds were germinated). The 2nd application occurred one week after the 1st application and was a quarter of the total rate. The 3rd application was carried out four days after the 2nd application and was half of the total rate. All fertilizers were dissolved in 1 L water and applied as subirrigation to all 72 plants in the same tray. Water was applied when needed as subirrigation during the experiment.

2.3. Chemical Properties of Liquid Fertilizers

All fertilizers were made at a rate of 400 mg N/L water with deionized water, and were tested for concentrations of nitrate-N, nitrite-N, ammonium-N, and P by a spectrophotometer using provided kits (HI 83200; Hanna Instruments, Woonsocket, RI, USA). The concentration of inorganic N was calculated as the sum of the concentration of nitrate-N, nitrite-N, and ammonium-N for each fertilizer. We did not measure K because of the low accuracy of the tests (±60 mg/L ± 14% of reading). We calculated the percentage of inorganic N and P to labels N and P (%N to label and %P to label) in fertilizer solutions by dividing inorganic N and P measured by the spectrophotometer by the amount of N and P indicated by the fertilizer labels, respectively. Th electrical conductivity (EC) and pH of fertilizer solutions were measured by a pH/EC tester (HI98129; Hanna Instruments). The chemical properties of all fertilizers and mixes are presented in Table 2.

2.4. Transplant Physiological and Morphological Measurements

For seedling morphology, canopy height and the longest width were measured from six random plants three times during the study 8, 15, and 20 DAS. Twenty days after sowing, six plants were randomly selected for chlorophyll content measurements and the other six for chlorophyll fluorescence measurements. Chlorophyll content was measured by a pigment meter (MPM-100; Opti-Science, Hudson, NH, USA) as ChlM in µg·cm−2, and maximum quantum yield of photosystem II (Fv/Fm) was measured by Pocket PEA (Hansatech, Pentney, UK) after dark-adapted for at least 30 min. The EC and pH of the substrate were measured by the PourThru method [26], one day after each fertilizer application, by a pH/EC tester.
Seedlings were harvested 21 DAS. Thirty-nine plants from each tray were harvested for shoot fresh weight and leaf area measurements. Leaf area was measured by a leaf area meter (LI-3100C; LI-COR Biosciences, Lincoln, NE, USA). Roots from six plants of each fertilizer treatment were washed and scanned by a root scanner (Perfection V850; Epson America Inc., Long Beach, CA, USA). Photos from the root scan were analyzed by WinRHIZO software (https://regent.qc.ca/assets/winrhizo_about.html, accessed on 16 August 2024) (Regent Instruments Inc., Québec City, QC, Canada) to extract root growth and morphological parameters. Shoot and root samples were then dried at 70 °C for at least 72 h before taking the dry shoot and root weights. After the shoot dry weight was recorded, dried shoot tissue was then ground into powder for mineral analysis. Substrate samples were also collected and oven-dried for mineral analysis. At least 1 g of dried shoot tissue and 500 mL of substrate were collected and sent to Texas A&M AgriLife Extension Service Soil, Water, and Forage Testing Laboratory (College Station, TX, USA) for mineral analyses.

2.5. Data Analyses

Chlorophyll content was calculated as ChlM multiplied by leaf area and then divided by shoot weight to obtain the chlorophyll content as µg·g−1. The root:shoot ratio was calculated as the root dry weight divided by the shoot dry weight. The effects of different fertilizers on plant height and width, leaf number, leaf area, chlorophyll content, Fv/Fm, shoot fresh and dry weights, root dry weight, root:shoot ratio, and root length were tested by one-way ANOVA (SAS OnDemand for Academics; SAS Institute, Cary, NC, USA). The ANOVA analysis included the two replications over time. Means were separated using the Student’s t test at p ≤ 0.05.
To quantify the correlation between chemical properties of liquid fertilizers (EC, pH, N rate, P rate, K rate, NO3-N concentration, NO2-N concentration, NH4+-N concentration, inorganic N concentration, and measured P concentration) and watermelon transplant shoot and root dry weights, and root:shoot ratio, we conducted a stepwise regression analysis with SigmaPlot 11.0 (Systat Software Inc., San Jose, CA, USA). Regression models were built based on a stepwise selection that eliminates the non-significant parameters with α = 0.05 (backward selection). Only statistically significant parameters are presented in the Section 3. Other correlations were tested by Microsoft Excel 2007 (Microsoft, Seattle, WA, USA).
We calculated the shoot mineral content of each treatment for N, P, and K (shoot N content, shoot P content, and shoot K content) as
S h o o t   m i n e r a l   c o n t e n t   ( g ) = s h o o t   m i n e r a l   c o n c e n t r a t i o n   ( % ) × s h o o t   d r y   w e i g h   p e r   p l a n t   ( g ) × 72   p l a n t s   p e r   t r e a t m e n t
Shoot mineral (N, P, and K) concentration can be found in Supplemental Material Table S3.
We calculated the mineral recovery efficiency to understand how effectively watermelon transplants were using nutrients from the organic fertilizers. The mineral recovery efficiency describes the amount of minerals assimilated into shoots by crops (shoot mineral content) divided by the fertilizer mineral input. The mineral recovery efficiency was calculated for N, P, and K as:
M i n e r a l   r e c o v e r y   e f f i c i e n c y   ( % ) = s h o o t   m i n e r a l   c o n t e n t   ( g ) m i n e r a l   r a t e   ( g / L ) × 4   L   s u s t r a t e   p e r   t r e a t m e n t
The shoot mineral (N, P, and K) contents were calculated using Equation (1). The mineral rates from fertilizers for N, P, and K can be found in Table 1 (N rate, P rate, and K rate).
The shoot mineral concentration, substrate mineral concentration, and mineral recovery efficiency of crops were similarly tested by ANOVA.

3. Results

3.1. Chemical Properties of Liquid Fertilizers
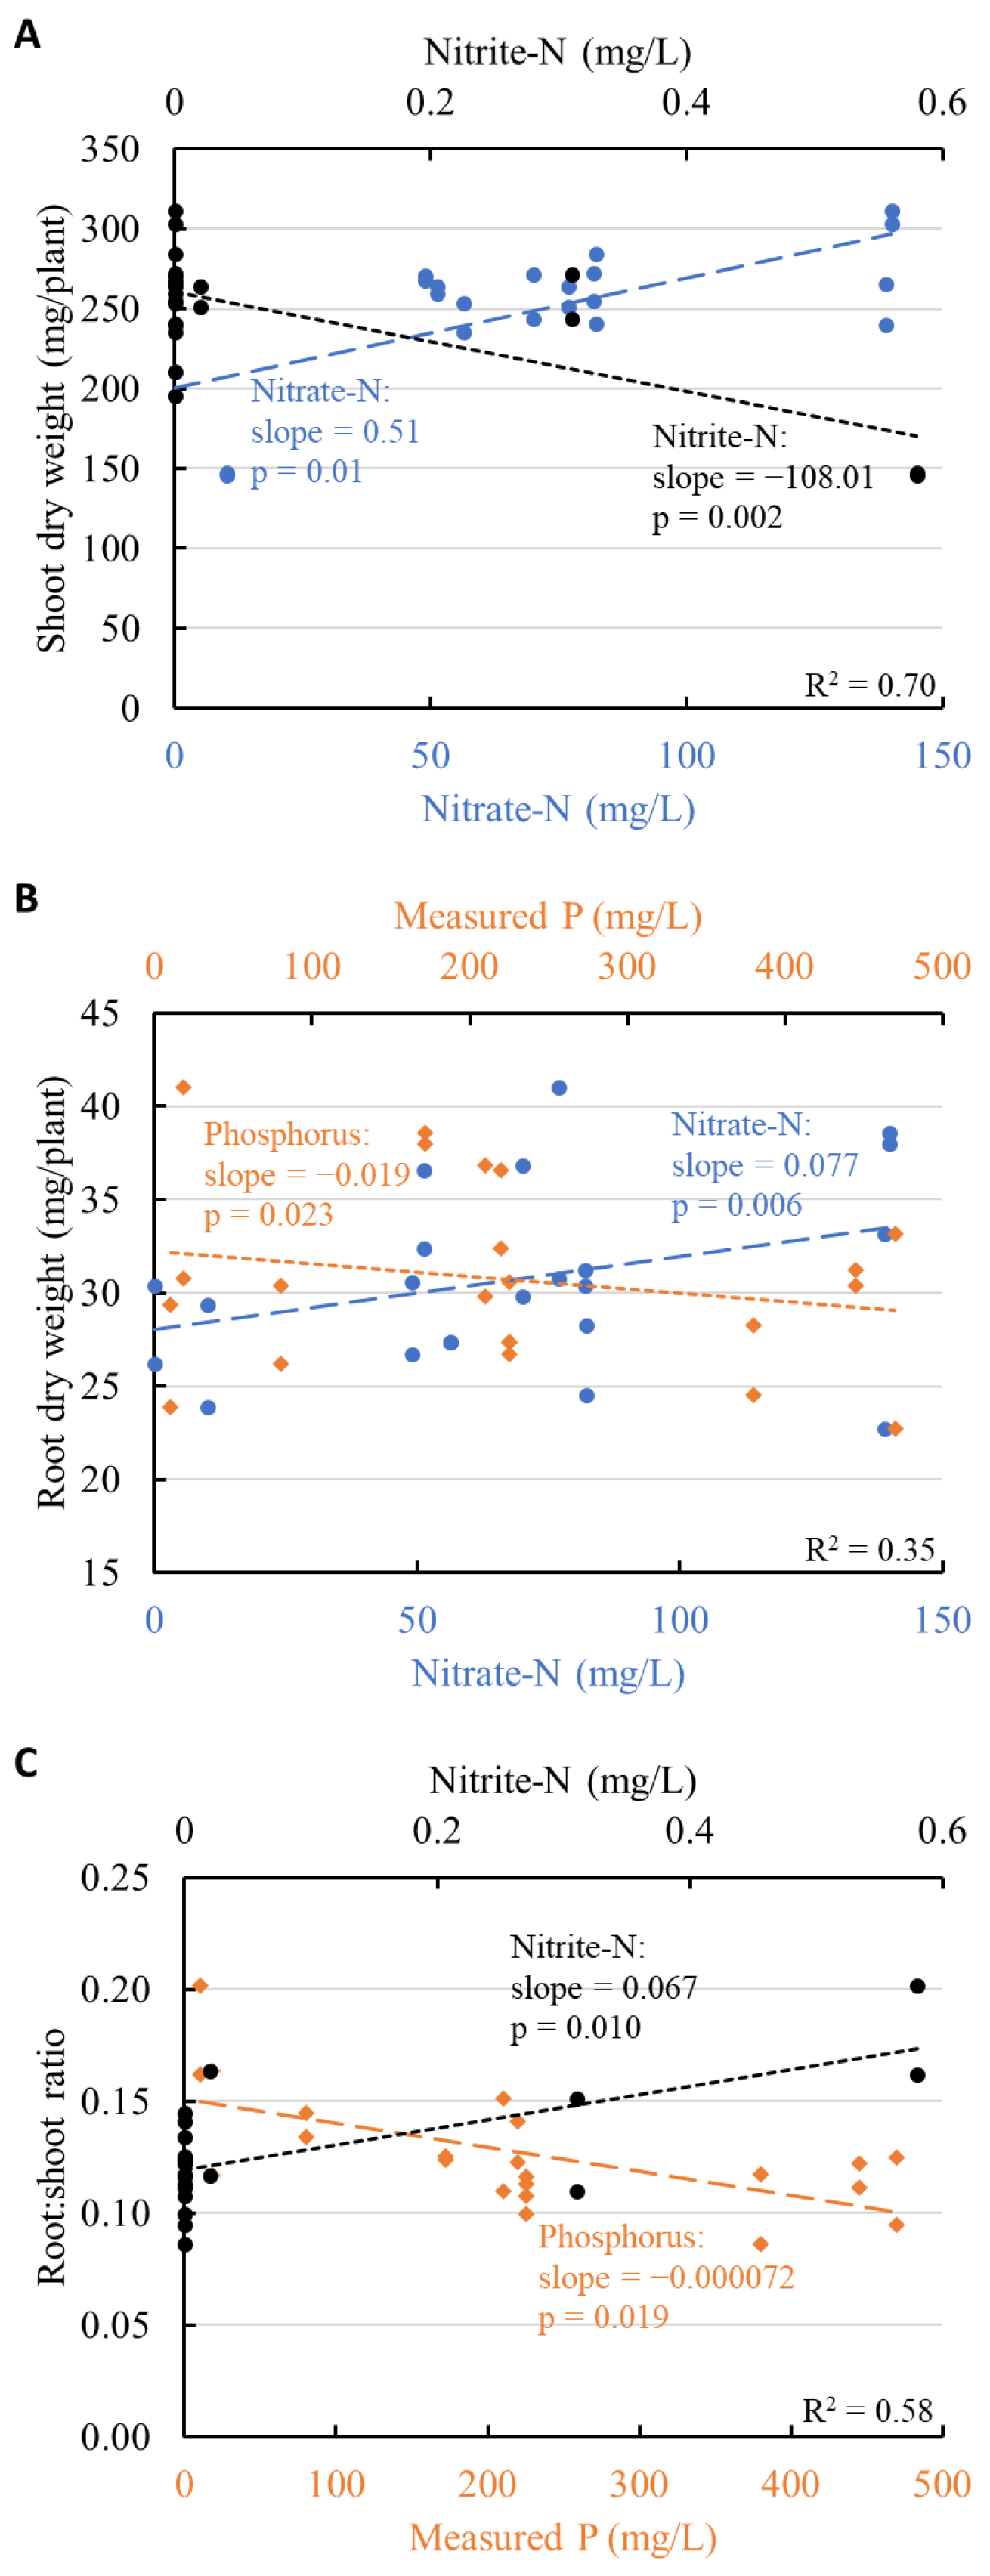
Fertilizers differed widely in pH, EC, nitrate-N, ammonium-N, nitrite-N, and inorganic N and P concentrations among the commercial fertilizer and the Drammatic-based blended treatments (Table 2). N and P concentrations were not presented for Drammatic+N1+K3 because the liquid was too dark to be measured reliably by the spectrophotometer. The EC of the fertilizers ranged from 1.66 to 3.36 mS·cm−1, and the pH ranged from 4.52 to 7.15 (Table 2). Only inorganic N can be measured by the spectrophotometer, therefore the %N to label were always lower than 100%. Among the commercial organic fertilizers, Drammatic had the highest inorganic N concentration, followed by Miracle-Gro (Table 2). Nature Safe and Dr. Earth fertilizer tea had the lowest inorganic N concentration (Table 2). Drammatic had the highest P concentration (470 mg·L−1), 34.7% higher than indicated on the label (Table 2). The measured P of conventional fertilizer was very similar to its label (172 mg·L−1). The measured P concentration of Nature Safe was nearly half of the amount indicated on its label (Table 2). The measured P concentrations in Miracle-Gro and Dr. Earth fertilizer tea were significantly lower than indicated on their labels, at only 10.3% and 5.7%, respectively (Table 2).

3.2. Shoot Growth

Shoot growth was affected by different fertilizers (Figure 1). At 21 DAS, watermelon transplants fertilized with conventional fertilizer had the largest leaf area at 91.1 ± 0.8 cm2 (Figure 1A). Drammatic resulted in the highest leaf area (68.3 ± 5.4 cm2) among the commercially available organic fertilizers, similar to Miracle-Gro (58.4 ± 5.7 cm2) (Figure 1A, left of dashed line). Nature Safe led to a lower leaf area (45.7 ± 3.7 cm2) and Dr. Earth fertilizer tea yielded the lowest leaf area (8.3 ± 1.7 cm2) among all the fertilizers tested (Figure 1A). Supplementing Drammatic with N-rich and/or K-rich fertilizers did not result in significant changes in leaf area compared to non-supplemented Drammatic (Figure 1A, right of dashed line). The shoot fresh weight and dry weights exhibited similar trends to leaf area: highest with conventional fertilizer, followed by Miracle-Gro and Drammatic, then Nature Safe, and then Dr. Earth fertilizer tea (Figure 1B,C, left of dashed lines). Supplementing Drammatic with organic fertilizers rich in N, K, or both did not result in significant increases in shoot growth (Figure 1B,C, right of dashed lines). The growth of the plants fertilized with Dr. Earth fertilizer tea was stunted. The height of plants fertilized with Dr. Earth fertilizer tea at 20 DAS (9.7 ± 0.2 cm) was similar to at 15 DAS (9.5 ± 0.4 cm), and the width remained the same since day 8 (6.4 ± 1.0 cm) (Figure S1).
Watermelon transplants fertilized with conventional fertilizer had the highest chlorophyll content (233.1 ± 14.9 µg·g−1) among all commercial fertilizers, follow by Miracle-Gro and Drammatic (191.2 ± 17.8 µg·g−1 and 195.4 ± 6.6 µg·g−1, respectively) (Figure 1D, left of dashed line). Nature Safe (155.0 ± 4.9 µg·g−1) and Dr. Earth (37.5 ± 2.9 µg·g−1) fertilizer tea resulted in low chlorophyll content, with Dr. Earth being the lowest (Figure 1D, left of dashed line). Drammatic-based blends had similar chlorophyll content compared to Drammatic, except for Drammatic+N1+K2, which resulted in 18.1% higher chlorophyll content than Drammatic (Figure 1D, right of dashed line).

3.3. Root Growth

Conventional fertilizer and Miracle-Gro tended to result in the highest root dry weight among all commercial fertilizers (38.3 ± 0.4 mg and 35.9 ± 7.2 mg, respectively) (Figure 2A, left of dashed line). Plants fertilized with Nature Safe (28.3 ± 3.0 mg), Dr. Earth fertilizer tea (26.7 ± 3.9 mg), and Drammatic (28.0 ± 7.4 mg) had lower root dry weight (Figure 2A, left of dashed line). Supplementing Drammatic with N-rich, P-rich, and both fertilizers did not affect root dry weight compared to non-supplemented Drammatic (Figure 2A, right of dashed line). The root:shoot ratio of plants fertilized with Dr. Earth fertilizer tea (0.18 ± 0.03) was higher than all other fertilizers (Figure 2B). Root length was longest in plants fertilized by conventional fertilizer (12.3 ± 0.9 m), and was shortest when fertilized by Nature Safe (4.8 ± 1.2 m) among all the commercial fertilizers (Figure 2C, left of dashed line). Drammatic-based blends had a similar root:shoot ratio and root length as Drammatic (5.7 ± 2.1 m), except that Drammatic+N1+K1 (8.5 ± 1.5 m) resulted in higher root length than Drammatic (Figure 2B,C).

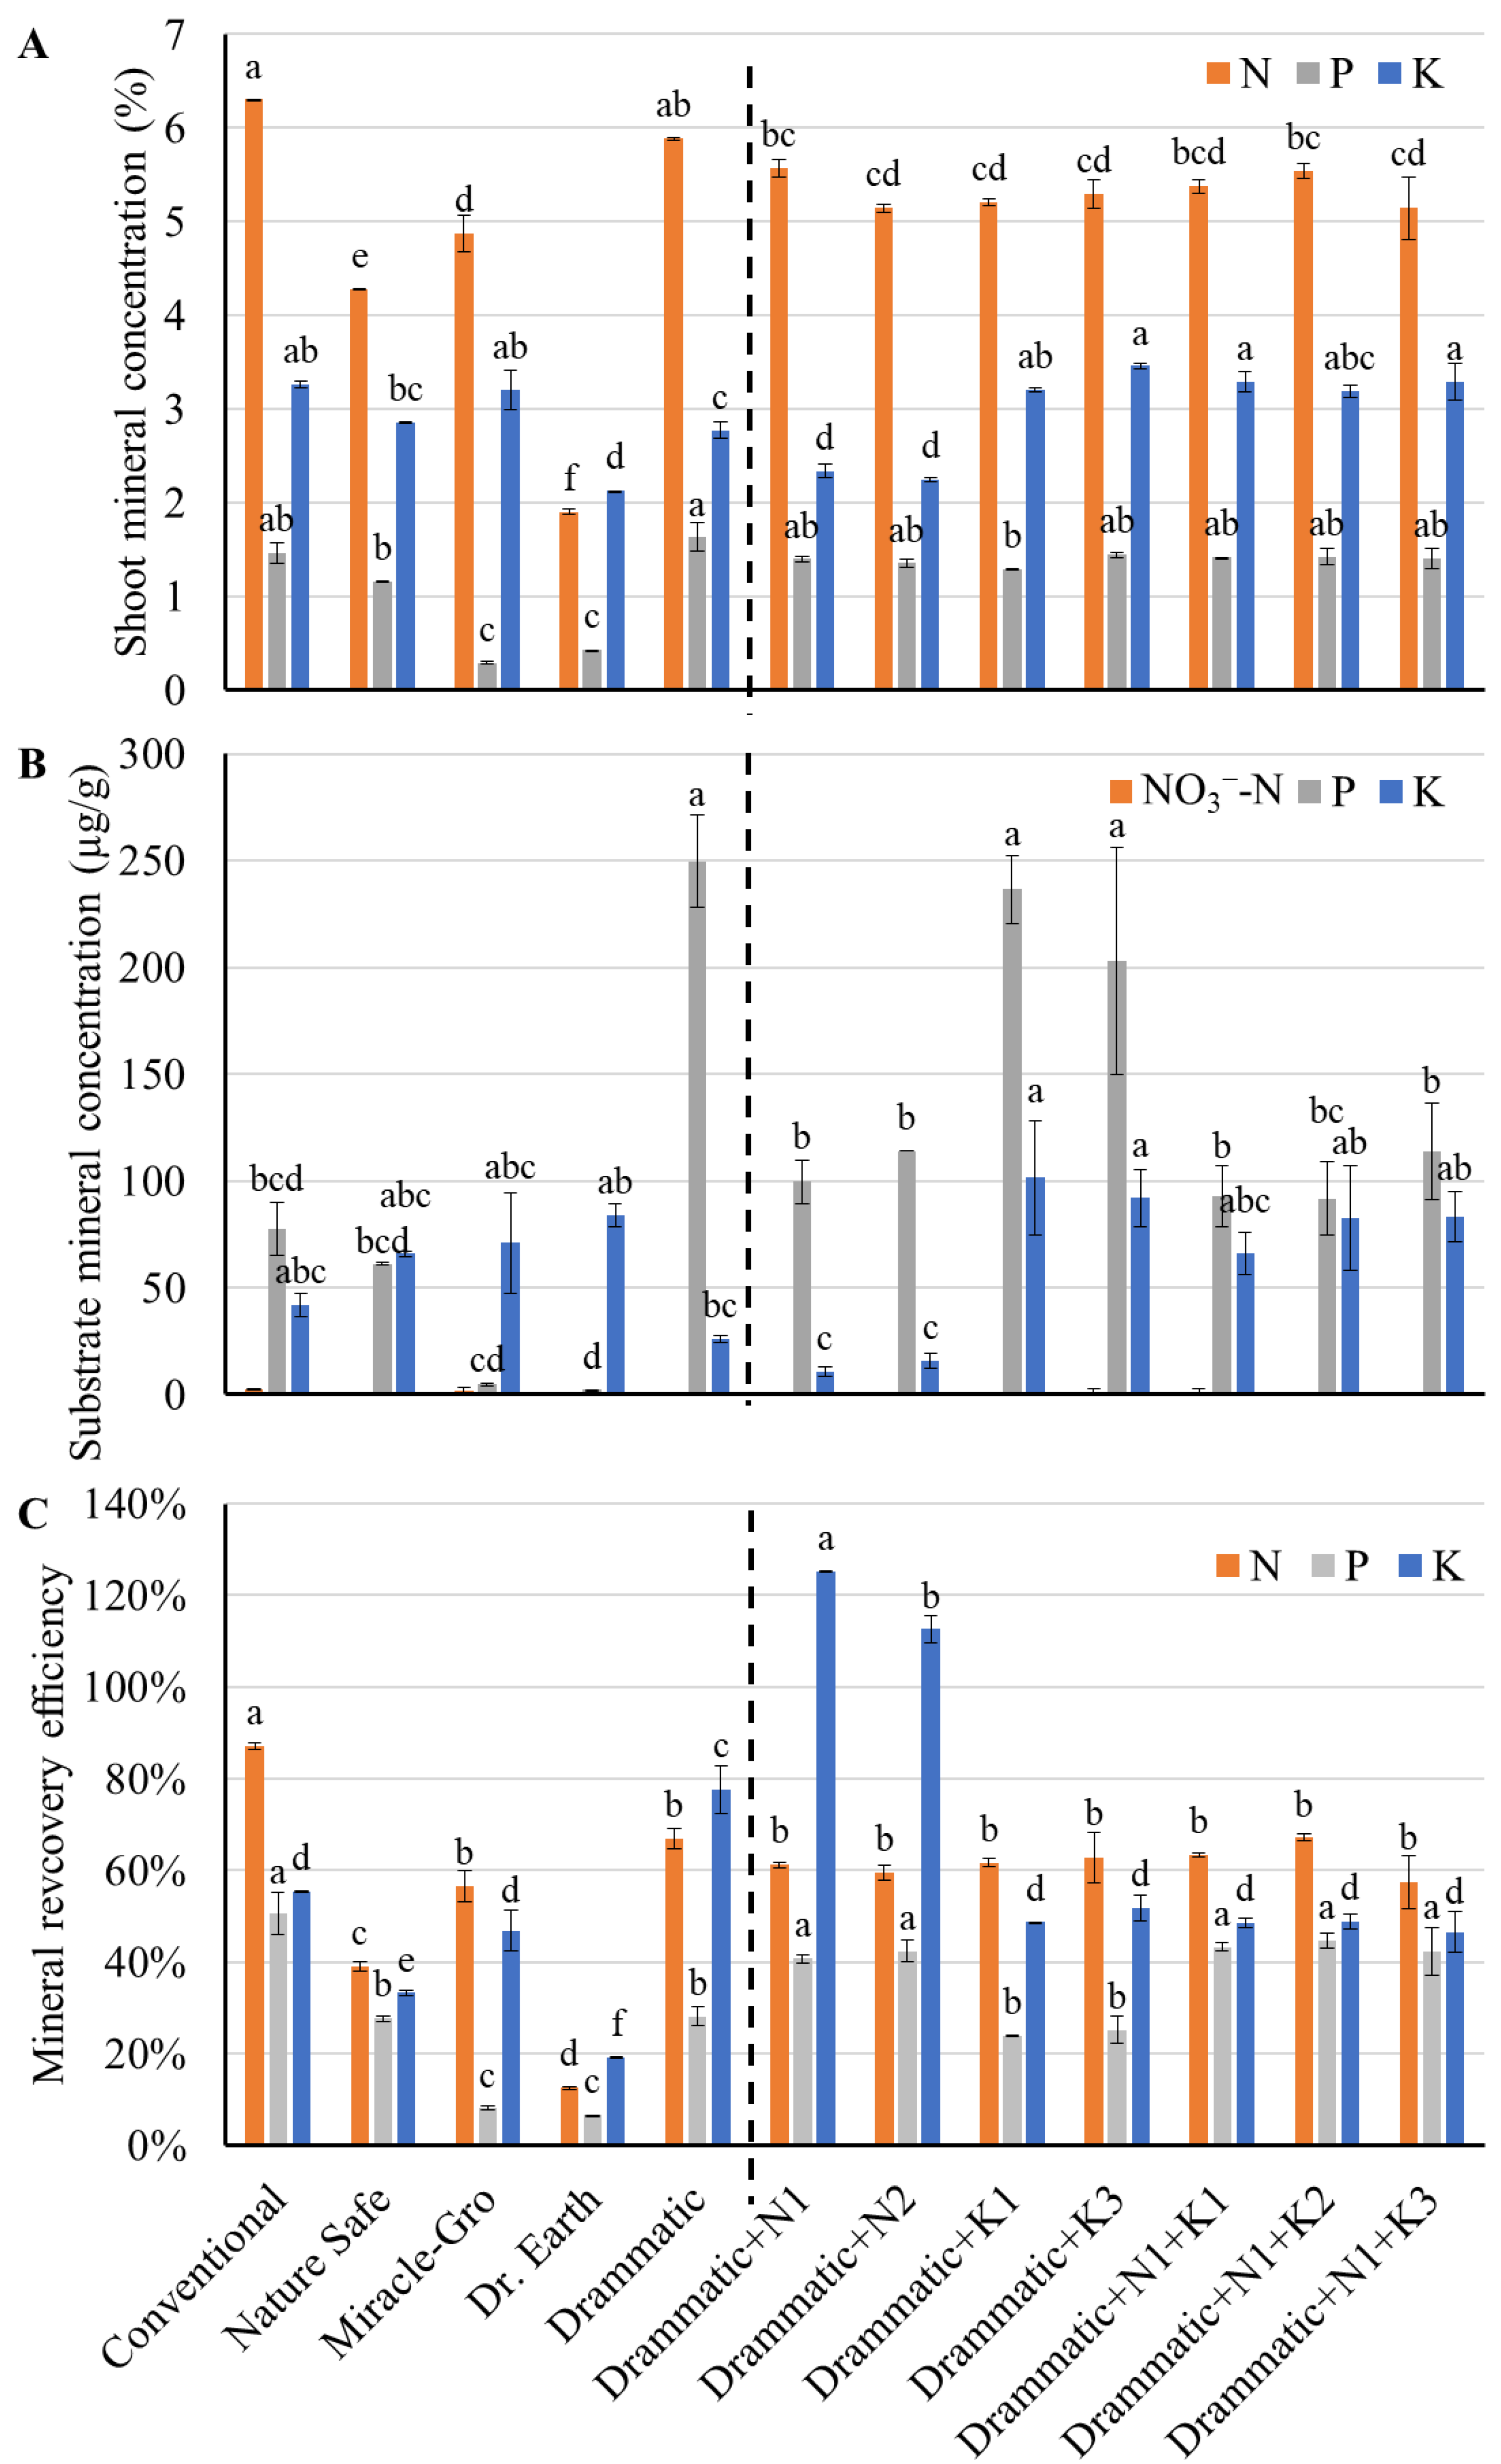
3.4. Mineral Nutrients and Plant Growth

Shoot dry weight positively correlated with nitrate-N in liquid fertilizers, but negatively correlated with nitrite-N (Figure 3A). Note the different scales of nitrite-N and nitrate-N concentrations in Figure 3A. There was a weak positive correlation between root dry weight and nitrate-N concentration, and a weak negative correlation between root dry weight and measured P concentration (Figure 3B). The root:shoot ratio was positively affected by nitrite-N concentration and negatively affected by measured P concentration in liquid fertilizers (Figure 3C). Since both shoot and root dry weights increased with nitrate-N concentration in fertilizers, nitrate-N concentration did not have statistically significant effect on the root:shoot ratio. On the other hand, nitrite-N negatively affected shoot dry weight without affecting root dry weight and, therefore, positively affected the root:shoot ratio (Figure 3). Phosphorus concentration did not affect the shoot dry weight but negatively affected the root dry weight and, therefore, negatively affected the root:shoot ratio (Figure 3).

3.5. Mineral Concentrations of Shoot and Substrate

Mineral analysis of shoot and substrate samples revealed that commercial organic fertilizers varied in nutrient availability (Figure 4). Plants fertilized with conventional and Drammatic had the highest leaf N concentrations (6.30% ± 0.01% and 5.89% ± 0.03%, respectively), followed by plants fertilized with Miracle-Gro (4.87% ± 0.40%) then with Nature Safe (4.27% ± 0.01%) (Figure 4A, left of dashed line). Plants fertilized with Dr. Earth fertilizer tea had the lowest leaf nitrogen concentration of 1.90% ± 0.06% (Figure 4A, left of dashed line). Plants fertilized with Drammatic-based blends had a similar leaf nitrogen concentration (Figure 4A, right of dashed line). The phosphorus concentration in leaves was higher in plants fertilized by Drammatic (1.63% ± 0.30%), followed by conventional fertilizer (1.46% ± 0.22%) and Nature Safe (1.16% ± 0.00%), among all commercial fertilizers (Figure 4A, left of dashed line). The phosphorus concentration was lowest in plants fertilized with Miracle-Gro (0.29% ± 0.03%) and Dr. Earth fertilizer tea (0.43% ± 0.00%) (Figure 4A, left of dashed line). Transplants fertilized with Drammatic-based blends had similar shoot P concentrations (Figure 4A, right of dashed line), despite different P rates and measured P concentrations, as seen in Table 1 and Table 2. The highest K concentrations were found in plants fertilized with conventional fertilizer and Miracle-Gro (3.26% ± 0.07% and 3.21% ± 0.42%, respectively) followed by Nature Safe (2.85% ± 0.01%), then by Drammatic (2.77% ± 0.17%), among all commercial fertilizers (Figure 4A, left of dashed line). The potassium concentration was lowest in leaves of plants fertilized by Dr. Earth fertilizer tea (2.13% ± 0.00%) (Figure 4A, left of dashed line) among all commercial fertilizers. The shoots’ K concentration tended to be higher in plants fertilized with Drammatic plus K-rich fertilizers than with Drammatic alone (Figure 4A, right panel).
All substrate samples had lower nitrate-N, P, and K concentrations than plant tissues (Figure 4B, note the difference in units compared to Figure 4A). The nitrate concentration in substrates fertilized with organic fertilizers were all ≤ 2 µg·g−1 and did not differ among treatments (Figure 4B). Phosphorus in substrates was highest in Drammatic (249.2 ± 43.1 µg·g−1) among all commercial fertilizers (Figure 4B, left of dashed line). Other than Drammatic, substrate P concentrations were statistically similar among commercial fertilizers, ranging from 2.2 to 77.5 µg·g−1 (Figure 4B). Among Drammatic-based blends, Drammatic+K1 and Drammatic+K2 had the highest substrate phosphorus concentrations, similar to Drammatic (Figure 4B, right of dashed line). Potassium in substrate was similar in concentration among the commercial fertilizers (Figure 4B, left of dashed line). Substrate potassium tended to be higher with Drammatic plus K-rich fertilizers such as Drammatic+K1 (Figure 4B, right of dashed lines).
The amount of minerals recovered from shoot and substrate samples exhibited a range of variations among all organic fertilizers: 13–67% N, 7–45% P, and 19.3–125.1% K were recovered relative to the amount indicated by fertilizer labels (Figure 4C). Not surprisingly, N from conventional fertilizer was most efficiently assimilated into transplant shoots at a rate of 87.1% (Figure 4C). Among all organic fertilizers, Miracle-Gro, Drammatic, and all Drammatic-based blends had higher N recovery efficiency, ranging between 56.6% and 67.1% (Figure 4C). Nitrogen in Nature Safe was less efficiently recovered by plants (39.0%), while nitrogen in Dr. Earth was very poorly recovered (12.5%) (Figure 4C). These numbers were all higher than the %N to label in fertilizer solution (Table 2), indicating the mineralization of organic N in the substrate over 21 days of cultivation. Transplants assimilated 39.0%, 56.6%, and 12.5% of N indicated by fertilizer labels from Nature Safe, Miracle-Gro, and Dr. Earth fertilizer tea, respectively (Figure 4C). These values were 32.6%, 34.0%, and 8.6% higher than %N to label in fertilizer solution (Table 2). Drammatic fertilizer solution had 55.8% N in inorganic forms, which was the highest among organic fertilizers (Table 2). The N recovery efficiency from Drammatic was 66.9% at harvesting (Figure 4C). Therefore, it was likely that 11.1% more organic N from Drammatic was mineralized.
The P recovery efficiency was highest in conventional fertilizer (50.6%), followed by Drammatic (28.2%) and Nature Safe (27.7%), then Miracle-Gro (8.0%) and Dr. Earth (6.6%) (Figure 4C, left of dashed line). Among Drammatic-based blends, P recovery efficiency was reversely affected by P rates in fertilizers, as seen in Table 1 (Figure 4C, right of dashed line). Similarly, K recovery efficiency from Drammatic and Drammatic-based blends was reversely affected by K rates in fertilizers (Figure 4C, right of dashed line).

4. Discussion

Production of vigorous organic watermelon transplants is the first step towards profitable organic watermelon production. Organic fertilizers often rely on microbial activities for mineralization to make the nutrients available to crops. Thus, the slower release and limited availability of nutrients in organic fertilizers present challenges for organic growers in managing fertilization programs in transplant production. In our study, commercial organic fertilizers exhibited a wide range of nutrient availability (Table 2). Biomass accumulation of watermelon transplants correlated with nitrate-N concentration, but not the total N rate of fertilizers, indicating that N availability was the limiting factor of plant growth rather than the total amount of N, echoing previous studies on organic fertilizers [27,28,29,30,31].

4.1. Nitrogen and Phosphorus Availability and Mineralization Rates Varied Among Fertilizers

In our study, fertilizers showed a wide range of N and P availability to plants (Table 2). Conventional fertilizer had 36% N in inorganic form (Table 2). The conventional fertilizer label indicates that 57.5% N is urea, which cannot be measured by a spectrophotometer and is considered a non-organic nitrogen fertilizer. It rapidly hydrolyzes into ammonium or can be directly absorbed by plant roots through urea transporters on roots [32]. Therefore, the N availability of conventional fertilizer was likely underestimated in our study. Drammatic and Miracle-Gro had the highest and the second highest inorganic N concentrations (55.8% and 22.5%, respectively) among the commercial organic fertilizers, mostly in the form of nitrate-N (Table 2). The labels of Drammatic and Miracle-Gro indicated that they were derived from hydrolyzed fish and soy protein, respectively, as the main N sources. The high N availability of these two organic fertilizers could be the result of a smaller molecule size after protein hydrolyzation. The EC of Miracle-Gro and Drammatic were also higher than other commercial fertilizers, implying higher ion concentration and potentially higher nutrient availability (Table 2). As for N mineralization after 21 DAS, Nature Safe and Miracle-Gro were higher in N mineralization rates, at 32.6% and 34.0%, respectively, among all organic fertilizers (comparing Table 2 and Figure 4C). Although the amount of N mineralization of Drammatic (11.1%) was lower than that of Nature Safe and Miracle-Gro, Drammatic fertilizer solution had the highest percentage of N in inorganic form (%N to label of 55.8%, see Table 2), and therefore still supplied the highest amount of N (66.9%) to transplants among all organic fertilizers after 21 days (Figure 4C).
Our results indicated that P and K availability, and the mineralization of the organic fertilizers, were of less importance than N for watermelon transplant growth. Recovered P was lower than measured P in organic fertilizer solutions, except for Dr. Earth (Table 2, Figure 4C). The lower P and K recovery efficiency was likely due to the lower P and K demand of transplants, since excessive P and K accumulated in substrates (Figure 4B) and possibly in roots [33], except for P in Miracle-Gro and Dr. Earth fertilizer tea. Interestingly, measured P in fertilizer solutions of Drammatic and Drammatic-based fertilizer blends was higher than the label indicated (Table 2). P was measured for soluble orthophosphate in fertilizer solutions according to the HI 83200 spectrophotometer manual. The reason for the higher measured P remains unclear.
From these results, we recommend that growers take N availability and mineralization rates into consideration when determining fertilizer rates for their crops, rather than rely purely on fertilizer labels of organic fertilizers. Our results also suggest that Drammatic seems suitable for shorter production cycles due to its high inorganic N concentration in freshly made fertilizer solutions (55.8%) (Table 2). While Miracle-Gro and Nature Safe had lower initial %N to label than Drammatic (22.5% and 6.4%, respectively) (Table 2), over 21 days of watermelon transplant cultivation, 34.0% and 32.6% total N, respectively, was mineralized and available to crops. They potentially can provide N to crops at lower rates over a longer period, and are therefore suitable for long production cycles. Fertilizer tea made by Dr. Earth was not recommended since it was a wasteful practice to discard the solid portion.

4.2. Plant Growth as Affected by Fertilizers

We originally hypothesized that the low root dry weight and high shoot dry weight of transplants fertilized by Drammatic rather than Nature Safe were the results of the higher P and lower K contents in Drammatic, based on [18]. Therefore, we supplemented Drammatic with N-rich and/or K-rich organic fertilizers to decrease the P content and/or increase the K content in fertilizers. Transplants fertilized by Drammatic-based blends did not exhibit significantly different leaf area, shoot fresh and dry weight, root dry weight, and root:shoot ratio compared to Drammatic (Figure 1 and Figure 2). Drammatic+N1+K2 had a higher chlorophyll content and Drammatic+N1+K1 had a higher root length than Drammatic (Figure 1D and Figure 2C), but neither resulted in any increase in shoot or root biomass. Our results did not support our hypothesis that low root biomass was the result of high P and/or low K concentrations in Drammatic.
Among all fertilizers we tested, significant differences in transplant morphological and growth characteristics were found (Figure 1 and Figure 2). We used stepwise regression analysis to explore correlations between chemical attributes of organic fertilizers and transplant growth. Although liquid fertilizers exhibited a range of pH (4.54–7.15) and EC (1.70–3.36 mS·cm−1) (Table 2), and affected pH (5.96–7.36) and EC (0.77–2.77 mS·cm−1) in the root zone (Supplemental Figure S2), no significant effect of fertilizer pH and EC was detected on shoot dry weight, root dry weight, or root:shoot ratio by stepwise regressions. Those morphological parameters did not correlate with N rates and ammonium-N concentration either. Instead, stepwise regression determined that nitrate-N and nitrite-N concentration in fertilizer solutions affected shoot growth, nitrate-N and P concentrations affected root growth, and nitrite-N and P concentrations affected the root:shoot ratio (Figure 3).

4.2.1. Shoot Growth Limited by Nitrogen Availability

Nitrogen availability, particularly in nitrate (NO3) form, was the limiting factor of shoot growth in our study, as seen in the positive correlation between nitrate-N concentration in fertilizers and shoot dry weight (Figure 3A). Furthermore, low nitrate-N concentrations were measured in all substrate samples (<3 µg·g−1, Figure 4B), indicating that watermelon transplants scavenge all available N from the substrate. The fertilizer rate in our study (0.4 g N/L substrate) provided a low fertility level to watermelon transplants based on a previous study performed in our laboratory [18]. Since our hypothesis was that the N:P:K ratio of organic fertilizer would affect transplant growth, we chose a low fertilizer rate so that the effects of nutrient composition would be more pronounced. However, in our study, nitrogen was most limiting while P and K were rarely insufficient, except for low P in Miracle-Gro and Dr. Earth fertilizer tea (Table 2 and Figure 4). Lower shoot fresh and dry weights of watermelon plants have been recorded in N-deficient conditions by the literature, including those that were induced by organic fertilizers [18,34,35].
Many horticultural crops, including watermelon, prefer nitrate over ammonium as their main N source [36]. A previous study on watermelon seedlings showed that total the dry weight, leaf area, photosynthetic rates, root length, root surface area, and root volume all decreased as the ammonium: nitrate ratio increased [36]. Stepwise regression analyses suggest that the ammonium did not contribute significantly to shoot growth in our study, consistent with previous findings (Figure 3A).
Nitrogen concentration in shoots of watermelon transplants fertilized by different fertilizers varied (Figure 4A). Shoot N concentrations were all higher than 4%, which fell into the ‘high’ range [24], except for plants received Dr. Earth fertilizer tea (Figure 4A). The trend matched with shoot dry weight well (see Figure 1C, R2 = 0.83, p < 0.001), which further indicated the N availability in fertilizer was the limiting factor for shoot growth.

4.2.2. Shoot Growth and Nitrite Toxicity

Shoot dry weight also negatively correlated with nitrite-N concentration (Figure 3A). Nitrite naturally occurs during the nitrification process and can cause toxicity to plants. Once the organic nitrogen was mineralized to ammonium, which is converted to nitrite by Nitrosomonas in soil, it is then oxidized to nitrate by Nitrobacter. Nitrite typically oxidizes quickly and does not accumulate in soil to a toxic level or cause significant economic losses. Several factors, however, lead to nitrite accumulation in soil, for example, high pH [37,38], poor soil aeration [37,39], high ammonium level [38,40], and organic matter application [37,39]. In our study, up to 0.58 ppm nitrite-N (equivalent to 1.91 ppm nitrite) was detected in fertilizers (Table 2). The highest nitrite concentration in leachate was 4.6 ppm. This nitrite level is likely too low to cause damage to plants or microbes in substrate based on previous studies [39,41,42]. Therefore, the negative correlation between nitrite-N concentration and shoot dry weight is likely not a causal relationship. Other factors associated with nitrite in fertilizer possibly resulted in the reduction of shoot dry weight, for example, high pH, and need further investigation.

4.2.3. Shoot Growth Unaffected by Phosphorus and Potassium Concentration

Phosphorus concentration in fertilizers did not significantly affect shoot fresh or dry weight. This result is in line with findings from previous studies showing that shoot growth parameters, such as fresh and dry weight, leaf number, total leaf area, and canopy height of watermelon transplants grown in containers were sensitive to N but not P [35]. Watermelon plants require less P than N [24,43], therefore, fertilizers low in P may not necessarily result in P limitation as N did. Miracle-Gro and Dr. Earth fertilizer tea had significantly lower measured P concentrations (18 and 10 mg·L−1, respectively) than other treatments (Table 2). Consequently, residual P concentrations in the substrate were also lower in Miracle-Gro and Dr. Earth treatments, also indicating P limitation in these two fertilizers (Figure 4B). Yet, only transplants fertilized with Miracle-Gro had shoot P concentration (0.29% ± 0.03%) in the deficient range (<0.3%), but not those fertilized with Dr. Earth fertilizer tea (0.43% ± 0.00%) (Figure 4A, Supplemental Table S2) [24]. The phosphorus concentration of shoot samples from the rest of the treatment were all >1.2%, which were over two times higher than the high range threshold [24]. This ‘luxury uptake’ of P was likely a result of excessive P supply from fertilizers [22]. Despite the low P supply and shoot P, Miracle-Gro still resulted in the highest shoot fresh and dry weights among organic fertilizers (Figure 1). Drammatic and Drammatic blends without supplemental N-rich fertilizer had higher P concentrations than other fertilizers (Table 2), but the higher P concentration in fertilizers did not result in higher shoot P concentration (Figure 4A) or higher shoot fresh or dry weights (Figure 1). It is likely that watermelon transplants either did not take up the excessive P (Figure 4B) or possibly stored excessive P in the roots. A previous study found that plants can store excessive P, K, Mg, and Na in globular structures in the cortex cells of roots [33]. These results, along with results from regression analyses, suggest that the P availability in fertilizers did not impose significant limitations on shoot growth.
The potassium concentration in liquid fertilizers cannot be reliably measured by a spectrophotometer. Therefore, no correlation between growth parameters and K concentration was tested as N and P in Figure 3. Substrate K was not completely depleted by roots, unlike N (Figure 4B), implying that K availability was less limiting for plants than N. Based on fertilizer labels, Drammatic had a lower K rate than conventional fertilizer and other commercial organic fertilizers (Table 1). Shoot K concentration when fertilized by Drammatic (2.77% ± 0.09%, Figure 4A) still fell into the sufficient range of 2.7–3.5% [24]. Drammatic supplemented with K-rich fertilizers resulted in a higher shoot K concentration than Drammatic, except for Drammatic+N1+K2 (3.19% ± 0.07%) (Figure 4A), but without resulting in higher shoot fresh and dry weights (Figure 1B,C). These results indicated sufficient K supply from Drammatic, despite a lower K concentration compared to other fertilizers. The results of shoot P and K concentrations, and shoot fresh and dry weights, did not support our hypothesis that high P and/or low K content in Drammatic promoted shoot growth compared to other organic fertilizers as seen in [18]. The higher shoot growth was rather a result of higher N availability in Drammatic.

4.2.4. Root Growth and Root:Shoot Ratio Weakly Affected by Mineral Availability

Nutrient availability in organic fertilizers affected root dry weight (Figure 2 and Figure 3B). Stepwise regression analysis determined that root dry weight was positively affected by nitrate-N concentration and was negatively affected by measured P concentration (Figure 3B). We originally hypothesized that the high P concentration in Drammatic potentially inhibits root growth and enhances shoot growth, as seen in [18], which is not desirable for transplant production. In our study, higher P concentration in fertilizers did not increase shoot growth, as discussed earlier, but negatively affected root dry weight (Figure 3). Similar to shoot dry weight, root dry weight was positively affected by nitrate-N concentration in fertilizer solution (Figure 3B), further confirming that N availability limited transplant growth. Also, nitrate-N enhanced root growth more strongly than the inhibition by P in liquid fertilizers (Figure 3B). The slopes indicated that root dry weight increased by 0.077 mg per 1 mg·L−1 N in nitrate form and decreased by 0.019 mg per 1 mg·L−1 measured P (Figure 3B). This result continues to highlight the importance of N availability in organic fertilizers on transplant growth.
However, the R2 value (0.35) of the model suggested that difference in mineral concentration of fertilizers can only explain 35% of variation in root dry weight, which is low compared to the model built for shoot dry weight, where R2 was 0.70 (Figure 3). A similar result of shoots being more sensitive to nitrogen availability than roots was obtained in both Arabidopsis (Arabidopsis thaliana) and watermelon [25,35,44]. It was possible that the root development relied more on the mineral reserves in seeds than shoots, while shoots possibly utilized mineral uptake by roots for growth. Later in growth, since the N limiting condition persisted, plants continued to invest in root growth over shoot growth, and N in the root did not translocate to shoots. For example, the root dry weight of plants fertilized by Dr. Earth fertilizer tea (26.7 mg/plant) was as high as 70% of the root dry weight of conventional fertilizer (38.3 mg/plant) (Figure 2A), despite extremely low N content in the fertilizer solution and low shoot dry weight compared to conventional fertilizer (Table 2 and Figure 1). This pattern that resource allocates towards roots under a limited mineral nutrient condition was described by ecological models [45,46]. Another possibility is that the propagation cell size (<60 mL per cell) limited root growth and altered root morphology. During harvest, we noticed that roots were coiled around the lower part of the cell. The small cell size possibly limited the root expansion and imposed a limitation on the sink size of root growth [21,47].

4.3. Limitations and Future Directions

One limitation of this study is that each organic fertilizer had a specific chemical composition, EC and pH, therefore it is challenging to separate the effects of chemical composition, EC, and pH on transplant growth. For example, Nature Safe is made from corn steep liquor, which is rich in phenolic acid, amino acids, and other bioactive molecules [48,49]. It also had the lowest pH, EC, nitrate-N, and nitrite-N concentrations (both were 0 mg/L) (Table 2). Similarly, stepwise regression in our study also suggested that nitrite-N concentrations negatively affected root dry weight (Figure 3B). However, the nitrite-N concentration in our study (Figure 3A) was too low to induce nitrite toxicity [39,41,42]. The decrease in root dry weight could potentially be attributed to factors associated with the higher nitrite concentration, for example, high pH or fertilizer types. A high correlation of those parameters is known as ‘multicollinearity’ in statistics. Such multicollinearity made it challenging to identify the true correlations between crop growth parameters and fertilizer chemical properties. Further studies are needed to distinguish the effects from different properties of organic fertilizers.
Our study highlighted the importance of N availability in watermelon transplant growth. However, our recommendations were made only from transplant growth and not from the final yield of watermelon fruits. A previous study found that a high N fertility during the transplant production stage resulted in the higher transplant fresh and dry weights of triploid watermelon ‘Crimson Sweet’ and ‘Queen of Hearts’ [35], similar to our study. However, the high fresh and dry weights of transplants also resulted in higher transplant shock in the field, as well as a higher occurrence of white heart and hallow heart of watermelon fruits, which are undesirable for watermelon production [35]. Larger transplant shoot size was also harder to handle [35], therefore, they recommended low N fertilizer during transplant production for watermelon [35]. It is yet to be tested if watermelon transplants responded the same under organic production conditions.
Organically grown crops often have higher organic compounds and secondary metabolites concentration (for example, vitamins, β-carotene, and phenolics) than conventionally grown crops, which are associated with stress responses [50]. In our study, low nitrogen availability and high salinity of organic fertilizers were observed (Table 2) and were shown to result in the accumulation of phenolic compounds and flavonoids by the previous literature [31,50]. We did not quantify the concentration of these compounds or their antioxidant capacity, but their potential accumulation in watermelon transplants could affect their survival and performance after transplanting, which calls for further evaluation.
Microbial communities in the substrate are affected by substrate type and fertilization [51,52]. Chemical and physical characteristics of growing media and fertilization, such as water content, pH, C:N ratio, porosity, particle size, nitrate-N, and electrical conductivity, affected the bacterial communities and subsequentially mineralization of organic nitrogen [51,52,53]. For example, when organic fertilizer was applied to rockwool substrate, no N mineralization was detected after 18 days, while nitrate concentrations increased when organic fertilizer was applied to coconut coir and peat-based media [52]. Interestingly, the presence of plants affected the microbial community and mineralization of organic fertilizer [53,54]. Tomato plants exert a more significant effect on the structure of microbial communities compared to fertilizers [53]. Tomato plants further suppressed the potential ammonia oxidation rate in the substrate [53]. The optimal temperature of 28 °C and water content higher than 0.46 v/v were also identified for microbial activity in peat-based substrate, which resulted in the highest nitrification rate [54]. From the existing literature, it is expected that, in our study, the organic fertilizers, microbial community, and watermelon root interactively shaped the mineral process in the substrate. Unfortunately, in this study, we did not quantify microbial activities in substrates. We will consider this in our future studies. Our findings emphasized the challenges in managing nitrogen availability in organic fertilizers due to the diversity of ingredients and in predicting crop growth response to organic fertilizers. One promising solution is the co-application of organic fertilizers with microbial-based biostimulants. Studies on microbial-based biostimulant applications in organic culture have showed positive effects in enhancing organic nutrient availability and promoting growth [55]. Biostimulants can be beneficial in enhancing nutrient availability and optimizing organic watermelon transplant production. Further studies are needed to test this approach.

5. Conclusions

Commercial organic fertilizers varied widely in nutrient availability. While Drammatic had the highest initial nitrogen availability (as %N to label, 55.8%), Miracle-Gro had low initial nitrogen availability (22.5%) but still achieved high nitrogen recovery efficiency (56.6%) after 21 days of watermelon cultivation, similar to Drammatic, due to efficient organic nitrogen mineralization (34.0%). In turn, Miracle-Gro and Drammatic resulted in the best shoot growth, and Miracle-Gro resulted in the best root growth, while Dr. Earth fertilizer tea resulted in the worst transplant growth. Nature Safe had low initial nitrogen availability (6.4%) but had a relatively high nitrogen mineralization rate at 32.6% over 21 days, similar to Miracle-Gro. Therefore, Nature Safe is potentially suitable for long production cycles. Nitrogen availability, especially nitrate concentrations in fertilizers, was the limiting factor of watermelon transplant growth. Despite high phosphorus and low potassium content in Drammatic, balancing the N:P:K ratio in Drammatic by supplementing it with nitrogen-rich and/or potassium-rich organic fertilizers did not affect watermelon transplant growth, further highlighting the importance of nitrogen availability rather than nutrient balance. Growers need to take nutrient availability and mineralization in organic fertilizers into account when selecting the right fertilization rate for their crops. More studies are needed to quantify the long-term effect of organic fertilizer on organic watermelon production such as fruit yield and quality, as well as the effect of biostimulants on nutrient availability and transplant growth and development.

Supplementary Materials

The following supporting information can be downloaded at: https://www.mdpi.com/article/10.3390/horticulturae10111140/s1, Table S1: Manufacturer, nitrogen (N), phosphorus (P), and potassium (K) sources indicated by fertilizer labels of commercial fertilizers tested on watermelon transplants; Table S2: Manufacturer, nitrogen (N), phosphorus (P), and potassium (K) sources indicated by fertilizer labels of organic fertilizers supplemented to Drammatic; Table S3: Foliage mineral concentration of watermelon transplants fertilized by different fertilizers and Drammatic based blends. Plants were 21 days old. Values with the same letter are not statistically different (p ≤ 0.05), the letters were statistics performed for each mineral. The composition of the fertilizer treatments is shown in Table S1; Table S4: Substrate mineral concentration of watermelon transplants fertilized by different fertilizers and Drammatic based blends. Plants were 21 days old. Values with the same letter are not statistically different (p ≤ 0.05), the letters were statistics performed for each mineral. The composition of the fertilizer treatments is shown in Table S1. Figure S1. Organic fertilizers affected watermelon shoot height (A) and width (B) at 8 (orange bars), 15 (grey bars), and 20 (blue bars) days after sowing. Bars with the same letter are not statistically different (p ≤ 0.05), the letters were statistics performed per time point. Error bars represent standard deviation (n = 2). The composition of the fertilizer treatments is shown in Table S1. Figure S2. Leachate pH (A) and electrical conductivity (EC) (B) from watermelon transplants fertilized with conventional and organic fertilizers. Leachates were collected one day after fertilizer application. The time of leachate collection is indicated on the left in panel B. Bars with the same letter are not statistically different (p ≤ 0.05), the letters were statistics performed per time point. Error bars represent standard deviation (n = 2). The composition of the fertilizer treatments is shown in Table S1.

Author Contributions

Conceptualization, J.L., J.M. and G.N.; resources, G.N.; investigation, J.L. and Q.Z.; data curation, J.L. and Q.Z.; writing—original draft preparation, J.L.; writing—review and editing, J.L., J.M., Q.Z. and G.N.; supervision, G.N.; project administration, G.N. funding acquisition: G.N. and J.M. All authors have read and agreed to the published version of the manuscript.

Funding

This research was funded by Specialty Crop Multi-State Program grant TX-SCM-21-05, Hatch Project TEX07726, and Specialty Crop Block Grant GSC2022030.

Data Availability Statement

The original contributions presented in the study are included in the article, further inquiries can be directed to the corresponding author.

Acknowledgments

We thank Sangjun Jeong, Yubraj K C, and everyone in the Urban Hort lab for their help and support with this study.

Conflicts of Interest

The authors declare no conflicts of interest.

References

  1. Grange, S.; Leskovar, D.I.; Pike, L.M.; Cobb, B.G. Seedcoat structure and oxygen-enhanced environments affect germination of triploid watermelon. J. Am. Soc. Hortic. Sci. 2003, 128, 253–259. [Google Scholar] [CrossRef]
  2. NeSmith, D. Root distribution and yield of direct seeded and transplanted watermelon. J. Am. Soc. Hortic. Sci. 1999, 124, 458–461. [Google Scholar] [CrossRef]
  3. Weston, L.A.; Zandstra, B.H. Effect of root container size and location of production on growth and yield of tomato transplants. J. Am. Soc. Hortic. Sci. 1986, 111, 498–501. [Google Scholar] [CrossRef]
  4. Janssen, M. Determinants of organic food purchases: Evidence from household panel data. Food Qual. Prefer. 2018, 68, 19–28. [Google Scholar] [CrossRef]
  5. Reganold, J.P.; Wachter, J.M. Organic agriculture in the twenty-first century. Nat. Plants 2016, 2, 15221. [Google Scholar] [CrossRef]
  6. Shahabi Ahangarkolaee, S.; Gorton, M. The effects of perceived regulatory efficacy, ethnocentrism and food safety concern on the demand for organic food. Int. J. Consum. Stud. 2021, 45, 273–286. [Google Scholar] [CrossRef]
  7. US Department of Agriculture, National Agricultural Statistics Service. 2021 Organic Survey. 2022. Available online: https://www.nass.usda.gov/Surveys/Guide_to_NASS_Surveys/Organic_Production/ (accessed on 26 August 2024).
  8. Bergstrand, K.-J. Organic fertilizers in greenhouse production systems—A review. Sci. Hortic. 2022, 295, 110855. [Google Scholar] [CrossRef]
  9. Chatzistathis, T.; Kavvadias, V.; Sotiropoulos, T.; Papadakis, I.E. Organic fertilization and tree orchards. Agriculture 2021, 11, 692. [Google Scholar] [CrossRef]
  10. Burnett, S.E.; Mattson, N.S.; Williams, K.A. Substrates and fertilizers for organic container production of herbs, vegetables, and herbaceous ornamental plants grown in greenhouses in the United States. Sci. Hortic. 2016, 208, 111–119. [Google Scholar] [CrossRef]
  11. Timsina, J. Can organic sources of nutrients increase crop yields to meet global food demand? Agronomy 2018, 8, 214. [Google Scholar] [CrossRef]
  12. Zikeli, S.; Deil, L.; Möller, K. The challenge of imbalanced nutrient flows in organic farming systems: A study of organic greenhouses in Southern Germany. Agric. Ecosyst. Environ. 2017, 244, 1–13. [Google Scholar] [CrossRef]
  13. Pang, X.; Letey, J. Organic farming challenge of timing nitrogen availability to crop nitrogen requirements. Soil Sci. Soc. Am. J. 2000, 64, 247–253. [Google Scholar] [CrossRef]
  14. He, H.; Peng, M.; Ru, S.; Hou, Z.; Li, J. A suitable organic fertilizer substitution ratio could improve maize yield and soil fertility with low pollution risk. Front. Plant Sci. 2022, 13, 988663. [Google Scholar] [CrossRef]
  15. Kozai, T.; Kubota, C.; Chun, C.; Afreen, F.; Ohyama, K. Necessity and concept of the closed transplant production system. In Transplant Production in the 21st Century, Proceedings of the International Symposium on Transplant Production in Closed System for Solving the Global Issues on Environmental Conservation, Food, Resources and Energy, Chiba, Japan, 28 February–2 March 2000; Springer: Berlin/Heidelberg, Germany, 2000; pp. 3–19. [Google Scholar]
  16. Shrefler, J.; Brandenberger, L.; Rebek, E.; Damicone, J.; Taylor, M.; Watermelon production. Oklahoma Cooperative Extension, Oklahoma State University, Oklahoma, United States of America, Fact Sheets, HLA-6236. 2015. Available online: http://osufacts.okstate.edu (accessed on 26 August 2024).
  17. McAvoy, T.; Coolong, T. Commercial Watermelon Production; The University of Georgia: Athens, GA, USA, 2017. Bulletin 996. Available online: https://extension.uga.edu/publications/detail.html?number=B996&title=commercial-watermelon-production (accessed on 26 August 2024).
  18. Zhang, Q.; Masabni, J.; Niu, G. Organic fertilizer type and dose affect growth, morphological and physiological parameters, and mineral nutrition of watermelon seedlings. PeerJ 2024, 12, e16902. [Google Scholar] [CrossRef]
  19. Wissuwa, M.; Gamat, G.; Ismail, A.M. Is root growth under phosphorus deficiency affected by source or sink limitations? J. Exp. Bot. 2005, 56, 1943–1950. [Google Scholar] [CrossRef]
  20. Niu, Y.F.; Chai, R.S.; Jin, G.L.; Wang, H.; Tang, C.X.; Zhang, Y.S. Responses of root architecture development to low phosphorus availability: A review. Ann. Bot. 2013, 112, 391–408. [Google Scholar] [CrossRef]
  21. Lopez, G.; Ahmadi, S.H.; Amelung, W.; Athmann, M.; Ewert, F.; Gaiser, T.; Gocke, M.I.; Kautz, T.; Postma, J.; Rachmilevitch, S. Nutrient deficiency effects on root architecture and root-to-shoot ratio in arable crops. Front. Plant Sci. 2023, 13, 1067498. [Google Scholar] [CrossRef]
  22. Caspersen, S.; Bergstrand, K.-J. Phosphorus restriction influences P efficiency and ornamental quality of poinsettia and chrysanthemum. Sci. Hortic. 2020, 267, 109316. [Google Scholar] [CrossRef]
  23. Henry, J.B.; McCall, I.; Jackson, B.; Whipker, B.E. Growth Response of Herbaceous Ornamentals to Phosphorus Fertilization. HortScience 2017, 52, 1362–1367. [Google Scholar] [CrossRef]
  24. Hochmuth, G.J.; Hanlon, E. Plant Tissue Analysis and Interpretation for Vegetable Crops in Florida: HS964/EP081 Rev. 11/2022; EDIS 2022 (6); University of Florida: Gainesville, FL, USA, 2022. [Google Scholar] [CrossRef]
  25. Gruber, B.D.; Giehl, R.F.; Friedel, S.; von Wirén, N. Plasticity of the Arabidopsis root system under nutrient deficiencies. Plant Physiol. 2013, 163, 161–179. [Google Scholar] [CrossRef]
  26. Altland, J.E. The pour-through procedure for monitoring container substrate chemical properties: A review. Horticulturae 2021, 7, 536. [Google Scholar] [CrossRef]
  27. Blok, C.; Streminska, M.; Vermeulen, T.; Klein, P. Organic fertilisers and nitrogen availability. Acta Hortic. 2017, 1168, 1–10. [Google Scholar] [CrossRef]
  28. Gaskell, M.; Smith, R. Nitrogen Sources for Organic Vegetable Crops. HortTechnology 2007, 17, 431–441. [Google Scholar] [CrossRef]
  29. Nygaard Sorensen, J.; Thorup-Kristensen, K. Plant-based fertilizers for organic vegetable production. J. Plant Nutr. Soil Sci. 2011, 174, 321–332. [Google Scholar] [CrossRef]
  30. Raviv, M.; Oka, Y.; Katan, J.; Hadar, Y.; Yogev, A.; Medina, S.; Krasnovsky, A.; Ziadna, H. High-nitrogen compost as a medium for organic container-grown crops. Bioresour. Technol. 2005, 96, 419–427. [Google Scholar] [CrossRef]
  31. Zhao, X.; Nechols, J.R.; Williams, K.A.; Wang, W.; Carey, E.E. Comparison of phenolic acids in organically and conventionally grown pac choi (Brassica rapa L. chinensis). J. Sci. Food Agric. 2009, 89, 940–946. [Google Scholar] [CrossRef]
  32. Miller, A.J.; Cramer, M.D. Root nitrogen acquisition and assimilation. Plant Soil 2005, 274, 1–36. [Google Scholar] [CrossRef]
  33. Ryan, M.H.; Kaur, P.; Nazeri, N.K.; Clode, P.L.; Keeble-Gagnère, G.; Doolette, A.L.; Smernik, R.J.; Van Aken, O.; Nicol, D.; Maruyama, H.; et al. Globular structures in roots accumulate phosphorus to extremely high concentrations following phosphorus addition. Plant Cell Environ. 2019, 42, 1987–2002. [Google Scholar] [CrossRef]
  34. Colla, G.; Rouphael, Y.; Mirabelli, C.; Cardarelli, M. Nitrogen-use efficiency traits of mini-watermelon in response to grafting and nitrogen-fertilization doses. J. Plant Nutr. Soil Sci. 2011, 174, 933–941. [Google Scholar] [CrossRef]
  35. Schultheis, J.R.; Dufault, R.J. Watermelon seedling growth, fruit yield, and quality following pretransplant nutritional conditioning. HortScience 1994, 29, 1264–1268. [Google Scholar] [CrossRef]
  36. Na, L.; Li, Z.; Xiangxiang, M.; Ara, N.; Jinghua, Y.; Mingfang, Z. Effect of Nitrate/Ammonium Ratios on Growth, Root Morphology and Nutrient Elements Uptake of Watermelon (Citrullus lanatus) Seedlings. J. Plant Nutr. 2014, 37, 1859–1872. [Google Scholar] [CrossRef]
  37. Oke, O.L. Nitrite Toxicity to Plants. Nature 1966, 212, 528. [Google Scholar] [CrossRef]
  38. Shen, Q.; Ran, W.; Cao, Z. Mechanisms of nitrite accumulation occurring in soil nitrification. Chemosphere 2003, 50, 747–753. [Google Scholar] [CrossRef] [PubMed]
  39. Hamilton, J.L.; Lowe, R.H. Organic Matter and N Effects on Soil Nitrite Accumulation and Resultant Nitrite Toxicity to Tobacco Transplants. Agron. J. 1981, 73, 787–790. [Google Scholar] [CrossRef]
  40. Birch, P.; Eagle, D. Toxicity to seedlings of nitrite in sterilized composts. J. Hortic. Sci. 1969, 44, 321–330. [Google Scholar] [CrossRef]
  41. Bancroft, K.; Grant, I.F.; Alexander, M. Toxicity of NO2: Effect of nitrite on microbial activity in an acid soil. Appl. Environ. Microbiol. 1979, 38, 940–944. [Google Scholar] [CrossRef] [PubMed]
  42. Samater, A.H.; Van Cleemput, O.; Ertebo, T. Influence of the presence of nitrite and nitrate in soil on maize biomass production, nitrogen immobilization and nitrogen recovery. Biol. Fertil. Soils 1998, 27, 211–218. [Google Scholar] [CrossRef]
  43. Olaniyi, J. Growth and seed yield response of egusi melon to nitrogen and phosphorus fertilizers application. J. Sustain. Agric. 2008, 2, 255–260. [Google Scholar]
  44. Nawaz, M.A.; Chen, C.; Shireen, F.; Zheng, Z.; Sohail, H.; Afzal, M.; Ali, M.A.; Bie, Z.; Huang, Y. Genome-wide expression profiling of leaves and roots of watermelon in response to low nitrogen. BMC Genom. 2018, 19, 456. [Google Scholar] [CrossRef]
  45. Hermans, C.; Hammond, J.P.; White, P.J.; Verbruggen, N. How do plants respond to nutrient shortage by biomass allocation? Trends Plant Sci. 2006, 11, 610–617. [Google Scholar] [CrossRef]
  46. Shipley, B.; Meziane, D. The balanced-growth hypothesis and the allometry of leaf and root biomass allocation. Funct. Ecol. 2002, 16, 326–331. [Google Scholar] [CrossRef]
  47. Elmstrom, G. Watermelon root development affected by direct seeding and transplanting. HortScience 1973, 8, 134–136. [Google Scholar]
  48. Navarro-Morillo, I.; Navarro-Perez, V.; Perez-Millan, R.; Navarro-León, E.; Blasco, B.; Cámara-Zapata, J.M.; Garcia-Sanchez, F. Effects of root and foliar application of corn steep liquor on pepper plants: A physiological, nutritional, and morphological study. Horticulturae 2023, 9, 221. [Google Scholar] [CrossRef]
  49. Zhu, M.-M.; Liu, E.-Q.; Bao, Y.; Duan, S.-L.; She, J.; Liu, H.; Wu, T.-T.; Cao, X.-Q.; Zhang, J.; Li, B.; et al. Low concentration of corn steep liquor promotes seed germination, plant growth, biomass production and flowering in soybean. Plant Growth Regul. 2019, 87, 29–37. [Google Scholar] [CrossRef]
  50. Orsini, F.; Maggio, A.; Rouphael, Y.; De Pascale, S. “Physiological quality” of organically grown vegetables. Sci. Hortic. 2016, 208, 131–139. [Google Scholar] [CrossRef]
  51. Grunert, O.; Hernandez-Sanabria, E.; Vilchez-Vargas, R.; Jauregui, R.; Pieper, D.H.; Perneel, M.; Van Labeke, M.-C.; Reheul, D.; Boon, N. Mineral and organic growing media have distinct community structure, stability and functionality in soilless culture systems. Sci. Rep. 2016, 6, 18837. [Google Scholar] [CrossRef]
  52. Grunert, O.; Reheul, D.; Van Labeke, M.-C.; Perneel, M.; Hernandez-Sanabria, E.; Vlaeminck, S.E.; Boon, N. Growing media constituents determine the microbial nitrogen conversions in organic growing media for horticulture. Microb. Biotechnol. 2016, 9, 389–399. [Google Scholar] [CrossRef]
  53. Grunert, O.; Robles-Aguilar, A.A.; Hernandez-Sanabria, E.; Schrey, S.D.; Reheul, D.; Van Labeke, M.-C.; Vlaeminck, S.E.; Vandekerckhove, T.G.L.; Mysara, M.; Monsieurs, P.; et al. Tomato plants rather than fertilizers drive microbial community structure in horticultural growing media. Sci. Rep. 2019, 9, 9561. [Google Scholar] [CrossRef]
  54. Cannavo, P.; Recous, S.; Valé, M.; Bresch, S.; Paillat, L.; Benbrahim, M.; Guénon, R. Organic fertilization of growing media: Response of N mineralization to temperature and moisture. Horticulturae 2022, 8, 152. [Google Scholar] [CrossRef]
  55. Zhang, Q.; Masabni, J.; Niu, G. Microbial Biostimulants and Seaweed Extract Synergistically Influence Seedling Growth and Morphology of Three Onion Cultivars. Horticulturae 2024, 10, 800. [Google Scholar] [CrossRef]
Figure 1. Organic fertilizers affected leaf area (A), shoot fresh weight (B), shoot dry weight (C), and leaf chlorophyll content (D) of watermelon transplants at 21 days after sowing. The left side of dashed lines shows the results of all commercial fertilizers, and the right side of dashed lines shows the results of Drammatic-based fertilizer blends. Bars with the same letter are not statistically different (p ≤ 0.05). Error bars represent standard deviation (n = 2). The descriptions of the fertilizer treatments are shown in Table 1.
Horticulturae 10 01140 g001
Figure 2. Organic fertilizers affected root dry weight (A), root:shoot ratio (B), and root length (C) of watermelon transplants at 21 days after sowing. The left side of dashed lines shows the results of all commercial fertilizers, and the right side of dashed lines shows the results of Drammatic-based fertilizer blends. Bars with the same letter are not statistically different (p ≤ 0.05). Error bars represent standard deviation (n = 2). The descriptions of the fertilizer treatments are shown in Table 1.
Horticulturae 10 01140 g002
Figure 3. Correlations between nitrate-nitrogen (nitrate-N), nitrite-nitrogen (nitrite-N), and phosphorus (measured P) concentrations in liquid fertilizers to watermelon shoot dry weight (A), root dry weight (B), and root:shoot ratio (C). Regression models were constructed by backward stepwise regression. Nitrate-N, nitrite-N, and measured P concentrations were measured by a spectrophotometer from five commercial fertilizers and seven Drammatic-based fertilizer blends at 400 mg N/mL water (see Table 2).
Horticulturae 10 01140 g003
Figure 4. Nitrogen (N, orange bars), phosphorus (P, grey bars), and potassium (K, blue bars) concentrations in watermelon transplant shoots (A) and substrates (B), and mineral recovery efficiency (C), calculated from shoot mineral content divided by total amount of mineral applied) after harvesting at 21 days. The left side of dashed lines show the results of all commercial fertilizers, and the right side of dashed lines show the results of Drammatic-based fertilizer blends. Bars with different letters indicate statistically significant difference (p ≤ 0.05) between treatment for each mineral. Error bars represent standard deviation (n = 2). The descriptions of the fertilizer treatments are shown in Table 1.
Horticulturae 10 01140 g004
Table 1. Fertilizer application rates. Nitrogen (N), phosphorus (P), and potassium (K) rates of all fertilizer treatments applied to watermelon transplants. N, P, and K rates were calculated based on fertilizer labels. Fertilizer and mineral rates are presented as weight per liter substrate. The details of the fertilizers, and N, P, and K sources for supplemental fertilizers, are shown in Supplemental Tables S1 and S2.
No.TreatmentFert 1 Rate (g/L)Fert 2 Rate (g/L)Fert 3 Rate (g/L)N Rate (mg/L)P Rate (mg/L)K Rate (mg/L)
1Conventional2.0--400174332
2Nature Safe5.7--400174332
3Miracle-Gro5.0--400174332
4Dr. Earth10.0--400174332
5Drammatic20.0--400349166
6Drammatic+N110.04.00-40017483
7Drammatic+N210.01.33-40017494
8Drammatic+K120.01.40-400349332
9Drammatic+K320.04.00-400349332
10Drammatic+N1+K110.04.001.40400174332
11Drammatic+N1+K210.04.000.60400174332
12Drammatic+N1+K310.04.004.00400174332
Table 2. Electrical conductivity (EC), pH, mineral concentrations, and percentage of measured N and P to label indicated of fertilizer solutions at 400 mg N/L water. Electrical conductivity (EC), pH, nitrate-nitrogen concentration (NO3-N), ammonium-nitrogen concentration (NH4+-N), nitrite-nitrogen concentration (NO2-N), and P concentration measured by a spectrophotometer are presented. Inorganic nitrogen concentration (inorganic N) was calculated as the sum of nitrate-N, ammonium-N, and nitrite-N. The percentages of inorganic N and measured P concentrations relative to labels N and P concentrations (%N to label and %P to label) are also presented. EC, NO3N, and NO2-N concentrations were highlighted with red or green colors, with a more intense hue indicating higher values. The descriptions of the fertilizer treatments are shown in Table 1.
TreatmentEC (mS·cm−1)pHNO3-N (mg·L−1)NH4+-N (mg·L−1)NO2-N (mg·L−1)Inorganic N (mg·L−1)Measured P
(mg·L−1)
%N to Label%P to Label
Conventional1.986.27140.03.90.00143.917236.0%98.6%
Nature Safe1.704.540.025.40.0025.4806.4%45.9%
Miracle-Gro2.106.7177.013.00.0290.01822.5%10.3%
Dr. Earth1.717.1510.14.80.5815.5103.9%5.7%
Drammatic2.614.58139.084.00.00223.047055.8%134.7%
Drammatic+N11.674.8856.452.50.00108.922527.2%129.0%
Drammatic+N21.665.4870.037.50.31107.821027.0%120.4%
Drammatic+K13.224.5881.977.00.00158.944539.7%127.6%
Drammatic+K33.365.3982.252.00.00134.238033.6%108.9%
Drammatic+N1+K12.564.8251.341.50.0092.822023.2%126.1%
Drammatic+N1+K22.344.8448.955.50.00104.422526.1%129.0%
Drammatic+N1+K3 *2.385.76-------
* N and P concentrations in Drammatic+N1+K3 were not measured since this fertilizer was too dark to be reliably measured by a spectrophotometer.
Disclaimer/Publisher’s Note: The statements, opinions and data contained in all publications are solely those of the individual author(s) and contributor(s) and not of MDPI and/or the editor(s). MDPI and/or the editor(s) disclaim responsibility for any injury to people or property resulting from any ideas, methods, instructions or products referred to in the content.

