Abstract
Near-infrared spectroscopy (NIR) is an efficient and accurate method for fat content detection in walnuts. ‘Wen 185’ walnut is grown in large quantities in southern Xinjiang, and its fat content is an important indicator for evaluating the intrinsic quality. The excessive pursuit of yield efficiency, combined with the neglect of quality, agricultural product safety and other factors, has led to the production of poor-quality walnuts. Moreover, research on predicting walnut kernel fat content based on near-infrared spectroscopy technology is rarely reported. Therefore, a technical framework for walnut kernel detection based on near-infrared spectroscopy and the technical standards for ‘Wen 185’ are urgently needed. After first optimizing the initial spectrum data using five preprocessing methods, we established separate prediction models for walnut kernel fat content based on either a back propagation neural network or a support vector regression (SVR) algorithm. The results show that the correction set and validation set coefficients of determination of the walnut kernel fat content prediction model using the back propagation neural network algorithm were 0.86 and 0.89, respectively, with root mean square errors of 1.56 and 1.58, and an RPD value of 2.57; the coefficients of determination for the calibration and validation sets of SVR were 0.90 and 0.83, respectively, with root mean square errors of 1.76 and 1.70, respectively, and an RPD value of 1.70. Thus, near-infrared spectroscopy can be used to establish a foundation for realizing the rapid detection of walnut kernel fat content.
1. Introduction
China is the largest producer of walnuts in the world, with a history of cultivation spanning more than 2000 years, and it possesses very rich walnut resources. Walnut (Juglans regia L.) is one of the most important woody oil crops in China, and walnut kernels are rich in fat (with linoleic acid being the main component), protein, carbohydrates and other components, representing high economic and nutritional value [1]. Xinjiang is one of the birthplaces of walnut cultivation in China. Moreover, the development of the walnut industry in other provinces and cities not only has unique advantages but also serves as a pillar for farmers to increase their income and prosperity, particularly in the southern border areas [2]. At present, there is significant focus on the quality and nutritional value of walnuts [3]. The fat content of walnuts is a critical indicator for evaluating their quality and is central to their nutritional value. Thus, testing the fat content of walnut kernels is essential for ensuring the healthy development of the walnut industry [4]. However, traditional detection methods have problems such as long analysis times, excessive use of organic reagents, high costs and low efficiency, and are thus unsuitable for high-volume testing and may not be compatible with modern production requirements. As a detection technology, near-infrared spectroscopy has the characteristics of fast speed, high efficiency, low analysis cost and simple operation [5,6]. Therefore, these features can effectively solve the problems of traditional methods and provide a feasible method to realize the rapid detection of walnut kernel fat content [7,8,9].
In recent years, near-infrared spectroscopy has been increasingly applied in nut quality testing. It was used by Yi J et al. [10] to detect and analyze the water, protein and fat content in 116 walnut powder samples. Their analysis demonstrated that near-infrared reflectance spectroscopy had good predictive ability for moisture, protein and fat content, indicating its reliability as a technique for predicting walnut composition. In 2019, Ma Wenqiang et al. [11,12] established an IPLS quantitative correction prediction model based on NIR for the simultaneous detection of protein components in walnut samples in different physical states. With the root mean square error and correlation coefficients of walnut whole kernel sample validation set to 0.021 and 0.913, they demonstrated that their method can be used to optimize model quality and achieve the rapid, nondestructive detection of walnut kernel fat content. Chengji Li et al. [13] investigated the application of near-infrared diffuse reflectance spectroscopy to fresh walnuts during storage, establishing a two-dimensional correlation visible–NIR kinetic model for the rapid detection of their moisture content at room temperature. Qingping Wang et al. [14] established a calibration model for crude fat and protein content in hickory based on NIR, and their results showed a correlation coefficient as high as 0.99 for crude fat and a coefficient of variation of 0.83. This demonstrated the good predictive performance of NIR, suggesting it can effectively detect crude fat and protein content in pecans.
Overall, walnut research based on NIR is similar to research using other techniques, although there are differences in the methods for data preprocessing, selection of spectral characteristic bands and inversion. Therefore, our study aims to explore the influence of different spectral pretreatment methods on the inversion results of ‘Wen 185’ walnut in southern Xinjiang, comparing the influence of different feature screening and inversion models on the inversion results and establishing both back propagation neural network and SVR prediction models for the fat content of ‘Wen 185’ walnut. Subsequent rapid characterization provides a relevant theoretical basis for rapidly determining the quality of ‘Wen 185’ walnut in southern Xinjiang.
2. Materials and Methods
2.1. Material
Samples were selected from the ‘Wen 185’ walnut forest farm in Wensu County, Aksu Prefecture, Xinjiang, and were obtained from 180 10-year-old trees in 9 different walnut orchards (3 each in high-yield management orchards, middle-class management orchards and low-yield management orchards), each with a row spacing of 4 m × 6 m. During the walnut ripening period (1 September 2021), 20 walnut fruits were collected from each tree for a total of 3600 walnuts. After harvesting, the green peels were removed and dried in a ventilated area. After drying, the walnuts were broken and shelled for collecting the kernels, and the walnuts were crushed for 3 min using a FW-80 high-speed universal crusher with even mixing. They were then packed in plastic bags, sealed and stored in a refrigerator at 4 °C until spectral scanning and the determination of the contents of each component were carried out.
2.2. Main Instruments
The instruments used in these tests were the Antaris II FT-NIR Fourier Near Infrared Spectrometer from Thermo Fisher, Waltham, MA, USA. SAE-D Active Automatic Fat Analyzer from Jinan Alva Instrument Ltd., FW-80 High-speed Universal Crusher from Shanghai Jinpeng Analytical Instrument Ltd., Shanghai, China. Model DHG-9240A Electrothermal Constant Temperature Blast Drying Oven from Shanghai Qixin Scientific Instrument Co., Ltd., Shanghai, China. Model BCD-216TX Refrigerator from Qingdao Haier Co., and BCD-216TX Refrigerator from Qingdao Haier Co., Qingdao, China.
2.2.1. Method for Acquisition of the Initial Spectrum of Walnut Kernels
Before the spectra were collected, the test samples were stored in the room where the instrument was located to ensure the consistency of the spectral acquisition conditions for all samples [15,16]. When collecting spectra, the instrument must be turned on and allowed to warm up for 60 min, and the walnut kernel spectrum was collected in the range of 10,000–4000 cm−1. The crushed walnut kernels were placed in a quartz sample cup (diameter 30 mm, height 5 mm, wall thickness 1 mm) and filled until parallel to the cup mouth, and the sample surface was then pressed to ensure it was level after filling. After scanning each sample three times, 540 spectra were obtained, and the spectra of replicates were averaged to obtain the final spectra of 180 samples. After each measurement, the sample cup was rinsed with tap water, then washed with distilled water, and finally wiped clean with alcohol for the spectral acquisition of the next sample.
2.2.2. Method for Determining the Fat Content of Walnut Kernels
The fat content of the walnut kernel samples was determined using the SAE-D6 active automatic fat analyzer. First, six 1 g samples of walnuts (accurate to 0.001 g) were weighed, wrapped in filter paper and placed in filter paper cartridges (with each sample measured three times, allowing two samples to be processed in one day), and 70 mL of petroleum ether (boiling point: 30–60 °C) was then poured into the aluminum cup for extraction. The leaching time (480 min) and drenching time (40 min) were set according to the fat meter’s operating procedure, and the program set to run automatically. After running the program, the aluminum cup was transferred into a 105 °C oven, dried for 2 h and then removed for cooling and weighing. The fat content was calculated as follows:
X1 indicates the fat content in the specimen (g); M1 indicates the quality of aluminum cup and walnut grease (g); M2 denotes the constant weight (g) of the empty aluminum cup; M0 represents the mass of the weighed walnut sample (g); and 100 indicates the conversion factor. The fat content in walnut kernels can be calculated using this formula, and it can be seen from Table 1 that there are stark differences in the maximum and minimum values of fat content across samples, demonstrating strong differentiation and representativeness.

Table 1.
Statistical analysis of physicochemical values of walnut kernel fat.
2.2.3. Spectral Preprocessing and Modeling Methods
The spectrometer used for sample measurement acquires information related not only to the components being analyzed but also various noise signals [17]. The sources of most of these noise signals are uncertain and may arise from environmental conditions (light, humidity, etc.), instrument operation, and other factors. These noise signals hinder the spectral analysis process and can introduce significant errors into the calibration model during construction, thereby affecting the prediction of the composition of the sample being measured [18], which in turn impacts the prediction results of subsequent models. Therefore, the main spectral pretreatment methods used to address noise in this study include multivariate scattering correction (MSC), standard normal variate (SNV), first derivative (FD), second derivative (SD), multivariate scattering correction (MSC) and first derivative (FD) combination algorithms [17]. Partial least squares (PLS), back propagation neural network, support vector regression (SVR) and other methods are mainly used in the quantitative analysis of spectra. BP neural network and SVR are currently the most widely used modeling methods in spectral quantitative analysis [19,20], and back propagation neural network and SVR are used to establish the mathematical models in our study. MATLAB R2017a software was utilized for code writing as well as for prediction, and the BP neural network was structured as a single hidden layer neural network of 129-7-1. Among them, the activation function of the hidden layer selects the trainlm function, the activation function of the output layer selects the tansig function, and the activation function of the output layer selects the logsig function. The parameters were set to a maximum iteration number of 100, an error threshold of 0.001, and a learning rate of 0.01. The kernel function of the SVR algorithm was chosen to be the RBF function, with a penalization factor c of 0.2 and a radial basis function g of 0.15. The key parameters of the CARS were as follows: fold (the number of cross-validated pairwise folds) was set to 5, num (the number of MC sampling times) was set to 100, and selectLV (the criterion for selecting the best Criteria for Variables) was set to 0.
2.2.4. Evaluation of Model Performance
The accuracy, precision, stability and ability to predict truth values of a model are the main aspects of assessing how well it works. Common criteria for model evaluation include determination coefficient (R2), root mean square error of calibration and residual prediction deviation (RPD). the RPD refers to the ratio of the standard deviation to the root mean square error, proving the predictive power of the model. In general, as a model’s prediction is considered to improve as its R2 value becomes larger and its RMSE value smaller [21]. Under ideal conditions, the coefficient of determination has a value of 1, and the root mean square error of prediction is 0. In this paper, the walnut kernel analytical model was evaluated based on coefficient of determination (R2), residual prediction deviation (RPD), root mean square error of calibration (RMSEC) and root mean square error of prediction (RMSEP). When R2 ≤ 0.5 and RPD ≤ 1.4, the model has poor predictive performance but can be used for qualitative prediction, and quantitative prediction is also possible; when 0.5 < R2 < 0.8 and 1.4 < RPD < 2.0, the model has good predictive performance, allowing for rough quantitative prediction; when R2 ≥ 0.8 and RPD ≥ 2.0, the model is effective for accurate quantitative prediction [22].The formulas for calculating R2, RMSE and RPD are as follows [23,24,25]:
2.2.5. Reject Abnormal Samples
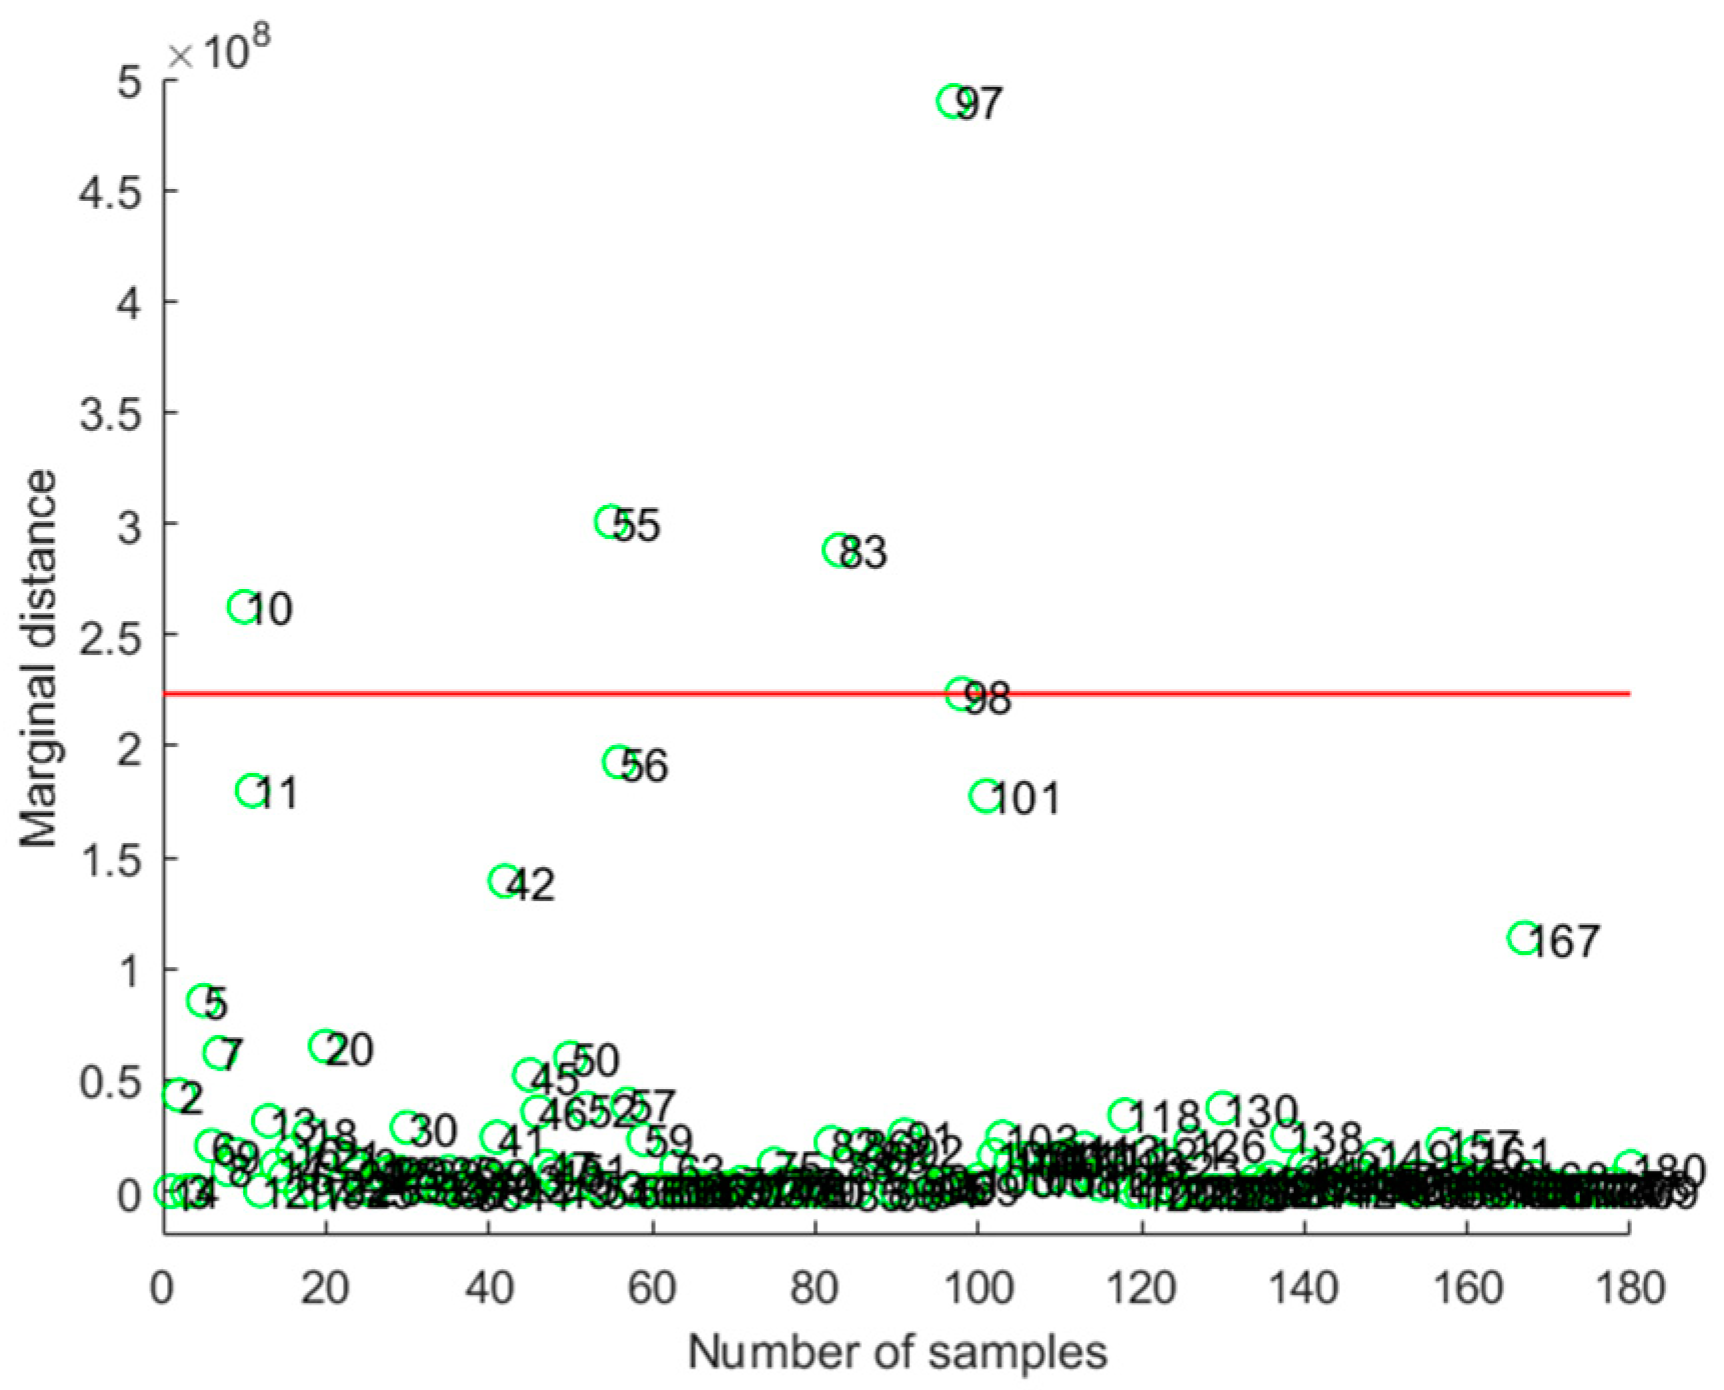
During this trial, the Mahalanobis distance method was used to eliminate 5 existing outliers. Moreover, the presence of natural variability (extreme values) in the same data type impacted the effectiveness of modeling, so data on the remaining 174 samples were included. First, each sample measurement was calculated to the center of the sample, and then the count, mean μ and standard deviation σ of the sample measurements were determined. Next, we judged the threshold M with μ + 3σ. Then, we calculated the mean value μ and standard deviation σ of the sample measurements, using μ + 3σ as the threshold value M. Finally, if the Mahalanobis distance of the measured sample was greater than the threshold M, the sample was considered to be abnormal and was rejected. If the measured value of the sample was greater than the threshold M, the sample was considered to be abnormal and was rejected. Figure 1 illustrates the process of removing outliers, with the red line indicating the threshold. Values greater than or equal to the threshold are classified as outliers, while those below the threshold are considered acceptable.
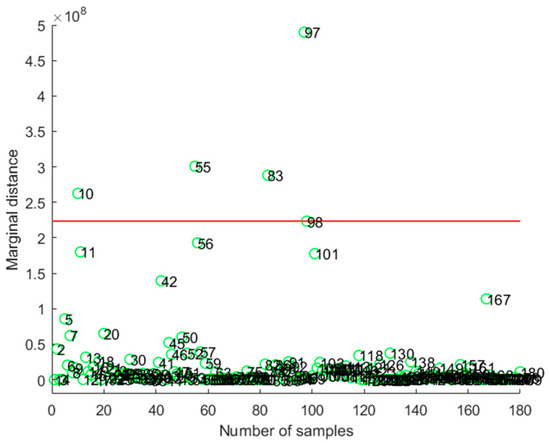
Figure 1.
Process of rejecting outliers. The green color represents the number of different samples and the red line represents the threshold line.
2.2.6. Sample Division
The methods for sample division include the random division (RS), Kennard–Stone (K-S) and SPXY methods. When using SPXY to divide samples, both the spectral information variables and the physical and chemical values of walnut samples are taken into account [26], resulting in a more uniform sample range distribution, which can improve the calculation accuracy of the model. In this study, the SPXY method was used to divide the samples into the correction set and the prediction set according to a ratio of 3:1, resulting in 42 samples in the prediction set.
3. Analysis of the Results
3.1. Near-Infrared Spectroscopy Analysis
The image below shows the initial near-infrared spectrum of 180 groups of walnut samples. Each line in the figure represents the shape of the original absorption spectra of different samples. The absorption peaks corresponding to fat are mainly found in the 1070–1440 nm (9345–6944 cm−1) and 1520–1680 nm (6578–5952 cm−1) ranges [27]. It can be seen from Figure 2 that the spectra basically show the same overall trend; however, due to differences in reflectivity, it is difficult to distinguish the relationship between the spectrum and the content of walnut components with the naked eye. The are three distinct absorption peaks observed at 5360 cm−1, 6155 cm−1 and 7721 cm−1. Although the initial absorption spectral shapes of different samples are basically the same for the different management levels, there are certain differences in the reflection intensity corresponding to each spectral line, which facilitates modeling.
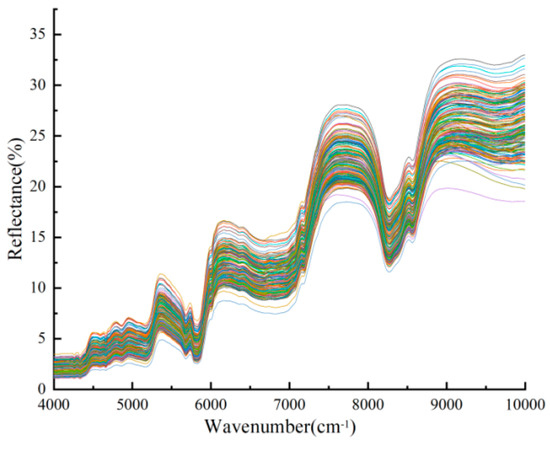
Figure 2.
Initial spectra of ‘Wen 185’ walnut kernel. Different lines represent the shapes of the original absorption spectra of different samples, with each sweep of the spectral information presenting a line.
3.2. Effects of Different Spectral Preprocessing Methods
Five pretreatment methods were used to process the spectra of 174 walnut samples, and the back propagation neural network fat content prediction model was established using the pretreated spectral data. The corresponding modeling results are shown in Table 2. In contrast to other pretreatment methods, the calibration set coefficient R2 values of the FD, SD and MSC + FD methods exceed 0.8, but the MSC + FD combination method has a poorer modeling effect than the SD and FD methods, as indicated by the smaller coefficient of determination for the correction and verification sets, and the larger RMSEC and RMSEP. The R2 of the correction and verification sets is larger for SD than for FD, and the RMSEP is smaller, indicating that the model performance is better.
Table 2.
Modeling results for different preprocessing methods.
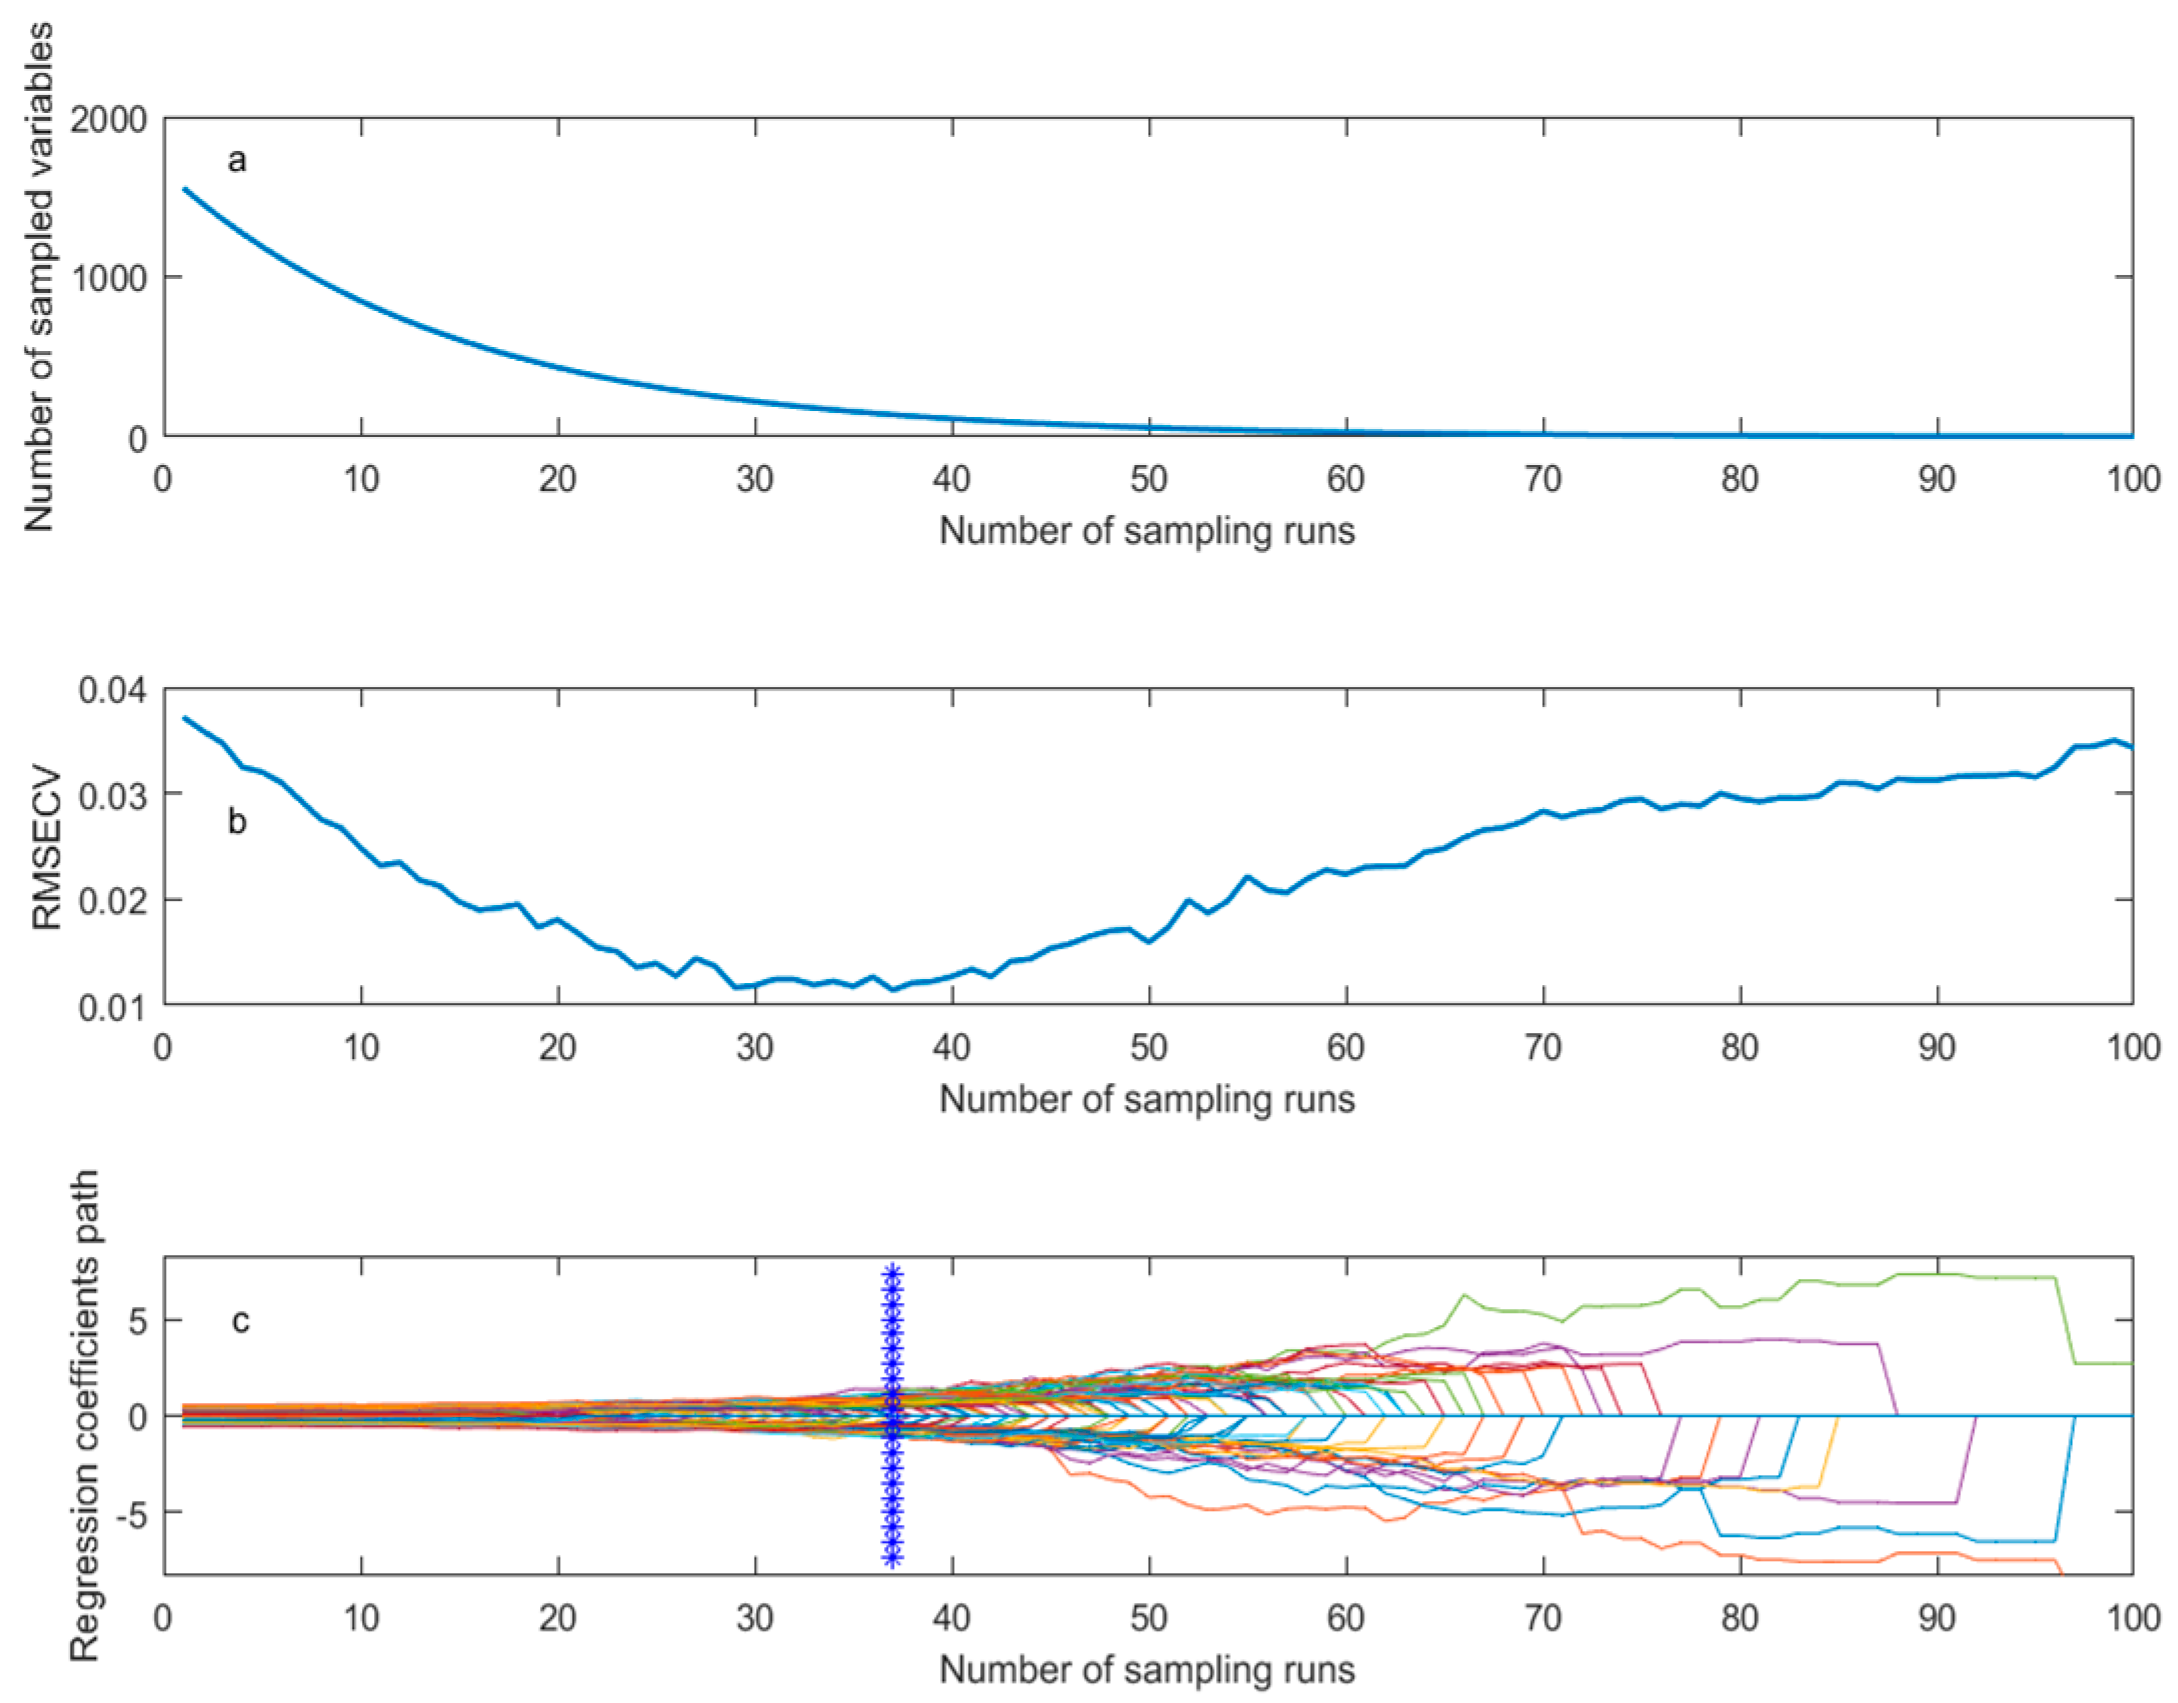
Filtering by Competitive Adaptive Reweighted Sampling (CARS) is a simple and effective way to quickly realize the optimal subset selection method [28]. Figure 3 shows the characteristic wavelength screening results for walnut kernel fat after applying the second derivative method. When performing variable filtering by CARS, the number of samples is set to 100. Figure 3a shows the trend of variable selection during band screening, and the number of variables decreases with the increase in the number of runs. Figure 3b shows the trend of RMSECV change obtained by cross-validation during the process of screening wavelength variables, and a decreasing RMSECV value indicates an increase in the effective information in the spectral variables. Conversely, an increase in RMSECV values indicates there is a decrease in the effective information in the spectral variables. RMSECV decreased when less than 38 samples were processed, and then began to increase, leaving 129 effective wavelength variables. Figure 3c shows the trend of regression coefficients for each wavelength variable as the number of runs increases, where “*” represents the minimum RMSECV at the corresponding location. Following the principle of the minimum RMSECV value, the subset of wavelength variables obtained at the 38th sampling is the optimal result. The number of characteristic wavelength variables screened at this point was 129, and the specific wave numbers are shown in Table 3.
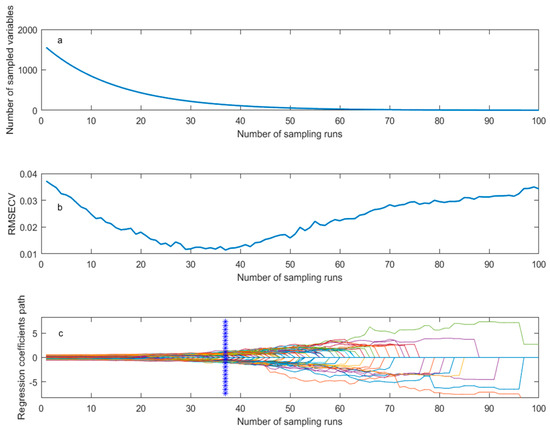
Figure 3.
CARS selecting feature bands (a): wavelength variation (b): cross−validation of root mean square error variation (c): change trend of variable regression coefficient.
Table 3.
Results of CARS characteristic wavelength screening based on SD combinations.
3.3. Model Validation
Verification is required before a model is put into use, and the 42 samples of the validation sample set are used to test the established calibration model and evaluate the model stability and accuracy. Figure 4 and Figure 5 show the verification results for the back propagation neural network and SVR model, respectively. The verification results demonstrate that the model prediction results share a similar undulating trend to the real values, and the fat content in walnut kernels can be accurately predicted. Regarding the results for the prediction of fat, the validation set coefficient R2 for the back propagation neural network was 0.89, with a root mean square error of 1.58 and RPD value of 2.86, and the validation set coefficient R2 for the SVR model was 0.83, with a root mean square error of 1.70 and RPD value of 1.27. Therefore, it is concluded that both modeling methods are good predictors of walnut kernel fat content.
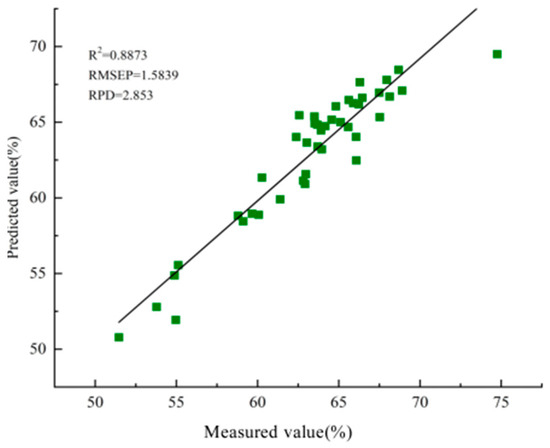
Figure 4.
Back propagation neural network model verification results. The green square mean 42 samples were validated, and the different colors were used in order to better distinguish the validation results of the two approaches.
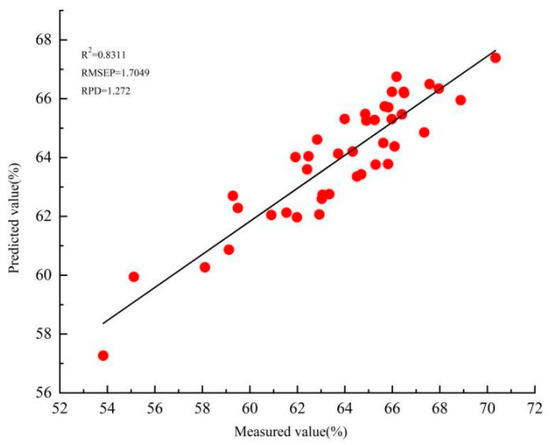
Figure 5.
SVR model verification results. The red dots mean 42 samples for the validation of the SVR model.
4. Discussion
In this study, the fat content in ‘Wen 185’ walnut samples from southern Xinjiang was predicted based on NIR. The results indicate that there is little difference between NIR and chemical detection methods for fat content, demonstrating that NIR can be utilized for the rapid detection of walnut quality, which is consistent with the conclusions of Ma Wenqiang et al. [12], Tang Wentao et al. [29] and Yi J et al. [10]. During spectral scanning, factors such as sample status, the number of repeats, light scattering and instrument response can cause interference, leading to baseline drift and the appearance of noise in the walnut kernel spectra [30]. To effectively reduce the influence of these factors, it is necessary to improve the signal-to-noise ratio of the spectrum [31] and thereby establish a more reliable model. Preprocessing is particularly critical in the modeling process for laying a solid foundation for the subsequent selection of characteristic bands and model construction. From our experimental results comparing the effects of five different spectral pretreatments, it can be seen that there is a better spectral modeling effect after SD treatment. This is inconsistent with the results of Zhang Hailiang et al. [32] and Song Xuejian et al. [33], possibly due to differences in the modeling methods utilized. The former used principal component regression (PCR) and partial least squares (PLS), whereas the latter used partial least squares (PLS), and in our study, the BP neural network and SVR methods were used to establish a predictive model. Feature extraction is a crucial step in the modeling process, and feature band filtering can be used to reduce the number of input parameters, shorten model operation time and partially eliminate redundant interference information to improve the accuracy of model prediction. In this paper, there were 1557 near-infrared spectral data points but only 174 samples, leading to increased collinearity in the modeling process. In addition, the near-infrared spectrum contained substantial amounts of redundant information, resulting in unsatisfactory modeling outcomes [34]. Thus, the CARS method was used to extract the characteristic wavelengths, and 129 effective wavelength variables for fat were finally extracted from 1557 data points. The back propagation neural network quantitative model and SVR model were established from the extracted 129 feature wavelengths, and the coefficient of determination R2 of the verification set of both models exceeded 0.83, which is higher than that of the model established in the full spectrum. Wang Cuixiu et al. [35] used the CARS method to screen for characteristic bands, greatly reducing the number of wavelength variables from 1981 to less than 100, with a variable compression ratio of greater than 94.95%. Duan Lingyao et al. [36] used the DWT method to process spectral data for the rapid detection of proteins, fats and polysaccharides in privet based on NIR, compressing the initial 1050 spectral data points to 133, which greatly improved model performance. Zhu Jinyan et al. [37] used the synergy interval partial least squares (SiPLS) algorithm to screen for characteristic bands, namely, the wavelengths of soluble solids, vitamin C and anthocyanins from 1751 wavelength variables to 701, 351 and 701, respectively, and the SiPLS-ELM model demonstrated more accuracy than the model established in the full spectrum.
A back propagation neural network and SVR prediction models for walnut kernel fat content were established on the basis of spectral preprocessing and characteristic band screening, and the coefficient of determination of both models exceeded 0.83. However, this is slightly lower than the values in Li Lu et al. [38] and Wang Cuixiu et al. [35], and our inferior results may be attributed to the use of fewer sample varieties in this study. The coefficient of determination for the fat content prediction model established using the SVR method is lower than that of Ma Wenqiang et al. [12] because different numbers of wavelength variables were screened, with the former screening out six wavelength variables, and fewer feature bands were extracted. In our study, a higher number of 129 wavelength variables were extracted, resulting in lower model performance. Another possible reason is the different number of near-infrared spectrum scans collected by the two, 64 times vs. 32 in our study. Lu Hui et al. [39] used 126 rice samples to establish an NIR analysis model for fat content, obtaining a validation set coefficient of 0.83, which is slightly lower than the value of 0.89 for the BP neural network prediction model in this study; this may have led to the low model performance they observed, owing to the smaller number of samples. Although the NIR prediction model for fat content proposed in this study can meet the requirements for application, a limited number of samples were collected; thus, the representativeness of samples needs to be strengthened and further improved. In follow-up studies, our team should collect a large number of samples to enhance the sample representativeness and thereby establish a more reliable near-infrared spectroscopy model.
5. Summary
In this paper, ‘Wen 185’ walnut in Nanjiang was taken as the research object, and a BP neural network prediction model and SVR prediction model of walnut kernel fat content was established following five data pretreatment methods. We verified that the SD pretreatment method was the most suitable for the pretreatment of walnut kernel near-infrared spectrum information. After selecting the characteristic wavelengths using the CARS algorithm, 129 wavelength variables of fat were extracted, greatly reducing the computational complexity and improving model accuracy. Both models showed better prediction of fat content of ‘Wen 185’ walnuts in southern Xinjiang.
Author Contributions
Conceptualization, Y.D. and R.Z.; methodology, J.Z.; software, Y.W. and Z.B.; validation, H.Z., Y.D. and R.Z.; formal analysis, Z.Z.; investigation, S.G. and Y.W.; resources, R.Z. and J.Z.; data curation, S.G.; writing—original draft preparation, L.L.; writing—review and editing, Y.W., Y.D. and R.Z.; visualization, C.F. and S.G.; supervision, S.G. and R.Z.; project administration, S.G. and R.Z.; funding acquisition, R.Z. All authors have read and agreed to the published version of the manuscript.
Funding
This study was supported by the Research Project on Modeling Hyperspectral Monitoring of Nitrogen Content in Walnut Leaves (No.TDZKSS202404); the Walnut Industry Chain Innovation Team—“Three Stations and Chain Harmony” Walnut Industry Chain Theory and Practice of Industry-University-Research-Government Development Project (No.TDZKCX202101); the Demonstration and Popularization Project of Walnut Classification Selection and Highly Efficient Cultivation Technology with Big Dataization (No.TDZKZD202403); the South Xinjiang Horticultural Research Center Scientiffc Research Condition Construction Project (TDZKKY202204); Huazhong Agricultural University—Tarim University South Xinjiang Horticultural Research Center Innovation Team Project, laying a solid foundation for the research conducted.
Data Availability Statement
The data supporting this study’s findings are available on request from the corresponding author. The data are not publicly available due to privacy and ethical restrictions.
Conflicts of Interest
The authors declare no conflicts of interest.
References
- Liu, W.; Li, Y.; Tomasetto, F.; Yan, W.; Tan, Z.; Liu, J.; Jiang, J. Non-destructive Measurements of Toona sinensis Chlorophyll and Nitrogen Content Under Drought Stress Using Near Infrared Spectroscopy. Front. Plant Sci. 2022, 12, 809–828. [Google Scholar] [CrossRef] [PubMed]
- Hu, D.Y.; Gao, J.; Huang, L.P.; Yang, L.P.; Wang, J.Y. Current Situation and Development Idea of Walnut Industry in Four Prefectures of Southern Xinjiang. North. Hortic. 2021, 13, 148–154. [Google Scholar]
- Nogales-Bueno, J.; Baca-Bocanegra, B.; Hernández-Hierro, J.M.; Garcia, R.; Barroso, J.M.; Heredia, F.J.; Rato, A.E. Assessment of Total Fat and Fatty Acids in Walnuts Using Near-Infrared Hyperspectral Imaging. Front. Plant Sci. 2021, 12, 729880. [Google Scholar] [CrossRef] [PubMed]
- Arndt, M.; Drees, A.; Ahlers, C.; Fischer, M. Determination of the Geographical Origin of Walnuts (Juglans regia L.) Using Near-Infrared Spectroscopy and Chemometrics. Foods 2020, 9, 1860. [Google Scholar] [CrossRef]
- Kusumiyati, J.S.H.; Sutari, W.; Mubarok, S.; Kurniasari, I. Non-destructive detection of two cucumber cultivars fruit quality using NIR Spectroscopy. Earth Environ. Sci. 2020, 583, 012002. [Google Scholar] [CrossRef]
- Tian, Z.; Tan, Z.; Li, Y.; Yang, Z. Rapid monitoring of flavonoid content in sweet tea (Lithocarpus litseifolius (Hance) Chun) leaves using NIR spectroscopy. Plant Methods 2022, 18, 44. [Google Scholar] [CrossRef]
- Nogales-Bueno, J.; Feliz, L.; Baca-Bocanegra, B.; Hernández-Hierro, J.M.; Heredia, F.J.; Barroso, J.M.; Rato, A.E. Comparative study on the use of three different near infrared spectroscopy recording methodologies for varietal discrimination of walnuts. Talanta 2020, 206, 120189. [Google Scholar] [CrossRef]
- Zareef, M.; Arslan, M.; Hassan, M.M.; Ali, S.; Qing, O.Y.; Li, H.; Wu, X.; Hashim, M.M.; Javaria, S.; Chen, Q.S. Application of benchtop NIR spectroscopy coupled with multivariate analysis for rapid prediction of antioxidant properties of walnut (Juglans regia). Food Chem. 2021, 359, 129928. [Google Scholar] [CrossRef]
- Zeng, P.; Li, X.; Wu, X.; Diao, Y.; Liu, Y.; Liu, P. Rapid Identification of Wild Gentiana Genus in Different Geographical Locations Based on FT-IR and an Improved Neural Network Structure Double-Net. Molecules 2022, 27, 5979. [Google Scholar] [CrossRef]
- Yi, J.; Sun, Y.; Zhu, Z.; Liu, N.; Lu, J. Near-infrared reflectance spectroscopy for the prediction of chemical composition in walnut kernel. Int. J. Food Prop. 2017, 20, 1633–1642. [Google Scholar] [CrossRef]
- Ma, W.Q.; Zhang, M.; Li, Z.X.; Yang, L.L. Detection and analysis of walnut kernel protein content based on near infrared spectroscopy. Trans. Chin. Soc. Agric. Mach. 2017, 48, 407–411. [Google Scholar]
- Ma, W.Q.; Zhang, M.; Li, Y.; Yang, L.L.; Zhu, Z.J.; Cui, K.B. Non-destructive detection for fat content of walnut kernels by near infrared spectroscopy. Trans. Chin. Soc. Agric. Mach. 2019, 50, 374–379. [Google Scholar]
- Li, C.J.; Zhang, S.; Sun, H.; Chen, C.; Xing, S. Study on a two-dimensional correlation visible–Near infrared spectroscopy kinetic model for the moisture content of fresh walnuts stored at room temperature. J. Food Process Eng. 2020, 43, 13551. [Google Scholar] [CrossRef]
- Wang, Q.P.; Li, Q.W.; Cui, B.S.; Su, J.H. Study on the prediction of oils of carya cathayensis sargent using near infrared reflectance spectroscopy. Southwest China J. Agric. Sci. 2009, 22, 873–875. [Google Scholar]
- Zhang, P.; Li, J.K.; Meng, X.J.; Zang, P.; Feng, X.Y.; Wang, B.G. Research on nondestructive measurement of soluble tannin content of astringent persimmon using visible and near infrared diffuse reflection spectroscopy. Spectrosc. Spectr. Anal. 2011, 31, 951–954. [Google Scholar]
- Li, Y.; Wei, Y.M.; Wang, F. Affecting factors on the accuracy of near-infrared spectroscopy analysis. J. Nucl. Agric. Sci. 2005, 19, 236–240. [Google Scholar]
- Ma, H.; Zhang, K.; Ji, J.Y.; Jin, X.; Zhao, K.X. Research on quantitative detection technology of freshness of Agaricus bisporus based on spectroscopic technology. Spectrosc. Spectr. Anal. 2021, 41, 3740–3746. [Google Scholar]
- Feng, Y.C.; Zhang, Q.; Hu, C.Q. Study on the selection of parameters for the evaluating drug NIR universal quantitative models. Spectrosc. Spectr. Anal. 2016, 36, 2447–2454. [Google Scholar]
- González-Casado, S.; López-Gámez, G.; Martín-Belloso, O.; Elez-Martínez, P.; Soliva-Fortuny, R. Pulsed light of near-infrared and visible light wavelengths induces the accumulation of carotenoids in tomato fruits during post-treatment time. Food Sci. 2022, 87, 3913–3924. [Google Scholar] [CrossRef]
- Kröncke, N.; Neumeister, M.; Benning, R. Near-Infrared Reflectance Spectroscopy for Quantitative Analysis of Fat and Fatty Acid Content in Living Tenebrio molitor Larvae to Detect the Influence of Substrate on Larval Composition. Insects 2023, 14, 114. [Google Scholar] [CrossRef]
- Ji, W.J.; Li, X.; Li, C.X. Using different data mining algorithms to predict soil organic matter based on visible-near infrared spectroscopy. Spectrosc. Spectr. Anal. 2012, 32, 2393–2398. [Google Scholar]
- Ma, S.; Tang, X.; Xu, Y. Nondestructive determination of pH value in beef using visible/near-infrared spectroscopy and genetic algorithm. Trans. Chin. Soc. Agric. Eng. 2012, 28, 263–268. [Google Scholar]
- Basile, T.; Marsico, A.D.; Perniola, R. Use of Artificial Neural Networks and NIR Spectroscopy for Non-Destructive Grape Texture Prediction. Foods 2022, 11, 281. [Google Scholar] [CrossRef] [PubMed]
- Sun, J.J. Research on Construction and Optimization of Wheat Grain Protein Content Model Based on Near Infrared Spectroscopy Technology. Ph.D. Thesis, Shanxi Agricultural University, Jinzhong, China, 2021. [Google Scholar]
- Wang, Y.Q.; Liu, G.M.; Hu, L.P.; Zhao, X.Z.; Zhang, D.S.; He, H.J. Prediction of Anthocyanidins Content in Purple Chinese Cabbage Based on Visible/Near Infrared Spectroscopy. Foods 2023, 12, 1922. [Google Scholar] [CrossRef]
- Zhang, J. Research on strawberry brix detection by near-infrared spectroscopy based on SPXY-WT-CARS algorithm. Food Ferment. Sci. Andtechnol. 2020, 56, 136–139+142. [Google Scholar]
- Zhang, Z.W.; Wen, Z.Y.; Zeng, T.L.; Wei, K.L.; Liang, Y.Q. Miniature near-infrared fiber optic spectrometer for quantitative protein-fat detection in milk powder. Spectrosc. Spectr. Anal. 2013, 33, 1796–1800. [Google Scholar]
- Li, P.; Ma, J.; Zhong, N. Fourier transform near-infrared spectroscopy coupled with variable selection methods for fast determination of salmon fillets storage time. J. Mol. Struct. 2022, 1264, 133–223. [Google Scholar] [CrossRef]
- Tang, W.T.; Xu, J.F.; Hu, D.; Zhao, C. Determination of protein and fat content in pecan based on near infrared spectroscopy. Cereals Oils 2022, 35, 158–162. [Google Scholar]
- Rinnan, Å.; Van Den Berg, F.; Engelsen, S.B. Review of the most common pre-processing techniques for near-infrared spectra. TrAC Trends Anal. Chem. 2009, 28, 1201–1222. [Google Scholar] [CrossRef]
- Mishra, P.; Rutledge, D.N.; Roger, J.M. Chemometric pre-processing can negatively affect the performance of near-infrared spectroscopy models for fruit quality prediction. Talanta 2021, 229, 122303. [Google Scholar] [CrossRef]
- Zhang, H.L.; Sun, X.D.; Hao, Y.; Liu, Y.D. Determination of Soluble Solids and Total Acidity in Gannan Navel Orange by NearInfrared Diffuse Reflection Spectroscopy. Food Sci. 2011, 32, 151–154. [Google Scholar]
- Song, X.J.; Wang, H.J.; Zhang, D.J.; Yu, J.C.; Zhou, Y.; Yu, G. Study on Quality Detection of Fresh Cut Hami Melon by Near Infrared Spectroscopy. Farm. Prod. Process. 2018, 10, 53–54+79. [Google Scholar]
- Li, L.L.; Jin, H.L.; Cui, B.B.; Wang, X.J. Rapid determination of soybean protein and crude fat content by near-infrared transmittance spectroscopy. Cereals Oils 2014, 27, 57–60. [Google Scholar]
- Wang, C.X.; Cao, J.F.; Gu, Z.F.; Xu, M.X.; Wu, Q.Y. Rapid Nondestructive Test of Soybean Protein and Fat by Near Infrared Spectroscopy Combined with Different Model Methods. Soybean Sci. 2019, 38, 968–976. [Google Scholar]
- Duan, L.Y.; Hou, C.Y.; Li, Y.L.; Gao, H.L.; Lou, H.H.; Hou, Z.Y. Study on rapid determination of protein, fat and polysaccharide in fruit of Ligustrum lucidum. J. Henan Inst. Sci. Technol. (Nat. Sci. Ed.) 2018, 46, 54–58. [Google Scholar]
- Zhu, J.Y.; Zhu, Y.J.; Feng, G.H.; Zeng, M.F.; Liu, S.Q. Establishment of quantitative models for blueberry storage quality based on near infrared spectroscopy combined with extreme learning machine. Food Ferment. Ind. 2022, 48, 270–276. [Google Scholar]
- Li, L.; Huan, H.Y.; Zhao, S.; Hu, Y.L.; Yang, S.X. NIR spectral detection model of protein, fat, total sugar and moisture in rice. J. Chin. Cereals Oils Assoc. 2017, 32, 121–126. [Google Scholar]
- Lu, H.; Peng, B.Q.; Feng, X.Y.; Shen, X.F. Near-infrared spectroscopy of straight-chain starch, protein, fat and moisture content of rice Detection model optimization. China Rice 2020, 26, 55–59+63. [Google Scholar]


Disclaimer/Publisher’s Note: The statements, opinions and data contained in all publications are solely those of the individual author(s) and contributor(s) and not of MDPI and/or the editor(s). MDPI and/or the editor(s) disclaim responsibility for any injury to people or property resulting from any ideas, methods, instructions or products referred to in the content. |
© 2024 by the authors. Licensee MDPI, Basel, Switzerland. This article is an open access article distributed under the terms and conditions of the Creative Commons Attribution (CC BY) license (https://creativecommons.org/licenses/by/4.0/).