Abstract
In Brazil, the fruit sector, including exotic fruits such as lychee, has great potential. In 2020, it ranked third in the world, with a 5.4% share. The objective of this research was to identify, analyze, and describe the lychee value chain in Brazil in order to compare it with that of the main producers in the world. Data of lychee production and the multiple linear regression technique were used to identify the competitiveness factor of the main lychee-producing countries, India, China, and Vietnam. The lychee value chain in Brazil was developed from secondary sources in order to compare it with these producing countries. The results show that the main competitiveness factor for China is the price; for India, the quantity produced; and for Brazil, the planted area. In India, most of the lychee produced is for domestic consumption; in China, it is for export; and Vietnam exports its production to China. Given these characteristics of the global lychee market, a production strategy to insert Brazil into this market should consider increases of 20% in the planted area and 35% in production every five years, over a period of 30 years, to make Brazil the sixth largest lychee producer in the world.
1. Introduction
Originating in China, the world production of lychee in 2018 was estimated at around 3.5 million tons, of which approximately 80% was produced in China (2.8 million tons), followed by India, with 670 thousand tons, and Vietnam, with 380 thousand tons [1].
The Agricultural Census—IBGE [2] was the first to introduce information on lychee (Litchi chinensis) in Brazil as an agricultural product considered an exotic fruit, and presented data indicating that, in 2017, the harvested area comprised 1781 hectares, involving 646 establishments, with 429 thousand trees and with the state of São Paulo being the largest producer in Brazil. Lychee cultivation in Brazil basically happens in orchards of tree plants, with a low density of plants per hectare. The research gap that was addressed in this study was the lack of comparisons of production and value chains of lychee in Brazil with those of other large producing countries. In turn, the novelty and contribution of this research work is to present the cultivation of this exotic fruit, which can be an opportunity for rural producers to diversify crops, especially for small producers in regions with temperate climates, climates that are cold and dry in winter, and climates that are hot and humid the rest of the year, not requiring specialization from the producer beyond management, similarly to other tree fruit crops [3]. As the production of lychee cultivation in Brazil is for the fresh fruit consumption market, there is room for growth in production, as well as for the industrialization of lychee and technologies that allow the fruit to be displayed for longer periods on the shelf.
Almost 50 years after the beginning of the sale of lychees in the domestic market, the harvest area in 2017 was still not representative, with 1781 hectares and a production of 5103 tons, with an average productivity of 2865.2 kg/ha−1 [2]. In 2021, the average price of lychee sold in Brazilian CEASAs [4] was BRL 15.71/kg, obtaining revenues of BRL 45,012.29 per hectare, which is 165.6% higher than the revenue from a soybean harvest followed by a corn crop, according to data on the average productivity CONAB [4] and the average prices of these grains CEPEA [5] for the 2021/2022 harvest.
In discussing the importance of this research, we can learn from the article by Di Vita et al. [6] that by looking at what activities could create the most value to the future competitiveness of the Italian aromatic sector, we can understand that farmers are apprehensive of imports but did not mention factors or technology of production that can be used in increasing the competitiveness of this sector. Litchi farmers in Brazil are still not aware of the challenges and targets in production that they will have to achieve in order to improve market positioning not only at the national but also at the international level.
The greater economic attractiveness of lychee production, represented by the higher revenue per hectare of lychee compared to other crops, generates the need to characterize and analyze the lychee value chain in Brazil and seek strategies to increase the competitiveness of this crop. As it is an exotic and seasonal fruit in Brazil, lychee is only sold in the period from November to January, generating problems of high prices for consumers, thus hindering its popularization and consumption in Brazil [7]. The increase in the planted area together with productivity, although it induces a decrease in prices, also favors increases in the consumption of the product that in the long term converges to a situation of equilibrium of supply and demand. This new market equilibrium at a lower price than the previous situation, in the case of lychee, which still has a high contribution margin even if it reduces profits, allows lychee producers to remain in the market [3].
This research, in addition to analyzing the global lychee market, carried out a comparative evaluation of the lychee production chain in Brazil, with a focus on the production yield of the three largest lychee producers in the world (China, India, and Vietnam) in order to increase the production and competitiveness of lychee in Brazil. Oberoi and Dinesh [8], studying the fruit sector in India, indicated available technologies and innovations that must be implanted in each stage of the value chain to increase the percentage of fruits that are sold by organized supply chain management. This could be the case for the Brazilian litchi value chain, especially when targeting planted areas and yield increases, which form the main topics of this research.
China is the world’s largest producer of lychee and uses more than 400 varieties in its production. The country shows progress in production methods, since production increased from 1.7 million tons in 2007 to 2.05 million tons in 2017, with a decrease in the cultivation area from 559.3 thousand hectares to 530 thousand hectares [9]. In addition, in the year 2021, China exported 97.7 million tons with a value of USD 126.2 million, accounting for 3.01% of the world’s export, with Japan being the largest consumer (17.1%). The price fluctuation is notable in the country, as in the same period, a price of USD 3.55/kg was recorded in Huanggang province and USD 1.62 was recorded in Jiaxing [10].
India, the second largest producer, in 2018, had a productivity of 7.4 kg/ha, showing that the country is also developing in production, since, in 2002, the productivity was 6.10 kg/ha [1]. In the year 2021, India exported 28.9 million tons (USD 40.7 million), which is 0.97% of the world’s export, with Saudi Arabia being the largest consumer (26.8%) [10]. The largest producer is the state of Bihar, with a productivity of 8 ton/ha and USD 0.49/kg in 2018, followed by Punjab, with a productivity of 15 ton/ha and USD 1.03/kg [10,11].
Vietnam, the third largest producer of the fruit, reached a productivity of 6.5 kg/ha [1]. In the year 2021, Vietnam exported 54.34 million tons, approximately USD 119.7 million, which accounted for 2.86% of world exports [10]. Tackling several difficulties such as yield, price, demand, being highly sensitive to weather conditions, and global uncertainty factors, in the dragon fruit plantations of Vietnam, Nguyen et al. [12] proposed an optimization model that, considering the timing of cultivating and harvesting decisions, would improve the efficiency of the supply chain of this fruit. Even though in this paper, we are not focusing on describing the internal or external factors affecting litchi production in Brazil, by looking at the performance of the leading countries in the production and marketing of lychee, we calculated the planted area and the yield that should be achieved in Brazilian lychee to have a more representative sector at a national and global level.
As for Brazil, one of the obstacles to lychee production is the lack of genetic variability, since 99% of the planted area is of the “Bengal” cultivar, and the high prices, since the harvest and supply of the fruit are concentrated in the months of November to January [7]. São Paulo appears as the largest producer in the country, accounting for 55% of the amount produced (2790 tons) and 58% of the harvested area (1037 hectares) and having a production value of BRL 15.22 million and a price of BRL 22.68/kg [13]. Minas Gerais appears as the second largest producer, with 27% of the national production (1354 tons) and 19% of the planted area. In Belo Horizonte, the price per kilogram was BRL 15.00 [4]. Paraná, the third largest producer, produced 14% of the Brazilian lychee in 16% of the planted area, with a record of BRL 10/kg in Curitiba in December 2021 [14].
2. Materials and Methods
The method used to carry out the research was a bibliographic survey of historical data from a period of 30 years (1993–2022), with information on the planted area, production, yield, price, and gross production value of three of the four countries studied namely China, India, and Brazil. The data were analyzed using the statistical technique of multiple linear regression, which describes the relationship between the variables and establishes comparisons in order to understand a phenomenon or a process. This makes predictions of variable values from the analysis of the behavior of other variables and replaces the measurement of one variable based on the observation of the values of another variable. This technique has as its method the construction of an equation, generating a first-order mathematical model, expressed by the following equation:
where β0 and β1 are unknown parameters and ϵ is the random error [15].
Y = β0 + β1X + ϵ
Using the R-4.3.0 software, 15 multiple linear regressions were performed to generate a mathematical model that relates a dependent variable and independent variables (Table 1) in order to make projections of the scenario of lychee production in Brazil, China, and India.

Table 1.
Description of the variables used in the linear regression.
In the bibliographic survey carried out in the research, some data on the planted area and production in China, India, and Brazil for the 30-year period studied were not found. In this way, the missing data were projected using the technique of scenario analysis which, according to Oliveira [18], is the explanation of the future from the analysis of trends and the evolution and sequence of events that occurred in the past; that is, in this research, for the elaboration of the missing data, the behavior of the previous data served as the basis for the projection of future data.
In the case of production, due to the scarcity of information, not enough data were found for Vietnam, so no regressions were performed for the country. The lychee price values in China and India for some years of the period under analysis that were not found were calculated using the multiple imputation method suggested by Oliveira et al. [19]. For the calculation, the fact that the price of lychee in China is 20% and in India 25% lower than the price of lychee in Brazil was also used [15]. These percentages were defined by analyzing the behavior of lychee supply in these countries and considering that a greater supply of product that can maintain the constant demand leads to a decrease in product prices [20]. To stipulate the strategy for the development of lychee production in Brazil, one of the methods used was the study of the lychee value chain of the three largest world producers, namely China, India, and Vietnam, and of Brazil. According to Porter [21], the value chain is a set of activities developed throughout a production process, which spans from processes before production to the way the product reaches the final consumer. The organization and strengthening of the links in the value chain add value to the product and generate a competitive advantage for the company. The study of the lychee value chain in the three countries contributed to the elaboration of a projection for the future of lychee production in Brazil.
3. Results and Discussion
3.1. Analysis of Lychee Production in Brazil and in the Main Producing Countries
The planted area of lychee in India, in the year 2022, was approximately 101,500 hectares, which represents 17.7% of the planted area in China, which was 573,000 ha. Brazil’s area, 1781 ha, represents only 1.7% of the area in India and 0.3% in China. Compared to the world’s largest producers, Brazil has the lowest values related to all the variables presented in Table 2, with the exception of price, which is higher in this country.
Table 2.
Descriptive statistics of the variables area, production, yield, price, and gross value of lychee.
The world’s largest producer produced approximately three million tons in the year 2022, while India produced 776,480 tons, and even though it is the second largest producer of lychee in the world, its production accounts for only 25% of China’s production [10]. Meanwhile, Brazil’s production, which was 5111 tons [2], represents 0.17% of China’s production and 0.66% of India’s. Even though India produces using smaller areas than those used in China, its productivity is higher, being 7.65 t/ha in 2022, while China’s was 5.27 t/ha and Brazil’s was 2.87 t/ha, showing that its production methods are more efficient.
Regarding the price of lychee in Brazil, 1994 has the highest value recorded, at USD 11.62, while the lowest value was USD 1.43 in 2004. The change in price does not occur in a linear way; there are always oscillations, showing that the lychee market in Brazil is unstable, with price differences that reach up to 70% in the last 30 years.
China’s average production is 590 times and India’s is 157 times higher than Brazil’s, showing that Brazil does not present itself as a threat to the lychee markets of these countries. India is the country with the highest yield (ton/ha); the minimum value of 4.95 t/ha was recorded in the country in 1997, a value that China only approached in 2020, with 4.70 t/ha, while Brazil still has a maximum value of 2.87 t/ha.
Regarding multiple linear regression, five regressions were performed with each variable studied (planted area, production, yield, price, and gross value) as the dependent variable in order to obtain the model that presents the highest degree of significance for each country. The parameter “p-value” is used to determine the best model, and the results of the regressions are shown in Table 3.
Table 3.
Coefficients and significance (p-value) of the multiple linear regression for lychee production in China, India, and Brazil.
The regression model that presented the most significant variables for China is the one that uses price as a dependent variable. For this parameter, the “p-value” data for each independent variable is significant and is above the permissible error of 5%. In addition, observing the data of “Coefficient value” in Table 3, the negative sign for production is predicted since price and production are inversely proportional, meaning that there is a tendency for the increase in production to generate a decrease in prices.
The yield and the gross value of production are presented with a positive sign in Table 3, meaning that they are directly proportional to the dependent variable used in the model, which is also expected, because the increase in yield, often generated by investments in high technology, generates an increase in production prices, which will consequently cause an increase in the gross value. Regarding the planted area, which is also positive, its proportionality relationship with the price variable can be explained by the fact that producers associate the increase in profit from the previous harvest with the increase in the planted area; that is, if the previous year’s harvest was profitable, the producer will want to increase the area to produce more and have even more profit.
Other indicators corroborate the model, such as the Kolmogorov–Smirnov test, which presents a value lower than 0.22 and, therefore, proves that the model has a normal distribution and adjusted value, which is close to one, as shown in Table 4.
Table 4.
The behavior of the variables of the lychee production model in China, with price as the dependent variable.
For India, the model that presented the most significant variables is the one that uses production as the dependent variable. The values of the “p-value” of the independent variables are significant and are above the admissible error, as well as the Kolmogorov–Smirnov test, which has a value of 0.1933, as shown in Table 5, and the adjusted value is very close to one.
Table 5.
The behavior of the variables of the lychee production model in India, with production as the dependent variable.
For the data found in the “Value” column, the only one that presents an inverse proportionality relationship is the price, confirming that high production usually generates low prices. Regarding the planted area, the same phenomenon mentioned above for China, the fact that the increase in profits from the previous harvest generates an increase in the planted area, which consequently generates an increase in production, also occurs for India, explaining the directly proportional relationship between the two variables. This relationship also explains the positive sign that appears for yield since the increase in yield increases production. Finally, it is expected that the increase in production will generate an increase in gross value, considering that it is obtained from the multiplication of production by price.
For Brazil, using the planted area as a dependent variable is the model that presented the highest degree of significance. All independent variables are significant and have an error above the admissible value for the “p-value”. The value of this is close to one, and the Kolmogorov–Smirnov normality test has a result of 0.1737, as shown in Table 6, which is lower than 0.22. In the case of Brazil, the variable with a negative sign in the “Value” table is the gross value, indicating that, as the country’s planted area grows, the gross value of production decreases, which may be a hypothesis that justifies the low rates of the production and sale of lychee in the country.
Table 6.
The behavior of the variables of the lychee production model in Brazil, with the planted area as the dependent variable.
The model also indicated that, in Brazil, the increase in production yield is linked to the increase in the planted area, just as the increase in the planted area is directly related to the increase in production.
The price appears as a directly proportional variable, indicating that the increase in the planted area follows the increase in the prices of the fruit in the country, which is unusual, considering that the increase in the planted area is expected to accompany the increase in production and the consequent decrease in prices.
3.2. Descriptive Analysis of the Lychee Value Chain in China, India, Vietnam, and Brazil
After identifying and analyzing the model that represents the situation of each of the four countries, the dependent variable of each model is the determining factor of competitiveness in that country. In the case of China, the determining factor that is potentially responsible for its good position in world production is the price; for India, the production; and for Brazil, the planted area. The analysis of these factors, together with the analysis of the production value chain, allows us to establish scenarios to increase Brazilian competitiveness in lychee production.
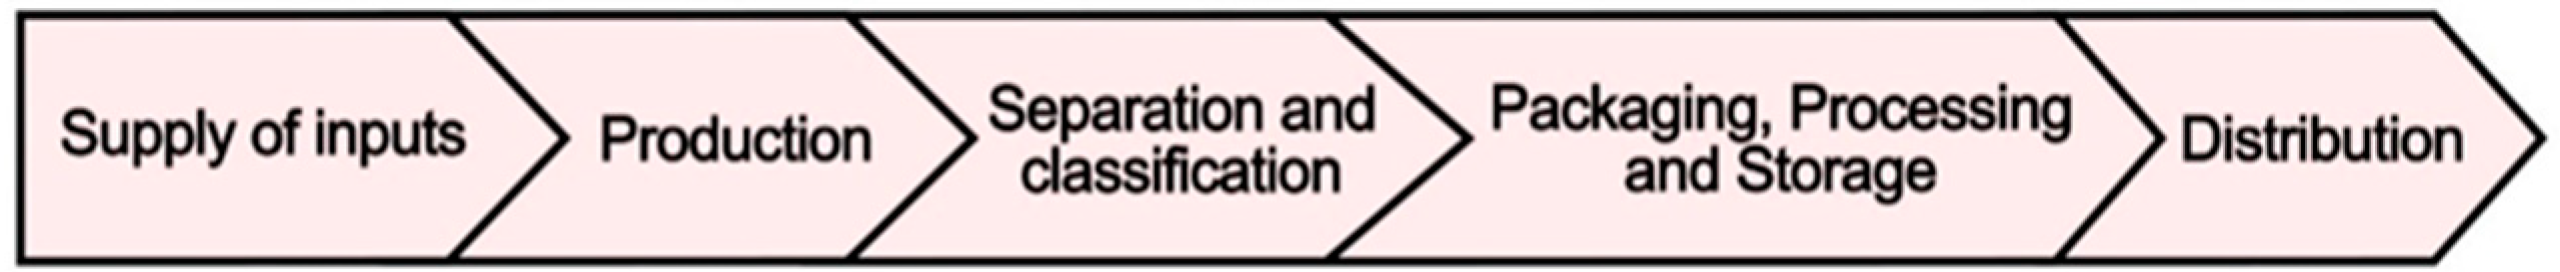
In general, the lychee value chain begins with the companies that supply the inputs to producers, such as seedlings, fertilizers, and pesticides, for example. Then, producers are responsible for planting and maintaining the orchards, carrying out soil preparation, planting, maintenance, and irrigation operations. Next, the lychee goes through a quality evaluation process through separation and classification methods, which mainly analyze aspects related to color and size and whether there is any damage to the fruit. Packaging varies from region to region, but typically, packaging can be made of wood, plastic, cardboard, and, in some Asian countries, even bamboo baskets.
The next step in the value chain is storage, which requires appropriate refrigeration infrastructure as it is necessary to slow down the browning process due to the perishability of the fruit. Part of the production is destined for processing, in which the lychee can be sold peeled and canned or as juice, tea, or jam. The fruit is then distributed, which can occur in the domestic market, through wholesalers and retailers, or in the foreign market, to other countries. Figure 1 shows these steps. Transport logistics must be well thought out since, as previously stated, lychee is a perishable fruit, being sensitive to high temperatures and humidity variation.
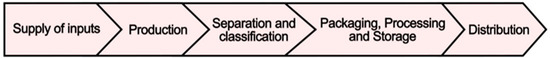
Figure 1.
Overall aspect of the lychee value chain, adapted from Jha and Sinha [22].
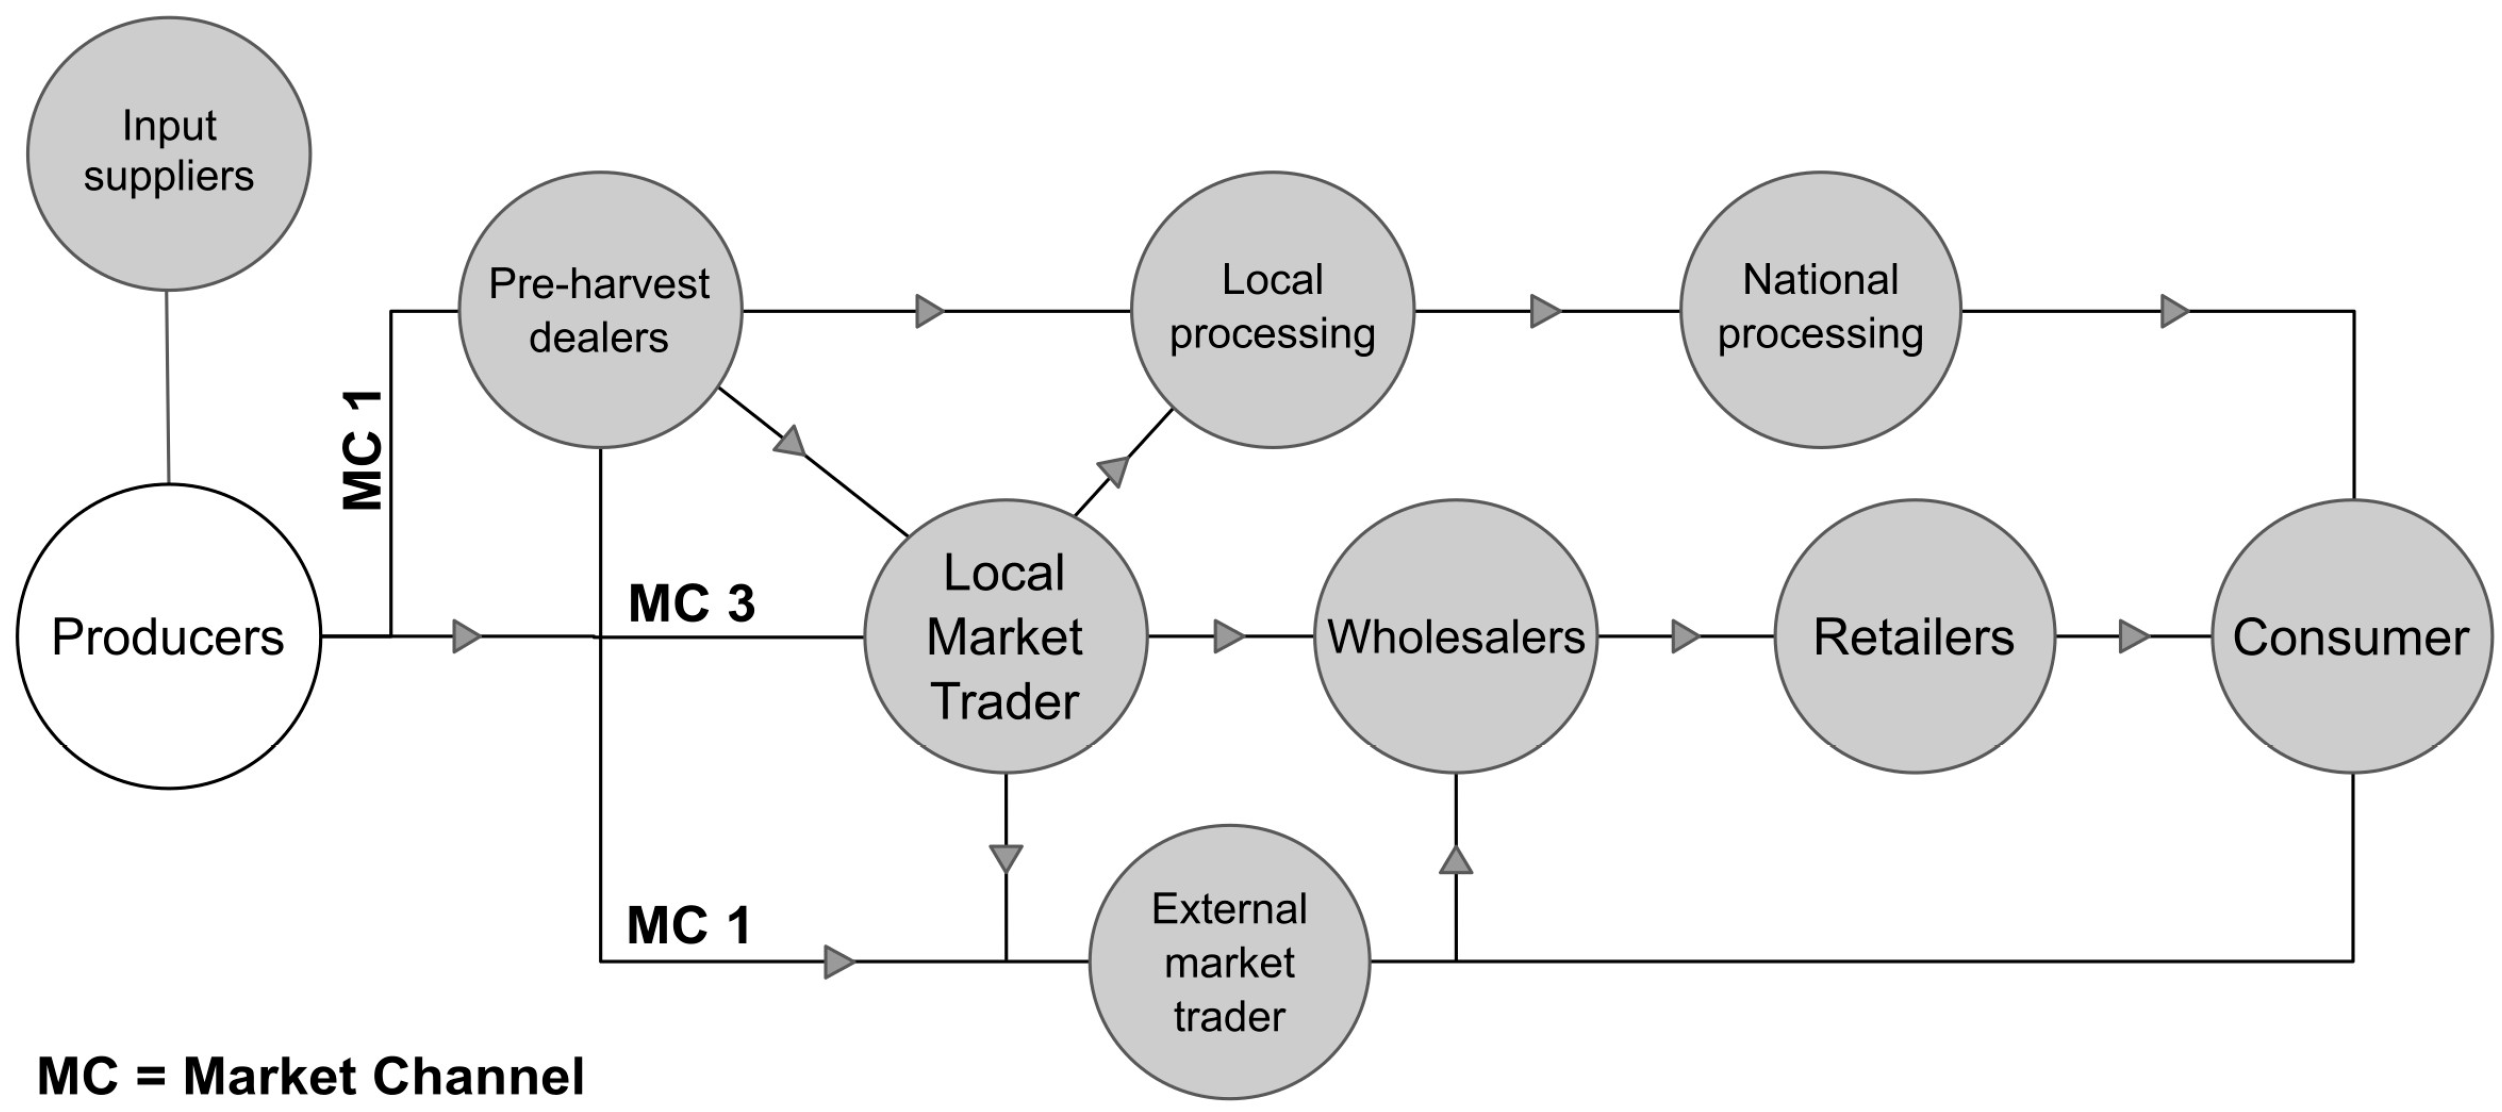
In India, the main actors in the value chain are producers and pre-harvest traders, as shown in Figure 2. After harvesting, the fruit is distributed to local and distant merchants, who take it to retailers, who then sell it to consumers. A small portion of the production is destined for processing.
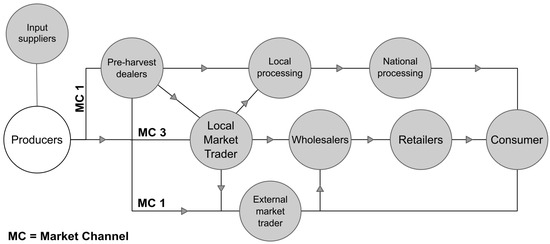
Figure 2.
Key actors in the lychee value chain in India, adapted from Jha and Sinha [22].
Producers are responsible for establishing lychee orchards, as well as the agricultural operations that will be carried out. It is not common for there to be an association of producers in India. They can sell their produce to processors or they can rent their orchards to pre-harvest dealers, who inspect the orchard and estimate the expected yield. In addition, these merchants manage the orchards, providing information on the most appropriate ways to produce and are responsible for organizing the sale of the fruit to local and distant merchants. Approximately 75% of lychee is sold through these contractors. However, some farmers prefer to sell their produce in street markets, the “mandis”, and distance themselves from the interference of these contractors.
Merchants are responsible for distributing the lychee to other locations in the country or to processing units. They handle large volumes of the fruit, and, as they are mainly responsible for transport and storage, they are the most affected by the perishability of lychee.
Typically operated by private companies, processing and packaging centers are integrated. In these centers, lychee is classified as Grade A if it has a reddish color and weighs between 25 and 30 g, Grade B if the weight is less than 25 g, and Grade C if it is discolored.
In Vietnam, lychee production uses three different marketing channels: the Chinese market, domestic market, and foreign market, as seen in Figure 3. After it is produced, farmers in the region sell their production to intermediaries, professionals who are involved in the three main channels of the value chain. They are responsible for intermediating the sale of the fruit to Chinese merchants and local wholesalers, and they are also involved with processing and exporting.
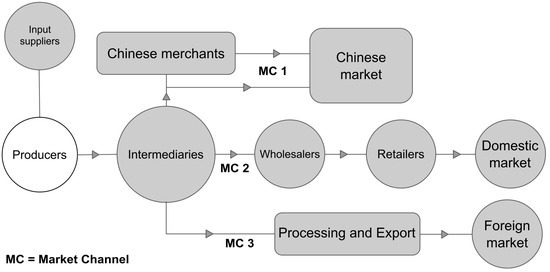
Figure 3.
Key actors in the lychee value chain in Vietnam, adapted from Sakata [23].
Regarding the Chinese market, the sale of Vietnamese production is significantly affected by Chinese production since the harvest period in China begins soon after the end of the harvest period in Vietnam, meaning there is an urgency to sell the produce.
To avoid paying taxes, the intermediaries hire Chinese residents who live on the border between China and Vietnam to sell the fruit. This measure is carried out due to the existence of a law that says that Chinese people who reside in Vietnam up to 20 km from the border are allowed to carry out commercial exchanges that do not exceed the value of CNY 8000; in this way, the cost of sale is lower and there is no bureaucratic involvement for intermediaries.
Due to the perishability of the fruit, intermediaries need to sell it quickly and on the same day that they are harvested; this is mainly due to the fact that farmers do not have refrigerated storage systems, stopping them from being able to keep the fruit fresh. The consequence of this is a price oscillation that occurs on the same day since, during the afternoon, prices decrease in relation to morning prices. In view of this, Chinese traders are only interested in buying lychee produced in Vietnam during the first twenty days of the harvest period, which is the time when the fruit has the highest quality; after this period, sales drop sharply, and it is at this time that the lychee begins to be sold in the domestic market.
Intermediaries only start selling in the domestic market, the second channel in the value chain, after the trading period with China ends. They are responsible for negotiating prices and transporting the fruit to wholesalers, who distribute it to retailers and consumers in the local market.
Processing and export make up the third channel of the value chain, and some of the farmers carry out the processing of the fruit, which can then be sold in a dry format or as juice. To boost exports, Vietnamese government officials buy refrigeration machines so that local farmers can export frozen lychee.
Vietnam exports lychee mainly to the European Union, the United States, Japan, Australia, Dubai, and Malaysia, and one of the export bottlenecks is the requirement for certificates by these countries, such as the GlobalGAP, which is required by the European Union. In addition, Japan requires producers to use a series of specific techniques for the production of lychee that will be exported to the country, making it even more difficult to export the lychee produced in the country. The challenges encountered in transport and logistics also contribute to making it difficult for Vietnam to enter the international market.
With regard to China (Figure 4), the world’s largest producer of lychee, one of the main players in the value chain are the suppliers of inputs, who are responsible for ensuring the quality of products, such as insecticides, pesticides, and the equipment that will be used in production, contributing to the addition of value to the product and stimulating local competitiveness. Producers, in addition to ensuring the quality and health safety of production, also need to ensure market demand to keep prices affordable. Within the value chain, they are the main fruit distribution channel for export, for local market fresh fruit sales, for processing, and for direct sales.
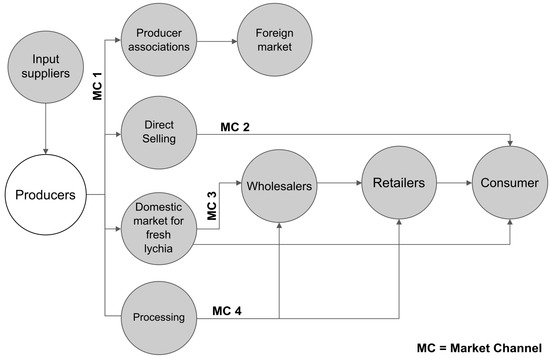
Figure 4.
Key actors in the lychee value chain in China, adapted from Sakata [23].
The fruit is sold fresh or processed a few days after harvest. Regarding processing, it is very common for the fruit to be sold dried, in the form of juice or wine, or canned. Direct sales are those in which the fruit is stored before being sold, and there is a need for a good refrigeration infrastructure since the fruit darkens very quickly after harvest. As far as the export channel is concerned, the largest importers of lychee from China are the United States and Europe.
In this context, Plazibat, Cejvanovic, and Vasiljevic [24], studying the fruit and vegetable sector in Bosnia and Herzegovina, indicate that the market supply chain of fruit and vegetables is short with products sold near the production site or at local markets, as well as indicating that longer market chains are largely not represented because the producers remain passive and have no contractual relationship with wholesalers and retailers. These long market chains are present in the Brazilian lychee market, and, as suggested by these authors, the primary problem lies in integrating small producers into these long market chains. Virtually all channels in the value chain lead to wholesalers and retailers, indicating that they are significant players in the country’s fruit production. Usually, they are primarily responsible for transportation, packaging, and price negotiations before the fruit reaches the consumer.
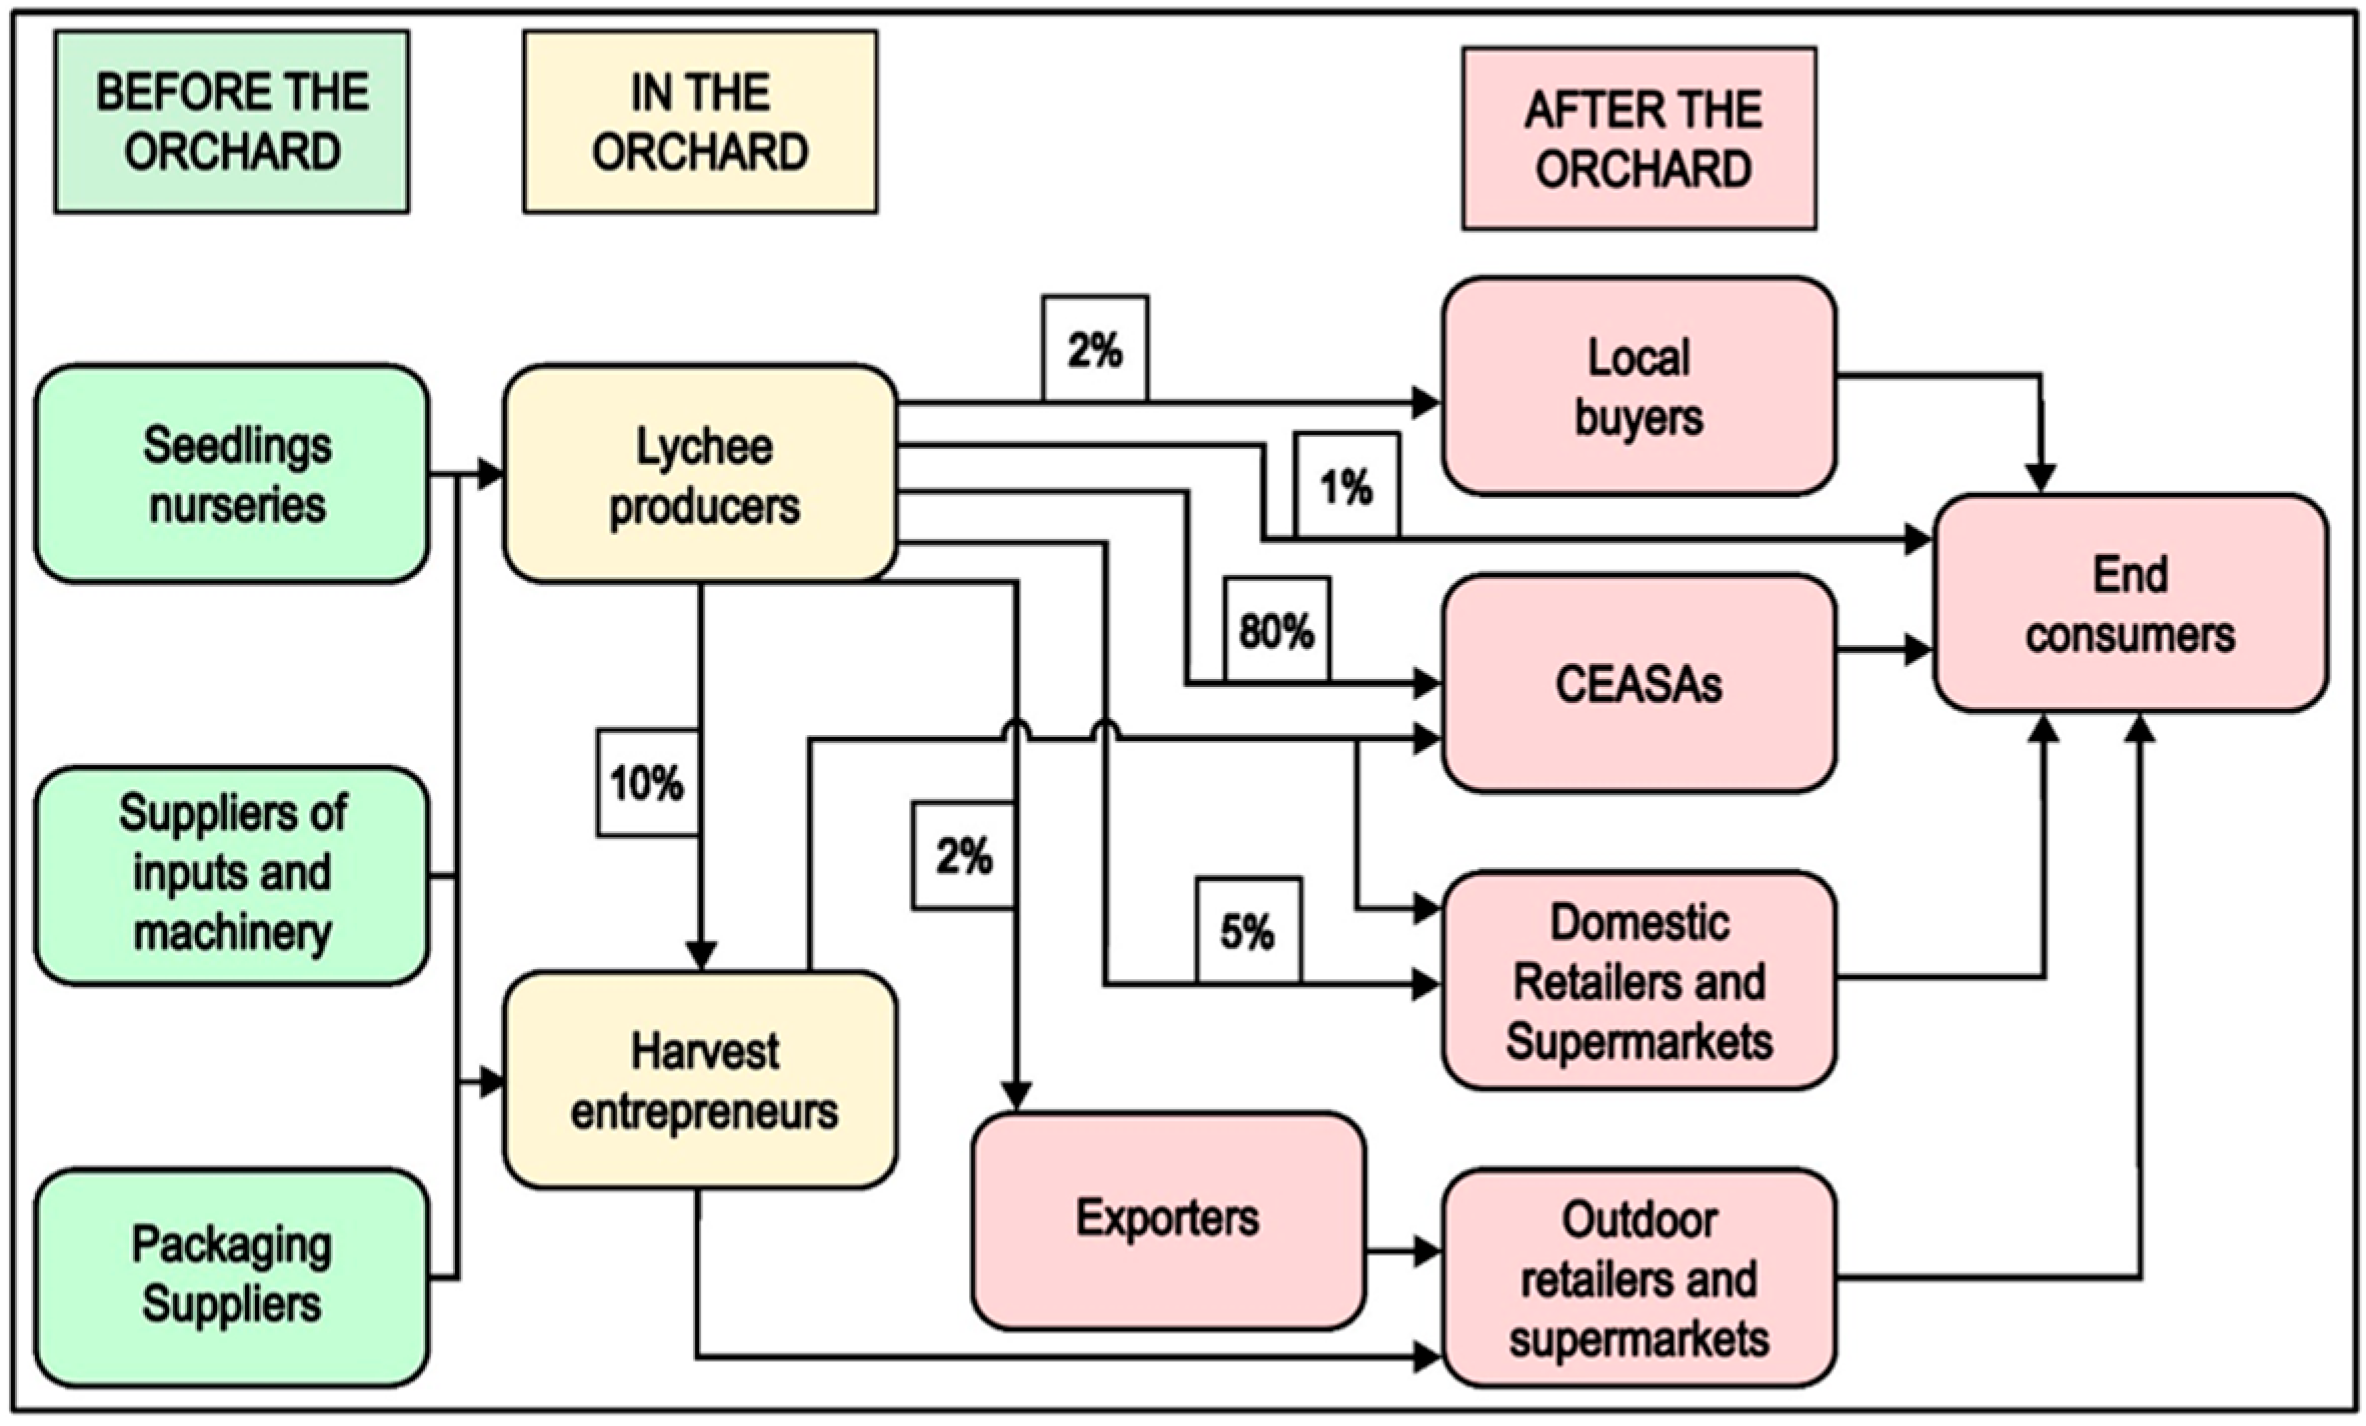
In Brazil, the value chain is analyzed in three stages as follows: before the orchard, in the orchard, and after the orchard. In the stage before the orchard, the main actors involved are the suppliers, who are responsible for supplying the producers with the lychee seedlings, the necessary agricultural inputs, the machinery and equipment that will be used in the production, the harvesting of the fruit, and the packaging.
Then, in the orchard stage, the producers are the main actors since they are responsible for the production of the fruit using everything that was supplied. They distribute to local buyers, CEASAs, exporters, and domestic retailers and supermarkets, as well as directly to final consumers. At this stage, buyers of lychee on the tree also appear, who often harvest the fruit after its production, and, in addition to distributing the lychee to CEASAs and to domestic retailers and supermarkets, they are the only distribution channel for external retailers and supermarkets.
The last stage, after the orchard, is the distribution of the fruit to the different actors in the chain, who are local buyers, exporters, CEASA workers, domestic and foreign retailers and supermarkets, and final consumers. The existence of different distribution channels in the Brazilian chain, in which lychee can reach final consumers through different channels, is observed.
Figure 5 shows that the distribution of the fruit in Brazil is performed in a diversified way, with different distribution channels in which lychee can reach end consumers in different ways and with the presence of different actors in the chain. The percentages that appear in the figure indicate the amount of lychee produced that is distributed by the channel in question. Thus, 80% of lychee production is sent to CEASAs, while only 1% goes directly to final consumers.

Figure 5.
Key actors in the lychee value chain in Brazil, prepared by the author based on Patino et al.; Almeida; Aragão and Contini [25,26,27].
The analysis of the distribution channels allows us to conclude that the commercialization of lychee in Brazil is carried out directly or indirectly. In direct marketing, producers sell the fruit directly to end consumers through open markets, direct sales on the property, or home delivery, for example. This way of marketing allows the producer to have more control over the sale, generating a competitive advantage. In indirect marketing, the most frequent form of commercialization, there are intermediaries between producers and the final consumer who are, in some cases, retailers, wholesalers, exporters, and buyers of CEASAs. As it is usually the intermediaries who are responsible for transportation, storage, and processing, the performance of these processes increases the final costs of the product, and the final consumers are affected by this price difference [28].
Considering the literature review on the effects of climate change on the environmental sustainability of fruits and vegetables carried out by Parajuli et al. [29], it is expected that these effects, in one way or another, will affect the production and commercialization of lychee in Brazil. Therefore, and as suggested by these authors, future studies on the prospective environmental assessment of the life cycle of the lychee value chain will be necessary.
3.3. Strategy for the Development of Lychee in Brazil
One of the main bottlenecks in Brazilian production is the planting of few varieties of lychee. In China, more than 200 different varieties are planted throughout the year, while in Brazil, the plantation is more focused on three varieties, namely Bengal, Brewster, and Americana. The consequence of this is the seasonality of production; that is, the supply of lychee depends on the harvest time of these three varieties, concentrating the harvest period at a certain time of the year and not throughout the whole year [30].
Using different varieties allows the producer to adapt the lychee to different climatic conditions and different production and harvest seasons, thus allowing the fruit to be supplied and consumed throughout the year in the country. In addition, taking advantage of the fact that Brazil is very extensive territorially and, at the same time of year, can present different climates and temperatures throughout the country, the lychee plantation can expand to several areas of the country and deconcentrate production in the southeast region since the main producers of the fruit are the states of São Paulo and Minas Gerais.
There is another consequence that the seasonality of production brings: the low popularity of the fruit. In addition, adding the fact that Brazil has a small planted area and low production volumes, lychee becomes an expensive fruit. In this way, with the fact that the fruit has high prices, even during the time of the greatest supply, it is less popular and it ends up being less consumed in the country.
Another observation is that Brazilians are not used to consuming processed lychee, unlike other Asian countries that consume juice, wine, jams, dehydrated, and even canned lychee. One way to leverage Brazilian production would be to invest in marketing campaigns to encourage the consumption of the fruit in a processed way, forcing an increase in the demand for the fruit and consequently the need to increase production.
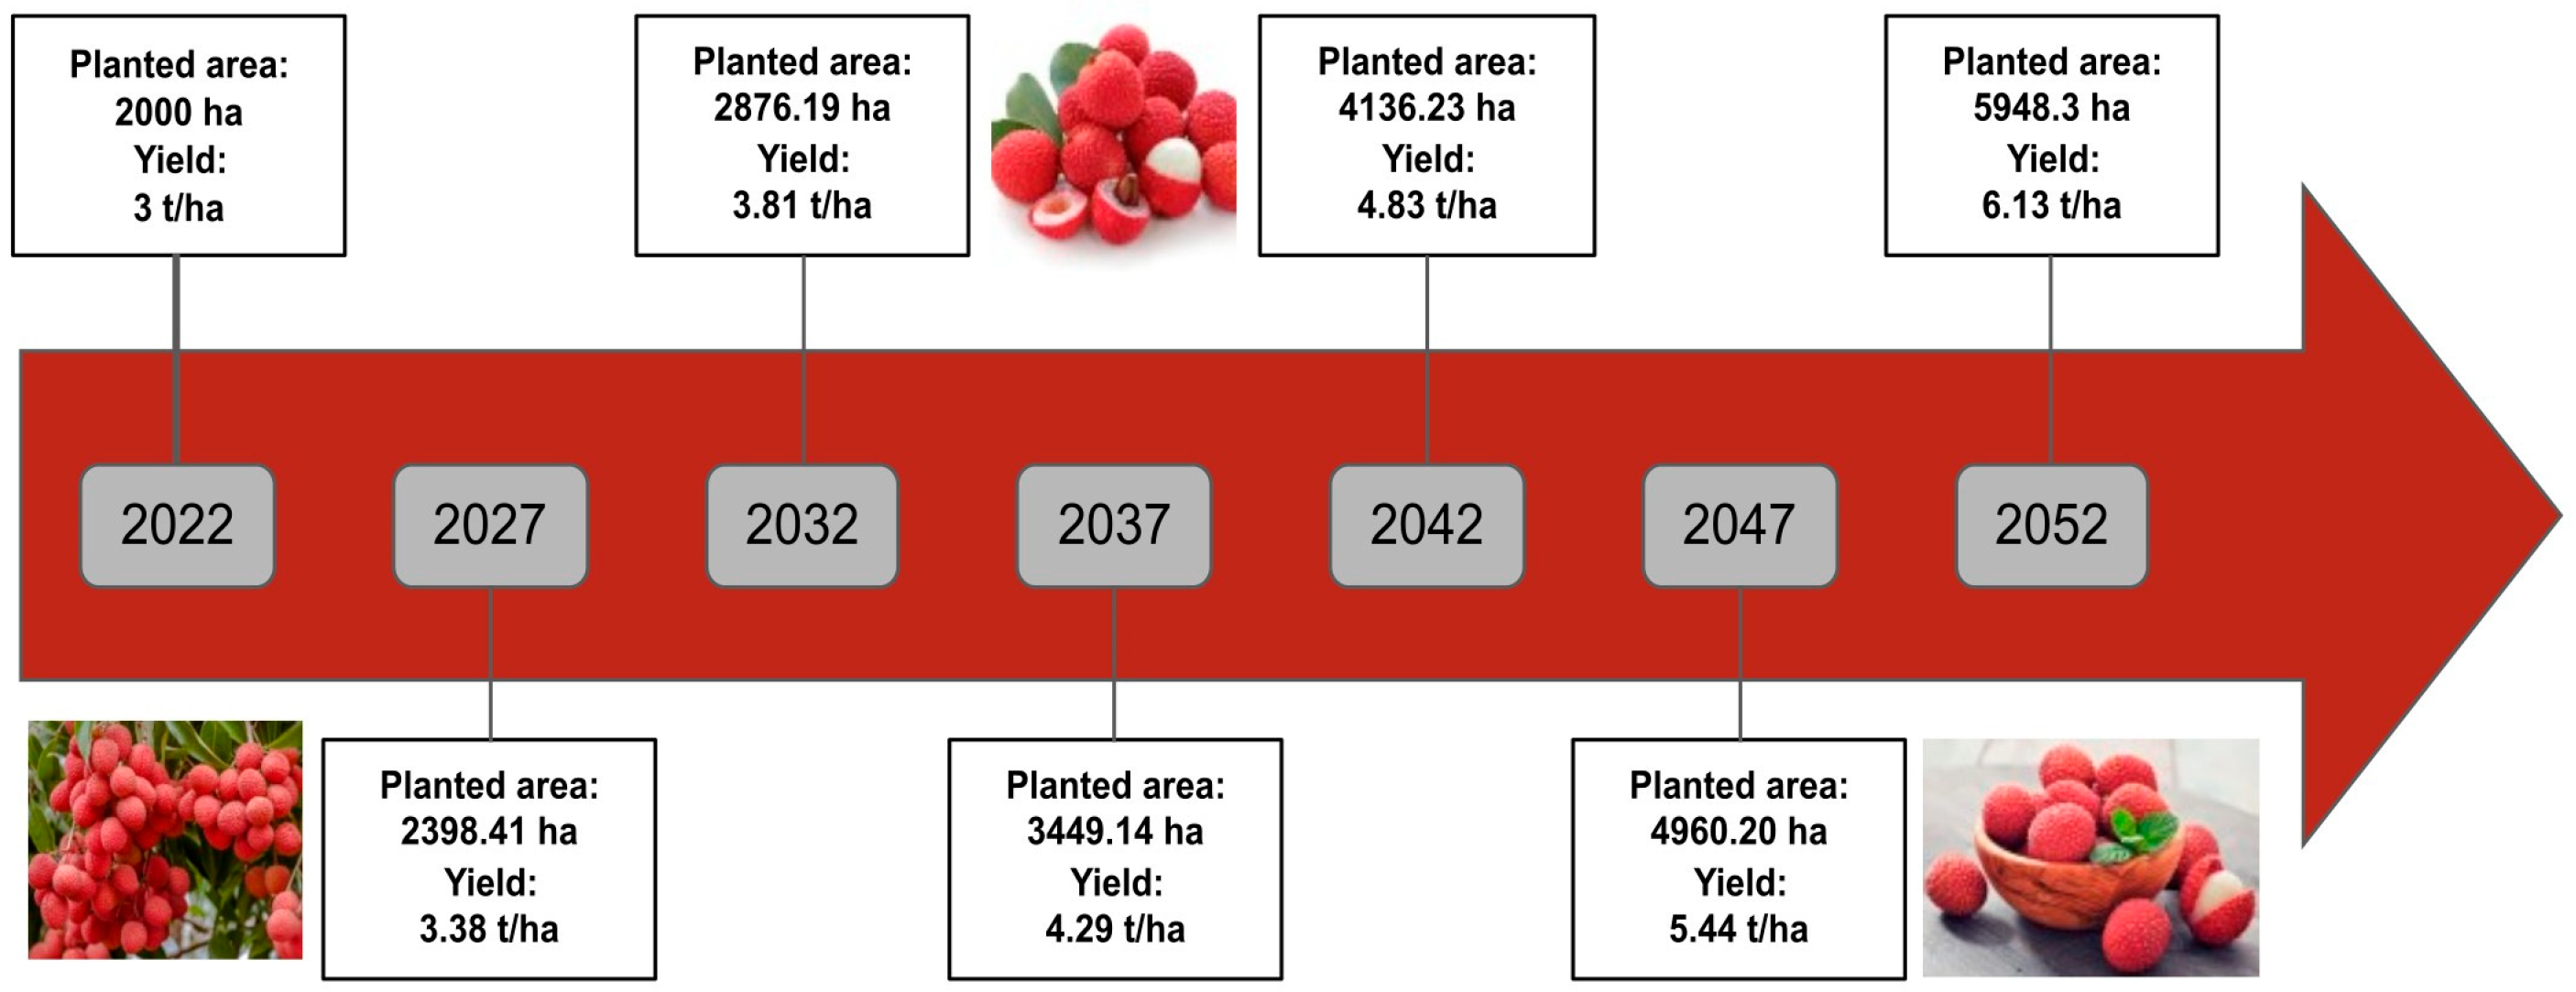
In order to insert Brazil in the competitive lychee market, the following research proposes an increase in the planted area, together with an increase in the production yield, across a period of time of 30 years. Thus, it is proposed that, in the year 2052, the planted area will be 5948.3 hectares, the yield will be 6.13 t/ha, and production will see 36,465.88 tons.
To obtain the data that make up this projection, the case study analyzed the increase in production yield in China and India over the last 30 years; in 1993, China’s production yield was 0.95 t/ha [31], and 30 years later, in 2022, the yield was 5.27 t/ha, indicating that in this period, the country increased its yield by 4.32 t/ha. In the case of India, in 1993 its yield was 4.95 t/ha and, in 2022, 7.65 t/ha, showing that the increase in this period was 2.7 t/ha.
This increase in Brazil’s production yield between the interval of 2022 and 2052, as shown in Figure 6, was obtained based on the interval between the values of productivity increases in China and India across the last 30 years, which are 4.95 and 2.7, respectively. Thus, the value chosen was 3.26 t/ha, which results in 6.13 t/ha, resulting from the sum of the production yield in 2022, which is 2.87 t/ha, with the addition of 3.26 t/ha to be obtained in the next 30 years.

Figure 6.
Projection of the increase in yield and planted area every 5 years over a period of 30 years of lychee production in Brazil (Prepared by the author).
The increase in the planted area and in production was elaborated assuming that the yield in the year 2052 will be 6.13 t/ha. Thus, it is necessary to increase the planted area by 20% every 5 years, which indicates an increase of approximately 3.7% per year. Similarly, it is necessary to increase production by 35% every 5 years, which would indicate an increase of 6.2% per year.
The proposal was prepared with the purpose of inserting Brazil into the competitive lychee market and increasing its prominence in the production, consumption, and commercialization of the fruit. If the goal is achieved—that is, if by the year 2052, the planted area is 5948.3 hectares and the yield is 6.13 t/ha—the production will be 36,465.88 tons, which would place Brazil as the sixth largest producer, considering the current data.
4. Conclusions
The comparative analyses of data on the planted area, production, yield, price, and gross value of lychee production, referring to the 30-year period (1993–2022), presented in this research allow us to conclude that Brazil’s production is still far from reaching the values of the three world producers, who are China, India, and Vietnam. A good example is a comparison of the production yield of Brazil and India, in which, for the year 2022, the Brazilian production recorded a yield of 2.02 t/ha, while India, in 1993, already recorded higher values of 4.95 t/ha. In addition, we can note, again, the fact that China’s production in 2022 is approximately three million tons and Brazil’s is only five thousand tons.
From the study and analysis of the value chain of the four countries, it can be stated that the lychee value chain, in general, commonly presents different intermediaries in the distribution channels, which contributes to the increase in fruit prices for final consumers. Another observation is that only in the Brazilian value chain is there direct marketing, that is, the sale of lychee from the direct producer to the final consumer. Still, it is inferred that, even though China, India, and Vietnam belong to the same continent, there are different peculiarities in the way each country trades, and it can be observed that Vietnam has a greater dependence on China for the flow of its production.
The multiple linear regressions performed and presented in the research were useful to identify the determinant factor of competitiveness in China, India, and Brazil, namely, respectively, price, production, and the planted area. From the identification, strategies were established to increase and develop production in Brazil and, thus, to insert the country into the international market. The study of the development of production in China and India across the last 30 years allowed us to establish a projection where in the year 2052, the planted area of lychee in Brazil should be 5948 hectares and the yield should be 6.13 t/ha, allowing us to place the country as the sixth world producer of lychee.
This research work does not exhaust the value analysis of the lychee production and marketing chain in Brazil. On the contrary, it seeks to initiate a long and productive discussion since there are many areas involved that still lack answers and in-depth comparisons regarding the cultivation of this fruit. Suggestions for future research work are to conduct a broad analysis of the existing literature, incorporating comparisons with similar studies conducted in developing and advanced economies, and to conduct a concise review of relevant studies on value chain analysis and its implications for the production of tropical fruits.
Author Contributions
Conceptualization, M.T.O.P., R.S.M. and R.S.d.A.P.; methodology, M.T.O.P. and R.S.M.; formal analysis, R.S.d.A.P., E.B.S., L.N.B., A.E.M., G.R.M. and M.R.d.A.; writing—original draft preparation, M.T.O.P. and R.S.M.; writing—review and editing, M.T.O.P., R.S.d.A.P. and E.B.S.; supervision, M.T.O.P. All authors have read and agreed to the published version of the manuscript.
Funding
This research received no external funding and the Article Processing Fee for the publication of this research was covered by the Coordination for the Improvement of Higher Education Personnel—CAPES. For open access purposes, the authors have assigned the Creative Commons CC BY license to any accepted version of the article.
Data Availability Statement
The raw data supporting the conclusions of this article will be made available by the authors on request.
Conflicts of Interest
The authors declare no conflicts of interest.
References
- Mitra, S.K.; Pan, J. Litchi and longan production and trade in the world. In Proceedings of the ISHS Acta Horticulturae 1293: VI International Symposium on Lychee, Longan and Other Sapindaceae Fruits, Hanoi, Vietnam, 7–11 June 2019. [Google Scholar] [CrossRef]
- IBGE. Brazilian Institute of Geography and Statistics—Automatic Recovery System—SIDRA—Municipal Agricultural Production. Agricultural Census, Brasília. 2018. Available online: https://sidra.ibge.gov.br/acervo#/S/CA/A/24/T/Q (accessed on 5 November 2022).
- Patino, M.T.O.; Berti, L.N.; de A. Pinto, R.S.; Simonato, E.B. Identification of needs, potential and strategies to increase the competitiveness of lychee in Brazil. J. Manag. Secr. GeSec 2024, 15, e3977. [Google Scholar] [CrossRef]
- CONAB—National Supply Company. PROHORT—Brazilian Program for the Modernization of the Horticultural Market. 2022. Available online: http://www3.ceasa.gov.br/prohortweb (accessed on 5 November 2022).
- CEPEA—Center for Advanced Studies in Applied Economics. Grain Price Indicator. 2022. Available online: https://www.cepea.esalq.usp.br/br/indicador/milho.aspx (accessed on 5 November 2022).
- Di Vita, G.; Spina, D.; De Cianni, R.; Carbone, R.; D’Amico, M.; Zanchini, R. Enhancing the extended value chain of the aromatic plant sector in Italy: A multiple correspondence analysis based on stakeholders’ opinions. Agric. Food Econ. 2023, 11, 15. [Google Scholar] [CrossRef]
- Yamanishi, O.K.; Pires, M.C.; Almeida, L.P.F. The Brazilian lychee industry—Present and future. In III International Symposium on Lychee, Longan and Other Sapindaceae Fruits; ISHS: Leuven, Belgium, 2010; pp. 59–66. [Google Scholar] [CrossRef]
- Oberoi, H.S.; Dinesh, M.R. Trends and Innovations in Value Chain Management of Tropical Fruits. J. Hortic. Sci. 2019, 14, 87–97. [Google Scholar] [CrossRef]
- Yan, F.F.; Qi, W.E.; Ouyang, X. Fluctuation traits of Litchi wholesale price in China. IOP Conf. Ser. Earth Environ. Sci. 2017, 77. [Google Scholar] [CrossRef]
- TRIDGE—Platform and Community Marketplace. Fresh Lychee in China. 2022. Available online: https://www.tridge.com/intelligences/lychee/CN/export (accessed on 13 October 2022).
- Nath, V.; Kumar, G.; Pandey, S.D.; Gupta, A.K. Status of litchi in India. In Proceedings of the ISHS Acta Horticulturae 1211: V International Symposium on Lychee, Longan and Other Sapindaceae Fruits, Bhagalpur, India, 31 May 2016. [Google Scholar] [CrossRef]
- Nguyen, T.-D.; Venkatadri, U.; Nguyen-Quang, T.; Diallo, C.; Adams, M. Optimization Model for Fresh Fruit Supply Chains: Case-Study of Dragon Fruit in Vietnam. AgriEngineering 2020, 2, 1–26. [Google Scholar] [CrossRef]
- CEAGESP—Company of Warehouses and General Warehouses of São Paulo. Prices in the Interior. 2022. Available online: https://ceagesp.gov.br/cotacoes/interior/ (accessed on 28 March 2023).
- CEASA—Supply Centers SA. With Supply Concentrated in December, Lychee Is a Fruit for the End-of-Year Festivities. Available online: https://www.aen.pr.gov.br/Noticia/Com-oferta-concentrada-em-dezembro-lichia-e-fruta-das-festas-de-final-de-ano (accessed on 23 March 2023).
- Amaral, D.G.; Silva, L.V.; Reis, A.E.; Linear Regression Analysis in the R Package. Technical Report, UFMG. 2009. Available online: https://www.est.ufmg.br/portal/wp-content/uploads/2023/01/RTE-01-2009.pdf (accessed on 23 March 2023).
- ISHS—International Society for Horticultural Science. The Lychee in the World. 2022. Available online: https://www.ishs.org/search-results?qq=lychee+in+the+world&form_build_id=form-jQWLaHgwYcPiFsGhKVxkknbXwKKluCicHM7WaTlm4rw&form_id=ishs_search_form&op=Search (accessed on 9 December 2022).
- FAO. Organization for Food and Agriculture. Lychee in the World. 2023. Available online: https://www.fao.org/home/search/en/?q=lychee+in+the+world (accessed on 9 December 2022).
- Oliveira, D.P.R. Strategic Planning, 18th ed.; Atlas Publishing: São Paulo, Brazil, 2002. [Google Scholar]
- de Oliveira, L.M.; de Lima, H.V.; Rodrigues, S.; Carvalho, E.J.M.; Torres, L.C. Multiple imputation to fill in missing data in soil physico-hydrical properties database. Rev. Ciência Agronômica 2020, 51, 2–10. [Google Scholar] [CrossRef]
- Varian, H.R. Microeconomics: A Modern Approach, 9th ed.; Atlas Publishing: São Paulo, Brazil, 2015. [Google Scholar]
- Porter, M.E. The Competitive Advantage: Creating and Sustaining Superior Performance; Free Press: New York, NY, USA, 1985. [Google Scholar]
- Jha, B.; Sinha, R. Litchi Production Marketing and Processing in Bihar and India. Ministry of Agriculture and Farmers Welfare—Agricultural Economics Research Unit. 2017. Available online: https://desagri.gov.in/wp-content/uploads/2024/03/2017-18-LITCHI-PRODUCTION-MARKETING-AND-PROCESSING-IN-BIHAR-AND-INDIA.pdf (accessed on 2 December 2024).
- Sakata, S.; Takanashi, F. Chapter 6 Vietnam’s Lychee and Dragon Fruit Exports to China: Studies of the Production and Value Chain. Impact of China’s Increasing Demand for Agro Produce on Agricultural Production in the Mekong Region, BRC Research Report Bangkok Research Center, JETRO Bangkok/IDE-JETRO. 2018. Available online: https://www.ide.go.jp/library/English/Publish/Reports/Brc/pdf/21_06.pdf (accessed on 13 June 2023).
- Plazibat, I.; Ćejvanović, F.; Vasiljević, Z. Analysis of Fruit and Vegetable Value Chains. Posl. Izvr. Zagreb 2016, 10, 169–188. Available online: https://ideas.repec.org/a/zag/busexc/v10y2016i2p169-188.html (accessed on 27 November 2024).
- Patino, M.T.O.; Simonato, E.B.; Berti, L.N.; Pinto, R.S.A. Strategies to increase the competitiveness of lychee in Brazil. In Proceedings of the Annals of the 60th Congress of the Brazilian Society of Rural Economics, Administration and Sociology—SOBER, Natal, Brazil, 11 August 2022. [Google Scholar] [CrossRef]
- Almeida, G.V.B. Lychee at CEAGESP in São Paulo, TodaFruta Portal. 2016. Available online: https://www.todafruta.com.br/lichia-na-ceagesp-de-sao-paulo/ (accessed on 5 November 2022).
- Aragão, A.; Contini, E. Agro in Brazil and in the World: A Synthesis of the Period from 2000 to 2020. Embrapa SIRE. 2020. Available online: https://www.embrapa.br/documents/10180/62618376/O+AGRO+NO+BRASIL+E+NO+MUNDO.pdf/41e20155-5cd9-f4ad-7119-945e147396cb (accessed on 5 November 2022).
- Barros, G.; Economics of Agricultural Commercialization. CEPEA/LES-ESALQ/USP. Piracicaba/SP. 221p. 2006. Available online: https://www.cepea.esalq.usp.br/br/documentos/texto/economia-da-comercializacao-agricola-em-pdf.aspx (accessed on 15 December 2022).
- Parajuli, R.; Thomas, G.; Matlock, M.D. Environmental sustainability of fruit and vegetable production supply chains in the face of climate change: A review. Sci. Total Environ. 2019, 650, 2863–2879. [Google Scholar] [CrossRef] [PubMed]
- Watanabe, H.S.; Oliveira, S.L. Commercialization of exotic fruits. Rev. Bras. Frutic. 2022, 36, 23–38. [Google Scholar] [CrossRef]
- Chen, H.B.; Huang, X.M. Overview of litchi production in the world with specific reference to China. Acta Hortic. 2014, 1029, 25–33. [Google Scholar] [CrossRef]


Disclaimer/Publisher’s Note: The statements, opinions and data contained in all publications are solely those of the individual author(s) and contributor(s) and not of MDPI and/or the editor(s). MDPI and/or the editor(s) disclaim responsibility for any injury to people or property resulting from any ideas, methods, instructions or products referred to in the content. |
© 2024 by the authors. Licensee MDPI, Basel, Switzerland. This article is an open access article distributed under the terms and conditions of the Creative Commons Attribution (CC BY) license (https://creativecommons.org/licenses/by/4.0/).