Article

Effect of Soaking, Germination, and Roasting on Phenolic Composition, Antioxidant Activities, and Fatty Acid Profile of Sunflower (Helianthus annuus L.) Seeds

1
Department of Food Science, School of Food Industry, King Mongkut’s Institute of Technology Ladkrabang, Bangkok 10520, Thailand
2
Department of Cuisine and Nutrition, Yangzhou University, Yangzhou 225127, China
3
International Cooperation Department of Lanzhi Education Foundation, Beijing 100075, China
4
The Development of Foods and Food Additive from Innovative Microbial Fermentation Research Unit, Faculty of Science, Chulalongkorn University, Bangkok 10330, Thailand
5
Research Unit of Thai Food Innovation, Department of Food Technology and Nutrition, Faculty of Technology, Mahasarakham University, Maha Sarakham 44150, Thailand
*
Authors to whom correspondence should be addressed.
Horticulturae 2024, 10(4), 387; https://doi.org/10.3390/horticulturae10040387
Submission received: 15 March 2024 / Revised: 9 April 2024 / Accepted: 10 April 2024 / Published: 11 April 2024
(This article belongs to the Section Processed Horticultural Products)

Abstract

:
This study investigates the impact of soaking, germination, and roasting under various conditions on the phenolic content, antioxidant activities, and fatty acid profile of sunflower seeds of striped and black oil seed varieties. Ferulic acid emerged as the predominant phenolic acid across all samples. The study highlights the influence of different treatments and processing conditions on the levels of phenolic acids and flavonoids. Results revealed that soaking striped seeds for 24 h and roasting black oil seeds for 6 min exhibited the highest total phenolic content (TPC) and total flavonoid content (TFC). Antioxidant activities varied, with striped seeds soaked for 24 h demonstrating the highest ferric-reducing antioxidant power (FRAP) values, while black oil seeds roasted for 6 min exhibited superior 2,2-diphenyl-1-picrylhydrazyl (DPPH) and 2,2’-azino-bis (3-ethylbenzthiazoline-6-sulphonic acid) (ABTS) radical scavenging activity. Oleic acid and linoleic acid were identified as major fatty acids in all processed samples, with striped seeds germinated for 24 h and black oil seeds germinated for 48 h displaying the highest concentrations. Soaking led to a reduction in both unsaturated and saturated fatty acids in both varieties. Roasting further influenced fatty acid concentrations, with a significant increase in striped seeds after 5 and 6 h of roasting, followed by a gradual decrease. Our findings suggest that incorporating appropriate processing methods, such as soaking striped seeds for 24 h and roasting black oil seeds for 6 min, enhances the potential health benefits of sunflower seeds.

1. Introduction

The sunflower plant (Helianthus annuus L.) is indigenous to northern and central America. Following groundnut and soybean, sunflower seeds are the third most significant oilseed crop on the planet and one of the most widely consumed edible seeds [1]. They are renowned for their nutritional value to human health and are commonly employed as savory treats or as a primary component in confectioneries [2,3]. Sunflower seeds are also significant in protein and lipid content. Sunflower oil predominantly contains unsaturated fatty acids, including oleic acid (approximately 20%), linoleic acid (approximately 64%) [3], palmitic acid, and stearic acid (approximately 15%) [4]. These fatty acids, especially polyunsaturated fatty acids (PUFAs) and monounsaturated fatty acids (MUFAs), have been associated with a reduced risk of non-communicable diseases (NCDs) [4]. Studies have indicated that sunflower oil may have beneficial effects on cholesterol levels, potentially reducing total cholesterol and low-density lipoprotein (LDL) cholesterol while also possessing antioxidant properties [4,5]. Oleic acid, a monounsaturated omega-9 fatty acid found in sunflower oil, has been associated with lowering triacylglycerides and LDL cholesterol levels, increasing high-density lipoprotein (HDL) cholesterol, and potentially reducing the risk of heart attack [5]. Linoleic acid, an essential polyunsaturated omega-6 fatty acid present in sunflower oil, contains two cis double bonds. However, some research has demonstrated an inverse relationship between omega-6 fatty acid intake and the risk of coronary heart disease [6]. The naturally occurring antioxidants that are most prevalent in plant materials are phenolics. Edible seeds and sprouts have been recognized as valuable sources of antioxidants, including flavonoids, phenolic acids, trace elements, and vitamins [7,8]. Over recent decades, various flavonoids such as heliannone, quercetin, kaempferol, luteolin, and apigenin, as well as phenolic acids, including caffeic acid, chlorogenic acid, caffeoylquinic acid, gallic acid, protocatechuic acid, coumaric acid, ferulic acid, and sinapic acid, have been identified in sunflower seeds and sprouts [9]. These compounds have been associated with pharmaceutical activities, including cardiovascular diseases, atherosclerosis, and cancer, attributed to sunflower seeds and sprouts [9,10]. Food processing is a process that alters the physical properties and chemical composition of the ingredients. It not only improves the texture, digestibility, flavor, color, and shelf life of food but also enhances the absorption of nutrients by deactivating antinutritional compounds, growth inhibitors, and haemagglutinins [11,12,13]. Soaking serves as an initial preparatory measure preceding cooking, aiding in the reduction of cooking time and the softening of texture [14]. Mecha et al. reported that decreasing polyphenol content and antioxidant activity after soaking seeds may be because some components were leached into the soaking water [15]. Germination is the process of seeds growing into plants. For sunflower seeds, germination is considered part of processing because it involves controlled conditions that initiate the growth of the seed into a young plant. This process generates various biochemical changes within the seed, leading to alterations in its chemical composition and nutritional profile, including nutrient activation, reduction in antinutrients, enhanced nutritional content, changes in phytochemical composition, and improved digestibility and palatability, thereby adding value to the final product for consumers [9,16]. The popularity of crop sprout consumption has been increasing [17]. Crop sprouts have more nutritional value compared to seeds. The sunflower sprout is widely regarded as a preferred sprout owing to its abundant nutritional content and phytochemical composition, including phenolic compounds, vitamins, and diverse colors. Notably, it contains components with antioxidant activity, which play significant roles in promoting human health and preventing diseases [8,9]. Roasting is an expeditious processing technique that employs a short duration of dry heat. The heightened antioxidant activity observed in the roasted seed may be attributed to the thermal treatment-induced depletion of polyphenols, which is countered by the formation of a new substance with promising antioxidant properties via the Maillard reaction [18,19,20]. While some studies have investigated the effects of food processing on the chemical composition changes in sunflower seeds [21,22], limited comprehensive information is available regarding individual phenolics alongside their biological activities and chemical compositions, including fatty acid composition and concentration.
Hence, this study aims to assess the impact of soaking, germination, and roasting on the total phenolic contents and antioxidant activities of sunflower seeds. Additionally, the phenolic components and fatty acids extracted from sunflower seeds will be characterized. The objective is to provide valuable insights into the optimal processing methods for further development and practical health benefits.

2. Materials and Methods

2.1. Chemicals and Reagents

2,2-diphenyl-1-picrylhydrazyl (DPPH), 2,2’-azino-bis (3-ethylbenzthiazoline-6-sulphonic acid) (ABTS), 2,4,6-tripyridyl-s-triazine (TPTZ), Folin–Ciocalteu reagent, sodium carbonate, rutin, phenolic acids standards, and methyl esters of fatty acid standards were purchased from Sigma-Aldrich Co. (St. Louis, MO, USA). Merck in Darmstadt, Germany, supplied the HPLC and GC acetonitrile, methanol, sodium nitrite (NaNO2), aluminum chloride (AlCl3), sodium hydroxide (NaOH), iron (III) chloride hexahydrate (FeCl3•6H2O), and iron (II) sulfate heptahydrate (FeSO4). Fisher Scientific (Leicester, UK) supplied hexane, 37% hydrochloric acid, and 96% ethanol solution.

2.2. Sunflower Samples

The sunflower seeds used in the study were obtained from two cultivars: striped sunflower seeds (cv. Artuel) and black oil sunflower seeds (cv. Peredovik), which were provided by P T Seed-sprout Company, located in Lopburi, Thailand. Detailed descriptions and characteristics of the samples from the two sunflower cultivars are exhibited in Table 1. The seeds were harvested during the 2022/2023 harvest season. Seeds that were damaged or broken were manually extracted from the samples. The moisture contents were determined [23]. Briefly, 3 g of seed kernels was subjected to drying at 105 ± 1 °C using a vacuum oven until a constant weight was achieved. After drying, the samples were removed, allowed to cool in a desiccator to prevent moisture absorption from the atmosphere, and then reweighed accurately. The moisture content is calculated using the following formula:
Moisture content (%) = ((W1 − W2)/W1) × 100.
where
  • W1 = initial weight of the sample (mg);
  • W2 = weight of the sample after drying (mg).
The data can be found in Supplementary Table S1.
Table 1. Description and characteristics of the samples of the two sunflower cultivars.
CultivarsMaturity
(Days)
Characteristics
Average Size and Shape of SeedColor of ShellUse
Artuel90–1009.3 × 4.8 mm, oval shapeStripe black and whiteDirectly consumed as seed
Peredovik95–1209.0 × 4.9 mm, oval shapeBlackEdible oil

2.3. Processing

2.3.1. Soaking

Sunflower seeds were soaked in water at a ratio of 1:5 (w/v) and left to soak for 2, 12, and 24 h in the dark at room temperature. Subsequently, the soaked seeds were immersed in boiling water for 1 min, then cooled in cold water for 1 min to stop germination and deactivate enzymes present in the seeds. The seeds were then drained, and their shells were removed. The seed kernels were dried with paper towels to eliminate any remaining water, ground using an electric grinder (BSH Bosch & Siemens, Munich, Germany), and stored at −20 °C for further analysis. Moisture content was determined for each sample [23].

2.3.2. Germination

The raw seeds were soaked in water at a ratio of 1:5 (w/v) for 12 h at room temperature. The samples were drained after soaking and then covered in a wet cloth to provide moisture to the seeds for 24 and 48 h at room temperature. The germinated samples were briefly boiled in boiling water for 1 min, then cooled in cold water for another minute to stop germination and deactivate enzymes present in the seeds. The seeds were then drained, and their shells were removed. The seed kernels were dried with paper towels to eliminate any remaining water, ground using an electric grinder (BSH Bosch & Siemens, Munich, Germany), and stored at −20 °C for further analysis. Moisture content was determined for each sample [23].

2.3.3. Roasting

Raw sunflower seeds were roasted in an induction cooker (CY-101, SHARP, Shanghai, China) for 5, 6, and 7 min at 110 °C. Following roasting, the seed shells were removed, and the seed kernels were ground using an electric grinder (BSH Bosch & Siemens, Munich, Germany) and stored at −20 °C for further analysis. Moisture content was determined for each sample [23].

2.4. Extraction

The raw and processed samples were defatted with hexane using a Soxhlet apparatus. Extracts were obtained from defatted samples by using 80% (v/v) aqueous ethanol (1:10, w/v) for 3 h at room temperature in a shaking incubator operating at 150 rpm [24]. The solution was filtered using filter paper, and the residue underwent two additional extractions to maximize compound recovery. The resulting filtrate was utilized to measure the total phenolic and flavonoid contents (TPC and TFC), as well as antioxidant activity.

2.5. Determination of TPC

TPC was assessed following the previous method [25] using the Folin–Ciocalteu reagent. Initially, either 0.3 mL of standard gallic acid or the sunflower seed extract was combined with 2.25 mL of 10% Folin–Ciocalteu reagent and allowed to react for 5 min. Following this, 2.25 mL of 6% sodium carbonate solution was added to the mixture, which was then left in the dark at room temperature for a duration of 90 min. Subsequently, the absorbance of the resulting solution was measured against a blank at 725 nm using a spectrophotometer (UV1700, Shimadzu, Tokyo, Japan). A blank was prepared by substituting the extract with distilled water. The TPC results were expressed as milligrams of gallic acid equivalents per gram of dried weight (mg GAE/g DW), providing a quantitative measure of the phenolic content present in the samples.

2.6. Determination of TFC

TFC was determined according to the procedure described by Abu Bakar et al. [26]. Initially, 0.5 mL of the extracted samples were aliquoted into test tubes, which were subsequently mixed with 2.25 mL of distilled water and 0.15 mL of a 5% NaNO2 solution. Following a 6 min agitation period, 0.3 mL of a 10% AlCl3 solution was introduced into the mixture, which was then shaken for an additional 5 min. Thereafter, 1.0 mL of 1 M NaOH was added to each sample. The absorbance of the resulting solutions was determined against a blank at 510 nm utilizing a spectrophotometer (UV1700, Shimadzu, Tokyo, Japan). A blank was prepared by substituting the extract with distilled water, utilizing a spectrophotometer to detect the absorbance at 510 nm. The results were measured as mg of rutin equivalents (REs) per g of dry weight (mg RE/g DW).

2.7. Determination of Phenolic Compounds and Flavonoids by HPLC

The phenolics were examined using Kubola and Siriamornpun’s method [27]. A 100 mL methanol/HCl solvent mixture (100:1, v/v) was added to 10 g of raw and processed samples and left at 35 °C for 18 h without light. After 2200 g of centrifugation and filtering, the filtrate evaporated at 30–40 °C. The material was diluted in methanol to 3 mL and filtered through a 0.45 µm nylon filter. HPLC analysis of phenolic compounds was performed using Shimadzu LC-20AC pumps, SPD-M20A diode array detection, and chromatographic separations on a column Inetsil ODS-3, C18 (4.6 mm 250 mm, 5 mL) (Hichrom Limited, Berks, UK). The analysis was conducted utilizing a C18 column (4.6 × 250 mm, 5 µm) obtained from Hichrom Limited, Berk, UK. The mobile phase consisted of a mixture of water containing 1% acetic acid (A) and acetonitrile (ACN) (B). A gradient elution system was employed, with a flow rate set at 1 mL/min, operating as follows: 0–40 min (30% A and 70% B) and 40–45 min (20% A and 80% B). Subsequently, the elution conditions were adjusted to 15% A and 85% B at 1.2 mL/min for 45–55 min, followed by 10% A and 90% B for 55–57. Phenolic chemicals in the samples were identified and quantified using UV-diode array detection at specific wavelengths. Hydroxybenzoic acids were detected at 280 nm, while hydroxycinnamic acids were detected at 320 nm. Phenolic chemicals in the samples were identified by comparing retention time to standard compounds and detected using external standards. These included gallic acid (GA), protocatechuic acid (PCCA), p-hydroxybenzoic acid (p-HO), vanillic acid (VA), chlorogenic acid (ChA), caffeic acid (CFA), syringic acid (SyA), p-coumaric acid (p-CA), ferulic acid (FA), and sinapic acid (SNA).

2.8. Determination of Antioxidant Activity

2.8.1. DPPH Free Radical Scavenging Activity

DPPH scavenging activity was measured using the technique of Xu et al. [28] with slight modifications. A total of 0.1 mL of the extracted solution was added to 3 mL of ethanol with 0.1 mM DPPH. The resulting mixture was stirred and incubated at room temperature for 30 min in darkness to allow for the reaction between the sample and the DPPH radical. During the incubation period, the absorbance of the reaction mixture was measured at 517 nm using a spectrophotometer (UV1700, Shimadzu, Tokyo, Japan). Subsequently, the obtained data were presented as the percentage of DPPH radical inhibition.
The degree of DPPH radical scavenging activity exhibited by the sample was determined using the following formula:
DPPH radical inhibition (%) = [(A0 − A1)/A0] × 100
where
  • A0 = initial absorbance of DPPH solution (without sample);
  • A1 = final absorbance of the DPPH solution after reaction with the sample.

2.8.2. Ferric-Reducing Antioxidant Power (FRAP) Assay

FRAP was analyzed following the method described by Luo et al. [29]. In this assay, the FRAP reagent was freshly prepared by combining 0.3 M acetate buffer pH 3.6 (100 mL), 10 mL of TPTZ solution (10 mM TPTZ dissolved in 40 mM HCl), and 20 mM FeCl3•6H2O (10 mL). To this reagent, 12 mL of distilled water was added, and the solution was incubated at 37 °C to ensure optimal conditions for the reaction. To initiate the assay, 60 µL of the sample extract was mixed with 180 µL of distilled water and 1.8 mL of the freshly prepared FRAP solution. The resulting mixtures were then thoroughly shaken and incubated in a water bath maintained at 37 °C for a duration of 4 min. Following the incubation period, the absorbance of the reaction mixture was measured against a blank at 593 nm using a spectrophotometer (UV1700, Shimadzu, Tokyo, Japan). A blank was prepared by substituting the extract with distilled water. In the FRAP assay, the antioxidant activity of the sample was evaluated by employing a standard curve generated with the FeSO4 linear regression equation (y = 0.002 + 0.888, R2 = 0.998). The results are indicated as millimoles of FeSO4 per gram of dry weight (mmol FeSO4/g DW).

2.8.3. ABTS Free Radical Scavenging Activity

A slight modification was made to the Wootton-Beard et al. [30] ABTS assay. ABTS•+ was generated by oxidizing 7 mM ABTS with 2.45 mM potassium persulfate in a 1:1 ratio and subsequently incubating the mixture for 12–16 h at 4 °C in darkness. This extended incubation period allowed for the complete generation of the ABTS•+ radical species. To assess the antioxidant activity of the samples, 20 µL of the sample was mixed with 2 mL of the pre-prepared ABTS•+ solution. The resulting mixture was stirred and then incubated at room temperature for 6 min in darkness to allow for the reaction between the sample and the ABTS•+ radical. Subsequently, the absorbance of the solution was measured at 734 nm using a spectrophotometer (UV1700, Shimadzu, Tokyo, Japan). The obtained data were expressed as the percentage of ABTS radical inhibition using the following formula:
ABTS radical inhibition (%) = [(A0 − A1)/A0] × 100
where
  • A0 = initial absorbance of ABTS solution (without sample);
  • A1 = final absorbance of the ABTS solution after reaction with the sample.

2.9. Extraction and Determination of the Fatty Acid Composition

Lipids were extracted using the Bligh and Dyer method [31]. A total of 100 mL of chloroform–methanol (2:1 v/v) with 10 mg/mL butylated hydroxytoluene (BHT) was extracted from 10 g of ground materials. The samples stayed in a fume hood for 18 h. After filtering, the samples were placed in funnels with 20 mL of 0.85% sodium chloride. The samples were aggressively agitated for phase separation. A vacuum-driven rotary evaporator evaporated the lower phase at 40 °C. Fatty acids in the extracted lipids were converted into methyl esters using acid-catalyzed methylation. A total of 100 mg of the sample was weighed into a screw-cap tube, followed by the addition of 3 mL of 0.9 M sulfuric acid in methanol, 1 mL of toluene, and 1 mL of nonadecanoic acid (19:0) internal standard. The mixture was then subjected to a 70 °C water bath for 2 h with intermittent shaking every 30 min. Subsequently, 2 mL of hexane was added, and the resulting solution was transferred to a test tube containing 3 mL of distilled water. The organic layer, containing methyl esters, was separated by filtration through sodium sulfate to remove any remaining water, evaporated to dryness, and stored at −25 °C before chemical analysis. Fatty acid methyl esters were analyzed using a gas chromatograph (model GC-2014, Shimadzu, Kyoto, Japan) with a flame ionization detector. The elution was carried out with hydrogen at a flow rate of 30 ± 1 mL/min with a split ratio of 1:17. Both the injector and detector temperatures were held constant at 250 °C throughout the analysis. Nitrogen was utilized as the carrier gas, and the temperature programming protocol was as follows: starting at 150 °C for 5 min, the temperature was then increased to 230 °C at a rate of 15 °C/min. Subsequently, the temperature transitioned to 170 °C and was held for 10 min at a rate of 10 °C/min, followed by a further increase to 200 °C held for 3 min at a rate of 5 °C/min. Finally, the temperature was elevated to 230 °C and maintained for 2 min at a rate of 15 °C/min. The emergent peaks were identified by comparing their retention time with authentic standards. The concentration of the fatty acids was calculated using an internal standard, namely nanodecanoic acid (C19:0) [32]. Lipid content, fatty acid composition, and concentration were calculated using the following formulas:
Fatty acid composition = Area under each peak Total areas of all fatty acids appeared in the chromatogram × 100
Fatty acid concentration = Area under each peak area of internal standard × 100 × 100 g sample

2.10. Statistical Analysis

The experiment was conducted in triplicate, and all procedures were meticulously followed. Data obtained were provided as mean ± standard deviation. Windows SPSS 11.5 was used for statistical analysis. Before conducting the one-way ANOVA analysis, normal distribution was confirmed for all samples using the Shapiro–Wilk test, and homogeneity of variances was assessed using Levene’s test. Subsequently, the comparison of means was performed using Duncan’s multiple range tests (p < 0.05) upon detecting statistically significant differences through ANOVA.
ANOVA and Duncan’s multiple range tests were employed to identify significant differences at a significance level of p < 0.05.

3. Results and Discussion

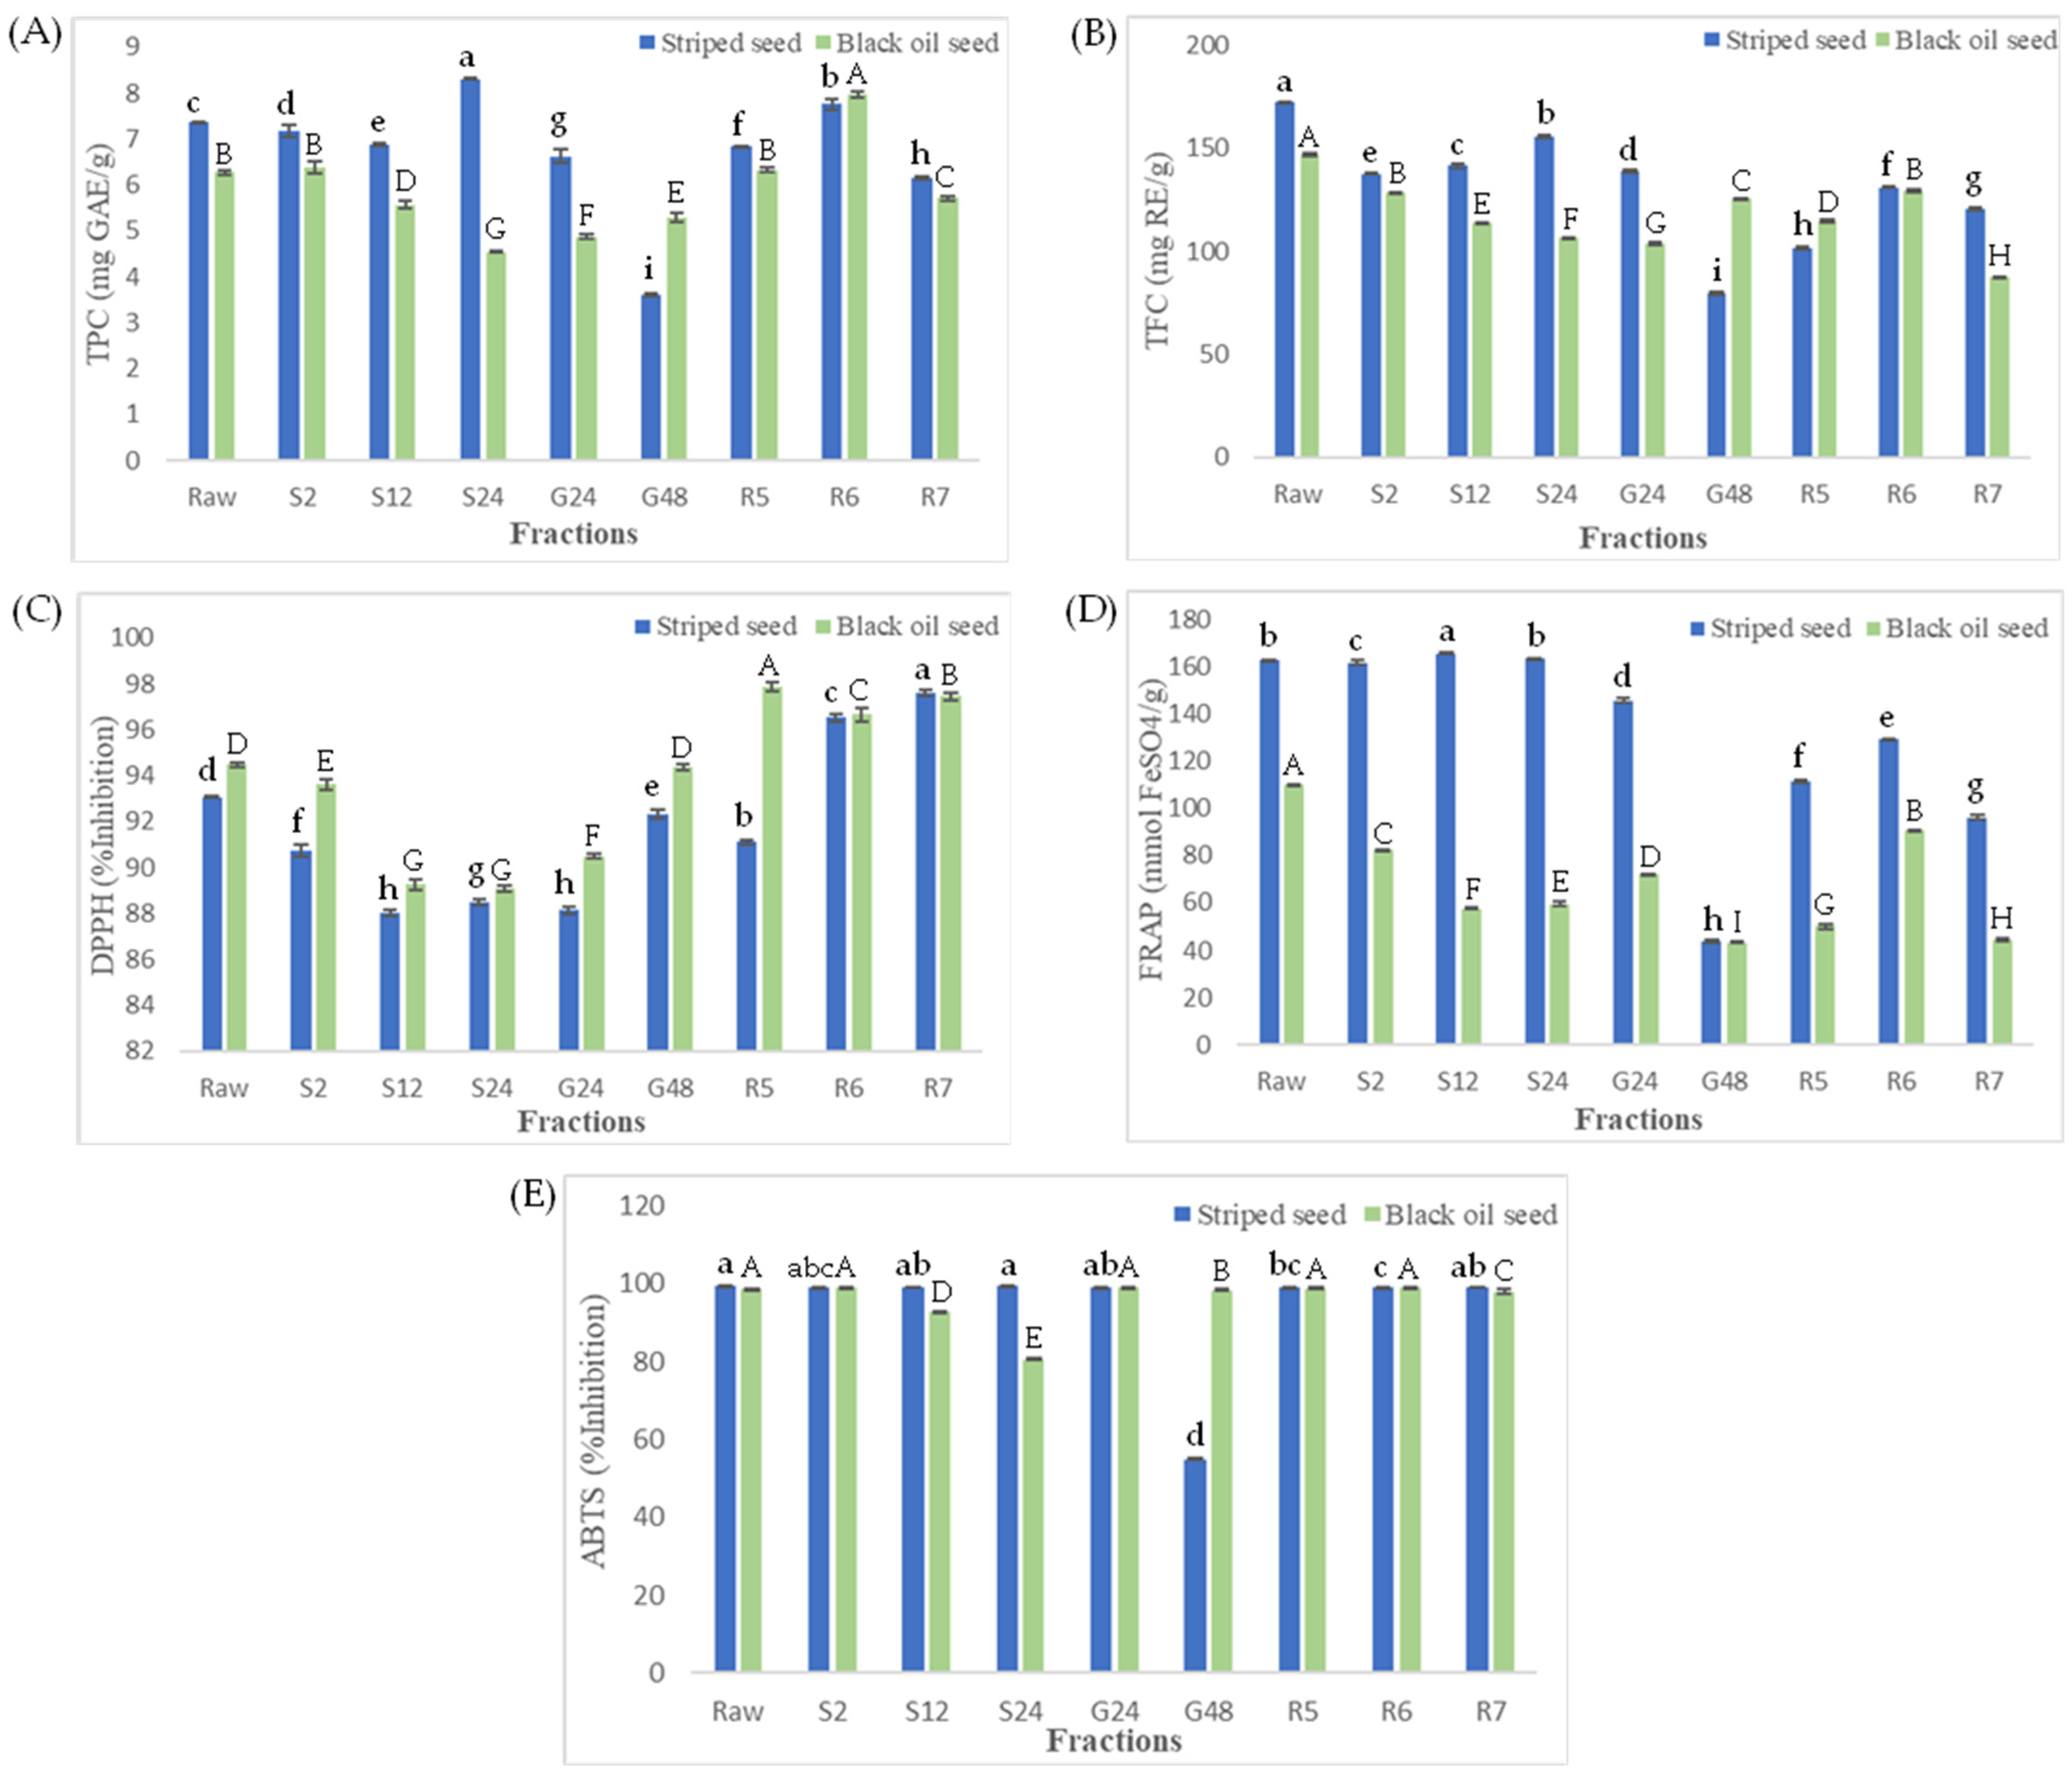
3.1. Total Phenolic and Total Flavonoid Contents

The impacts of soaking, germination, and roasting on the total phenolic (TPC) and total flavonoid (TFC) contents of sunflower seeds are depicted in Figure 1A,B. Statistical analysis revealed significant variations (p < 0.05) in TPC and TFC levels among sunflower seeds subjected to distinct processing methods. The TPC of raw and processed sunflower seeds ranged from 3.60 to 8.31 mg gallic equivalent (GAE)/g DW (Figure 1A). Our present study revealed that striped seeds soaked for 24 h had the highest TPC, whereas striped seeds germinated for 48 h had the lowest TPC (Figure 1A). Regarding soaking, it was observed that soaking of striped samples in water resulted in a significant reduction in TPC during soaking for 2 and 12 h, followed by a gradual increase after soaking for 24 h. In contrast, black oil seeds exhibited a different trend, with longer soaking times showing lower TPC, reaching the lowest level in the 24 h soaked samples (4.54 mg GAE/g). Similar findings have been reported by Kataria et al. [33] for mung beans and by Khandelwal et al. [34] for faba beans and Indian pulses, where soaking led to a decrease in phenolic content. The reduction in total phenolic compounds (TPCs) during soaking may be attributed to the leaching of certain components into the soaking water, as well as the activation of enzymes such as polyphenol oxidase, which can catalyze the degradation and loss of polyphenols [35]. Other researchers [36,37] have suggested that losses may occur due to the binding of polyphenols with other organic compounds, such as carbohydrates or proteins. Additionally, the variation in TPC between the two types of sunflower seeds suggests differences in their phenolic composition. Furthermore, decreasing the germination period to 24 and 48 h had a further decreased effect on the total polyphenols content of striped seeds but increased in black oil seeds. The phenolic content of germinated seeds in the present study was comparable to those reported by other investigators. Zhang et al. [38] found that the germination process reduced the polyphenol contents of various Indian pulse varieties. Similar results were observed by Randhir et al. [39], with germination causing a decrease in phenolic content in green mung beans. The reductions in total phenolic content (TPC) may be linked to observed increases in the activity of polyphenol oxidase and other catabolic enzymes, as noted by Huang et al. [40]. Moreover, germination duration can modulate the phenolic content of sunflower seeds differently depending on the variety. However, our findings contrast with the results reported by previous studies, which showed that the phenolic content of sunflower seeds increases during germination by 232% [9]. For roasting, the contents of total phenolic were also increased significantly during roasting for 5 and 6 min at 110 °C and then were gradually decreased after roasting for 7 min at 110 °C. This suggests that moderate roasting may enhance the phenolic content of sunflower seeds, potentially through heat-induced reactions, but prolonged roasting could lead to degradation or loss of phenolic compounds. Similar results were reported by Rizki et al. [41]. The phenolic content of sesame seeds increased with an increase in roasting time. Chandrasekara and Shahidi [42] measured the effect of roasting on the phenolic content of cashew nuts, in which TPC increased from 70.95 mg GAE/g in unroasted cashew nuts as a control to 123.30 mg GAE/g after roasting at 200 °C for 20 min. Moreover, increased levels of total phenolics content induced by heat have been observed in roasted pumpkin seeds [20] and common beans [43], kidney and pinto beans, and black-eyed peas [44].
The total flavonoid contents (TFCs) of raw and processed sunflower seeds ranged from 80 to 172 mg rutin equivalent (RE)/g DW (Figure 1B). Our present study found that raw sunflower seeds had the highest TFC, whereas striped seeds germinated for 7 min and black oil seeds roasted for 7 min had the lowest TFCs (Figure 1B). Similar results were reported by Franke et al. [45] that the content of flavonoids was decreased in legumes after processing. For soaked striped seeds, the longer soaking time showed the greater TFC, being the greatest at 24 h (156 mg RE/g), while it decreased in black oil seeds. In addition, increasing the germination time decreased TFC values for striped seeds but increased in black oil seeds. For the roasting process, the content of flavonoids also increased significantly (p < 0.05) during roasting for 5 and 6 min and then gradually decreased after roasting for 7 min. This may be caused by the biodegradation of bioactive compounds during roasting while some compounds might break down bound forms into free forms, which enhance their flavonoid content [46]. Boateng et al. [44] found that heat treatment of black-eyed peas, kidney beans, and pinto beans increased the concentrations of total flavonoids.
The findings of this study revealed a similar pattern in TPC and TFC levels during soaking, germination, and roasting processes, suggesting that these processes have a uniform effect on the overall phenolic composition of sunflower seeds. This uniformity in response highlights the robustness of these processing methods in altering the phenolic composition of sunflower seeds and emphasizes their potential significance in modulating the bioactive properties of the seeds.

3.2. Change in Antioxidant Activity

DPPH free radical scavenging activities (DPPH) of the extracts from processed sunflower seeds are presented in Figure 1C. DPPH values of the roasting process ranged from 96 to 97%, which was significantly (p < 0.05) higher than that of the soaking (88–93%) and germination (88–94%) processes. A significant decrease in the DPPH values of both seeds was observed as a result of soaking and germination. A longer soaking time showed a lower DPPH value as a result of soaked black oil seeds, being the lowest at 24 h (89% inhibition), whereas striped seeds decreased during soaking for 2 and 12 h and then slightly increased after soaking for 24 h. Xu and Chang [47] have reported that the soaking method caused a significant (p < 0.05) decrease in DPPH free radical scavenging activity in cool-season food legumes. The reduction in DPPH values was partly due to soluble antioxidants that may be leached into the soaking water. During germination, the percent inhibition of DPPH increased continuously with germination time, and 48 h provided the highest antioxidant activity at 92% and 94% inhibition for striped and black oil seeds, respectively. The reason for the increase in antioxidant activity with DPPH free radical scavenging activity during germination may be due to an increase in the activity of the enzymes’ endogenous antioxidants [8,9]. Following roasting, the seeds exhibited elevated DPPH values compared to their raw counterparts. Time appears to be a significant factor influencing this capacity. Specifically, in the case of black oil sunflower seeds, DPPH values were highest in R5, followed by R7 and R6, respectively. Conversely, for striped seeds, the order was R5 < R6 < R7, indicating that DPPH values increased with longer roasting times. Considering the optimal processing conditions to be those yielding the highest free radical scavenging activity, it can be inferred that for striped seeds, this occurs after 7 min of roasting, while for black oil seeds, it is achieved after 5 min of roasting. In addition, the increased antioxidant activity of roasted sunflower seeds may also be caused by the action of thermal denaturation of the endogenous hydrolytic enzymes, degrading the antioxidant compounds [19]. Lin et al. [46] observed that roasting increased antioxidant activity, as evidenced by increased DPPH free radical scavenging activity in almond kernels. This enhancement is likely attributed to Maillard reaction products formed during the roasting process, which can contribute to antioxidant activity. Additionally, they proposed that the DPPH radical scavenging activity of peanut kernel flour also increased following roasting [48].
The FRAP values of antioxidant extracts obtained from processed sunflower seeds are illustrated in Figure 1D. Statistically significant differences (p < 0.05) in FRAP values were observed among sunflower seeds subjected to various processing methods. After processing, the FRAP values of processed sunflower seeds were reduced in the cases of soaked, germinated, and roasted samples, except for striped seeds soaked for 12 and 24 h as compared to unprocessed sunflower seeds. The highest values were noted for striped seeds soaked for 12 h and raw black oil seeds (166 mmol FeSO4/g and 110 mmol FeSO4/g, respectively). During the germination process, FRAP values in both sunflower seeds were significantly decreased. FRAP values exhibited a significant increase (p < 0.05) during soaking for 2 and 12 h and roasting for 5 and 6 min, then gradually decreased after soaking for 24 h and roasting for 7 min. A similar result was observed by Kittibunchakul et al. [49], who found a significant increase in the FRAP after roasting of sacha inchi seeds. The generation of Maillard reaction products upon roasting, which contribute to antioxidant properties, may be the cause of the increase in FRAP levels [46]. The results of the ABTS free radical scavenging activities are illustrated in Figure 1E. The ABTS values of the extracts from the processed sunflower seeds ranged from 54.68 to 99.33%. During soaking, striped seeds had similar percent inhibition of ABTS in different processes. However, ABTS values of soaked black oil seeds significantly decreased (p < 0.05), which could be attributed to various factors, such as the leaching of phenolic compounds or the activation of enzymes that degrade antioxidants. With respect to germination, ABTS values gradually decreased and reached the lowest percent inhibition after 48 h. In the context of the roasting process, ABTS values in striped seeds did not exhibit significant differences, while in black oil seeds, ABTS values slightly decreased during roasting for 7 min, possibly due to potential heat-induced degradation of antioxidants.
The differences in ABTS results compared to DPPH and FRAP assays can be attributed to variations in the mechanisms of action, radical species targeted, sensitivity to chemical structures, and the complexity of biological systems. DPPH and ABTS assays use different radical species (DPPH and ABTS•+, respectively), which may have varying reactivities toward different types of antioxidants [50,51]. FRAP assay, although not directly measuring radical scavenging, involves the reduction of a metal ion by antioxidants, which may reflect a different aspect of antioxidant capacity compared to direct radical scavenging assays [52]. In addition, the chemical structures of antioxidants can influence their reactivity toward different radical species and assay systems. Some antioxidants may be more effective in scavenging specific radicals targeted by one assay over others.

3.3. Changes in Content and Composition of Phenolic Acids

An HPLC-DAD system was used to analyze the phenolic compounds in raw and processed sunflower seed extracts, with standard compounds used as references. Phenolic acids are hydroxylated forms of hydrocinnamic acid and hydrobenzoic acid found in plants as esters, glycosides, and bound complexes. Four hydroxybenzoic acids (HBAs) were found in the sunflower seeds: gallic acid, vanillic acid, protocatechuic acid, and p-hydroxybenzoic acid. Furthermore, a total of six hydrocinnamic acids (HCAs) were detected, namely sinapic acid, syringic acid, caffeic acid, p-coumaric acid, chlorogenic acid, and ferulic acid. In Table 2 and Table 3, the composition and concentration of phenolic acids in each sample are detailed.
HBAs were detected in raw striped sunflower seeds. However, gallic acid was only detected in raw black oil seeds. The present study found that during soaking, the concentrations of HBAs were increased in sunflower seeds. Especially protocatechuic acid significantly (p < 0.05) increased in striped seeds. However, the longer soaking times resulted in a decrease in TPC in both striped and black oil sunflower seeds. For germinated striped seeds, the longer the germination time, the lower the concentration of vanillic acid, while it was not detected in black oil seeds. The decrease in TPC during germination may be correlated with changes in the concentrations of specific phenolic compounds, influenced by enzymatic processes and metabolic activities occurring during seed germination. Roasting resulted in significant changes in both individual phenolic compounds and TPC. Gallic acid levels increased in striped sunflower seeds but decreased in black oil seeds after roasting. Likewise, roasting significantly enhanced the quantity of gallic acid in hazelnuts compared to raw hazelnuts [53]. This could be caused by the breakdown of polymerized polyphenols, particularly hydrolyzable tannins, and the hydrolysis of other glycosylated flavonoids [54]. The contents of protocatechuic acid were also increased with increasing roasting time, whereas they slightly decreased in roasted black oil seeds for 5 and 6 min and then gradually increased after being roasted for 7 min. In addition, increasing the roasting period to 5 and 6 min had a further increasing effect on the concentrations of vanillic acid in striped seeds but was not detected in striped seeds roasted for 7 min or black oil seeds.
For HCAs, six phenolic acids were detected in all fractions except chlorogenic acid, which was not identified in the striped seeds roasted for 7 min or all black oil seeds. The major phenolic acids in all fractions were ferulic acid, followed by caffeic acid. In the case of soaked sunflower seeds compared to original raw seeds, there were significant (p < 0.05) decreases in chlorogenic acid but significant increases in ferulic acid, caffeic acid, p-coumaric acid, syringic acid, and sinapic acid. Chlorogenic acid, ferulic acid, and sinapic acid in soaked seeds increased during soaking for 2 and 12 h before decreasing progressively after 24 h of soaking. On the other hand, the longer soaking time showed the greater content of p-coumaric acid, being the greatest at 24 h, while caffeic acid and syringic acid were decreased in both sunflower seeds. During 24 to 48 h of germination, chlorogenic acid, caffeic acid, syringic acid, and ferulic acid contents were gradually decreased in all samples. Falcinelliet al. [55] discovered similar findings and noted that the concentration of ferulic acid decreased during the early stages of germination of rapeseed, which is consistent with the current finding. This may be due to the cell walls being softened and some compounds, including ferulic acid, being released. In our study, the sinapic acid and p-coumaric acid contents were significantly increased (p < 0.05) after germination treatment. Interestingly, we found that the levels of ferulic acid and sinapic acid in roasted seeds increased as compared with the raw sample. The contents of ferulic acid and sinapic acid in striped seeds increased during roasting for 5 and 6 min and then gradually decreased after roasting for 7 min, while chlorogenic acid, caffeic acid, syringic acid, and p-coumaric acid concentrations decreased. In roasted black oil seeds, the content of caffeic acid, ferulic acid, syringic acid, and sinapic acid decreased with increases in heating time, but the p-coumaric acid content was slightly increased. However, since the present study measured only extractable phenolics, it must be noted that most of the phenolics present in sunflower seeds are in bound form [9]. The differences in phenolic composition and TPC seen during soaking, germination, and roasting highlight the importance of studying how processing procedures affect the bioactive properties of seeds. However, the results of each process may be inconsistent between TPC and individual phenolic acids. For instance, TPC was increased, while caffeic acid decreased with roasting in both cultivars. On the other hand, ferulic acid increased but TPC decreased with soaking in black oil seeds.

3.4. Fatty Acid Composition and Concentration

The composition of saturated fatty acids (SFAs), monounsaturated fatty acids (MUFAs), and polyunsaturated fatty acids (PUFAs) in raw and processed sunflower seed samples are shown in Table 4 for striped seeds and Supplementary Table S2 for black oil seeds. Generally, MUFAs predominate in unprocessed striped seeds, followed by PUFAs and SFAs. Hamed et al. [29] also reported the same results in Egyptian and Chinese sunflower seeds. Conversely, in unprocessed black oil seeds, PUFAs were the most dominant, followed by MUFAs and SFAs, similar to the findings of Petraruet al. [3]. The major SFAs found in all samples were palmitic acid (C16:0) and stearic acid (C18:0). During the soaking process, SFAs significantly (p < 0.05) increased in both sunflower seeds. For germination, the saturated fatty acids of all samples were decreased. In our study, palmitic acid (C16:0) was increased in all germinated sunflower seeds. Meanwhile, stearic acid (C18:0) was slightly decreased in all samples. Criste et al. [56] presented similar findings, indicating a decrease in stearic acid and an increase in palmitic acid after germination in legumes. The result was in contrast with the findings of Hahm et al. [57], who reported that germinated sesame seeds increased the level of stearic acid but reduced the level of palmitic acid. Roasting of striped samples at 110 °C resulted in a significant reduction in SFAs during roasting for 5 and 6 min, which was gradually decreased after roasting for 24 h. Unlike black oil seeds, it can be observed that the contents of SFAs were decreased during roasting for 5 and 6 min and then gradually increased after roasting for 24 h. The levels of MUFAs range from 39 to 48% in striped seeds and 30 to 33% in black oil seeds. Oleic acid (C18:1) was the most common monounsaturated fatty acid (MUFA) found in all processed seeds. Non-significant differences were found for MUFAs in all soaked seeds. During germination, MUFAs were increased in striped seeds, similar to the findings of Hahm et al. [57]. However, the level of MUFAs in germinated black oil seeds decreased. Cristeet al. [56] indicated that MUFAs were decreased in germinated legumes. In our present study, the roasting process was not affected by the percentage of MUFAs in sunflower seeds. In addition, the percentage of PUFAs was decreased in soaked striped seeds, whereas in black oil seeds, PUFAs were increased during soaking for 2 and 12 h and then gradually increased after soaking for 24 h. For germination, the longer the germination duration, the lower the PUFA content of both sunflower seeds. Similarly, Hahm et al. [57] found a reduction in PUFAs during the germination of sesame seeds. After the roasting process, PUFAs were not significantly different with increasing roasting time. Linoleic acid (C18:2) was the most common PUFA found in all samples.
The fatty acid concentrations of raw and processed sunflower seeds are shown in Table 5 for striped seeds and Supplementary Table S3 for black oil seeds. Raw samples contained predominantly oleic acid (282–837 mg/100 g) and linoleic acid (491–741 mg/100 g). The major saturated fatty acid was palmitic acid (53–77 mg/100 g). Moreover, there were rare levels of stearic acid (27–45 mg/100 g) and linolenic acid (15–30 mg/100 g). Oleic acid and linoleic acid were the predominant fatty acids in all processed samples. These results are in agreement with other reported data on the soaking and germination of legumes [56] and the roasting of almond kernels [46]. The amount of each fatty acid level in striped and black oil seeds decreased with the soaking duration (2, 12, and 24 h). Except for linolenic, germination treatment could decrease each fatty acid in the striped seeds, whereas it increased in the black oil seeds. The breakdown of lipids during germination is widely acknowledged in soybeans [58]. Hahm et al. [57] stated that the breakdown of lipids and carbohydrates during germination serves the primary function of supplying the energy needed for protein synthesis in plant development. The level of each fatty acid in striped seeds was increased during roasting for 2 and 12 h, then gradually decreased after roasting for 24 h. Unlike black oil seeds, the amount of each fatty acid was decreased during roasting for 2 and 12 h, then gradually increased after roasting for 24 h. Kita and Figureiel [59] reported that roasting increased the content of fatty acids in walnut oil. Roasting is the most common method of sunflower thermal processing. Arab et al. [60] present that the decrease in the content of fatty acids may be caused by heat processing, in which there is a breakdown of proteins in the cell membrane and the release of phospholipids. Thermal oxidation of PUFAs in oilseeds takes place during roasting [61], which may be responsible for the decrease in the levels of linoleic and linolenic acids after roasting in the present study.
The observed differences between both cultivars in the experimental outcomes could be attributed to inherent variations in the morphology and structural characteristics of the respective seed varieties [62]. These differences in seed morphology and structure may result in distinct responses to the applied processing conditions, consequently influencing the measured parameters in a disparate manner. Factors such as seed coat thickness, oil content, and internal cellular composition can vary between cultivars, potentially leading to differential interactions with the processing methods employed [9]. Consequently, these variances may contribute to the observed discrepancies in the measured phenolic composition, antioxidant activities, and fatty acid profiles between the two cultivars.

4. Conclusions

In conclusion, soaking, germination, and roasting processes significantly affected the phytochemical contents, antioxidant activities, and fatty acids of sunflower seeds. The changes depended on the processing method and processing times. From our results, soaked or roasted seeds still contained substantial amounts of TPC, TFC, and antioxidants. However, germination processes reduced TPC, TFC, phenolic acids, and antioxidant activities while increasing fatty acids. The main phenolic acids in these seeds were ferulic acid and caffeic acid. Oleic acid and linoleic acid were the predominant fatty acids in all processed samples. The results indicate that certain processing methods, particularly soaking and roasting, can improve the nutritional quality and antioxidant properties of sunflower seeds. Importantly, our results highlight the efficacy of specific processing techniques, particularly soaking striped seeds for 24 h and roasting black oil seeds for 6 min, in enhancing the nutritional quality and antioxidant properties of sunflower seeds. The exploitation of our findings could lead to the development of optimized processing techniques and functional food products fortified with sunflower seeds to offer increased health benefits to consumers. The optimized processing techniques identified in the study could also be used in commercial applications aimed at maximizing the health benefits of sunflower seeds. This could expose market opportunities for sunflower seed products targeting health-conscious consumers.

Supplementary Materials

The following supporting information can be downloaded at: https://www.mdpi.com/article/10.3390/horticulturae10040387/s1, Table S1: Moisture content (%) of sunflower seeds, Table S2: Fatty acid composition (% total fatty acids) of raw and processed black oil seeds; Table S3: Fatty acids concentrations (mg/100 g) of raw and processed black oil sunflower seeds.

Author Contributions

C.T.: data curation, formal analysis, investigation, methodology, visualization, writing—original draft. L.H. and H.W.: formal analysis, methodology, investigation. S.S. and C.P.: conceptualization, investigation, methodology, project administration, resources, supervision, writing—review and editing, funding acquisition, validation. All authors have read and agreed to the published version of the manuscript.

Funding

The Office of the Permanent Secretary of the Minister of Higher Education, Science, Research and Innovation and Mahasarakham University.

Data Availability Statement

All relevant data are within the article and the Supplementary Materials.

Acknowledgments

This research was financially supported by The Office of the Permanent Secretary of the Minister of Higher Education, Science, Research and Innovation and Mahasarakham University. The authors also thank the Laboratory Equipment Center of Mahasarakham University for cooperation and scientific aids provided.

Conflicts of Interest

Author Hu Wei was employed by the company International Cooperation Department of Lanzhi Education Foundation. The remaining authors declare that the research was conducted in the absence of any commercial or financial relationships that could be construed as a potential conflict of interest.

References

  1. de Oliveira Filho, J.G.; Egea, M.B. Sunflower seed byproduct and its fractions for food application: An attempt to improve the sustainability of the oil process. J. Food Sci. 2021, 86, 1497–1510. [Google Scholar] [CrossRef] [PubMed]
  2. Mirpoor, S.F.; Giosafatto, C.V.L.; Porta, R. Biorefining of Seed Oil Cakes as Industrial Co-Streams for Production of Innovative Bioplastics. A Review. Trends Food Sci. Tech. 2021, 109, 259–270. [Google Scholar] [CrossRef]
  3. Petraru, A.; Ursachi, F.; Amariei, S. Nutritional Characteristics Assessment of Sunflower Seeds, Oil and Cake. Perspective of Using Sunflower Oilcakes as a Functional Ingredient. Plants 2021, 10, 2487. [Google Scholar] [CrossRef]
  4. Adeleke, B.S.; Babalola, O.O. Oilseed Crop Sunflower (Helianthus annuus) as a Source of Food: Nutritional and Health Benefits. Food Sci. Nutr. 2020, 8, 4666–4684. [Google Scholar] [CrossRef]
  5. Bester, D.; Esterhuyse, A.J.; Truter, E.J.; van Rooyen, J. Cardiovascular effects of edible oils: A comparison between four popular edible oils. Nutr. Res. Rev. 2010, 23, 334–348. [Google Scholar] [CrossRef]
  6. Trumbo, P.; Schlicker, S.; Yates, A.A.; Poos, M. Nutrition Board of the Institute of Medicine Dietary reference intakes for energy, carbohydrate, fiber, fat, fatty acids, cholesterol, protein and amino acids. J. Am. Diet. Assoc. 2002, 102, 1621–1630. [Google Scholar] [CrossRef]
  7. So, V.; Poul, P.; Oeung, S.; Srey, P.; Mao, K.; Ung, H.; Eng, P.; Heim, M.; Srun, M.; Chheng, C.; et al. Bioactive Compounds, Antioxidant Activities, and HPLC Analysis of Nine Edible Sprouts in Cambodia. Molecules 2023, 28, 2874. [Google Scholar] [CrossRef] [PubMed]
  8. Gai, F.; Karamać, M.; Janiak, M.A.; Amarowicz, R.; Peiretti, P.G. Sunflower (Helianthus annuus L.) Plants at Various Growth Stages Subjected to Extraction—Comparison of the Antioxidant Activity and Phenolic Profile. Antioxidants 2020, 9, 535. [Google Scholar] [CrossRef] [PubMed]
  9. Guo, S.; Ge, Y.; Na Jom, K. A review of phytochemistry, metabolite changes, and medicinal uses of the common sunflower seed and sprouts (Helianthus annuus L.). Chem. Cent. J. 2017, 11, 95. [Google Scholar] [CrossRef] [PubMed]
  10. Alexandrino, T.D.; da Silva, M.G.; Ferrari, R.A.; Ruiz, A.L.T.G.; Duarte, R.M.T.; Simabuco, F.M.; Bezerra, R.M.N.; Pacheco, M.T.B. Evaluation of some in vitro bioactivities of sunflower phenolic compounds. Curr. Res. Food Sci. 2021, 4, 662–669. [Google Scholar] [CrossRef]
  11. Igual, M.; Martínez-Monzó, J. Physicochemical Properties and Structure Changes of Food Products during Processing. Foods 2022, 11, 2365. [Google Scholar] [CrossRef] [PubMed]
  12. Tenyang, N.; Ponka, R.; Tiencheu, B.; Tonfack Djikeng, F.; Womeni, H.M. Effect of boiling and oven roasting on some physicochemical properties of sunflower seeds produced in Far North, Cameroon. Food Sci. Nutr. 2022, 10, 402–411. [Google Scholar] [CrossRef]
  13. Alonso, R.; Aguirre, A.; Marzo, F. Effects of Extrusion and Traditional Processing Methods on Antinutrients and In Vitro Digestibility of Protein and Starch in Faba and Kidney Beans. Food Chem. 2000, 68, 159–165. [Google Scholar] [CrossRef]
  14. Abdel-Aleem, W.M.; Abdel-Hameed, S.; Latif, S. Effect of Soaking and Cooking on Nutritional and Quality Properties of Faba Bean. J. Food Dairy Sci. 2019, 10, 389–395. [Google Scholar] [CrossRef]
  15. Mecha, E.; Leitão, S.T.; Carbas, B.; Serra, A.T.; Moreira, P.M.; Veloso, M.M.; Gomes, R.; Figueira, M.E.; Brites, C.; Vaz Patto, M.C.; et al. Characterization of Soaking Process’ Impact in Common Beans Phenolic Composition: Contribute from the Unexplored Portuguese Germplasm. Foods 2019, 8, 296. [Google Scholar] [CrossRef] [PubMed]
  16. Ohanenye, I.C.; Tsopmo, A.; Ejike, C.E.C.C.; Udenigwe, C.C. Germination as a bioprocess for enhancing the quality and nutritional prospects of legume proteins. Trends Food Sci. 2020, 101, 213–222. [Google Scholar] [CrossRef]
  17. Thongchuang, M.; Kunsombat, C.; Taothong, R.; Naknawa, W.; Kraboun, K.; Ajavakom, V.; Wutipraditkul, N. Antioxidant capacity in different cultivars of sunflower sprouts and their harvesting indices. J. Appl. Sci. 2019, 18, 79–96. [Google Scholar] [CrossRef]
  18. Jan, K.; Ahmad, M.; Rehman, S.; Gani, A.; Khaqan, K. Effect of Roasting on Physicochemical and Antioxidant Properties of Kalonji (Nigella sativa) Seed Flour. J. Food Meas. Charact. 2019, 13, 1364–1372. [Google Scholar] [CrossRef]
  19. Zhang, Y.; Li, X.; Lu, X.; Sun, H.; Wang, F. Effect of Oilseed Roasting on the Quality, Flavor and Safety of Oil: A Comprehensive Review. Int. Food Res. 2021, 150, 110791. [Google Scholar] [CrossRef] [PubMed]
  20. Peng, M.; Lu, D.; Liu, J.; Jiang, B.; Chen, J. Effect of Roasting on the Antioxidant Activity, Phenolic Composition, and Nutritional Quality of Pumpkin (Cucurbita pepo L.) Seeds. Front. Nutr. 2021, 8, 647354. [Google Scholar] [CrossRef]
  21. Valdés García, A.; Beltrán Sanahuja, A.; Karabagias, I.K.; Badeka, A.; Kontominas, M.G.; Garrigós, M.C. Effect of Frying and Roasting Processes on the Oxidative Stability of Sunflower Seeds (Helianthus annuus) under Normal and Accelerated Storage Conditions. Foods 2021, 10, 944. [Google Scholar] [CrossRef] [PubMed]
  22. El-Safy, F.; Salem, R.; Ensaf Mukhtar, Y.Y. The Impact of Soaking and Germination on Chemical Composition, Carbohydrate Fractions, Digestibility, Antinutritional Factors and Minerals Content of Some Legumes and Cereals Grain Seeds. Alex. Sci. Exch. J. 2013, 34, 499–513. [Google Scholar] [CrossRef]
  23. Redondo-Cuenca, A.; Villanueva-Suárez, M.J.; Mateos-Aparicio, I. Soybean seeds and its by-product okara as sources of dietary fibre. Measurement by AOAC and Englyst methods. Food Chem. 2008, 108, 1099–1105. [Google Scholar] [CrossRef]
  24. Anwar, F.; Przybylski, R. Effect of solvents extraction on total phenolics and antioxidant activity of extracts from flaxseed (Linum usitatissimum L.). Acta Sci. Pol. Technol. Aliment. 2012, 11, 293–302. [Google Scholar] [PubMed]
  25. Tarasevičienė, Ž.; Viršilė, A.; Danilčenko, H.; Duchovskis, P.; Paulauskienė, A.; Gajewski, M. Effects of Germination Time on the Antioxidant Properties of Edible Seeds. CyTA J. Food 2019, 17, 447–454. [Google Scholar] [CrossRef]
  26. Abu Bakar, M.F.; Mohamed, M.; Rahmat, A.; Fry, J. Phytochemicals and Antioxidant Activity of Different Parts of Bambangan (Mangifera Pajang) and Tarap (Artocarpus odoratissimus). Food Chem. 2009, 113, 479–483. [Google Scholar] [CrossRef]
  27. Kubola, J.; Siriamornpun, S. Phenolic Contents and Antioxidant Activities of Bitter Gourd (Momordica Charantia L.) Leaf, Stem and Fruit Fraction Extracts In Vitro. Food Chem. 2008, 110, 881–890. [Google Scholar] [CrossRef] [PubMed]
  28. Xu, B.J.; Yuan, S.H.; Chang, S.K.C. Comparative Analyses of Phenolic Composition, Antioxidant Capacity, and Color of Cool Season Legumes and Other Selected Food Legumes. J. Food Sci. 2007, 72, S167–S177. [Google Scholar] [CrossRef]
  29. Luo, J.; Cai, W.; Wu, T.; Xu, B. Phytochemical Distribution in Hull and Cotyledon of Adzuki Bean (Vigna angularis L.) and Mung Bean (Vigna radiate L.), and Their Contribution to Antioxidant, Anti-Inflammatory and Anti-Diabetic Activities. Food Chem. 2016, 201, 350–360. [Google Scholar] [CrossRef]
  30. Wootton-Beard, P.C.; Ryan, L. Improving Public Health?: The Role of Antioxidant-Rich Fruit and Vegetable Beverages. Food Res. Int. 2011, 44, 3135–3148. [Google Scholar] [CrossRef]
  31. Bligh, E.G.; Dyer, W.J. A rapid method of total lipid extraction and purification. Can. J. Biochem. Physiol. 1959, 37, 911–917. [Google Scholar] [CrossRef]
  32. Yang, L.-F.; Siriamornpun, S.; Li, D. Polyunsaturated fatty acid content of edible insects in thailand. J. Food Lipids. 2006, 13, 277–285. [Google Scholar] [CrossRef]
  33. Kataria, A.; Chauhan, B.M.; Punia, D. Antinutrients and Protein Digestibility (In Vitro) of Mungbean as Affected by Domestic Processing and Cooking. Food Chem. 1989, 32, 9–17. [Google Scholar] [CrossRef]
  34. Khandelwal, S.; Udipi, S.A.; Ghugre, P. Polyphenols and Tannins in Indian Pulses: Effect of Soaking, Germination and Pressure Cooking. Food Res. Int. 2010, 43, 526–530. [Google Scholar] [CrossRef]
  35. Jood, S.; Chauhan, B.M.; Kapoor, A.C. Saponin Content of Chickpea and Black Gram: Varietal Differences and Effects of Processing and Cooking Methods. J. Sci. Food Agric. 1986, 37, 1121–1124. [Google Scholar] [CrossRef]
  36. Bravo, L. Polyphenols: Chemistry, Dietary Sources, Metabolism, and Nutritional Significance. Nutr. Rev. 2009, 56, 317–333. [Google Scholar] [CrossRef]
  37. Saharan, K.; Khetarpaul, N.; Bishnoi, S. Variability in Physico-Chemical Properties and Nutrient Composition of Newly Released Ricebean and Fababean Cultivars. J. Food Compos. Anal. 2002, 15, 159–167. [Google Scholar] [CrossRef]
  38. Zhang, M.; Chen, H.; Li, J.; Pei, Y.; Liang, Y. Antioxidant Properties of Tartary Buckwheat Extracts as Affected by Different Thermal Processing Methods. LWT Food Sci. 2010, 43, 181–185. [Google Scholar] [CrossRef]
  39. Randhir, R.; Lin, Y.-T.; Shetty, K. Stimulation of Phenolics, Antioxidant and Antimicrobial Activities in Dark Germinated Mung Bean Sprouts in Response to Peptide and Phytochemical Elicitors. Process Biochem. 2004, 39, 637–646. [Google Scholar] [CrossRef]
  40. Huang, J.; Qian, J.; Wang, S.; Li, Y.; Zhai, X.; Olajide, T.M.; Shen, G.X.; Liao, X. Effect of selenium biofortification on bioactive compounds and antioxidant activity in germinated black soybean. J. Food Sci. 2022, 87, 1009–1019. [Google Scholar] [CrossRef] [PubMed]
  41. Rizki, H.; Kzaiber, F.; Elharfi, M.; Ennahli, S.; Hanine, H. Effects of Roasting Temperature and Time on the Physicochemical Properties of Sesame (Sesamum Indicum .L) Seeds. Int. J. Innov. Appl. Stud. 2015, 11, 148–155. [Google Scholar]
  42. Chandrasekara, N.; Shahidi, F. Antioxidative Potential of Cashew Phenolics in Food and Biological Model Systems as Affected by Roasting. Food Chem. 2011, 129, 1388–1396. [Google Scholar] [CrossRef]
  43. Siddhuraju, P.; Becker, K. The Antioxidant and Free Radical Scavenging Activities of Processed Cowpea (Vigna unguiculata (L.) Walp.) Seed Extracts. Food Chem. 2007, 101, 10–19. [Google Scholar] [CrossRef]
  44. Boateng, J.; Verghese, M.; Walker, L.T.; Ogutu, S. Effect of Processing on Antioxidant Contents in Selected Dry Beans (Phaseolus spp. L.). LWT Food Sci. 2008, 41, 1541–1547. [Google Scholar] [CrossRef]
  45. Franke, A.A.; Custer, L.J.; Cerna, C.M.; Narala, K.K. Quantitation of Phytoestrogens in Legumes by HPLC. J. Agric. Food Chem. 1994, 42, 1905–1913. [Google Scholar] [CrossRef]
  46. Lin, J.-T.; Liu, S.-C.; Hu, C.-C.; Shyu, Y.-S.; Hsu, C.-Y.; Yang, D.-J. Effects of Roasting Temperature and Duration on Fatty Acid Composition, Phenolic Composition, Maillard Reaction Degree and Antioxidant Attribute of Almond (Prunus dulcis) Kernel. Food Chem. 2016, 190, 520–528. [Google Scholar] [CrossRef] [PubMed]
  47. Xu, B.; Chang, S.K.C. Effect of Soaking, Boiling, and Steaming on Total Phenolic Contentand Antioxidant Activities of Cool Season Food Legumes. Food Chem. 2008, 110, 1–13. [Google Scholar] [CrossRef]
  48. Win, M.M.; Abdul-Hamid, A.; Baharin, B.S.; Anwar, F.; Saari, N. Effects of Roasting on Phenolics Composition and Antioxidant Activity of Peanut (Arachis hypogaea L.) Kernel Flour. Eur. Food Res. Technol. 2011, 233, 599–608. [Google Scholar] [CrossRef]
  49. Kittibunchakul, S.; Kemsawasd, V.; Hudthagosol, C.; Sanporkha, P.; Sapwarobol, S.; Suttisansanee, U. The Effects of Different Roasting Methods on the Phenolic Contents, Antioxidant Potential, and In Vitro Inhibitory Activities of Sacha Inchi Seeds. Foods 2023, 12, 4178. [Google Scholar] [CrossRef]
  50. Shimoji, Y.; Tamura, Y.; Nakamura, Y.; Nanda, K.; Nishidai, S.; Nishikawa, Y.; Ishihara, N.; Uenakai, K.; Ohigashi, H. Isolation and Identification of DPPH Radical Scavenging Compounds in Kurosu (Japanese Unpolished Rice Vinegar). J. Agric. Food Chem. 2002, 50, 6501–6503. [Google Scholar] [CrossRef]
  51. Benzie, I.F.F.; Strain, J.J. The Ferric Reducing Ability of Plasma (FRAP) as a Measure of “Antioxidant Power”: The FRAP Assay. Anal. Biochem. 1996, 239, 70–76. [Google Scholar] [CrossRef]
  52. Zheng, L.; Zhao, M.; Xiao, C.; Zhao, Q.; Su, G. Practical problems when using ABTS assay to assess the radical-scavenging activity of peptides: Importance of controlling reaction pH and time. Food Chem. 2016, 192, 288–294. [Google Scholar] [CrossRef]
  53. Schmitzer, V.; Slatnar, A.; Veberic, R.; Stampar, F.; Solar, A. Roasting Affects Phenolic Composition and Antioxidative Activity of Hazelnuts (Corylus avellana L.). J. Food Sci. 2011, 76, S14–S19. [Google Scholar] [CrossRef]
  54. Monagas, M.; Garrido, I.; Lebrón-Aguilar, R.; Bartolome, B.; Gómez-Cordovés, C. Almond (Prunus dulcis (Mill.) D.A. Webb) Skins as a Potential Source of Bioactive Polyphenols. J. Agric. Food Chem. 2007, 55, 8498–8507. [Google Scholar] [CrossRef]
  55. Falcinelli, B.; Sileoni, V.; Marconi, O.; Perretti, G.; Quinet, M.; Lutts, S.; Benincasa, P. Germination under Moderate Salinity Increases Phenolic Content and Antioxidant Activity in Rapeseed (Brassica napus var. oleifera Del.) Sprouts. Molecules 2017, 22, 1377. [Google Scholar] [CrossRef] [PubMed]
  56. Criste, A.D.; Urcan, A.C.; Coroian, C.O.; Copolovici, L.; Copolovici, D.M.; Burtescu, R.F.; Oláh, N.K. Plant-Based Beverages from Germinated and Ungerminated Seeds, as a Source of Probiotics, and Bioactive Compounds with Health Benefits—Part 1: Legumes. Agriculture 2023, 13, 1185. [Google Scholar] [CrossRef]
  57. Hahm, T.-S.; Park, S.-J.; Martin Lo, Y. Effects of Germination on Chemical Composition and Functional Properties of Sesame (Sesamum indicum L.) Seeds. Bioresour. Technol. 2009, 100, 1643–1647. [Google Scholar] [CrossRef]
  58. Lu, J.; Cheng, J.-H.; Xu, Y.; Chen, Y.; Qian, K.; Zhang, Y. Effect of germination on nutritional quality of soybean. Food Sci. Technol. 2023, 43, e008323. [Google Scholar] [CrossRef]
  59. Kita, A.; Figiel, A. Effect of Roasting on Properties of Walnuts. Pol. J. Food Nutr. Sci. 2007, 57, 89–94. [Google Scholar]
  60. Arab, R.; Casal, S.; Pinho, T.; Cruz, R.; Freidja, M.L.; Lorenzo, J.M.; Hano, C.; Madani, K.; Boulekbache-Makhlouf, L. Effects of Seed Roasting Temperature on Sesame Oil Fatty Acid Composition, Lignan, Sterol and Tocopherol Contents, Oxidative Stability and Antioxidant Potential for Food Applications. Molecules 2022, 27, 4508. [Google Scholar] [CrossRef]
  61. Durmaz, G.; Gökmen, V. Impacts of Roasting Oily Seeds and Nuts on Their Extracted Oils. Lipid Technol. 2010, 22, 179–182. [Google Scholar] [CrossRef]
  62. Lagiso, T.M.; Singh, B.C.S.; Weyessa, B. Evaluation of sunflower (Helianthus annuus L.) genotypes for quantitative traits and character association of seed yield and yield components at Oromia region, Ethiopia. Euphytica 2021, 217, 27. [Google Scholar] [CrossRef]
Figure 1. Effect of soaking, germination, and roasting on phenolic contents (A), flavonoid (B) and antioxidant activities (DPPH radical scavenging) (C), FRAP, ferric-reducing antioxidant activity (D), and ABTS radical scavenging (E). Different letters are significantly different at p < 0.05. S2, soaked for 2 h; S12, soaked for 12 h; S24, soaked for 24 h; G24, germinated for 24 h; G48, germinated for 48 h; R5, roasted for 5 min; R6, roasted for 6 min; R7, roasted for 7 min. Different letters indicate the significant differences among treatments of each variety (a, b, etc., for striped seeds) (A, B, etc., for black oil seeds).
Horticulturae 10 00387 g001
Table 2. Hydroxybenzoic acids of sunflower seeds.
Hydroxybenzoic Acids
(mg/g DW)
Fractions
RawS2S12S24G24G48R5R6R7
Striped SeedsGA3.72 ± 0.01 dND4.31 ± 0.01 cNDND5.38 ± 0.03 b6.39 ± 0.21 a6.54 ± 0.60 a6.23 ± 0.22 a
PCCA2.80 ± 0.01 e3.54 ± 0.01 d3.97 ± 0.01 c4.34 ± 0.03 bNDND2.77 ± 0.02 e2.87 ± 0.23 e4.58 ± 0.14 a
p-OH3.49 ± 0.02 c3.98 ± 0.01 bNDND4.20 ± 0.02 aNDNDNDND
VA26.98 ± 0.23 c32.95 ± 0.41 a33.17 ± 0.33 a26.30 ± 0.40 cd31.69 ± 0.54 b6.65 ± 0.18 f18.90 ± 0.49 e25.94 ± 0.79 dND
Total37.00 ± 0.22 c40.46 ± 0.43 b41.46 ± 0.33 a30.64 ± 0.38 e35.89 ± 0.53 d12.03 ± 0.21 g28.06 ± 0.71 f35.35 ± 0.77 d10.81 ± 0.20 h
Black Oil SeedsGA5.25 ± 0.05 b5.47 ± 0.03 a5.42 ± 0.02 aNDNDND5.06 ± 0.07 c4.67 ± 0.08 d5.22 ± 0.01 b
PCCANDND4.92 ± 0.04 c7.18 ± 0.05 b7.30 ± 0.20 aND3.22 ± 0.06 d2.76 ± 0.02 e2.77 ± 0.01 e
p-OHNDNDNDNDNDNDNDNDND
VANDNDNDNDNDNDNDNDND
Total5.25 ± 0.05 g5.47 ± 0.03 f10.34 ± 0.04 a7.18 ± 0.05 e7.30 ± 0.20 deND8.28 ± 0.13 b7.43 ± 0.10 d7.99 ± 0.02 c
ND = not detectable. Means ± SD (n = 3). GA = gallic acid; PCCA = protocatechuic acid; p-OH = p-hydroxy benzoic acid; VA = vanillic acid; S2, soaked for 2 h; S12, soaked for 12 h; S24, soaked for 24 h; G24, germinated for 24 h; G48, germinated for 48 h; R5, roasted for 5 min; R6, roasted for 6 min; R7, roasted for 7 min. Significant differences in the same row are shown by different lowercase letters (p < 0.05).
Table 3. Hydroxycinnamic acids of sunflower seeds.
Hydroxycinnamic Acids (mg/g DW)Fractions
RawS2S12S24G24G48R5R6R7
Striped SeedsChA37.78 ± 0.39 b36.00 ± 0.35 d36.72 ± 0.06 c29.07 ± 0.29 e38.39 ± 0.46 a5.88 ± 0.14 h20.63 ± 0.20 f19.47 ± 0.51 gND
CFA150.98 ± 0.53 d192.01 ± 0.84 ab191.76 ± 0.77 b158.16 ± 0.26 c192.97 ± 0.89 a63.95 ± 0.63 h115.912 ± 0.56 e95.97 ± 0.34 f92.41 ± 0.16 g
SyA3.09 ± 0.01 f8.35 ± 0.21 a8.07 ± 0.04 a6.23 ± 0.10 d6.62 ± 0.06 b4.82 ± 0.04 e3.10 ± 0.06 f3.02 ± 0.23 f3.07 ± 0.01 f
p-CA3.10 ± 0.01 d3.84 ± 0.02 c4.19 ± 0.13 b4.10 ± 0.02 b4.11 ± 0.01 b4.71 ± 0.04 a2.95 ± 0.05 e2.99 ± 0.23 de3.06 ± 0.02 de
FA711.10 ± 0.61 i901.84 ± 1.02 e1123.72 ± 1.06 a894.83 ± 0.66 f755.28 ± 0.85 h88.11 ± 0.89 j1092.85 ± 0.92 c1113.26 ± 0.89 b1069.97 ± 0.67 d
SNA6.33 ± 0.09 f6.51 ± 0.11 ef8.04 ± 0.09 b6.71 ± 0.08 e6.02 ± 0.03 g7.46 ± 0.11 cd7.69 ± 0.15 c8.59 ± 0.30 a7.25 ± 0.10 d
Total912.41 ± 1.28 g1148.54 ± 0.64 d1372.50 ± 1.04 a1099.10 ± 0.64 e1003.38 ± 1.34 f174.94 ± 1.77 h1243.14 ± 0.24 b1243.31 ± 1.17 b1175.76 ± 0.60 c
Black Oil SeedsChANDNDNDNDNDNDNDNDND
CFA91.91 ± 0.96 f151.90 ± 0.45 a121.89 ± 0.35 d123.00 ± 0.59 c128.56 ± 0.52 b108.90 ± 0.73 e78.78 ± 0.43 g76.84 ± 0.09 h71.25 ± 0.42 i
SyA3.02 ± 0.01 e6.63 ± 0.11 a6.70 ± 0.05 a5.78 ± 0.02 b5.37 ± 0.10 c5.02 ± 0.04 d2.87 ± 0.02 h2.84 ± 0.01 h2.89 ± 0.01 h
p-CA2.94 ± 0.01 d3.68 ± 0.02 c3.91 ± 0.01 b3.90 ± 0.01 b3.90 ± 0.05 b5.30 ± 0.06 a2.76 ± 0.01 i2.83 ± 0.01 f2.89 ± 0.01 e
FA795.28 ± 0.57 f929.18 ± 0.91 d941.11 ± 0.61 c593.71 ± 0.87 g583.62 ± 0.84 h578.78 ± 0.84 i1048.79 ± 0.95 a987.55 ± 0.83 b844.08 ± 0.68 e
SNA5.23 ± 0.04 h5.90 ± 0.02 e6.66 ± 0.06 c5.58 ± 0.09 g5.51 ± 0.03 g6.07 ± 0.04 d7.47 ± 0.29 a7.03 ± 0.31 b5.84 ± 0.03 f
Total898.38 ± 1.54 f1097.29 ± 1.27 c1080.27 ± 0.27 b732.01 ± 0.99 g726.98 ± 1.20 h674.07 ± 1.57 i1140.47 ± 1.14 a1077.10 ± 1.20 d926.95 ± 0.34 e
ND = not detectable. Means ± SD (n = 3). ChA = chlorogenic acid; VA = vanillic acid; CFA = caffeic acid; SyA = syringic acid; p-CA = p-Coumaric acid; FA = ferulic acid; SNA = sinapic acid. S2, soaked for 2 h; S12, soaked for 12 h; S24, soaked for 24 h; G24, germinated for 24 h; G48, germinated for 48 h; R5, roasted for 5 min; R6, roasted for 6 min; R7, roasted for 7 min. Significant differences in the same row are shown by different lowercase letters (p < 0.05).
Table 4. Fatty acid composition (% total fatty acids) of raw and processed striped seeds.
FractionsFatty Acid Composition (%)
16:018:018:118:218:3ΣSFAΣMUFAΣPUFATotal
Raw4.42 ± 0.08 c2.59 ± 0.07 c48.25 ± 0.19 a42.74 ± 0.38 f1.72 ± 0.07 a7.01 ± 0.15 cde48.25 ± 0.19 a44.46 ± 0.44 e100
S2 4.37 ± 0.06 c2.46 ± 0.02 d46.50 ± 0.60 b45.58 ± 0.58 c1.09 ± 0.02 f6.83 ± 0.08 e46.50 ± 0.60 b46.83 ± 0.56 c100
S124.42 ± 0.05 c2.76 ± 0.01 c47.09 ± 0.30 b44.44 ± 0.24 de1.30 ± 0.04 d7.18 ± 0.06 cd47.09 ± 0.30 b45.73 ± 0.26 d100
S244.72 ± 0.17 b3.03 ± 0.01 a46.53 ± 0.32 b44.14 ± 0.36 e1.58 ± 0.01 b7.75 ± 0.18 a46.53 ± 0.32 b45.72 ± 0.35 d100
G245.13 ± 0.08 a2.59 ± 0.03 c38.67 ± 0.57 d52.95 ± 0.54 a0.66 ± 0.01 g7.72 ± 0.11 a38.67 ± 0.57 d53.61 ± 0.54 a100
G484.37 ± 0.04 c2.63 ± 0.04 c46.55 ± 0.38 b45.11 ± 0.38 cd1.35 ± 0.02 c6.99 ± 0.08 de46.55 ± 0.38 b46.46 ± 0.40 c100
R54.71 ± 0.01 b2.73 ± 0.06 b44.96 ± 0.42 c46.31 ± 0.40 b1.29 ± 0.01 d7.44 ± 0.05 b44.96 ± 0.42 c47.60 ± 0.39 b100
R64.45 ± 0.11 c2.60 ± 0.07 c45.59 ± 0.27 c46.31 ± 0.07 b1.05 ± 0.03 f7.05 ± 0.18 cd45.59 ± 0.27 c47.36 ± 0.10 b100
R74.59 ± 0.03 b2.62 ± 0.01 b45.10 ± 0.30 c46.50 ± 0.31 b1.18 ± 0.02 e7.22 ± 0.02 c45.10 ± 0.30 c47.68 ± 0.29 b100
Values are expressed as mean ± SD (n = 3) of triplicate measurement. Superscripts with different letters are significantly different at p < 0.05 within the same column. S2, soaked for 2 h; S12, soaked for 12 h; S24, soaked for 24 h; G24, germinated for 24 h; G48, germinated for 48 h; R5, roasted for 5 min; R6, roasted for 6 min; R7, roasted for 7 min.
Table 5. Fatty acids concentrations (mg/100 g) of raw and processed striped sunflower seeds.
FractionsFatty Acids Concentrations (mg/100 g)
16:018:018:118:218:3ΣSFAΣMUFAΣPUFATotal
Raw76.64 ± 0.30 e44.85 ± 0.58 e836.52 ± 12.56 d740.96 ± 7.95 e29.74 ± 0.74 a121.49 ± 0.88 d836.52 ± 12.56 d770.70 ± 7.55 d1728.71 ± 16.95 d
S2 84.33 ± 0.97 c47.48 ± 0.32 d897.70 ± 11.04 c880.07 ± 13.82 c21.09 ± 0.31 d131.81 ± 1.30 c897.70 ± 11.04 c901.16 ± 13.51 c1930.68 ± 9.99 c
S1267.42 ± 0.97 f42.03 ± 0.29 f717.82 ± 12.70 e677.36 ± 4.14 f19.75 ± 0.50 e109.45 ± 1.22 e717.82 ± 12.70 e697.10 ± 3.95 e1524.37 ± 17.47 e
S2419.99 ± 0.69 i12.84 ± 0.05 i197.11 ± 1.11 h186.97 ± 1.84 g6.71 ± 0.05 i32.84 ± 0.73 h197.11 ± 1.11 h193.68 ± 1.79 h423.63 ± 0.68 h
G24153.57 ± 1.84 a77.63 ± 0.53 a1158.22 ± 21.94 a1586.01 ± 35.47 a19.63 ± 0.21 f231.21 ± 2.30 a1158.22 ± 21.94 a1605.64 ± 35.62 a2995.07 ± 47.80 a
G4882.65 ± 0.16 d49.69 ± 0.30 c881.10 ± 11.64 c853.78 ± 11.56 d25.61 ± 0.57 b132.34 ± 0.33 c881.10 ± 11.64 c879.39 ± 12.11 c1892.83 ± 18.66 c
R537.63 ± 0.15 h21.80 ± 0.45 h359.15 ± 3.83 g369.97 ± 2.70 h10.34 ± 0.09 h59.43 ± 0.31 g359.15 ± 3.83 g380.31 ± 2.65 g798.89 ± 1.28 g
R6104.81 ± 0.66 b61.30 ± 0.58 b1074.45 ± 26.93 b1091.42 ± 19.18 b24.85 ± 0.26 c166.11 ± 1.23 b1074.45 ± 26.93 b1116.27 ± 19.02 b2356.83 ± 44.88 b
R764.65 ± 0.35 g36.93 ± 0.20 g634.63 ± 4.92 f654.25 ± 3.70 f16.63 ± 0.30 g101.57 ± 0.24 f634.63 ± 4.92 f670.88 ± 3.44 f1407.08 ± 1.48 f
Values are expressed as mean ± SD (n = 3) of triplicate measurement. Superscripts with different letters are significantly different at p < 0.05 within the same column. S2, soaked for 2 h; S12, soaked for 12 h; S24, soaked for 24 h; G24, germinated for 24 h; G48, germinated for 48 h; R5, roasted for 5 min; R6, roasted for 6 min; R7, roasted for 7 min.
Disclaimer/Publisher’s Note: The statements, opinions and data contained in all publications are solely those of the individual author(s) and contributor(s) and not of MDPI and/or the editor(s). MDPI and/or the editor(s) disclaim responsibility for any injury to people or property resulting from any ideas, methods, instructions or products referred to in the content.

