Article

Identification, Classification, and Expression Analysis of Leucine-Rich Repeat Extensin Genes from Brassica rapa Reveals Salt and Osmosis Stress Response Genes

College of Horticulture Science and Engineering, Shandong Agricultural University, Tai’an 271018, China
*
Author to whom correspondence should be addressed.
These authors contributed equally to this work.
Horticulturae 2024, 10(6), 571; https://doi.org/10.3390/horticulturae10060571
Submission received: 20 April 2024 / Revised: 23 May 2024 / Accepted: 24 May 2024 / Published: 30 May 2024

Abstract

:
Leucine-rich repeat extensin (LRX) is involved in the regulation of crucial cellular processes, such as cell wall growth and development, as well as signaling. However, the presence of the LRX gene family in Brassica rapa (B. rapa) has not been previously reported. This study identified 17 BrLRXs within the Brassica rapa genome by bioinformatic analysis, and these genes were distributed on seven chromosomes. Phylogenetic and covariance analyses indicate that BrLRXs can be categorized into two distinct branches: the trophic branch and the reproductive branch, with a close relationship observed between BrLRXs and AtLRXs. According to cis-acting element analysis, this gene family is rich in hormone-responsive and stress-responsive elements such as drought-inducibility, abscisic acid, methyl jasmonate, and gibberellic acid responsive elements, suggesting a potential role in abiotic stress response. Transcriptomic, proteomic, and RT-qPCR analyses demonstrated significant up-regulation of BrLRX2 and BrLRX6 under salt stress, while BrLRX3, BrLRX6, and BrLRX8 were significantly down-regulated under osmotic stress. Our analysis of the protein tertiary structure predicts a strong association between LRX proteins and RALF. Protein–protein interaction prediction revealed that LRX interacts with the RALF protein and the receptor FER, which have been previously reported to jointly regulate plant stress responses. We propose that BrLRX6 and BrLRX8 are implicated in osmotic stress, while BrLRX2 and BrLRX6 are involved in the modulation of salt stress.

1. Introduction

Leucine-rich repeat extensins (LRXs) are a family of cell wall proteins that are widespread in plants, and they belong to the hydroxyproline-rich glycoprotein (HRGP) family. The N-terminus of this family of genes is a key component of Leu-rich repeat (LRR) proteins, and the C-terminus has an extended domain [1,2,3], which is characteristic of HRGPs [4]. LRRs play various roles in protein–protein interactions (PPIs) [5]. Receptor kinases often contain extracellular LRRs, which are thought to be involved in signaling during development [6,7,8,9], such as in the response to abscisic acid (ABA) signaling. The LRR-rich receptor-like protein kinase FaRIPK1 has been shown to regulate the ripening of Fragaria ananassa fruit by interacting with ABA receptors [10], and LRR-rich receptor-like kinase 1 (RPK1) is involved in ABA signaling pathways during early ABA perception in Arabidopsis thaliana [11]. In addition, LRRs have been shown to potentially mediate pathogen recognition and defense [12]. Extensin proteins are a class of cell wall proteins [13,14] that strengthen the structure of the cell wall by cross-linking with other components of the cell wall to affect its properties [14,15]; these proteins have also been shown to respond to wounding and tensile stress [16] and have a protective function [17]. Extensin proteins are associated with cell morphogenesis and fixation [18,19]. Thus, the two characteristic structures of LRX proteins are involved in a wide range of processes.
LRXs have been identified in a variety of plants, including A. thaliana [20], Oryza sativa (rice) [20], Zea mays (maize) [1,21], and Solanum lycopersicum (tomato) [22]. A total of 11 LRX genes have been identified in A. thaliana, and these can be divided into two groups depending on their phylogenetic relationships and expression patterns: the reproductive group and the trophic group. The trophic group includes LRX1-7 in A. thaliana; these genes are mainly expressed in various sporophyte tissues. The reproductive group includes LRX8-11 in A. thaliana, which is also known as PEX1-4; these genes are specifically expressed in pollen [20]. The differentiation of these two lineages occurred prior to the differentiation of monocotyledons from dicotyledons, and plants differentiated independently.
LRX genes have been reported to have diverse functions in plants. LRXs have been shown to be involved in signaling processes in responses to abiotic stress. In A. thaliana, LRXs, RALF, and FER act jointly in a neural signaling pathway in response to salt stress [23]. LRX has also been shown to play a role in pollen tube elongation, cell wall growth, and wound regulation. In A. thaliana, LRX1 is involved in root hair morphogenesis [2] and acts together with LRX2 to promote proper cell wall development [24]. LRX3, LRX4, and LRX5 are important for normal plant development and cell wall development [25], and LRX8-11 acts synergistically to maintain the integrity of pollen tube cell walls [26,27]. Other LRXs function in cell wall–plasma membrane communication [28]. The LRX gene PEX1 (ZmPEX1) in Zea mays is localized to the intine in mature pollen and the callosic sheath of the pollen tube wall in germinated pollen, and it plays a role in pollen tube growth [21]. LeLRX1 (TOML-4) mRNA accumulates in tomatoes upon wounding and might be associated with wounding regulation [22].
Brassica rapa (B. rapa) is an economically important vegetable that is widely grown in Asia, and its yield is affected by various types of abiotic stress, especially salt stress and osmotic stress. LRX genes involved in abiotic stress responses have been identified in other plants; however, they have not been identified in B. rapa to date. In this study, we identified 17 BrLRXs and analyzed their promoter elements, expression profiles, PPI relationships, and expression patterns under salt and osmotic stress. The results of this study will aid future functional studies of BrLRXs.

2. Materials and Methods

2.1. Identification of LRX Genes in the B. rapa Genome

A total of 11 AtLRXs were identified based on previous research [20] and a search in the UniProt database (https://www.uniprot.org, accessed on 2 March 2024). The B. rapa genome data file was extracted from BRAD (http://brassicadb.cn/, accessed on 2 March 2024), and the A. thaliana genome data file was extracted from TAIR (http://www.Arabidopsis.org, accessed on 2 March 2024). Predicted LRX genes were screened using TBtools (v1.120) [29], and genes without domains were eliminated. A total of 17 LRX genes were identified. In the B. rapa genome database, chromosome location information was retrieved from genome annotation files. The length (aa), molecular mass (Da), and isoelectric point (pI) of the proteins encoded by the LRX genes were obtained from ExPASy [30] (https://web.expasy.org/protparam/, accessed on 8 March 2024). Subcellular localization data were obtained from PSORT (https://wolfpsort.hgc.jp/, accessed on 10 March 2024).

2.2. Chromosomal Localization, Synteny, and Phylogenetic Analysis

The locations of LRX genes on the B. rapa chromosome were determined from the B. rapa gff3 genome annotation information using TBtools (v1.120) software, and the chromosome density was calculated using the Gene Density Profile plug-in in TBtools (v1.120) with default settings. Names for BrLRXs were assigned based on their chromosomal locations.
Collinearity relationships between duplicate genes within B. rapa and between species were analyzed and visualized using data from B. rapa and A. thaliana with the Dual Systeny Plot plug-in, Advanced Circos plug-in, and Table row extract or filter plug-in in TBtools (v1.120) software.
Based on the complete amino acid sequences of BrLRXs and AtLRXs, maximum likelihood trees were constructed using MEGA 11 [31] with default parameters; 1000 bootstrap replicates were used to evaluate branch support. Phylogenetic trees were made using iTOL (https://itol.embl.de/, accessed on 10 March 2024).

2.3. Motif, Gene Structure, and Conserved Domain Analysis

Conserved motifs were analyzed using the Simple MEME Wrapper in TBtools (v1.120) with default parameter settings, with the exception of the Number of Motifs, which was set to 10. NCBI’s Batch CD-Search (https://www.ncbi.nlm.nih.gov, accessed on 8 March 2024) was used to identify conserved domains, and these were visualized using “Visualize Pfam Domain Pattern” (from Pfam Search) in TBtools.

2.4. Cis-Acting Element Analysis

Cis-acting elements in BrLRX promoter sequences 2000 bp upstream of the CDS were predicted using the GXF Sequences Extract tool in TBtools (v1.120) with default parameters. The PlantCARE database [32] (PlantCARE, a database of plant promoters and their cis-acting regulatory elements (ugent.be) accessed on 9 March 2024) was used to analyze the BrLRX promoter sequences. The results were visualized using TBtools (v1.120).

2.5. Tissue-Specific Expression and GO Analysis

Tissue-specific expression data for callus, flower, leaf, root, silique, and stem tissues from BRAD (http://brassicadb.cn/, accessed on 10 March 2024) were analyzed using TBtools (v1.120).
The GO is a terminology standard used globally to describe the functions of genes and gene products in organisms. We performed functional enrichment tests on the candidate genes using the GO analysis online server, g:Profiler (https://biit.cs.ut.ee/gprofiler/gost/, accessed on 12 March 2024) [33].

2.6. Stress Treatments and Transcriptome, Proteome, and RT-qPCR Analysis

We sowed seeds in an incubator (RXZ Intelligent Artificial Climate Chamber, Model: RXZ-1000F-4) using MS-modified medium (containing vitamins, sucrose, and agar) (PM10121-307) at temperature of 24 °C, relative humidity: 67%, light for 16 h, darkness for 8 h. We selected six-leaf seedlings with similar growth status, and the seedlings were placed in a hydroponic system under salt stress (150 mM NaCl) and osmosis stress (15% PEG6000); control (CK) seedlings were grown in the absence of stress. Materials that had been treated with salt stress for 12 h, and osmosis stress for 6 h, were used for transcriptome and proteome analysis. BrLRX genes were subjected to paired-end (PE) sequencing using next-generation sequencing (NGS) with the Illumina HiSeq sequencing platform by BioMarker Technologies (Beijing, China), and three biological replicates were collected for each sample. RT-qPCR experiments were conducted using samples exposed to stress treatment for 4 h, 6 h, and 12 h. Each treatment was replicated at least three times, and samples were stored at −80 °C.
A FastPure® Cell/Tissue Total RNA Isolation Kit V2 was used to extract total RNA from cells and tissues (Vazyme Biotech Co., Ltd., Nanjing, China). The primer sequences were derived from the qPrimerDB-qPCR Primer Database (https://biodb.swu.edu.cn/qprimerdb/, accessed on 14 March 2024). The primer sequences for RT-qPCR are listed in Table S5. Utilizing TransScript®Uni All-in-One First-Strand cDNA Synthesis SuperMix, the RNA samples underwent reverse transcription. A qTOWER3 qPCR machine was used for the RT-qPCR reaction with TransStart®Green qPCR SuperMix (TransGen Biotech, Beijing, China); BrGAPDH was used as the internal reference gene, and three technical replicates were performed. The data were analyzed using the 2−∆∆CT method and plotted using Excel 2020.

2.7. PPI Network Analysis

PPI network analysis was conducted using STRING (https://cn.string-db.org/, accessed on 16 March 2024) with default parameters, and Cytoscape v3.9.1 [34] was used to construct the interaction network.

2.8. Protein Secondary and Tertiary Structure Analysis

A tool for predicting protein secondary structures was used (https://predictprotein.org/, accessed on 15 March 2024), and Excel 2016 was used to analyze the results and make plots. SWISS-MODEL (https://swissmodel.expasy.org/, accessed on 17 March 2024) was used to predict and analyze the tertiary structure of BrLRXs.

3. Results

3.1. Identification and Analysis of BrLRX Family Genes

Eighteen genes were obtained from the known AtLRX genes and the B. rapa genome database for homology comparison. After domain analysis, a gene member that did not contain the PLN00113 domain was found and deleted, which resulted in a total of 17 predicted LRX genes. These genes were named according to their chromosomal distribution. The gene name, gene ID, chromosome position, isoelectric point (pI), molecular weight (MW), protein length, subcellular localization, homologous IDs of AtLRXs, and names of homologous genes are shown in Table 1. The pI ranged from 4.91 (BrLRX11) to 8.48 (BrLRX14); the MW ranged from 125,711.55 Da (BrLRX5) to 46,466.39 Da (BrLRX11). The protein length ranged from 419 aa (BrLRX11) to 1153 aa (BrLRX5) and was linearly positively correlated with MW. Most genes were predicted to be localized to the extracellular space; a few genes were predicted to be localized to the extracellular space, as well as the chloroplast, nucleus, and vacuolar membrane.

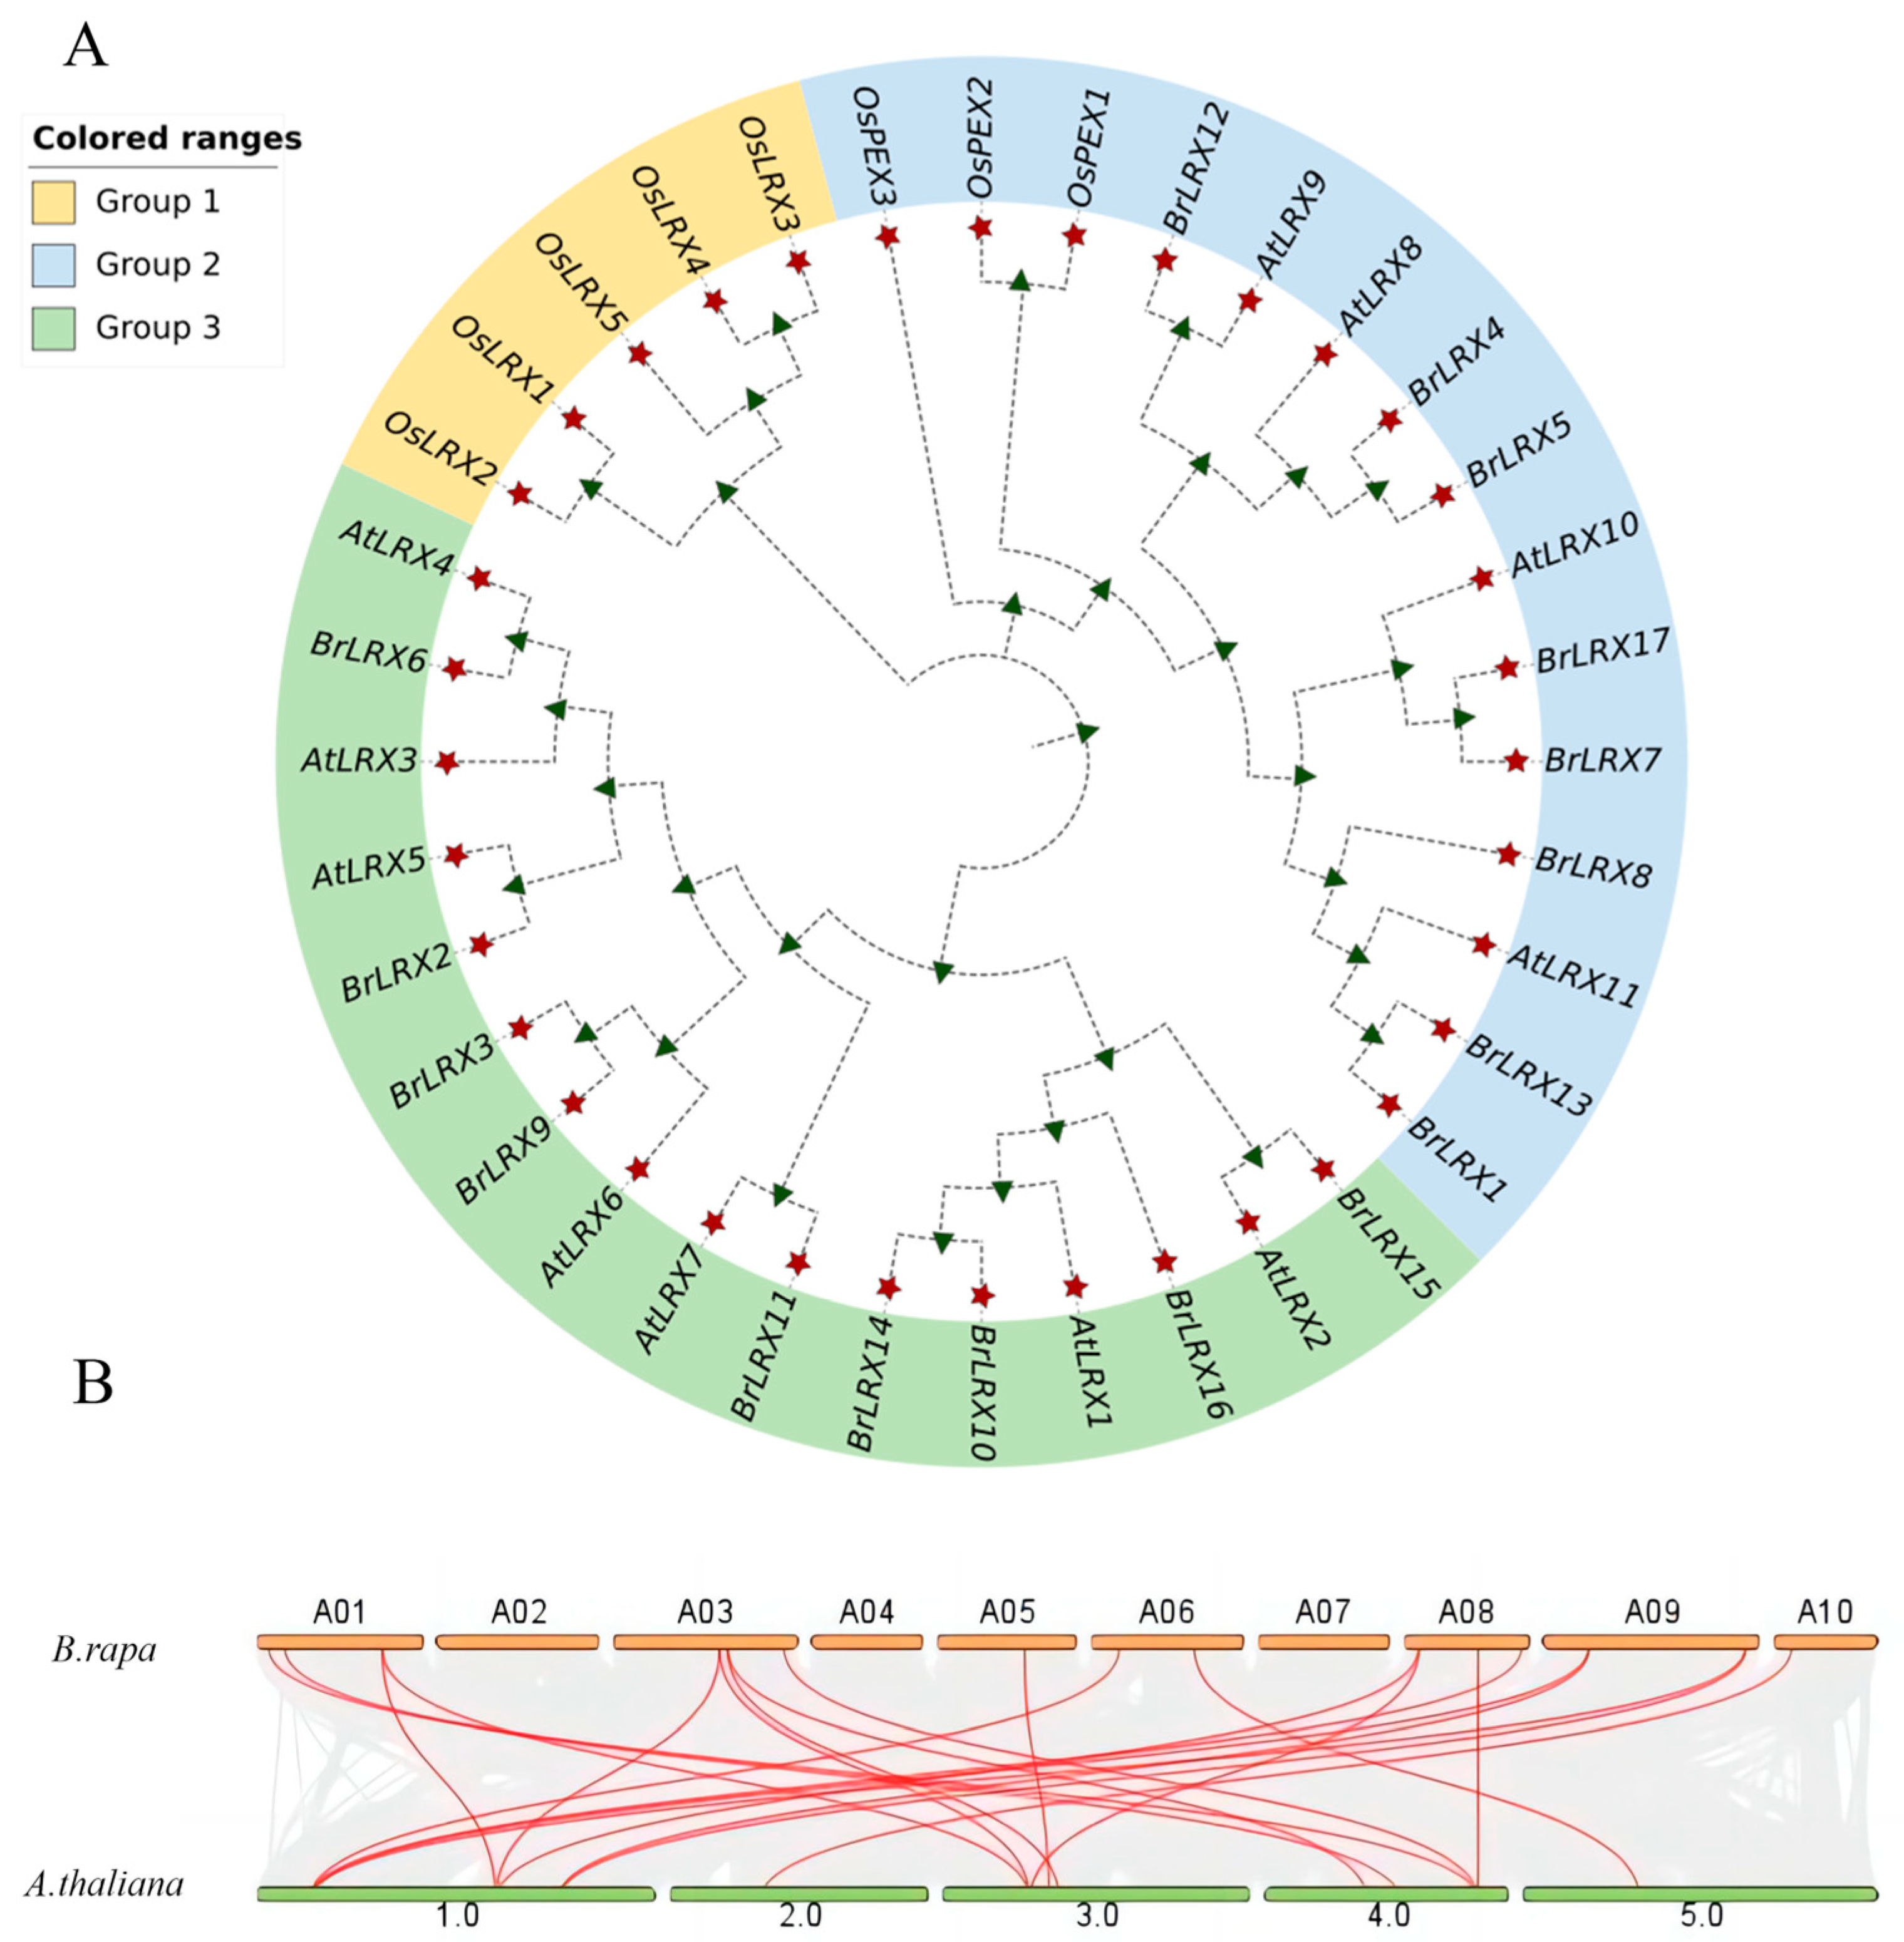
3.2. Chromosomal Localization, Synteny, and Phylogenetic Analysis of BrLRXs

Chromosomal mapping analysis of the BrLRX genes revealed a total of 17 BrLRXs distributed on seven chromosomes (Figure 1). The highest number of BrLRX genes (four) was observed on chromosomes 1 and 3. Three BrLRX genes were observed on chromosome 8; chromosomes 6 and 9 each contained two BrLRX genes, and chromosomes 3 and 10 each contained one BrLRX gene. Chromosomes 1, 2, and 6 each contained one BrLRX gene. BrLRX3 and BrLRX4, and BrLRX5, BrLRX6, and BrLRX7 were found in close proximity to each other on chromosomes 1 and 3, respectively, indicating that these genes are tandem duplicates. We also conducted collinearity analysis of the LRX genes of B. rapa and A. thaliana, and 21 collinear pairs were identified between these two species, indicating that BrLRX and AtLRX genes are closely related.
To analyze the evolutionary relationships among LRX genes, we constructed phylogenetic trees of A. thaliana, B. rapa, and O. sativa using the maximum likelihood method. As shown in the figure below, we divided the LRX genes of the three species into three groups based on their evolutionary relationships: Group 1 (yellow), Group 2 (blue), and Group 3 (green). Group 1 contains five genes from all the trophic branches of the OsLRX family, which do not belong to the same branch as the LRX genes in A. thaliana and B. rapa, and have low homology. Group 2 contains 15 genes from all the reproductive branches of three species, and PEXs in A. thaliana and O. sativa were associated with pollen tube growth. Group 3 contains 16 genes belonging to the trophic branches of LRXs in A. thaliana and B. rapa. Unlike O. sativa, which comprises a separate branch, the trophic LRX genes of these two species show high homology (Figure 2A).
We examined collinearity relationships between the BrLRX genes and genes of A. thaliana (Figure 2B). We observed strong collinearity relationships between 15 BrLRXs and 11 genes in A. thaliana.

3.3. Motif Analysis, Gene Structure, and Conserved Domain Analysis of BrLRXs

The structural features of BrLRXs were comprehensively analyzed by characterizing the structure of exons (Figure 3B). Small differences in exon structure were observed between BrLRX genes, and the number of exons ranged from one to three, suggesting that no major differentiation was observed within the BrLRX family.
Phylogenetic analyses revealed that BrLRXs had different conserved motifs (Figure 3A, C and Table 2), but all contained Motifs 1–5 and Motifs 7–8. Ten genes (BrLRX 1, 2, 4, 5, 6, 7, 8, 11, 13, 17) contained Motif 9, and seven of these BrLRXs contained Motif 7 and Motif 9; BrLRX13 contained Motif 8 in addition to Motif 9. A total of 11 BrLRXs (BrLRX 1, 4, 5, 7, 8, 12, 13, 14, 15, 16, 17) contained Motif 6; and Motif 10 was present in BrLRX 1, 4, 5, 7, 8, 12, 13, 14, 15, 17.
The number of conserved motifs in each BrLRX gene ranges from 6 to 10. Most BrLRX genes have 7 to 10 motifs; however, BrLRX3, 9 have only six conserved motifs. These findings strongly suggest that Motifs 1–5 and Motifs 7–8 are the most conserved structural units in the BrLRX gene family. Thus, the structural motifs are arranged differently among members of the BrLRX gene family but are highly similar among closely related genes.
The BrLRX gene encodes a protein with a major conserved structural domain (structural domain PLN00113). Similar protein structures were observed in the BrLRX family, as evidenced by their placement in the same phylogenetic branch, suggesting that they have a common function (Figure 3C). Conserved amino acids were present in all BrLRX motifs, which indicates that these amino acids play important roles in protein function.

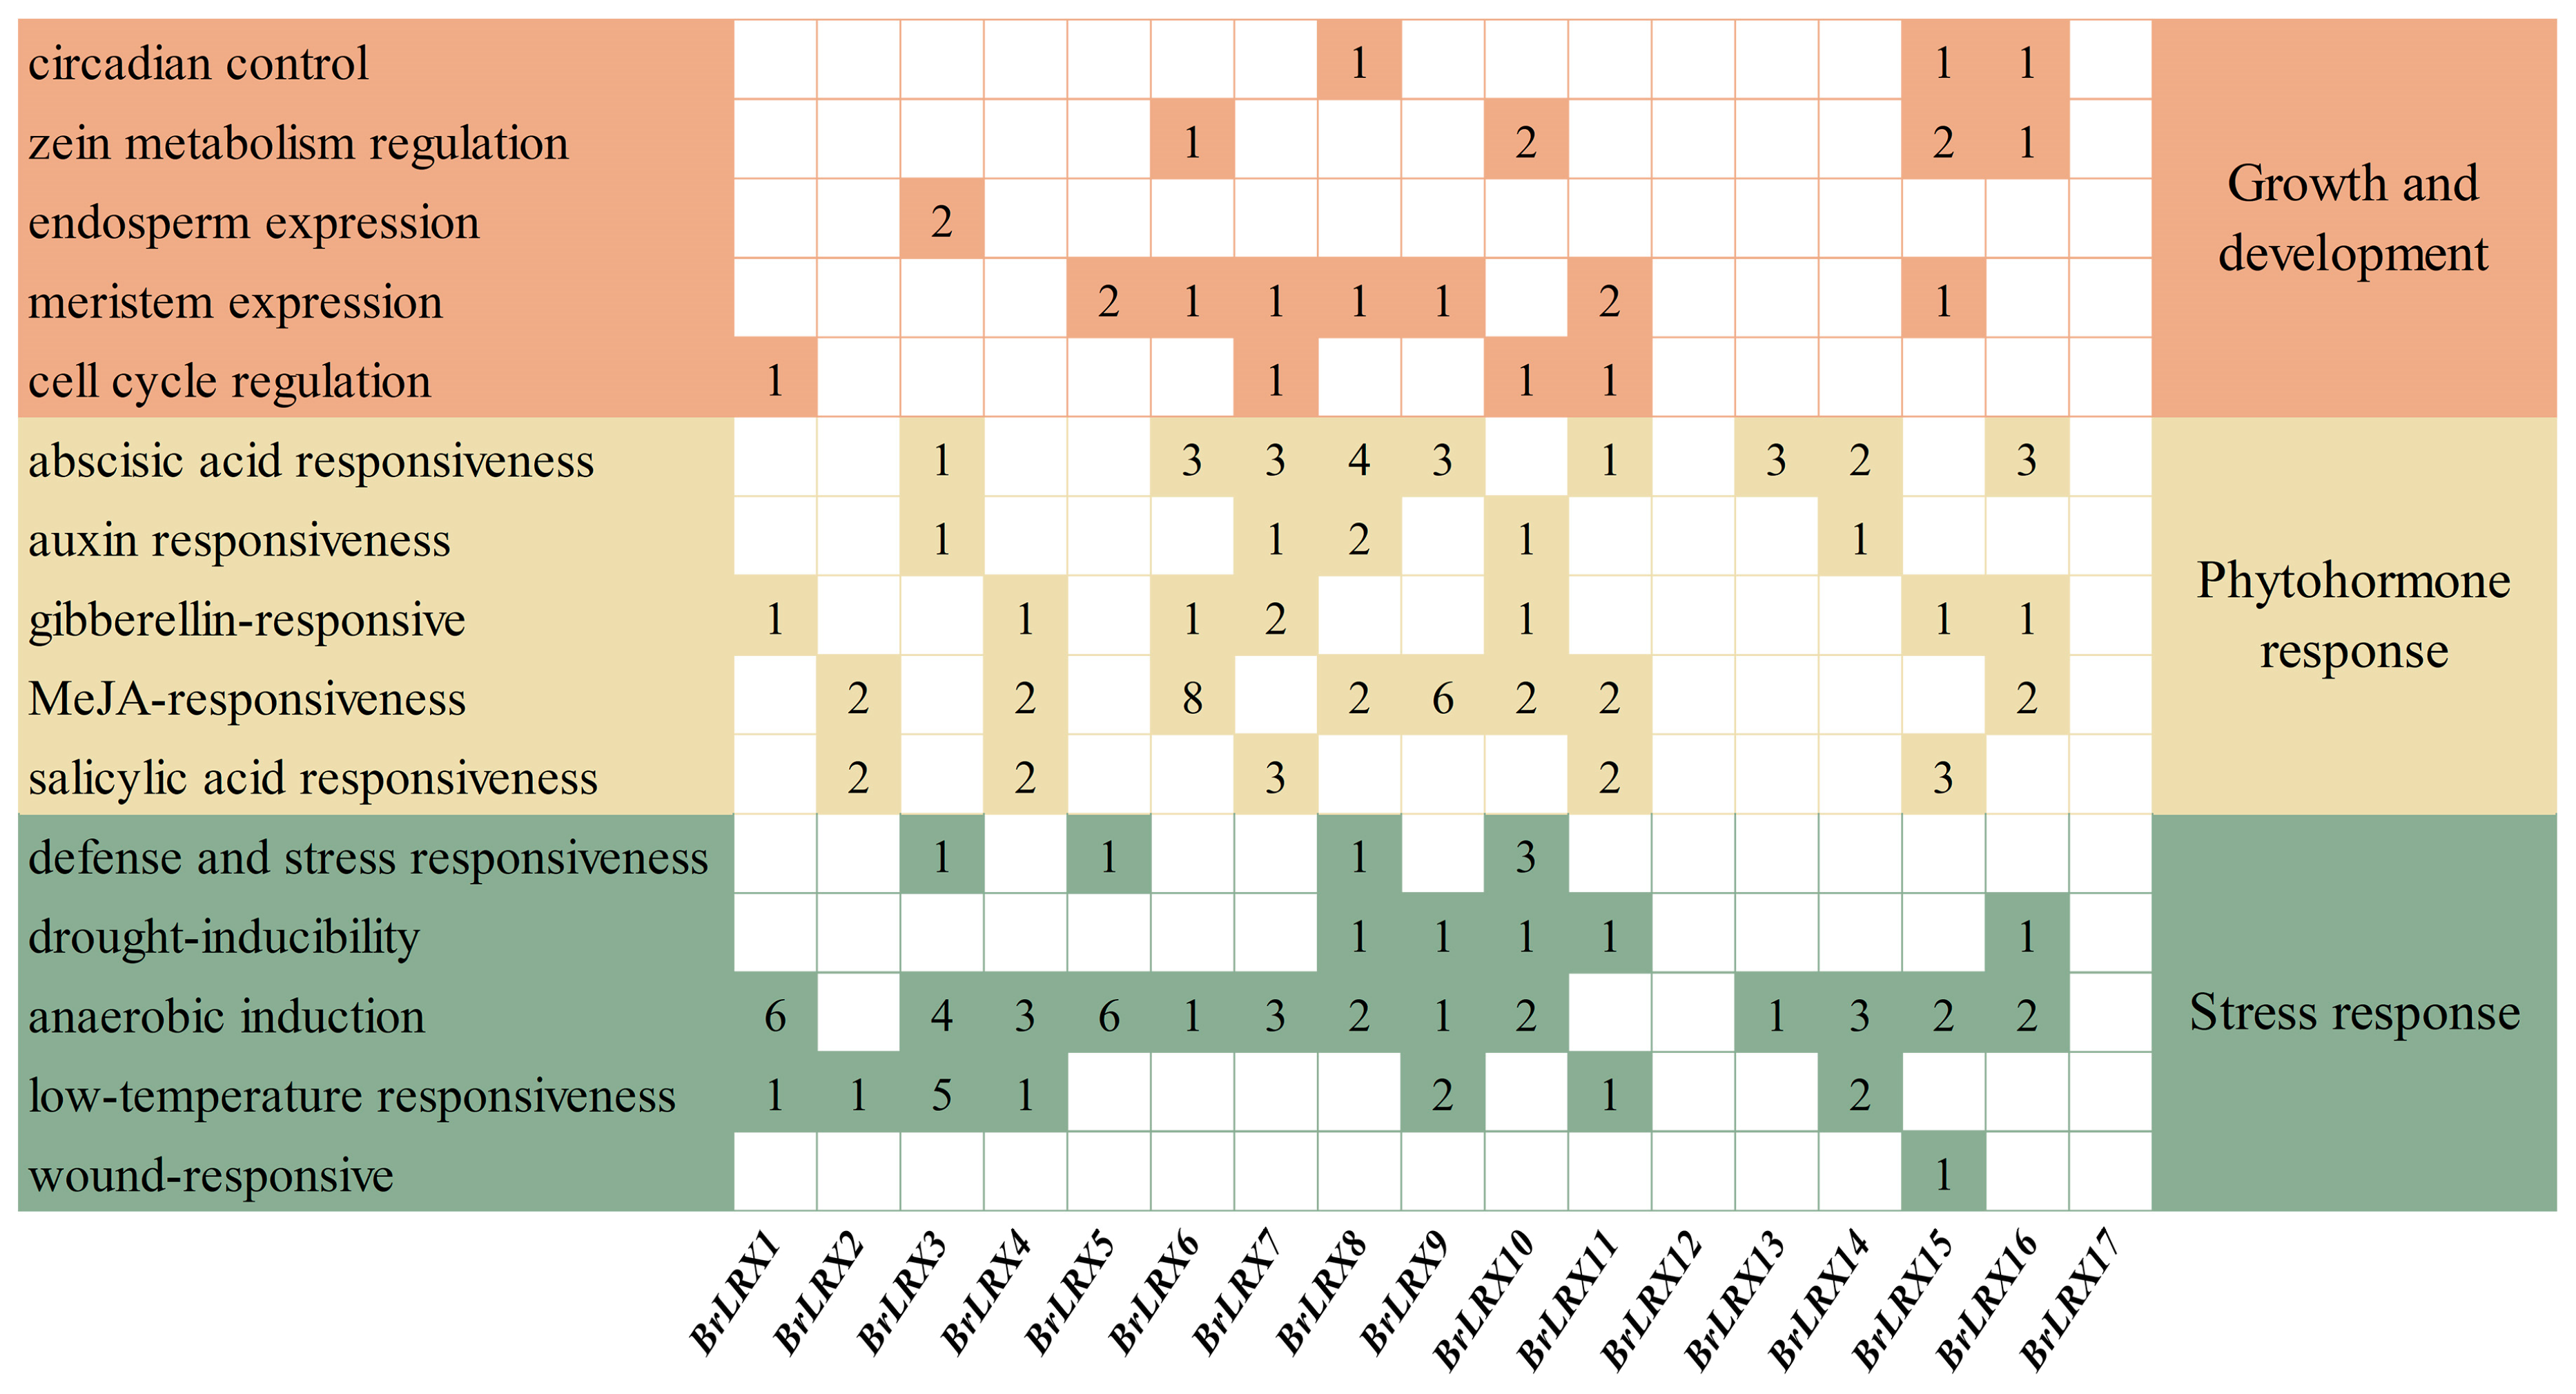
3.4. Cis-Acting Element Analysis of BrLRXs

We identified 15 cis-acting elements within 2000 bp upstream of the 17 BrLRX promoters and determined their functions (Figure 4). We divided the cis-acting elements into three groups according to their functions: Growth and development, Phythohormone response, and Stress response. The number of different cis-acting elements for each gene is shown in the figure below. We found that, with the exception of BrLRX12 and 17, each gene contained a different number of cis-acting elements, and BrLRX6 contained the highest number of cis-acting elements (15); BrLRX13 contained only four cis-acting elements; BrLRX8 and BrLRX10 contained the most diverse types of cis-acting elements (eight different cis-acting elements). These cis-acting elements also include hormone-related elements involved in processes, such as methyl abscisic acid response, auxin response, gibberellin response, MeJA response, and salicylic acid response. These hormones often play a regulatory role by serving as signaling molecules in stress responses. BrLRX genes also contain many stress response elements, such as those involved in defense and stress responses, drought susceptibility, anaerobic induction, and low-temperature responses. The functions of these genes in stress responses might depend on the cis-acting elements of the promoter. BrLRX15 also contains a unique wound-responsive element, which suggests that it might play a role in callus formation or in resistance to pathogens.

3.5. Tissue-Specific Expression of BrLRXs

The expression patterns of 17 BrLRXs in six tissues (stem, silique, leaf, root, flower, and callus) of B. rapa were determined (Figure 5, Table S1). The similarity in expression patterns among the genes was positively correlated with their sequence similarity. BrLRX1, BrLRX4, BrLRX5, BrLRX6, BrLRX7, BrLRX8, BrLRX13, and BrLRX17 were highly expressed in flowers, suggesting that they play a role in stem growth and development. Only BrLRX6 and BrLRX15 were significantly expressed in stems, suggesting that they play a role in stem growth and development. In addition, several BrLRX genes were highly expressed in other organs. These findings highlight the diverse roles that BrLRXs play in the development of different tissues.

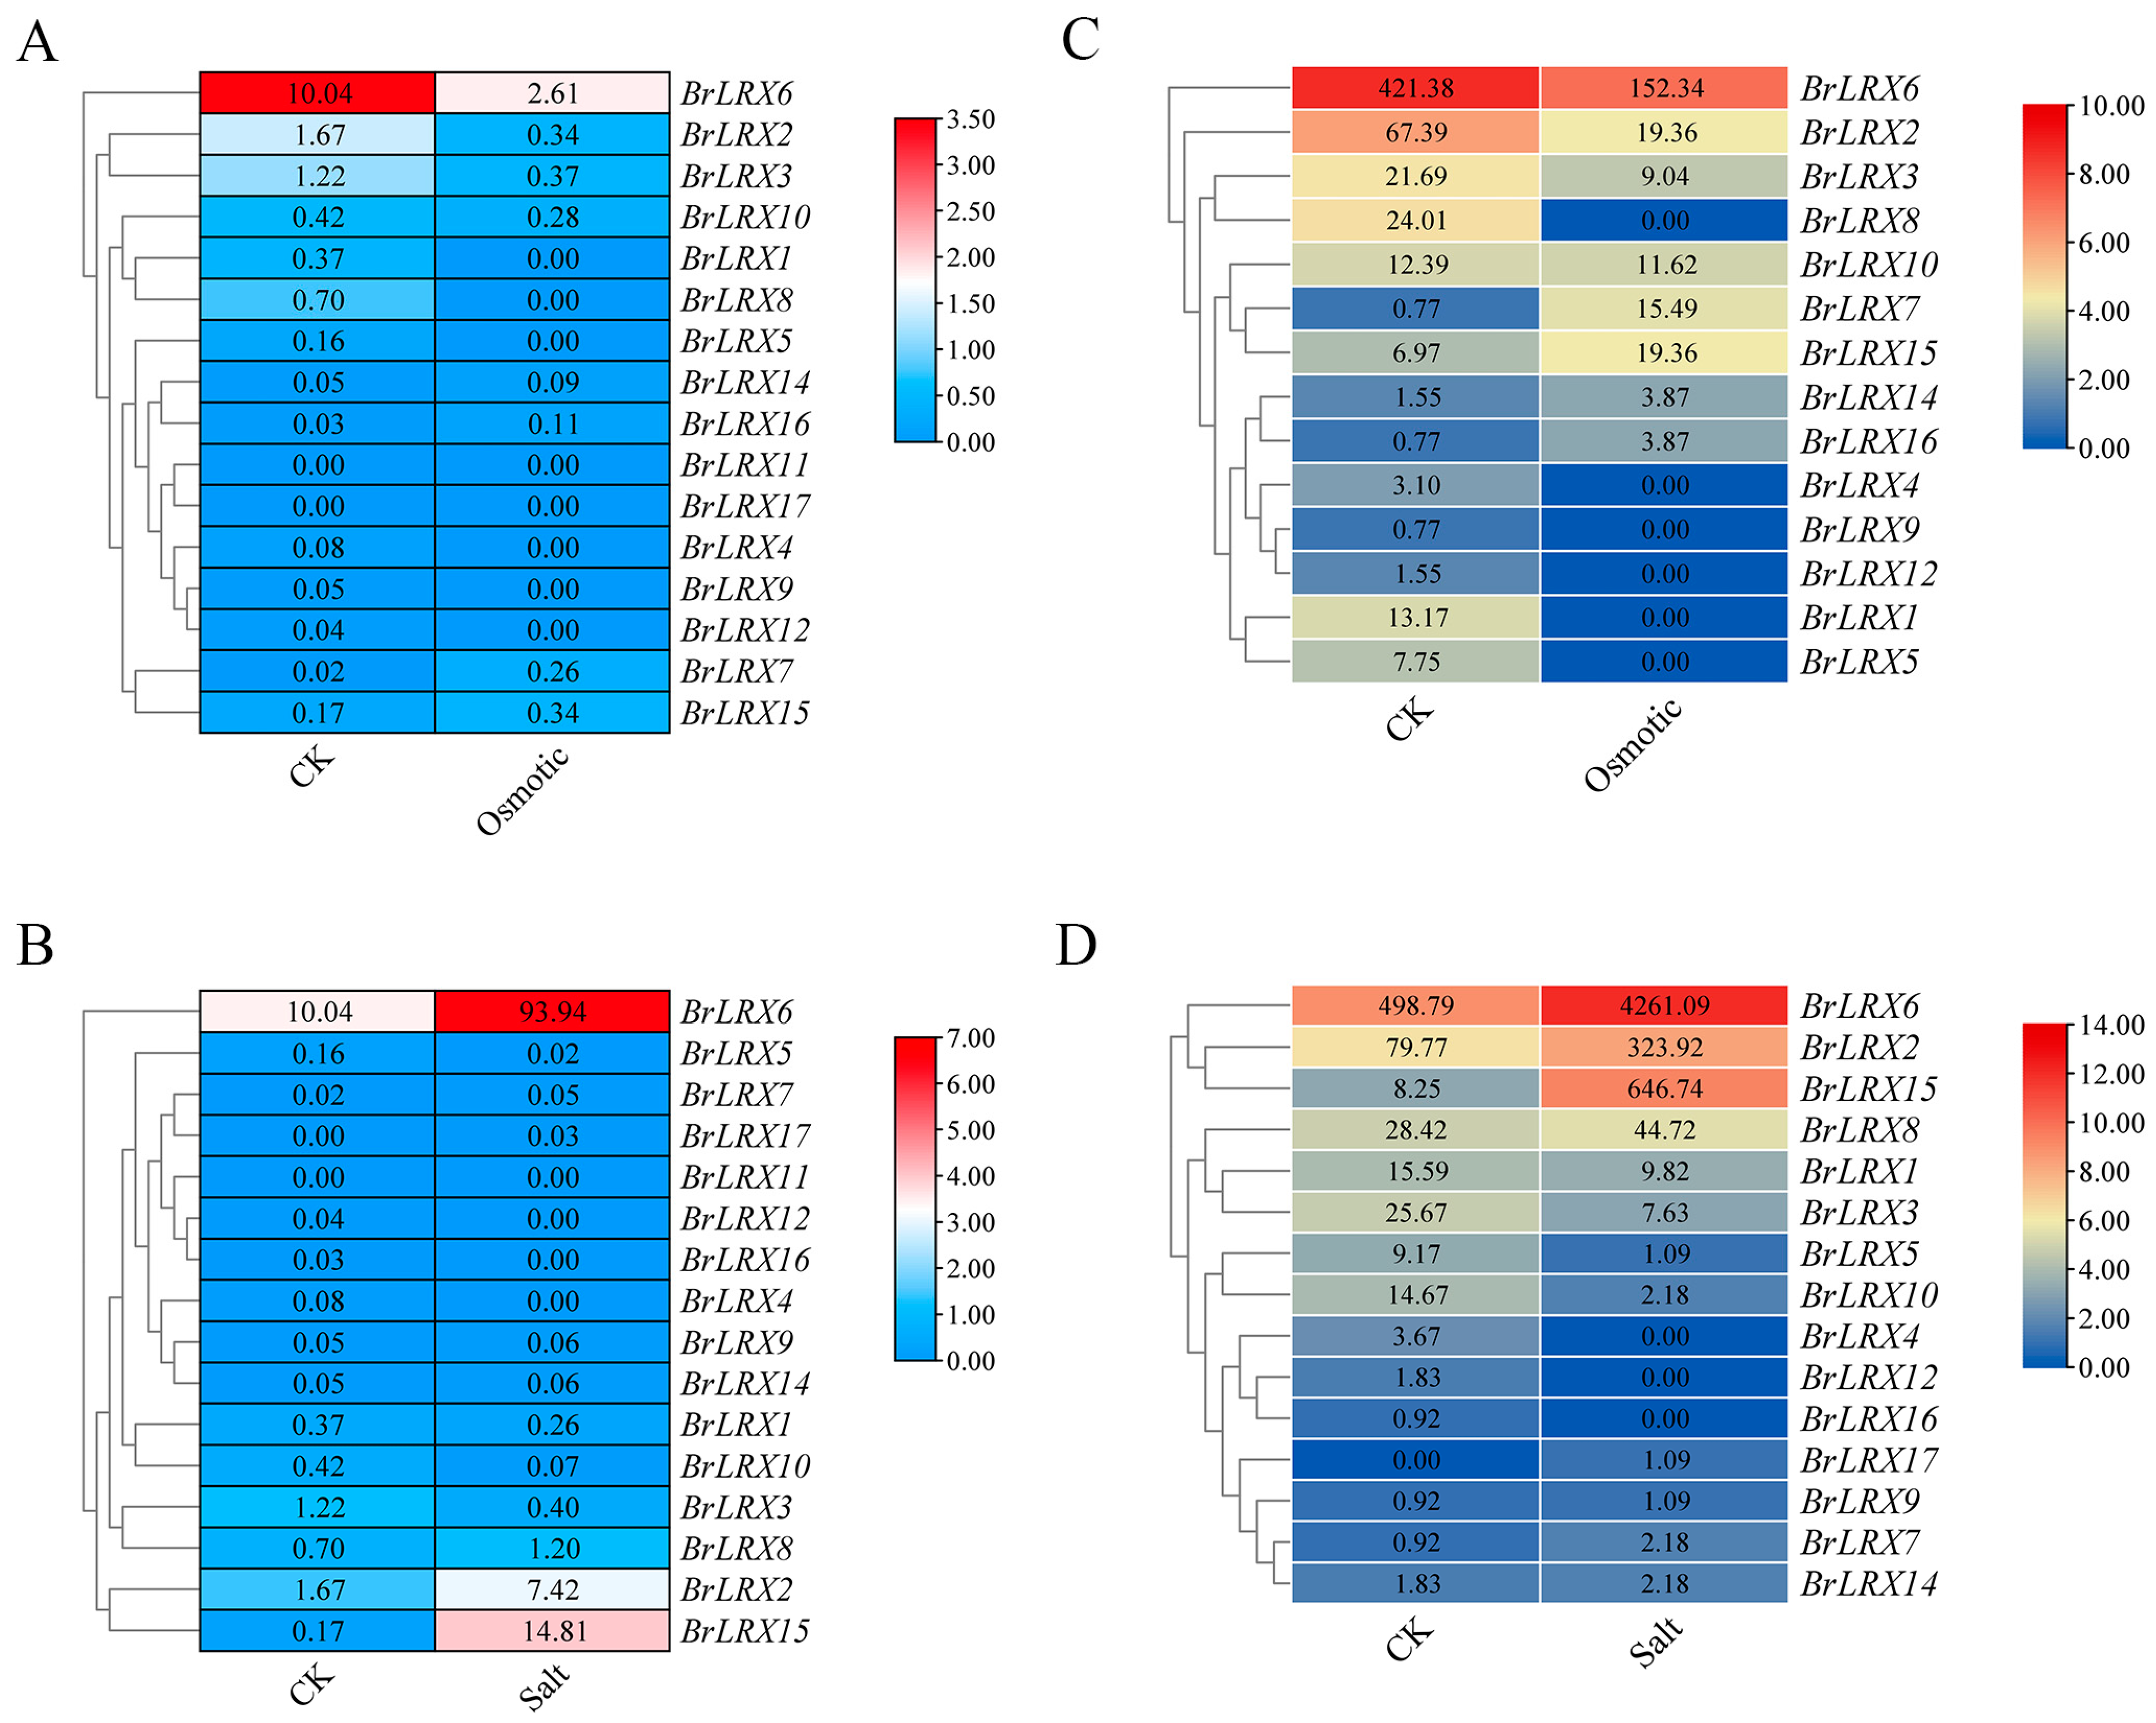
3.6. Proteome and Transcriptome Analysis of BrLRXs Involved in Responses to Abiotic Stresses

To further investigate the role of BrLRXs in stress responses, we analyzed the effects of osmosis stress and salt stress treatments on the expression patterns of BrLRXs. The expression pattern of BrLRXs was consistent in the transcriptome and proteome, with expression up-regulated or down-regulated by the same times for the same treatment time (Figure 6A–D, Tables S2 and S3). The expression of BrLRX genes was significantly altered under salt stress; the expression of eight (BrLRX2, 6, 7, 8, 9, 14, 15, 17) and seven (BrLRX1, 3, 4, 5, 10, 12, 16) BrLRXs was down-regulated and up-regulated, respectively. BrLRX15 was up-regulated more than 80-fold. Under osmosis stress, most genes were down-regulated, 10 genes were up-regulated (BrLRX1, 2, 3, 4, 5, 6, 8, 9, 10, 12), and the remaining 4 genes were up-regulated (BrLRX7, 14, 15, 16). The expression of BrLRX7 was 14 times higher under salt stress than in the control group, and this difference was significant. The expression of BrLRX6, BrLRX8, and BrLRX6 was significantly altered under both types of stress.

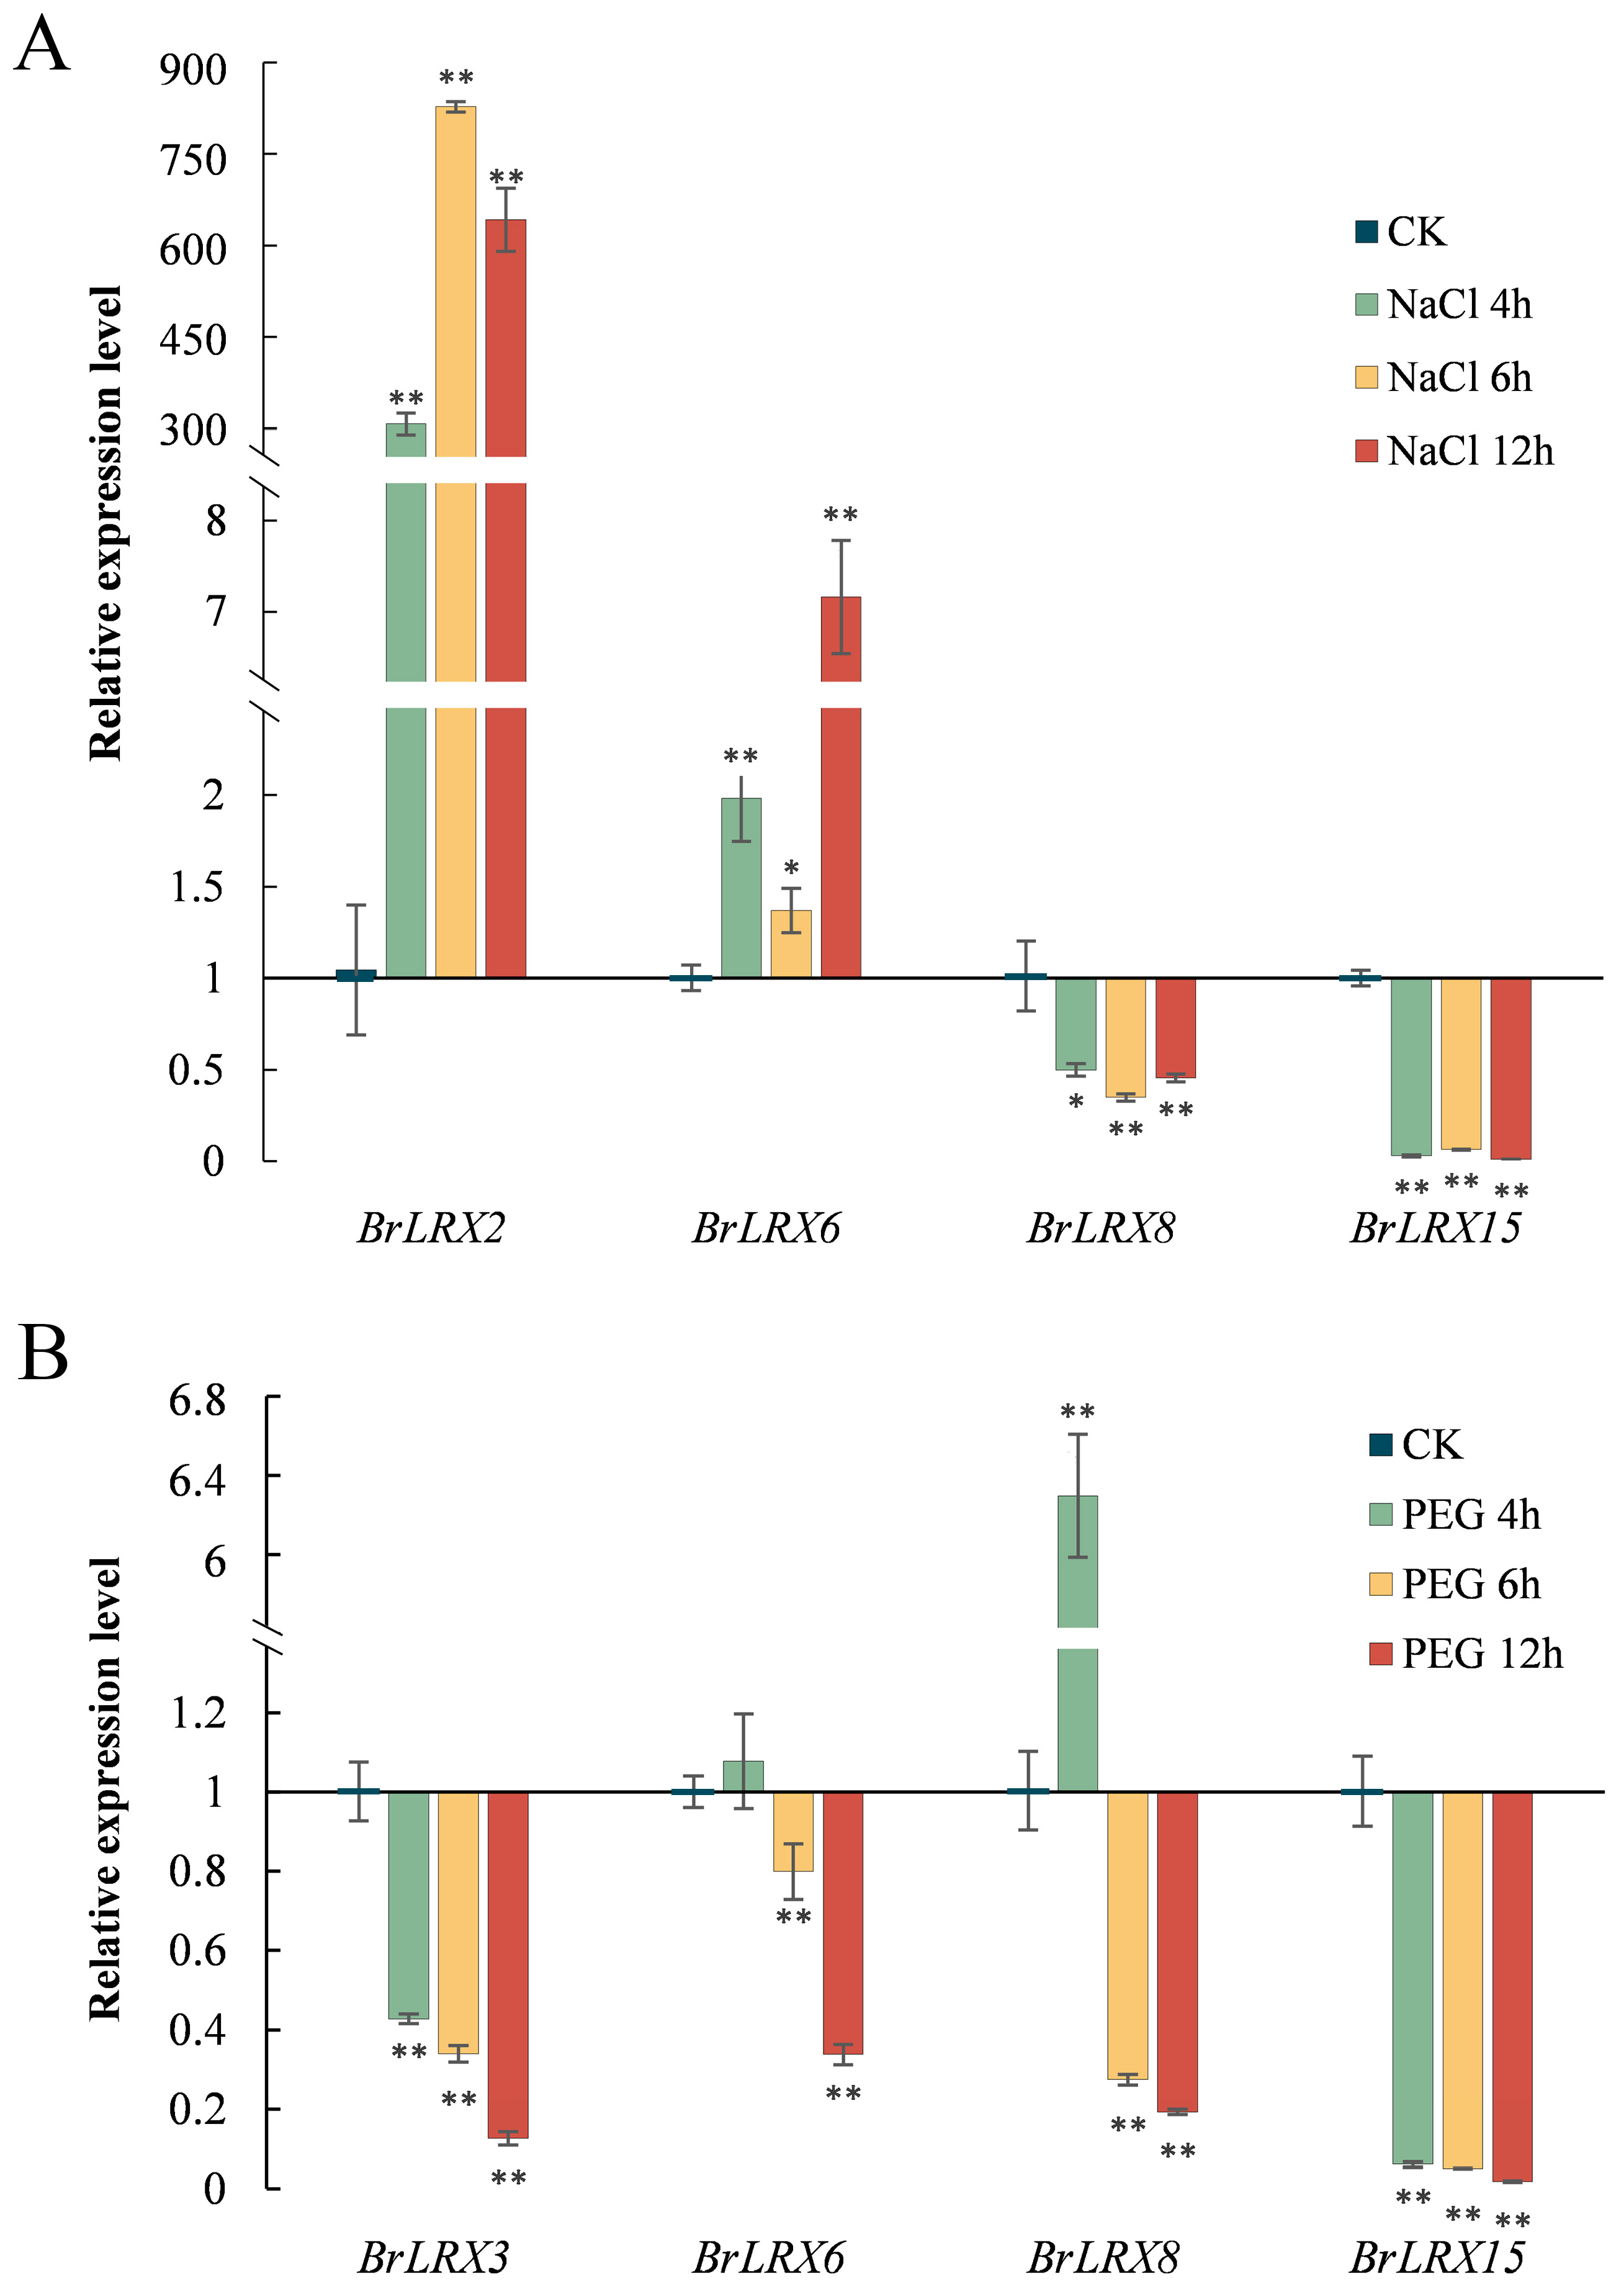
3.7. RT-qPCR Analysis of BrLRXs Involved in Responses to Abiotic Stresses

The results of transcriptomic and proteomic analyses indicated that the expression of several genes was significantly up-regulated or down-regulated under salt stress and osmotic stress, indicating that these genes might play a role in the response to salt stress and osmotic stress. To further validate the expression patterns of genes under abiotic stress, we selected five key genes based on the results of transcriptomic and proteomic analyses and used RT-qPCR to detect changes in their expression under salt stress and osmotic stress for 4 h, 6 h, and 12 h; untreated material was used as a control (Table S4).
The expression of BrLRX2, BrLRX6, BrLRX8, and BrLRX15 was significantly altered under salt treatment (Figure 7A). BrLRX6 expression was up-regulated 7-fold after 12 h of salt stress, which was consistent with the results of the transcriptomic and proteomic analysis. The expression of BrLRX2 was 300-fold, 800-fold, and 600-fold higher after 4 h, 6 h, and 12 h of salt stress, respectively, and these increases were extremely significant, suggesting that BrLRX2 plays an important role in regulating the response to salt stress. The expression of BrLRX8 and BrLRX15 was significantly down-regulated under salt stress at 4 h, 6 h, and 12 h. Expression profiling showed that BrLRX2, BrLRX6, BrLRX8, and BrLRX15 most likely play important roles in the response to salt stress.
Under osmotic treatment, the expression of BrLRXs was significantly down-regulated, and the expression of these genes was the lowest after 12 h of PEG treatment (Figure 7B). The expression levels of BrLRX3, BrLRX6, BrLRX8, and BrLRX15 were significantly down-regulated by more than five-fold under osmotic stress at both 6 h and 12 h. BrLRX8 expression was significantly up-regulated 6-fold under osmotic stress at 4 h and then down-regulated 6-fold at 6 h, which is consistent with the results of the transcriptomic and proteomic analyses; we hypothesize that this gene plays a role in osmotic stress tolerance.

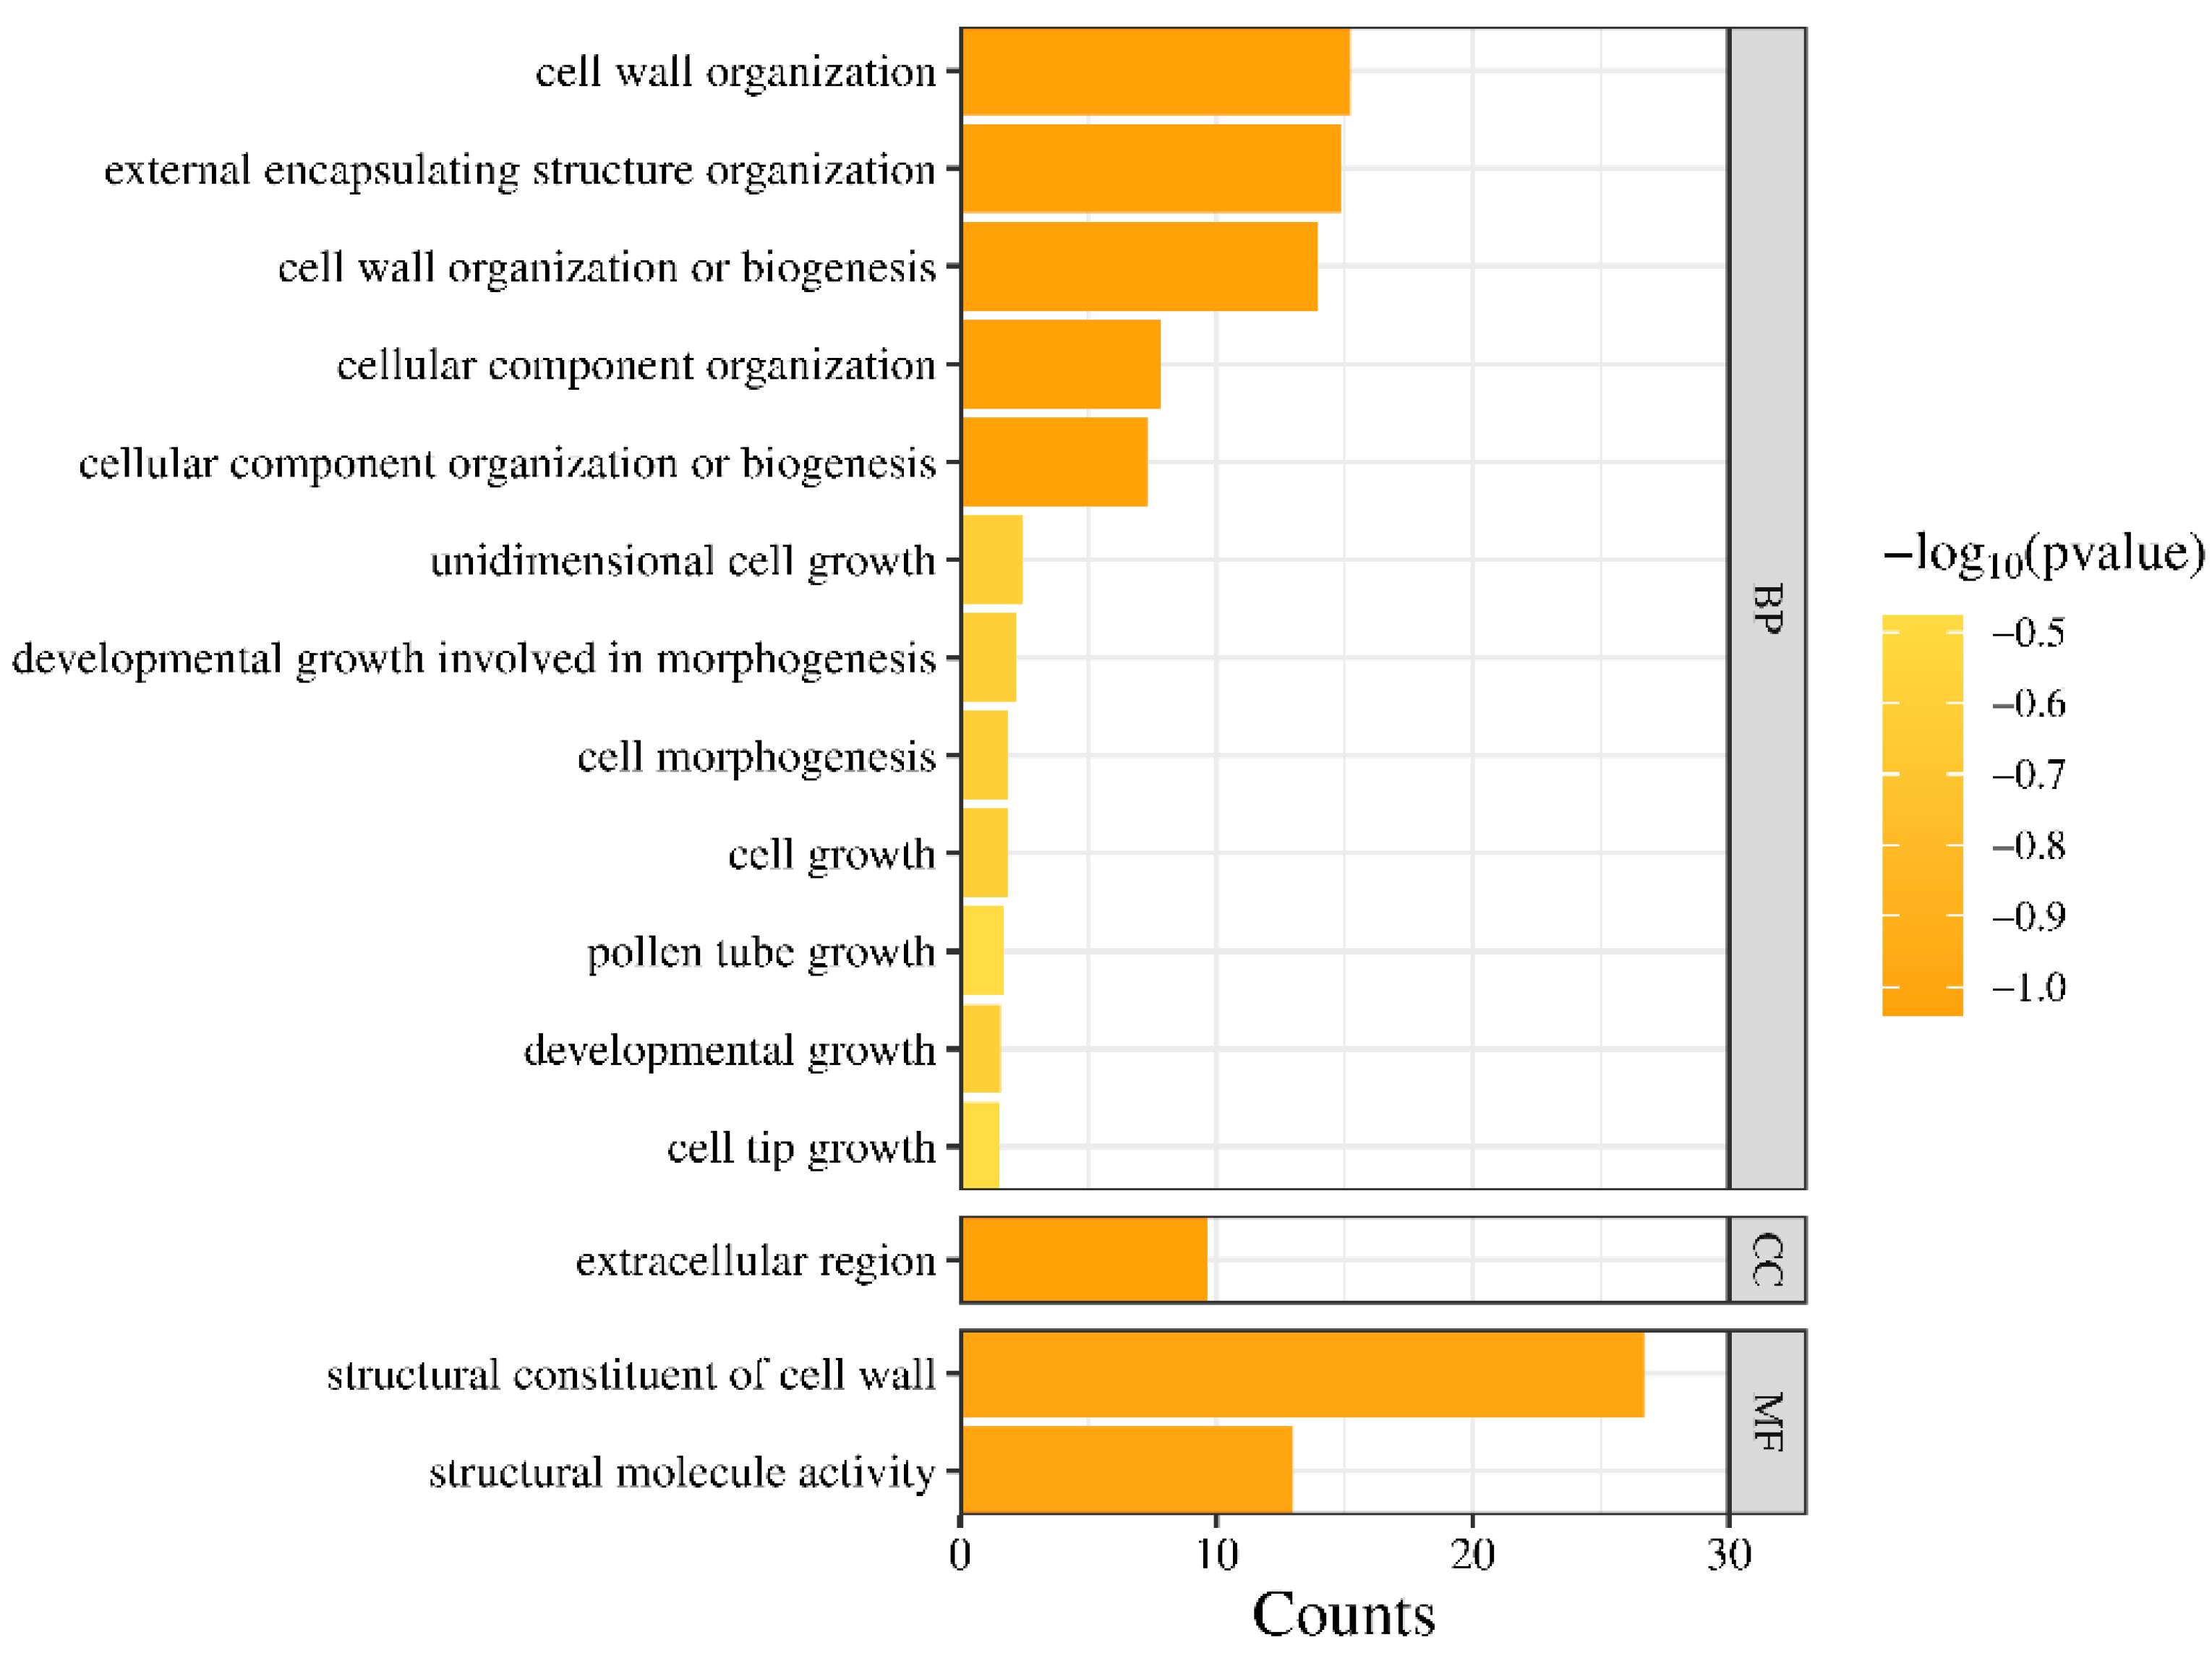
3.8. Gene Ontology (GO) Analysis of LRXs in A. thaliana

Because LRX genes have not been studied in B. rapa, we conducted a GO analysis on LRXs in A. thaliana to provide insights into the possible functions of BrLRXs. We performed GO analyses of the AtLRX genes to elucidate their potential functions. AtLRX genes were enriched in GO terms, which were classified and these were classified into three categories: ‘biological processes (GO-BPs), cellular components (GO-CCs), and molecular functions (GO-MFs) (Figure 8). Two enriched GO-MF terms, structural constituent of the cell wall (GO: 0005199) and structural molecule activity (GO: 0005198), were detected. Only one enriched GO-CC term, extracellular region (GO: 0005576), was detected, and this was consistent with the subcellular localization predictions. The primary GO-BP terms were cell wall organization (GO: 0071555), external encapsulating structure organization (GO: 0071554), cellular component organization (GO: 0016043), cellular component organization or biogenesis (GO: 0071840), and other related processes. Overall, the GO data of the AtLRXs suggest that BrLRXs might play a key role in determining the composition of the cell wall.

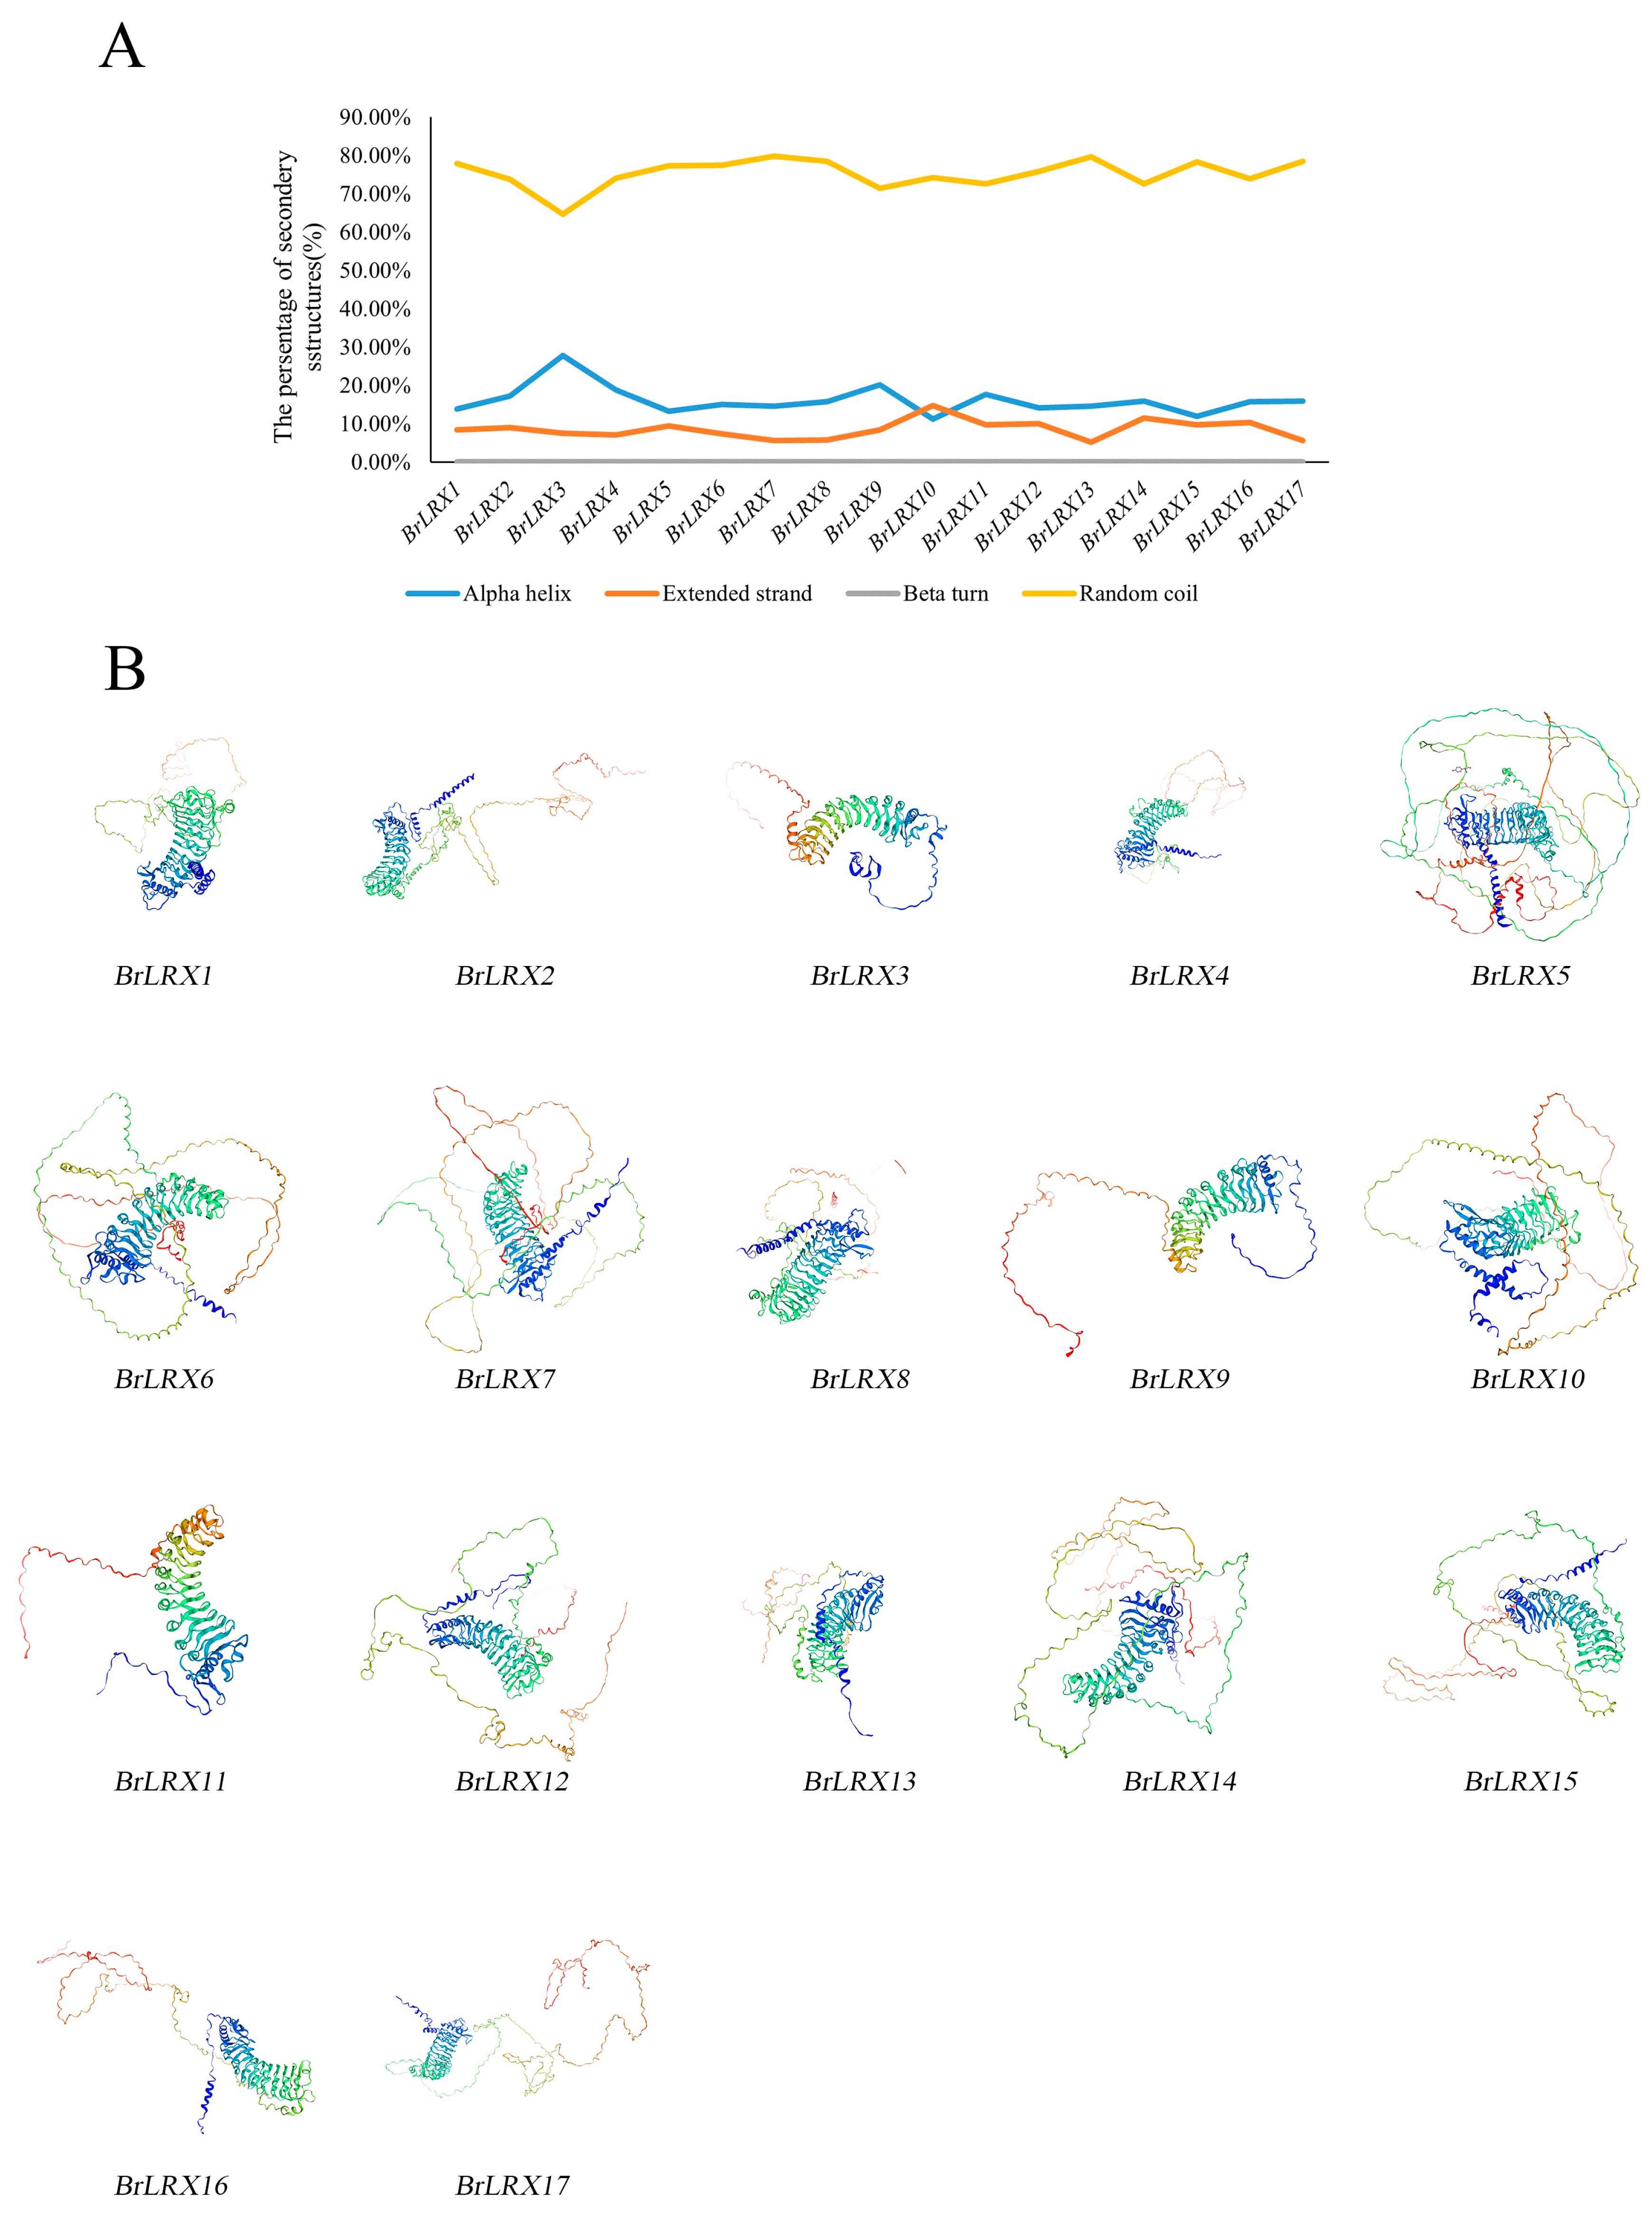
3.9. Protein Secondary and Tertiary Structure Analysis of BrLRXs

Analysis of the secondary structures of LRX proteins in B. rapa encompassed α-helices, extended strands, β-turns, and random coil components. The most common secondary structures in LRX proteins were the α-helixes and random coil components; β-turns were the least common components with nearly 0% occurrence (Figure 9A).
The tertiary structure of the protein was determined based on the secondary structure, as well as additional coiling and folding processes. Visualization of the tertiary conformations can provide insight into the structural features of these proteins and their evolutionary relationships. We predicted the tertiary structures of LRXs in B. rapa using the homology model (Figure 9B). We observed significant structural similarity among members of the same subgroup. This observation suggests that homologous structures are maintained during evolution. Previous studies have found that LRX2 proteins are closely related to the extracellular structural domains of known LRR receptor kinases, such as the immunoreceptor FLS2. LRX2 consists of 11 LRRs sandwiched between canonical N-terminal and C-terminal-capped structural domains as well as cysteine-rich protrusions corresponding to the N-terminal portion of the extended protein structural domains. The structure of the LRX2-LRX8 complex confirms that the LRX proteins form constitutive dimers covalently linked by conserved disulfide bonds. The RALF4 peptide binds to each LRX prototype protein in the dimer, and the LRR core provides a binding platform for RALF4 to fold. The differential electron density of the entire RALF4-folded peptide supports its close interaction with LRX proteins [35].

3.10. Protein–Protein Interaction (PPI) Network Prediction Analysis of BrLRXs

Genes can regulate life activities by mediating the synthesis of proteins, acting as signaling substances, and interacting with other protein substances and the environment [36]. Phylogenetic and collinearity analysis revealed high homology among LRX genes in A. thaliana and B. rapa. To further verify the role of BrLRX in stress responses, we predicted interactions among homologous A. thaliana genes and inferred the function of the corresponding LRX genes based on the function of the interacting proteins (Figure 10). AtLRX2, AtLRX4, AtLRX5, and AtLRX11 all interacted with RALF, and these proteins are involved in stress responses in plants. Previous studies have shown that RALF proteins can cause the rapid alkalization of cell walls and inhibit cell growth [37]. RALF-like proteins can bind to the receptor FER to regulate stress responses in plants [38] and inhibit ABA responses [39]; RALF-like proteins are also recognized by LRX proteins to regulate pollen tube growth [35]. For example, RALF1 has been shown to regulate stress responses and growth in plants [40] by binding to receptor proteins and phosphorylating other proteins; RALF4 and RALF9 interact with LRX proteins to control pollen tube growth in A. thaliana [41], and the perception of RALF23 facilitates the regulation of cell surface signaling of other ligand-binding receptor kinases by LRX proteins [42]. We detected a close interaction between AtLRX6 and AGP30, which has been shown to be involved in Cd2+ stress tolerance [43].

4. Discussion

LRX proteins are a group of cell wall proteins containing an N-terminal LRR domain and a C-terminal elongation protein domain [44]. The LRR domain is thought to recognize and bind ligands, and the highly glycosylated extensin domain might be involved in cross-linking with pectin, a cell wall component [45,46]. LRX proteins are involved in cell wall formation in vegetative tissues, and they have been shown to play a role in regulating lateral root development [47], cell wall assembly and cell growth in different tissues [2,20], cell wall–plasma membrane communication [28], and pollen tube growth [41]; LRX proteins are thus essential for plant growth. They play a key role in mediating the adaptation of plants to abiotic stress, especially salt stress [23]. The study aimed to identify LRXs in B. rapa, analyze their structure and expression patterns, and characterize the sequences, conserved domains, and evolutionary relationships of the encoded proteins. Our objective was to elucidate the roles of LRX gene family members in the response to abiotic stress in B. rapa.
BrLRX2 might play a role in regulating the response of B. rapa to salt stress. Analysis of its promoter elements revealed the presence of SA and MeJA response elements within the BrLRX2 promoter region. Previous studies have shown that SA can enhance the tolerance of various plants to salt stress [48,49,50]. BrLRX2 was most highly expressed in the roots. Previous studies have shown that plants have the capacity to adjust their root system architecture (RSA) and the direction of root growth in order to avoid high salt concentrations [51]. The expression of these genes was substantially up-regulated according to the transcriptome, proteome, and RT-qPCR analyses.
BrLRX6 might also participate in the response to osmotic and salt stress. Cis-acting elements analysis in the BrLRX6 promoter region revealed the presence of GA and ABA response elements. GA is inactivated under osmotic stress, and this results in the partial closure of the stomata to cope with the drought caused by the increase in soil osmotic pressure. This in turn inhibits the synthesis of GA within leaf tissue, thereby limiting transpiration [52]. ABA can induce stomatal closure and play a role in leaf abscission and the response to osmotic stress [53]; ABA signaling can regulate plant salt tolerance and drought tolerance [54]. These findings suggest that GA and ABA contribute to adaptation to osmotic and salt stress. The expression of BrLRX6 was higher in the roots of plants than in other tissues. Plants can regulate their growth under osmotic stress and salt stress through the roots [51]. Transcriptome, proteome, and RT-qPCR data consistently revealed that the expression of BrLRX6 was down-regulated under osmotic stress and up-regulated under salt stress.
Previous studies have shown that AtLRX3, 4, and 5 are key genes for salt tolerance in A. thaliana, and lrx345 triple mutant plants exhibit growth retardation and salt sensitivity [41]. LRX5 and LRX4 are homologs of BrLRX2 and BrLRX6 in A. thaliana, respectively. According to PPI network analysis, RALF23, FER, and THE1 are key interacting proteins during the response to abiotic stress. In A. thaliana, lrx345 and fer-4 mutants and RALF22/23 overexpression transgenic plants exhibit similar phenotypes, such as growth retardation and increased sensitivity to salt stress. This indicates that the LRX 3/4/5 proteins function together with RALF22/23 and FER to activate signaling pathways critical for regulating plant growth and salt tolerance [23,55]. FER-dependent signaling induces cell-specific calcium transients to maintain cell wall integrity during salt stress [56]. ABA production, phytohormone regulation of turgor pressure, and response to drought depend on the presence of functional cell walls. The cell wall integrity sensor THESEUS1 (THE1) regulates the mechanical properties of the cell wall, expansion loss point, ABA biosynthesis, and ABA control process; it is responsible for coordinating changes in expansion pressure and cell wall stiffness, and its mode of action can affect the resistance of plants to osmotic stress [57].
We speculate that BrLRX8 might be involved in the response to osmotic stress given the following findings. A drought-inducibility element was predicted in BrLRX8, which indicates that BrLRX8 might be related to the response to osmotic and drought stress. ABA contributes to mediating adaptation to osmotic stress and salt stress [58,59]. Auxin is a key regulator of plant growth and development and plays a key role in integrating abiotic stress signals such as osmotic stress and controlling downstream stress responses [60]. MeJA can induce osmotic stress tolerance by promoting the accumulation of osmotic regulatory substances and antioxidant activity [61]. We conducted transcriptome, proteome, and RT-qPCR analyses. Under PEG-6000 treatment, the expression patterns of BrLRX8 examined using these three methods were consistent, and the expression of BrLRX8 was substantially down-regulated.
AtLRX11, the homolog of BrLRX8 in A. thaliana, interacts with RALF4, RALF19, FER, and ANX1. RALF4 and RALF19 in A. thaliana interact with LRX proteins to regulate pollen tube integrity and growth [41], and previous studies have shown that ANX1 and ANX2 are male factors that induce pollen tube rupture at the appropriate time. Furthermore, ANX1 and ANX2 are the most closely related paralogs of the female factor FERONIA/SIRENE, which controls pollen tube behavior in synergistic cells. The expression of sugar transporter genes and ROS-related genes (e.g., FER) [56] might be altered in anthers to repair damage caused by drought [62]. Several genes responsive to drought in anthers control the expression of genes related to anther function, enhancing both drought resilience and anther development. BrLRX8 is posited to be pivotal in osmotic stress response by influencing root growth, elements of drought response, hormonal pathways, and protein interactions in B. rapa.

5. Conclusions

This study involved the identification of 17 BrLRXs within B. rapa. Sequence analysis, identification of cis-elements, analysis of interacting proteins, assessment of abiotic stress tolerance using expression profiles, and analysis of previous studies indicate that BrLRX6 and BrLRX8 might contribute to regulating osmotic stress tolerance. BrLRX2 and BrLRX6 play key roles in the response to salt stress.

Supplementary Materials

The following supporting information can be downloaded at: https://www.mdpi.com/article/10.3390/horticulturae10060571/s1, Table S1: Tissue-specific expression data(TPM value), Table S2: The expression of BrLRX genes after PEG and NaCl treatments in transcriptome, Table S3: The expression of BrLRX genes after PEG and NaCl treatments in proteome, Table S4: The RT-qPCR data under NaCl treatments after analysis, Table S5: List of primers used for RT-qPCR

Author Contributions

Y.C. designed and supervised the entire experiment; J.H. (Jiyun Hui), M.Z. and L.C. performed the raw letter analysis; Y.W. performed the expression profiling experiments and data analysis; J.H. (Jiawei He), J.Z., R.W., Q.J. and B.L. visualized and presented the data; L.C. and M.Z. wrote the manuscript; and Y.C. revised the manuscript. All authors have read and agreed to the published version of the manuscript.

Funding

This work was supported by the National Natural Science Foundation of China (32002045).

Data Availability Statement

Data are contained within the article and Supplementary Materials.

Acknowledgments

We are grateful to Zhilong Bao’s lab for help with RT-qPCR experiments.

Conflicts of Interest

The authors declare no conflicts of interest.

References

  1. Rubinstein, A.L.; Broadwater, A.H.; Lowrey, K.B.; Bedinger, P.A. Pex1, a pollen-specific gene with an extensin-like domain. Proc. Natl. Acad. Sci. USA 1995, 92, 3086–3090. [Google Scholar] [CrossRef] [PubMed]
  2. Baumberger, N.; Ringli, C.; Keller, B. The chimeric leucine-rich repeat/extensin cell wall protein LRX1 is required for root hair morphogenesis inArabidopsis thaliana. Genes. Dev. 2001, 15, 1128–1139. [Google Scholar] [CrossRef] [PubMed]
  3. Stratford, S.; Barne, W.; Hohorst, D.L.; Sagert, J.G.; Cotter, R.; Golubiewski, A.; Showalter, A.M.; McCormick, S.; Bedinger, P. A leucine-rich repeat region is conserved in pollen extensin-like (Pex) proteins in monocots and dicots. Plant Mol. Biol. 2001, 46, 43–56. [Google Scholar] [CrossRef] [PubMed]
  4. Lamport, D.T.; Kieliszewski, M.J.; Chen, Y.; Cannon, M.C. Role of the extensin superfamily in primary cell wall architecture. Plant Physiol. 2011, 156, 11–19. [Google Scholar] [CrossRef]
  5. Torii, K.U.; Mitsukawa, N.; Oosumi, T.; Matsuura, Y.; Yokoyama, R.; Whittier, R.F.; Komeda, Y. The Arabidopsis ERECTA gene encodes a putative receptor protein kinase with extracellular leucine-rich repeats. Plant Cell 1996, 8, 735–746. [Google Scholar] [CrossRef] [PubMed]
  6. Clark, S.E.; Williams, R.W.; Meyerowitz, E.M. The CLAVATA1 gene encodes a putative receptor kinase that controls shoot and floral meristem size in Arabidopsis. Cell 1997, 89, 575–585. [Google Scholar] [CrossRef] [PubMed]
  7. Li, J.; Chory, J. A putative leucine-rich repeat receptor kinase involved in brassinosteroid signal transduction. Cell 1997, 90, 929–938. [Google Scholar] [CrossRef] [PubMed]
  8. Jinn, T.L.; Stone, J.M.; Walker, J.C. HAESA, an Arabidopsis leucine-rich repeat receptor kinase, controls floral organ abscission. Genes. Dev. 2000, 14, 108–117. [Google Scholar] [CrossRef]
  9. He, Z.; Wang, Z.Y.; Li, J.; Zhu, Q.; Lamb, C.; Ronald, P.; Chory, J. Perception of brassinosteroids by the extracellular domain of the receptor kinase BRI1. Science 2000, 288, 2360–2363. [Google Scholar] [CrossRef]
  10. Hou, B.Z.; Xu, C.; Shen, Y.Y. A leu-rich repeat receptor-like protein kinase, FaRIPK1, interacts with the ABA receptor, FaABAR, to regulate fruit ripening in strawberry. J. Exp. Bot. 2018, 69, 1569–1582. [Google Scholar] [CrossRef]
  11. Osakabe, Y.; Maruyama, K.; Seki, M.; Satou, M.; Shinozaki, K.; Yamaguchi-Shinozaki, K. Leucine-rich repeat receptor-like kinase1 is a key membrane-bound regulator of abscisic acid early signaling in Arabidopsis. Plant Cell 2005, 17, 1105–1119. [Google Scholar] [CrossRef] [PubMed]
  12. Song, W.Y.; Wang, G.L.; Chen, L.L.; Kim, H.S.; Pi, L.Y.; Holsten, T.; Gardner, J.; Wang, B.; Zhai, W.X.; Zhu, L.H.; et al. A receptor kinase-like protein encoded by the rice disease resistance gene, Xa21. Science 1995, 270, 1804–1806. [Google Scholar] [CrossRef] [PubMed]
  13. Kieliszewski, M.J.; Lamport, D.T. Extensin: Repetitive motifs, functional sites, post-translational codes, and phylogeny. Plant J. 1994, 5, 157–172. [Google Scholar] [CrossRef]
  14. Kieliszewski, M.J.; Leykam, J.F.; Lamport, D.T. Structure of the Threonine-Rich Extensin from Zea mays. Plant Physiol. 1990, 92, 316–326. [Google Scholar] [CrossRef] [PubMed]
  15. Showalter, A.M.; Keppler, B.; Lichtenberg, J.; Gu, D.; Welch, L.R. A bioinformatics approach to the identification, classification, and analysis of hydroxyproline-rich glycoproteins. Plant Physiol. 2010, 153, 485–513. [Google Scholar] [CrossRef] [PubMed]
  16. Elliott, K.A.; Shirsat, A.H. Promoter regions of the extA extensin gene from Brassica napus control activation in response to wounding and tensile stress. Plant Mol. Biol. 1998, 37, 675–687. [Google Scholar] [CrossRef] [PubMed]
  17. Wycoff, K.L.; Powell, P.A.; Gonzales, R.A.; Corbin, D.R.; Lamb, C.; Dixon, R.A. Stress activation of a bean hydroxyproline-rich glycoprotein promoter is superimposed on a pattern of tissue-specific developmental expression. Plant Physiol. 1995, 109, 41–52. [Google Scholar] [CrossRef] [PubMed]
  18. Carpita, N.C.; Gibeaut, D.M. Structural models of primary cell walls in flowering plants: Consistency of molecular structure with the physical properties of the walls during growth. Plant J. 1993, 3, 1–30. [Google Scholar] [CrossRef] [PubMed]
  19. Hall, Q.; Cannon, M.C. The cell wall hydroxyproline-rich glycoprotein RSH is essential for normal embryo development in Arabidopsis. Plant Cell 2002, 14, 1161–1172. [Google Scholar] [CrossRef]
  20. Baumberger, N.; Doesseger, B.; Guyot, R.; Diet, A.; Parsons, R.L.; Clark, M.A.; Simmons, M.P.; Bedinger, P.; Goff, S.A.; Ringli, C.; et al. Whole-Genome Comparison of Leucine-Rich Repeat Extensins in Arabidopsis and Rice. A Conserved Family of Cell Wall Proteins Form a Vegetative and a Reproductive Clade. Plant Physiol. 2003, 131, 1313–1326. [Google Scholar] [CrossRef]
  21. Rubinstein, A.L.; Marquez, J.; Suarez-Cervera, M.; Bedinger, P.A. Extensin-like Glycoproteins in the Maize Pollen Tube Wall. Plant Cell 1995, 7, 2211–2225. [Google Scholar] [CrossRef] [PubMed]
  22. Zhou, J.; Rumeau, D.; Showalter, A.M. Isolation and characterization of two wound-regulated tomato extensin genes. Plant Mol. Biol. 1992, 20, 5–17. [Google Scholar] [CrossRef] [PubMed]
  23. Zhao, C.; Zayed, O.; Yu, Z.; Jiang, W.; Zhu, P.; Hsu, C.-C.; Zhang, L.; Tao, W.A.; Lozano-Durán, R.; Zhu, J.-K. Leucine-rich repeat extensin proteins regulate plant salt tolerance in Arabidopsis. Proc. Natl. Acad. Sci. USA 2018, 115, 13123–13128. [Google Scholar] [CrossRef] [PubMed]
  24. Baumberger, N.; Steiner, M.; Ryser, U.; Keller, B.; Ringli, C. Synergistic interaction of the two paralogous Arabidopsis genes LRX1 and LRX2 in cell wall formation during root hair development. Plant J. 2003, 35, 71–81. [Google Scholar] [CrossRef] [PubMed]
  25. Draeger, C.; Ndinyanka Fabrice, T.; Gineau, E.; Mouille, G.; Kuhn, B.M.; Moller, I.; Abdou, M.T.; Frey, B.; Pauly, M.; Bacic, A.; et al. Arabidopsis leucine-rich repeat extensin (LRX) proteins modify cell wall composition and influence plant growth. BMC Plant Biol. 2015, 15, 155. [Google Scholar] [CrossRef] [PubMed]
  26. Wang, X.; Wang, K.; Yin, G.; Liu, X.; Liu, M.; Cao, N.; Duan, Y.; Gao, H.; Wang, W.; Ge, W.; et al. Pollen-Expressed Leucine-Rich Repeat Extensins Are Essential for Pollen Germination and Growth. Plant Physiol. 2018, 176, 1993–2006. [Google Scholar] [CrossRef] [PubMed]
  27. Sede, A.R.; Borassi, C.; Wengier, D.L.; Mecchia, M.A.; Estevez, J.M.; Muschietti, J.P. Arabidopsis pollen extensins LRX are required for cell wall integrity during pollen tube growth. FEBS Lett. 2018, 592, 233–243. [Google Scholar] [CrossRef]
  28. Fabrice, T.N.; Vogler, H.; Draeger, C.; Munglani, G.; Gupta, S.; Herger, A.G.; Knox, P.; Grossniklaus, U.; Ringli, C. LRX Proteins Play a Crucial Role in Pollen Grain and Pollen Tube Cell Wall Development. Plant Physiol. 2018, 176, 1981–1992. [Google Scholar] [CrossRef]
  29. Chen, C.; Chen, H.; Zhang, Y.; Thomas, H.R.; Frank, M.H.; He, Y.; Xia, R. TBtools: An Integrative Toolkit Developed for Interactive Analyses of Big Biological Data. Mol. Plant 2020, 13, 1194–1202. [Google Scholar] [CrossRef]
  30. Duvaud, S.; Gabella, C.; Lisacek, F.; Stockinger, H.; Ioannidis, V.; Durinx, C. Expasy, the Swiss Bioinformatics Resource Portal, as designed by its users. Nucleic Acids Res. 2021, 49, 216–227. [Google Scholar] [CrossRef]
  31. Kumar, S.; Stecher, G.; Li, M.; Knyaz, C.; Tamura, K. MEGA X: Molecular Evolutionary Genetics Analysis across Computing Platforms. Mol. Biol. Evol. 2018, 35, 1547–1549. [Google Scholar] [CrossRef]
  32. Lescot, M.; Déhais, P.; Thijs, G.; Marchal, K.; Moreau, Y.; Van de Peer, Y.; Rouzé, P.; Rombauts, S. PlantCARE, a database of plant cis-acting regulatory elements and a portal to tools for in silico analysis of promoter sequences. Nucleic Acids Res. 2002, 30, 325–327. [Google Scholar] [CrossRef]
  33. Raudvere, U.; Kolberg, L.; Kuzmin, I.; Arak, T.; Adler, P.; Peterson, H.; Vilo, J. g:Profiler: A web server for functional enrichment analysis and conversions of gene lists (2019 update). Nucleic Acids Res. 2019, 47, W191–W198. [Google Scholar] [CrossRef] [PubMed]
  34. Shannon, P.; Markiel, A.; Ozier, O.; Baliga, N.S.; Wang, J.T.; Ramage, D.; Amin, N.; Schwikowski, B.; Ideker, T. Cytoscape: A software environment for integrated models of biomolecular interaction networks. Genome Res. 2003, 13, 2498–2504. [Google Scholar] [CrossRef] [PubMed]
  35. Moussu, S.; Broyart, C.; Santos-Fernandez, G.; Augustin, S.; Wehrle, S.; Grossniklaus, U.; Santiago, J. Structural basis for recognition of RALF peptides by LRX proteins during pollen tube growth. Proc. Natl. Acad. Sci. USA 2020, 117, 7494–7503. [Google Scholar] [CrossRef] [PubMed]
  36. Alberts, B. The Cell as a Collection of Protein Machines: Preparing the next Generation of Molecular Biologists. Cell 1998, 92, 291–294. [Google Scholar] [CrossRef]
  37. Pearce, G.; Moura, D.S.; Stratmann, J.; Ryan, C.A. RALF, a 5-kDa ubiquitous polypeptide in plants, arrests root growth and development. Proc. Natl. Acad. Sci. USA 2001, 98, 12843–12847. [Google Scholar] [CrossRef] [PubMed]
  38. Liao, H.; Tang, R.; Zhang, X.; Luan, S.; Yu, F. FERONIA Receptor Kinase at the Crossroads of Hormone Signaling and Stress Responses. Plant Cell Physiol. 2017, 58, 1143–1150. [Google Scholar] [CrossRef]
  39. Yu, F.; Qian, L.; Nibau, C.; Duan, Q.; Kita, D.; Levasseur, K.; Li, X.; Lu, C.; Li, H.; Hou, C.; et al. FERONIA receptor kinase pathway suppresses abscisic acid signaling in Arabidopsis by activating ABI2 phosphatase. Proc. Natl. Acad. Sci. USA 2012, 109, 14693–14698. [Google Scholar] [CrossRef]
  40. Wang, L.; Yang, T.; Wang, B.; Lin, Q.; Zhu, S.; Li, C.; Ma, Y.; Tang, J.; Xing, J.; Li, X.; et al. RALF1-FERONIA complex affects splicing dynamics to modulate stress responses and growth in plants. Sci. Adv. 2020, 6, 21. [Google Scholar] [CrossRef]
  41. Mecchia, M.A.; Santos-Fernandez, G.; Duss, N.N.; Somoza, S.C.; Boisson-Dernier, A.; Gagliardini, V.; Martínez-Bernardini, A.; Fabrice, T.N.; Ringli, C.; Muschietti, J.P.; et al. RALF4/19 peptides interact with LRX proteins to control pollen tube growth in Arabidopsis. Science 2017, 358, 1600–1603. [Google Scholar] [CrossRef] [PubMed]
  42. Gronnier, J.; Franck, C.M.; Stegmann, M.; DeFalco, T.A.; Abarca, A.; von Arx, M.; Dünser, K.; Lin, W.; Yang, Z.; Kleine-Vehn, J.; et al. Regulation of immune receptor kinase plasma membrane nanoscale organization by a plant peptide hormone and its receptors. eLife 2022, 11, e74162. [Google Scholar] [CrossRef] [PubMed]
  43. Jing, Y.; Shi, L.; Li, X.; Zheng, H.; He, L. AGP30: Cd tolerance related gene associate with mitochondrial pyruvate carrier 1. Plant Signal. Behav. 2019, 14, 1629269. [Google Scholar] [CrossRef] [PubMed]
  44. BBorassi, C.; Sede, A.R.; Mecchia, M.A.; Salgado Salter, J.D.; Marzol, E.; Muschietti, J.P.; Estevez, J.M. An update on cell surface proteins containing extensin-motifs. J. Exp. Bot. 2015, 67, 477–487. [Google Scholar] [CrossRef]
  45. Cannon, M.C.; Terneus, K.; Hall, Q.; Tan, L.; Wang, Y.; Wegenhart, B.L.; Chen, L.; Lamport, D.T.; Chen, Y.; Kieliszewski, M.J. Self-assembly of the plant cell wall requires an extensin scaffold. Proc. Natl. Acad. Sci. USA 2008, 105, 2226–2231. [Google Scholar] [CrossRef] [PubMed]
  46. Qi, X.; Behrens, B.X.; West, P.R.; Mort, A.J. Solubilization and partial characterization of extensin fragments from cell walls of cotton suspension cultures. Evidence for a covalent cross-link between extensin and pectin. Plant Physiol. 1995, 108, 1691–1701. [Google Scholar] [CrossRef]
  47. Lewis, D.R.; Olex, A.L.; Lundy, S.R.; Turkett, W.H.; Fetrow, J.S.; Muday, G.K. A kinetic analysis of the auxin transcriptome reveals cell wall remodeling proteins that modulate lateral root development in Arabidopsis. Plant Cell 2013, 25, 3329–3346. [Google Scholar] [CrossRef] [PubMed]
  48. Abdi, N.; Van Biljon, A.; Steyn, C.; Labuschagne, M.T. Salicylic Acid Improves Growth and Physiological Attributes and Salt Tolerance Differentially in Two Bread Wheat Cultivars. Plants 2022, 11, 1853. [Google Scholar] [CrossRef] [PubMed]
  49. Ogunsiji, E.; Umebese, C.; Stabentheiner, E.; Iwuala, E.; Odjegba, V.; Oluwajobi, A. Salicylic Acid Enhances Growth, Photosynthetic Performance and Antioxidant Defense Activity Under Salt Stress in Two Mungbean [Vigna radiata (L.) R. Wilczek] Variety. Plant Signal. Behav. 2023, 18, 2217605. [Google Scholar] [CrossRef]
  50. Arruda, T.F.L.; Lima, G.S.; Silva, A.; Azevedo, C.A.V.; Souza, A.R.; Soares, L.; Gheyi, H.R.; Lima, V.L.A.; Fernandes, P.D.; Silva, F.A.D.; et al. Salicylic Acid as a Salt Stress Mitigator on Chlorophyll Fluorescence, Photosynthetic Pigments, and Growth of Precocious-Dwarf Cashew in the Post-Grafting Phase. Plants 2023, 12, 2783. [Google Scholar] [CrossRef]
  51. Ji, H.; Liu, L.; Li, K.; Xie, Q.; Wang, Z.; Zhao, X.; Li, X. PEG-mediated osmotic stress induces premature differentiation of the root apical meristem and outgrowth of lateral roots in wheat. J. Exp. Bot. 2014, 65, 4863–4872. [Google Scholar] [CrossRef] [PubMed]
  52. Colebrook, E.H.; Thomas, S.G.; Phillips, A.L.; Hedden, P. The role of gibberellin signalling in plant responses to abiotic stress. J. Exp. Biol. 2014, 217, 67–75. [Google Scholar] [CrossRef] [PubMed]
  53. Rehman, A.; Azhar, M.T.; Hinze, L.; Qayyum, A.; Li, H.; Peng, Z.; Qin, G.; Jia, Y.; Pan, Z.; He, S.; et al. Insight into abscisic acid perception and signaling to increase plant tolerance to abiotic stress. J. Plant Interact. 2021, 16, 222–237. [Google Scholar] [CrossRef]
  54. Luo, X.; Li, C.; He, X.; Zhang, X.; Zhu, L. ABA signaling is negatively regulated by GbWRKY1 through JAZ1 and ABI1 to affect salt and drought tolerance. Plant Cell Rep. 2020, 39, 181–194. [Google Scholar] [CrossRef] [PubMed]
  55. Zhao, C.; Jiang, W.; Zayed, O.; Liu, X.; Tang, K.; Nie, W.; Li, Y.; Xie, S.; Li, Y.; Long, T.; et al. The LRXs-RALFs-FER module controls plant growth and salt stress responses by modulating multiple plant hormones. Natl. Sci. Rev. 2021, 8, nwaa149. [Google Scholar] [CrossRef] [PubMed]
  56. Feng, W.; Kita, D.; Peaucelle, A.; Cartwright, H.N.; Doan, V.; Duan, Q.; Liu, M.C.; Maman, J.; Steinhorst, L.; Schmitz-Thom, I.; et al. The FERONIA Receptor Kinase Maintains Cell-Wall Integrity during Salt Stress through Ca(2+) Signaling. Curr. Biol. 2018, 28, 666–675. [Google Scholar] [CrossRef]
  57. Bacete, L.; Schulz, J.; Engelsdorf, T.; Bartosova, Z.; Vaahtera, L.; Yan, G.; Gerhold, J.M.; Tichá, T.; Øvstebø, C.; Gigli-Bisceglia, N.; et al. THESEUS1 modulates cell wall stiffness and abscisic acid production in Arabidopsis thaliana. Proc. Natl. Acad. Sci. USA 2022, 119, e2119258119. [Google Scholar] [CrossRef] [PubMed]
  58. Lim, C.W.; Baek, W.; Jung, J.; Kim, J.-H.; Lee, S.C. Function of ABA in Stomatal Defense against Biotic and Drought Stresses. Int. J. Mol. Sci. 2015, 16, 15251–15270. [Google Scholar] [CrossRef] [PubMed]
  59. Zhu, J.K. Salt and drought stress signal transduction in plants. Annu. Rev. Plant Biol. 2002, 53, 247–273. [Google Scholar] [CrossRef]
  60. Jing, H.; Wilkinson, E.G.; Sageman-Furnas, K.; Strader, L.C. Auxin and abiotic stress responses. J. Exp. Bot. 2023, 74, 7000–7014. [Google Scholar] [CrossRef]
  61. Xiong, B.; Wang, Y.; Zhang, Y.; Ma, M.; Gao, Y.; Zhou, Z.; Wang, B.; Wang, T.; Lv, X.; Wang, X.; et al. Alleviation of drought stress and the physiological mechanisms in Citrus cultivar (Huangguogan) treated with methyl jasmonate. Biosci. Biotechnol. Biochem. 2020, 84, 1958–1965. [Google Scholar] [CrossRef] [PubMed]
  62. Yu, J.; Jiang, M.; Guo, C. Crop Pollen Development under Drought: From the Phenotype to the Mechanism. Int. J. Mol. Sci. 2019, 20, 1550. [Google Scholar] [CrossRef] [PubMed]
Figure 1. BrLRX gene localization and replication on B. rapa chromosomes. The outermost red blocks are representative of the 10 chromosomes, and the middle and inner regions show the density of each chromosome. A yellow line in the middle shows the collinearity between B. rapa’s BrLRXs.
Horticulturae 10 00571 g001
Figure 2. (A) Phylogenetic tree of LRXs in B. rapa, A. thaliana, and O. sativa. Different colors correspond to different groups: yellow indicates Group 1, blue indicates Group 2, and green indicates Group 3. Green triangles represent branch nodes, and red stars indicate leaf nodes. (B) Gene expression patterns for B. rapa and A. thaliana. Red lines indicate homologous genes.
Horticulturae 10 00571 g002
Figure 3. Motif and gene structure in B. rapa: (A) An overview of BrLRX gene structure and conserved structural domains. Green boxes show exons for which MEME analysis identified conserved structural domains of LRX genes in B. rapa. (B) Each color indicates a specific structural domain. (C) The structural domains of LRXs in B. rapa exhibit a high degree of conservation, as indicated by the integral height of each stack, with the size of each letter representing the amino acid frequency at the respective site.
Horticulturae 10 00571 g003
Figure 4. Examination of cis-regulatory motifs within BrLRXs promoter regions reveals a diverse array of elements in B. rapa. Each hue represents a specific cis-element linked to various biological functions, while numerical values denote their abundance per gene. Absence of a cis-regulatory element is depicted by white squares. Varied colors flanking the grid symbolize disparate biological pathways.
Horticulturae 10 00571 g004
Figure 5. A heatmap illustrating the expression profiles of BrLRXs across various organs in B. rapa. Each cell represents the log2-transformed gene expression in different organs, with deeper hues of red indicating higher expression and cooler tones suggesting lower expression levels.
Horticulturae 10 00571 g005
Figure 6. The expression of LRXs in B. rapa after 0 h and 6 h of osmotic and salt stress was detected by RNA-seq and proteome analysis: (A) The expression of BrLRXs under PEG-6000 was detected by RNA-seq. (B) The expression of BrLRXs under 150 mM NaCl was detected by RNA-seq. (C) The expression of BrLRXs under PEG-6000 was detected by proteomics. (D) The expression of BrLRXs under 150 mM NaCl was detected by proteomic analysis.
Horticulturae 10 00571 g006
Figure 7. RT-qPCR was used to analyze the expression levels of BrLRX genes in B. rapa under salt stress and osmotic stress: (A) Expression levels of four genes under salt stress. (B) Expression levels of four genes under osmotic stress. In the above experiment, 0 h (CK) was used as a control, and the samples were tested after 4 h, 6 h, and 12 h. Data are shown as means; errors are shown as ±SD (t-test, * p < 0.05, ** p < 0.01).
Horticulturae 10 00571 g007
Figure 8. The gene ontology (GO) annotations assigned to LRXs in A. thaliana. GO terms were classified into three main categories: “BP” for biological process, “CC” for cellular component, and “MF” for molecular function. The y-axis represents the respective GO term, while the x-axis illustrates the gene count associated with each specific GO term. The bars portray the −logP value.
Horticulturae 10 00571 g008
Figure 9. Secondary and tertiary structure analysis of LRXs in B. rapa: (A) Secondary structure prediction. (B) Tertiary structure prediction. The color of the bands varies from red to blue, indicating that the protein structure is from the N-terminus to the C-terminus.
Horticulturae 10 00571 g009
Figure 10. Protein–protein interaction (PPI) networks of LRX proteins were investigated in A. thaliana: (A) An analysis was conducted to predict the interaction networks of LRX in A. thaliana. (BF) LRX2, 4, 5, 6, and 11 in A. thaliana were individually analyzed for their predicted interactions. The analysis required a minimum engagement score of 0.150, with other parameters set to default values. Network nodes represent proteins, while edges denote protein–protein associations. Key functional proteins are depicted by dark green circles. The size of each circle corresponds to the node’s degree value, with larger circles indicating higher degrees.
Horticulturae 10 00571 g010
Table 1. Basic information of BrLRXs is shown in the table. The italics in parentheses in the A. thaliana column are the alternate names of the genes. “MW” is molecular weight; “pI” is the isoelectric point.
Gene NameGene IDChromosomepIMW (Da)Protein Length
(aa)
Subcellular LocationA. thaliana IDA. thaliana Name
BrLRX1Bra011483A01:1996205-19982895.3274,239.31694Nucleus, ChloroplastAT4G33970AtLRX11
BrLRX2Bra013339A01:5076635-50888166.6980,732.58758ChloroplastAT4G18670AtLRX5
BrLRX3Bra023805A01:20099064-201014886.5448,666.94436Chloroplast, ExtracellularAT3G22800AtLRX6
BrLRX4Bra037543A01:21776633-217791555.5490,368.26840Vacuolar membraneAT3G19020AtLRX8
BrLRX5Bra001730A03:18114562-181200535.23125,711.551153Vacuolar membraneAT3G19020AtLRX8
BrLRX6Bra001950A03:19552078-195558276.7582,626.60756NucleusAT3G24480AtLRX4
BrLRX7Bra013092A03:20527348-205299336.8992,180.92860Vacuolar membrane, ExtracellularAT2G15880AtLRX10
BrLRX8Bra017617A03:29343070-293453706.5381,850.73776ExtracellularAT4G33970AtLRX11
BrLRX9Bra033914A05:15169415-151708755.7551,109.69461ExtracellularAT3G22800AtLRX6
BrLRX10Bra019737A06:4713634-47159368.0174,056.35684NucleusAT1G12040AtLRX1
BrLRX11Bra009850A06:17668994-176702534.9146,466.39419Vacuolar membraneAT5G25550AtLRX7
BrLRX12Bra014193A08:2658201-26603845.2778,665.99727Vacuolar membrane, ExtracellularAT1G49490AtLRX9
BrLRX13Bra034594A08:12612559-126145715.2871,304.18670NucleusAT4G33970AtLRX11
BrLRX14Bra016796A08:20029117-200314298.4883,428.68770ExtracellularAT1G12040AtLRX1
BrLRX15Bra027044A09:7860356-78625698.4779,946.18737Vacuolar membrane, ExtracellularAT1G62440AtLRX2
BrLRX16Bra026996A09:34684812-346865665.8663,602.80584Chloroplast, Extracellular, Vacuolar membraneAT1G12040AtLRX1
BrLRX17Bra015245A10:2972264-29747687.0889,419.33834Vacuolar membraneAT2G15880AtLRX10
Table 2. Information regarding LRX motifs in B. rapa.
MotifMotif Consensus
Motif1FENPRLKRAYIALQAWKKAIYSDPFNTTANWHGPDVCSYTGVYCAPALDD
Motif2FENPRLKRAYIALQAWKKAIYSDPFNTTANWHGPDVCSYTGVYCAPALDD
Motif3VVLSLPSLKFLDLRFNEFEGKVPSELFDKDLDAIFLNNNRFRSTIPENLG
Motif4VVLSLPSLKFLDLRFNEFEGKVPSELFDKDLDAIFLNNNRFRSTIPENLG
Motif5VVLSLPSLKFLDLRFNEFEGKVPSELFDKDLDAIFLNNNRFRSTIPENLG
Motif6VPGSRKEIALDDTRNCLPDRPKQRSAKECAVVISRPVDCSKDKCAGGGSS
Motif7FSKLKLLHELDVSNNRFVGPF
Motif8VSVVVLABNKFGGCI
Motif9AYALTDEEASFJVQRQLLTLPENGD
Motif10TPPAEAPAPSDEFILPPFIGHQYASPPPPMFPGY
Disclaimer/Publisher’s Note: The statements, opinions and data contained in all publications are solely those of the individual author(s) and contributor(s) and not of MDPI and/or the editor(s). MDPI and/or the editor(s) disclaim responsibility for any injury to people or property resulting from any ideas, methods, instructions or products referred to in the content.

