Article

Elucidation of Shoot and Root Growth, Physiological Responses, and Quality Traits of Tomato (Solanum lycopersicon L.) Exposed to Elevated Calcium Carbonate Concentrations

by
Naveedullah Sediqui
1,2,*,
Mohammad Wasif Amin
3,4,
Niamatullah Dawlatzai
1,
Gulbuddin Gulab
5,
Dawlat Shah Poyesh
6,
Naoki Terada
1,
Atsushi Sanada
1,
Atsushi Kamata
7 and
Kaihei Koshio
1
1
Faculty of International Agriculture and Food Studies, Tokyo University of Agriculture, Sakuragaoka 1-1-1, Setagaya-ku 156-8502, Tokyo, Japan
2
Department of Horticulture, Faculty of Agriculture, Alberoni University, Kapisa 1254, Afghanistan
3
Faculty of Regional Environment Science, Tokyo University of Agriculture, Sakuragaoka 1-1-1, Setagaya-ku 156-8502, Tokyo, Japan
4
Faculty of Agriculture, Parwan University, Parwan 1102, Afghanistan
5
Department of Horticulture, Faculty of Agriculture, Nangarhar University, Nangarhar 2601, Afghanistan
6
Department of Horticulture, Faculty of Agriculture, Bamyan University, Bamyan 1601, Afghanistan
7
Department of Agriculture, Faculty of Agriculture, Tokyo University of Agriculture, Isehara Farm, 1499-1 Maehata, Sannomiya, Isehara 259-1103, Kanagawa, Japan
*
Author to whom correspondence should be addressed.
Horticulturae 2024, 10(6), 573; https://doi.org/10.3390/horticulturae10060573
Submission received: 28 April 2024 / Revised: 19 May 2024 / Accepted: 21 May 2024 / Published: 31 May 2024
(This article belongs to the Section Fruit Production Systems)

Abstract

:
The excess presence of calcium carbonate (CaCO3) in soil poses challenges for production of horticultural crops, including tomatoes. This condition is prevalent in arid and semi-arid regions of Afghanistan. The objective of this study was to evaluate the effects of elevated concentrations of CaCO3 on growth, physiology, and quality attributes of tomato. Seedlings were exposed to different concentrations of CaCO3 (0%, 2.5%, 5%, 10%, and 20% w/w) in soil. The results showed that elevated concentrations of CaCO3 (10% and 20%) significantly increased soil electrical conductivity (EC) and pH, and subsequently affected growth, physiology, and quality of tomato. CaCO3 effects resulted in an increase in leaf electrolyte leakage, leaf calcium content, root respiration rate, root ethylene production, fruit firmness, total soluble solids, ascorbic acid, and organic acids, as well as a decrease in plant height, leaf length, leaf magnesium content, leaf SPAD value, number of leaves per plant, root weight and length, and root activity. At higher concentrations, CaCO3 decreased number of flowers and fruit per plant, as well as fruit weight and diameter, consequently affecting yield production. Although elevated concentrations of CaCO3 is characteristic of soils in Afghanistan, limited information is available about this topic. These findings enhance our understanding of soil conditions in the country and provide valuable insights for farmers.

1. Introduction

Soil, as a physical medium that provides water, a place, and nutrients for plants, so far directly and indirectly affects agricultural production [1]. Soils rich in calcium carbonate (CaCO3) derived from a variety of rocks, such as limestone, sandstone, carbonate-rich shale, or marl, are regarded as calcareous soils. The parent materials of calcium carbonate-rich soils are, to a certain degree, young, and undergo persistent weak weathering over extended periods of time compared to older soils [2]. Calcareous soils cover over 30% of the globe’s surface, and mainly occur in arid and semi-arid regions due to little leaching [3]. They lie within a pH range of near-neutral and alkaline soils [4], which means a range of 7.6–8.4 [5]. Calcareous soils predominantly contain an excess of free lime, and their CaCO3 content could differ from negligible amounts up to 95% [6]. In addition, they often have low amounts of organic matter and are deficient in nitrogen, phosphorus, and trace elements, especially iron and zinc [7]. CaCO3 is a key compound of many soils in dry regions, and the amount and types of formed CaCO3 in these soils limit water movement and root penetration [8]. CaCO3 has persistent effects on soil pH and calcium ion concentrations, where both of them, either alone or in combination, may affect root growth and some soil biological activities, and thus affect the uptake of nutrients [9]. Certain increments of pH and Ca levels in the soil triggered by an excess presence of CaCO3 can disturb plant growth due to their role in interrupting soil–water relation and availability of some macro- and micronutrients [6]. Major nutritional constraints in calcareous soils that affect plant growth and yield production include deficiencies of iron (Fe), zinc (Zn), manganese (Mn), boron (B), and phosphorus (P) [10]. On the other hand, the uptake of potassium (K), calcium (Ca), and magnesium (Mg) is increased in calcareous soils [11,12]. Moreover, plants in these kinds of soils often suffer from excessive bicarbonate ion (HCO3-), a water deficit, mechanical impedance, and a reduction in P, Fe, Zn, B, and Mn solubility due to a high pH and high bicarbonate ion concentrations [10]. These conditions inhibit root growth, cause nutrient deficiency, affect solute transport into the xylem, and later, the rate of cytokinin distribution to shoot, which is essential for protein synthesis and chloroplast development [10]. These consequences will impact the plant’s health and productivity.
Afghanistan is a mountainous country with semi-arid and arid continental climates, having cold winters and hot summers in most areas [13]. The country’s mean annual precipitation was reported to be 327 mm in 2017, highlighting a low rainfall level [14]. Afghanistan soils, pedologically known as young soils, have developed under arid and semi-arid climatic conditions [15]. They developed under the influence of the climate and underwent thorough calcification, a process that involves accumulation of CaCO3 due to upward movement and evaporation of underground water containing large quantities of this substance [16]. Afghanistan soils usually have a high CaCO3 content, alkaline conditions, sandy loam and clay loam textures, and a high permeability and infiltration rate, but a low water holding capacity, low fertility, and low organic matter content ranging from 0.2% to 2.5% [17]. These soils possess low amounts of nitrogen, varying amounts of phosphorus, and sufficient amounts of potassium [18]; their average pH is 8.2, with a CaCO3 concentration of 23% and sand content of 49% [19]. The pH status of the country’s soils was reported in a way that 50% of the soils had a pH of 8–8.5, 35% had a pH of 8.5–9, and 10% had a pH of 9–9.5. Soils with a pH ranging from 8 to 8.5 are normally excessive in CaCO3, making up 10% to 40% of soil content in some cases [16]. For instance, assessed paddy field soils in Nangarhar province of Afghanistan had an average pH of 8.4, and their carbonate content laid between 4.9 and 16.9 g C kg−1. The characteristics of high pH and elevated CaCO3 content of these soils come from an arid climate and carbonate-rich geology [20].
Tomato is widely grown and consumed throughout the country, with an estimated domestic production of 1.1 million tons in 2014 [21]. Tomato is considered as one of the major vegetable crops, an important cash crop, and an economically important vegetable of the country [22]. The tomato is commonly used as a plant for studying fruit development, metabolite analysis, and responses to biotic and abiotic stresses [23]. Tomato cv. Micro-Tom, basic in its compact habit, has been considered an ideal model for conducting various research studies on tomato [24].
Previous studies on agricultural crops have shown that the addition of excessive levels of CaCO3 as an amendment adversely affects plant growth by decreasing parameters such as the number of fruits, plant height, stem diameter, plant fresh and dry weight, number of branches [25,26,27], canopy size, and fruit yield [28]. Lee and Kim [26] and Bessrour et al. [29] observed a slight reduction in leaf chlorophyll content caused by the application of CaCO3. On the other hand, an excess of CaCO3 in the soil diminishes the availability of P and micronutrients to plants [10,11]. In arid and semi-arid regions, where calcareous soils are common and rainfall is limited, the failure of sufficiently leaching accumulated Ca has significant implications for agricultural production. Excessive Ca and alkaline pH in the soil surrounding plant roots create abiotic stress, hampering root growth and nutrient absorption, and consequently decreasing yield and affecting fruit quality. For this reason, it is required to adopt optimized agricultural practices such as irrigation, tillage, and fertilization [3] to enhance crop and nutritional management in order to effectively tackle the soil challenge.
Understanding the properties of calcareous soil and its effects on plant growth and physiology is crucial for implementing effective approaches to mitigate its adverse effects. Although elevated soil CaCO3 content is a common characteristic of most soils in Afghanistan, there is limited information available on this issue. Consequently, the aim of this study was to know how increased levels of CaCO3 in the soil impacts the growth, physiological traits, and quality attributes of tomato plants.

2. Materials and Methods

The experiment was conducted in a laboratory and a greenhouse belonging to the Laboratory of Tropical Horticulture, Tokyo University of Agriculture, Setagaya Campus, Japan. The experiment location is geographically situated within N 35° 38′ 33.6804 latitude, E 139° 38′ 1.2084 longitude, and 52 m altitude. Tomato (Solanum lycopersicon L. cv. Micro-Tom) seeds were sown in a moistened petri dish and kept in an incubator under 25 °C for 72 h to germinate. The germinated seeds were placed in a seed tray filled with Akadama soil, which is a granular clay-like soil (Japanese volcanic soil, Makino Co., Ltd., Tochigi, Japan), and positioned in the greenhouse. The seed tray was irrigated regularly 1–2 times a day. A nutrient solution was prepared by combining certain quantities of fertilizers, including OAT House 1 [N 10.0%, P2O5 8.0%, K2O 27.0%, MgO 4.0%, MnO 0.1%, B2O3 0.1%, Fe 0.18%, Cu 0.002%, Zn 0.006%, and Mo 0.002%] and OAT House 2 [NO3-N 11.0 % and Ca 16.4%] (OAT Agrio, Tokyo, Japan). The nutrient solution was mixed with irrigation water to achieve an EC of less than 1 mS cm−1, with the aim of optimizing seedling growth. At the 7–10 leaf stage, the seedlings were transplanted to a growing medium composed of Akadama soil and leaf compost at a 5:1 ratio. The medium was prepared with and without the inclusion of CaCO3 (White Lime, Home Chemical Industry Co., Ltd., Osaka, Japan). The five treatments of this experiment with varying percentages of CaCO3 were the control (0%), 2.5%, 5%, 10%, and 20%. A plastic pot with dimensions of 20 × 16 cm (height and diameter) was used as a planting container and filled with 2.5 kg of the growing medium. Before planting, a slow-release fertilizer with a grade of 13-9-11 (NPK) and application rate of 200 kg N per hectare was incorporated into the soil. The plants were irrigated with tap water twice a week in the early and mid-growth stages and once a week in the late growth stage. An aphid and whitefly sticky trap was used to minimize pest incidences.

2.1. Measurement of Soil pH and Soil Electrical Conductivity (EC)

The soil pH was measured using the soil–water suspension method (1:2.5) with a pH meter (LAQUAtwin B-712, Horiba, Kyoto, Japan), while the soil EC was measured by employing the soil–water extract method (1:5) with an EC meter (LAQUAtwin-S070, Horiba, Kyoto, Japan). Rayment and Lyons [30] described both measurement methods.

2.2. Measurement of Shoot Growth and Physiology

The plant height and leaf length, expressed in centimeters (cm), were measured weekly with a ruler in a six-week period, starting from late vegetative growth stage as plants began flowering. Here, plant height refers to the length of the plant, and was taken from the soil surface to its apex, while the leaf length involved the distance from the lowest secondary leaflets to the terminal leaflet in a compound leaf. The number of leaves per plant−1 was counted in the late flowering stage. The leaf EL measurement was performed according to Wang et al. [31] with some modifications. The leaf disk was removed using a cork borer with a 1 mm diameter, and placed inside a 2 mL tube containing 1 mL of water for an hour. The EC of the solution (EC1) was read with an EC meter (LAQUAtwin-S070, Horiba, Kyoto, Japan). The tube was boiled for one hour in a heat block at 100 °C and was cooled immediately. The EC of the solution was measured again (EC2). The EL was derived by dividing EC1 by EC2, and multiplying the result by 100, as described by Wang et al. [31].
EL (%) = [EC1 × EC2−1] × 100
The leaf Ca concentration was determined using the OCPC (o-Cresolphthalein Complexone) method employing an SFP-3, a spectro-flame-photometer (Fujihira Industry Co., Ltd., Tokyo, Japan), whereas the leaf Mg concentration was measured utilizing the Xyridyl Blue-1 (XB-I) method with the same soil plant analyzer system [32]. In the case of the SPAD value, which expresses the amount of chlorophyll in a leaf, it was measured using a SPAD-502 Plus meter.

2.3. Measurement of Root Growth and Physiology

The root fresh weight was expressed in grams (g), and it was determined with a lab balance after removing the root’s surface moisture, while the root length was measured with a ruler and expressed in centimeters (cm). The root respiration rate, which was determined based on the amount of emitted CO2, was determined by a gas chromatography machine (GC-14B, Shimadzu, Kyoto, Japan) paired with a thermal conductivity detector (TCD, Shimadzu, Kyoto, Japan) and Sunpack-A column (Shinwa Kako, 2.1 m × 3.2 mmφ, a glass column filled with porous poly beads). Roots were cut from the plant and washed, and their moisture was removed with blotting paper. Then, the roots were incubated inside a 550 mL sealed container at room temperature (25 °C) in the dark for an hour. A total of 1 mL of gas was removed from the container with a plastic syringe and injected into the machine. Helium was used as a carrier gas. The machine column was adjusted to 40 °C, the injector to 150 °C, and the detector to 150 °C. To measure the root ethylene production, 1 mL of gas was taken out from the same container using a plastic syringe and injected into the gas chromatography machine (GC-14B, Shimadzu, Kyoto, Japan) coupled with a chromatography-flame ionization detector (FID, Shimadzu, Kyoto, Japan) and a Sunpack-A column (Shinwa Kako, 2.1 m × 3.2 mmφ, a glass column filled with porous poly beads). N2 was used as a carrier gas, and the measurement parameter for the detector was adjusted to 200 °C, the injector to 180 °C, and the column to 80 °C.
Root activity, shown in mg FWmg−1 h−1, was measured using the MTT (3-(4,5-dimethylthiazol-2-yl)-2,5-diphenyltetrazolium bromide) assay described by Kusunoki [33] and Castro-Concha et al. [34], with some modifications. Root was collected at the end of the experiment and washed twice with 50 mM phosphate buffer (pH 7.5). It was weighed at 500 mg, and placed in a petri dish, to which 10-20 mL of an MTT solution (1% MTT + 99% phosphate buffer) was added, and then incubated for 8 h at room temperature (25 °C). Formazan salt was solubilized in 1.5 mL of methanol (50%) containing 1% SDS (sodium dodecyl sulfate) and heated at 60 °C for 30 min in a falcon tube. Afterwards, the roots were crushed with a mortar and pestle, and diluted in 3 mL of methanol (50%). The sample was centrifuged at 1875× g for 5 min. The supernatant was collected, and the absorbance was quantified at 570 nm using a spectrophotometer (U-1100, Hitachi, Ltd., Tokyo, Japan).

2.4. Measurement of Yield and Fruit Characteristics

The set flowers of each plant were counted to determine the number of flowers per plant−1. The number of fruits per plant−1 were counted at the time of harvesting. The yield per plant, fruit weight, and fruit diameter were measured when the majority of the fruit reached maturity. The yield and fruit weight were estimated with a portable lab balance and expressed in (g). To calculate fruit size, the diameter of the fruit was determined with a grade caliper and expressed in millimeters (mm).

2.5. Measurement of Fruit Quality

Ripe fruits were gathered to assess their quality. Five mature fruits were chosen for each treatment (replication) based on their date of flowering. Fruit firmness, expressed in newton (N), was tested using a texturometer (Instron 3342, Illinois Tool Works Inc., Hopkinton, MA, USA). Total soluble solids, expressed in percentage (%), was measured by the application of a drop of squeezed juice on a digital refractometer (PAL-1, Atago Co. Ltd., Tokyo, Japan). The amount of ascorbic acid (vitamin C) was quantified by smashing 2.5 g of fruit in a 2.5 mL metaphosphoric acid solution (5%) using a mortar and pestle until a uniform liquid was obtained. The solution was filtered through a 2-layer gauge, collected in a 2 mL tube, and centrifuged for 5 min at 12,000× rpm. An ascorbic acid reading was performed using a reflectometer (RQflex 10, Merck, Darmstadt, Germany).
Fruit sugars and organic acids were measured by an HPLC machine (Shimadzu 2007, Kyoto, Japan) using methods described by Haris et al. [35]. Tomato was pre-cooled in liquid nitrogen and crushed into fine powder with a mortar and pestle. To quantify the sugars, 200 mg of powder was measured and put into a 2 mL tube, and 1.6 mL of 5% ethanol was added. The mixture was vortexed and sonicated. Later, it was subjected to a 15 min centrifugation at 15,000× g at 4 °C. The resulting supernatant (900 µL) was taken out and put into a new 2 mL tube, to which 900 µL of HPLC-grade acetonitrile was added. The mixture was vortexed smoothly. The content was filtered into a 2 mL HPLC vial using a 2.5 mL syringe fitted with a Millex-LG (PTFE) filter (0.20 µm). A Shodex sugar KS-801 column (8 mm in diameter and 300 mm in length) and RID-10A refractive index detector were fitted into the HPLC system. The flow rate was adjusted to 0.8 mL min−1 of deionized water with a 10 µL sample, and the column oven temperature was adjusted to 80 °C. To quantify the organic acids, the powder was weighed to 300 mg and was mixed in a centrifuge tube with 2.4 mL deionized water using a vortex mixer. After that, the supernatant was transferred into a 2 mL tube. A 2.5 mL syringe with a 0.45 µm DISMIC cellulose acetate filter unit was used to deplete the sample. It went into a 2 mL HPLC vial after filtration. SCR-102H × 2 were used as columns (8 mm in length × 300 mm × 2), and a CDD-10AVP was used as a conductivity detector. The flow rate was maintained at 0.8 mL min−1, and the column oven temperature was adjusted to 40 °C, while isocratic elution was performed with 100% 3 mM HCO4.

2.6. Data Statistical Analysis

Variance analysis was carried out to find differences among the treatments. An SPSS software package (v. 16.0) was used to compare means. The means were statistically evaluated with Tukey’s Test. Origin 2024 software was used for performing principal component analysis (PCA) and creation of the correlation coefficient (matrix).

3. Results

3.1. Soil pH and Soil EC

The addition of CaCO3 into the growing medium altered the soil pH and soil EC (Table 1). The soil pH was increased by all CaCO3 concentrations compared to the control (p < 0.01); however, there was no significant difference among the CaCO3 treatments. Meanwhile, the soil EC was significantly increased by the 10% and 20% concentrations of CaCO3 (Table 1). The difference was significant at a p < 0.01 level.

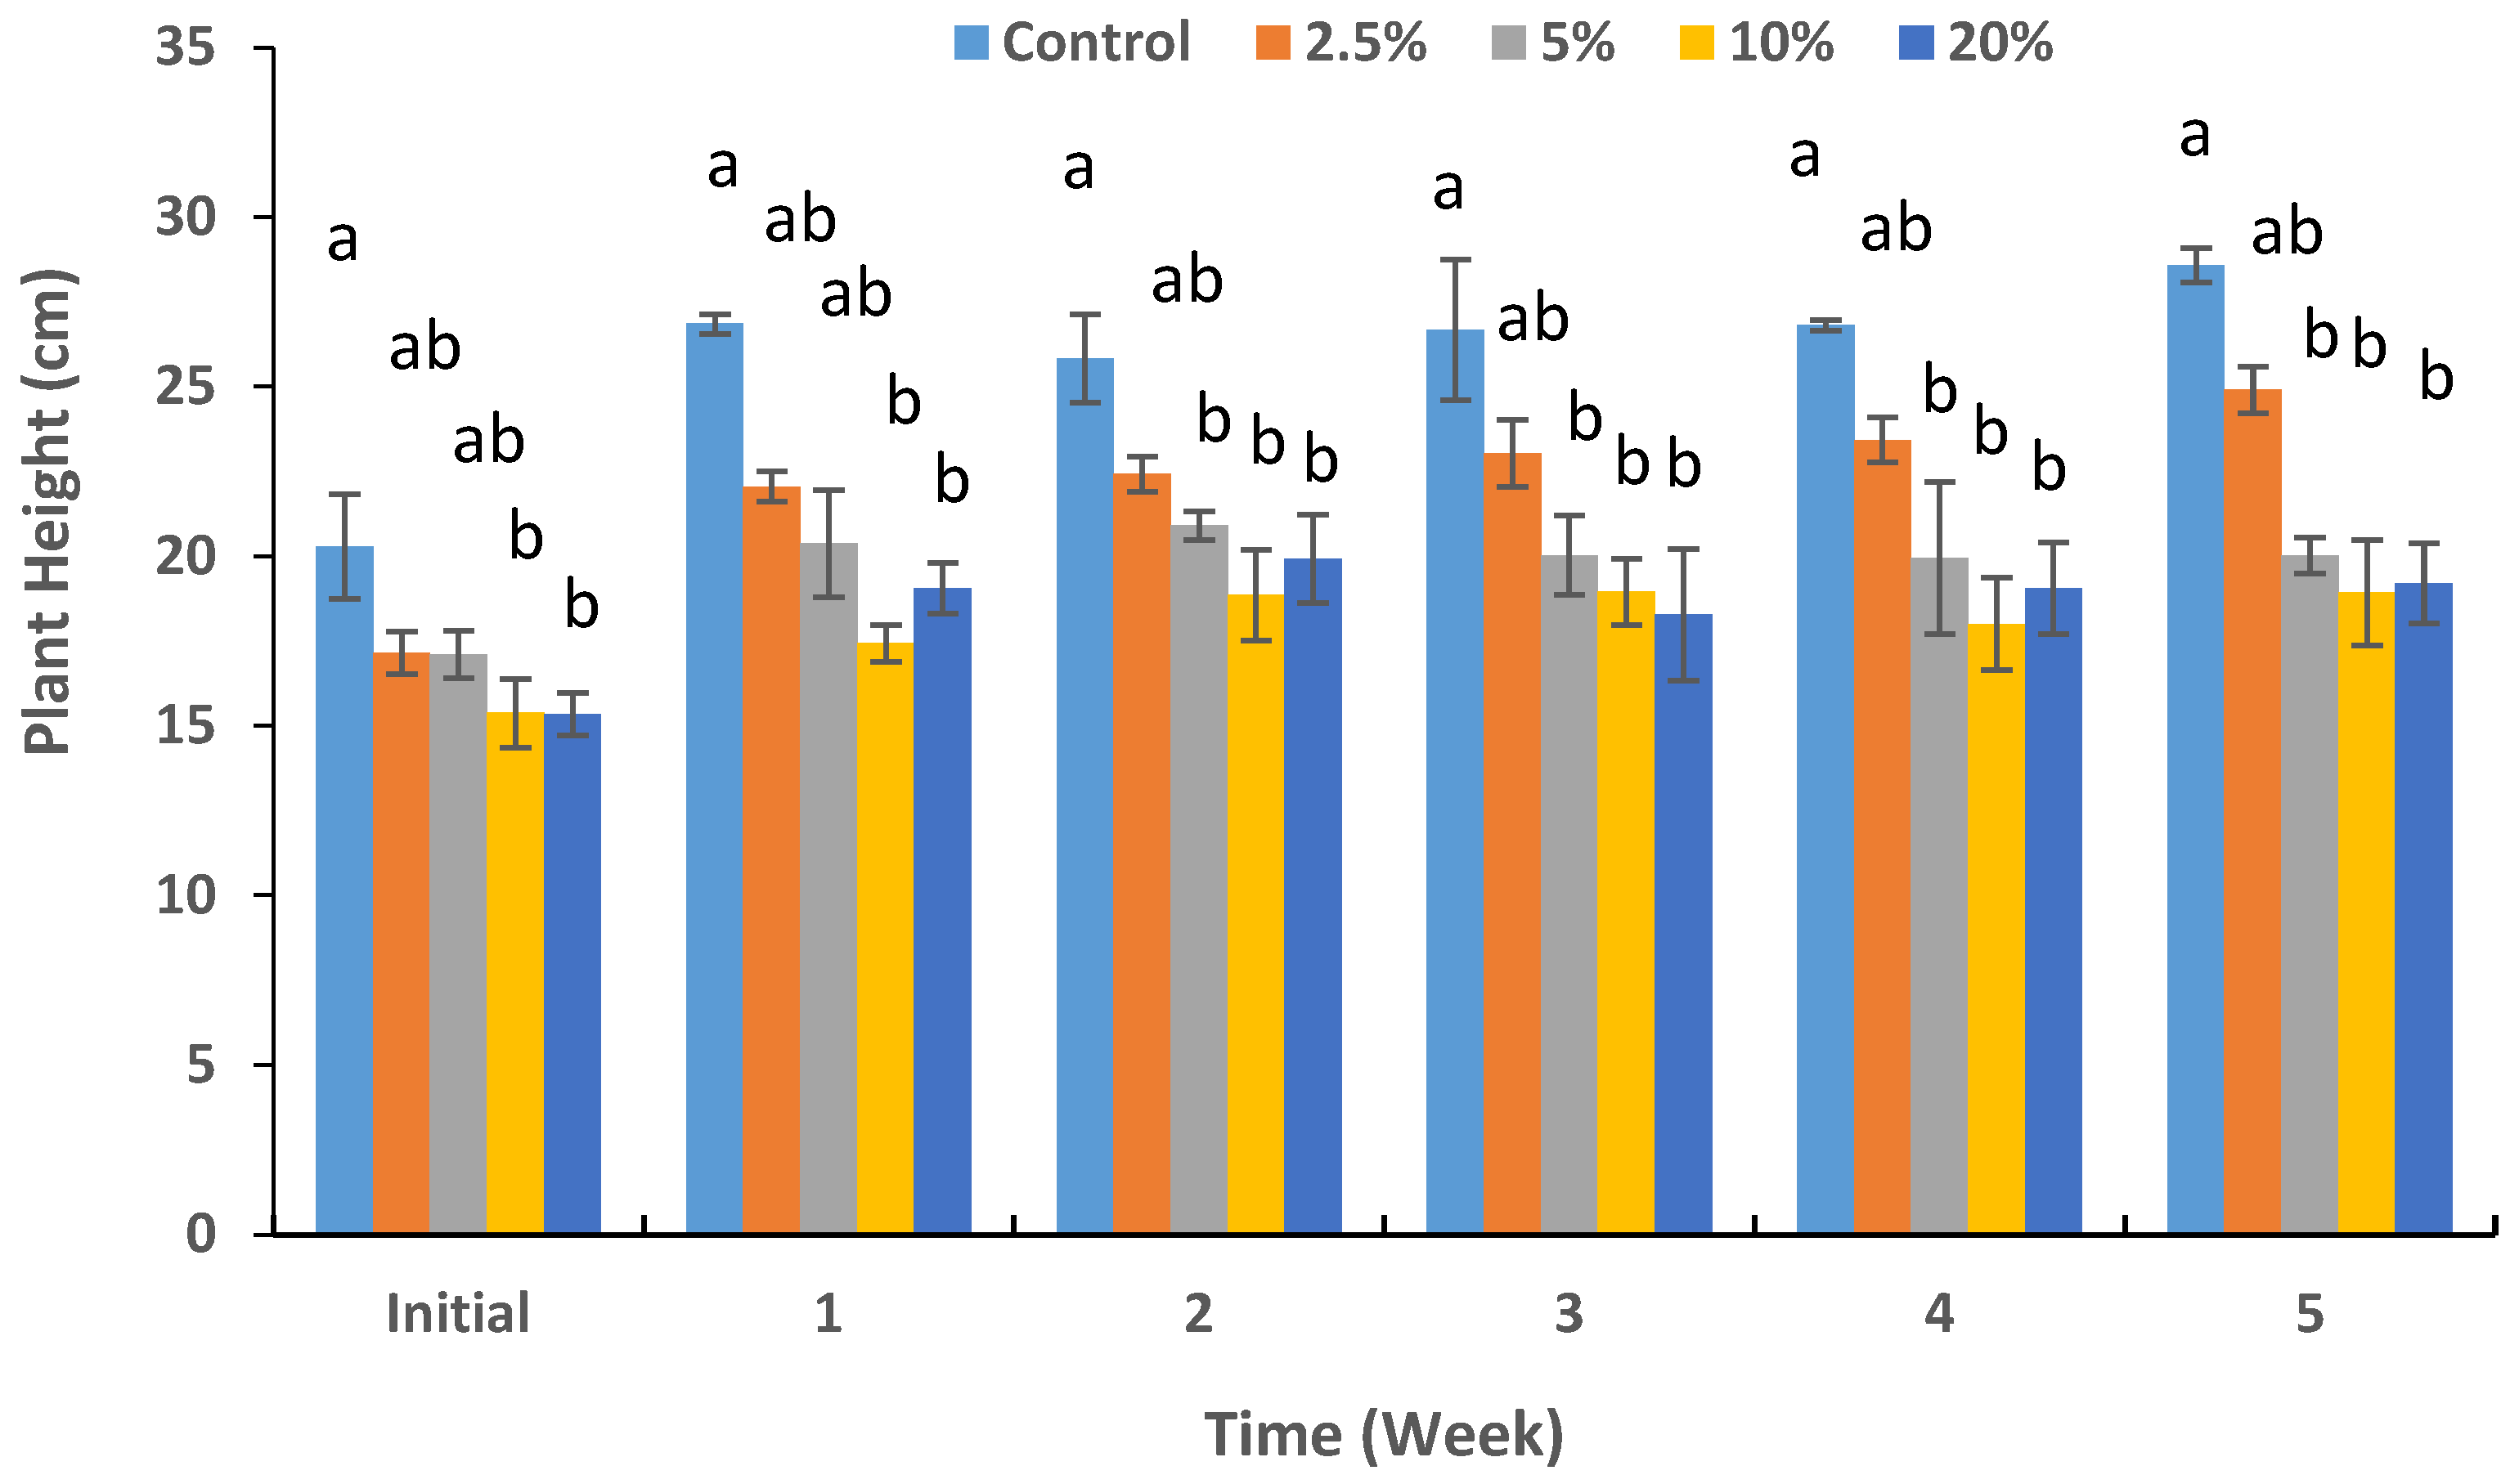
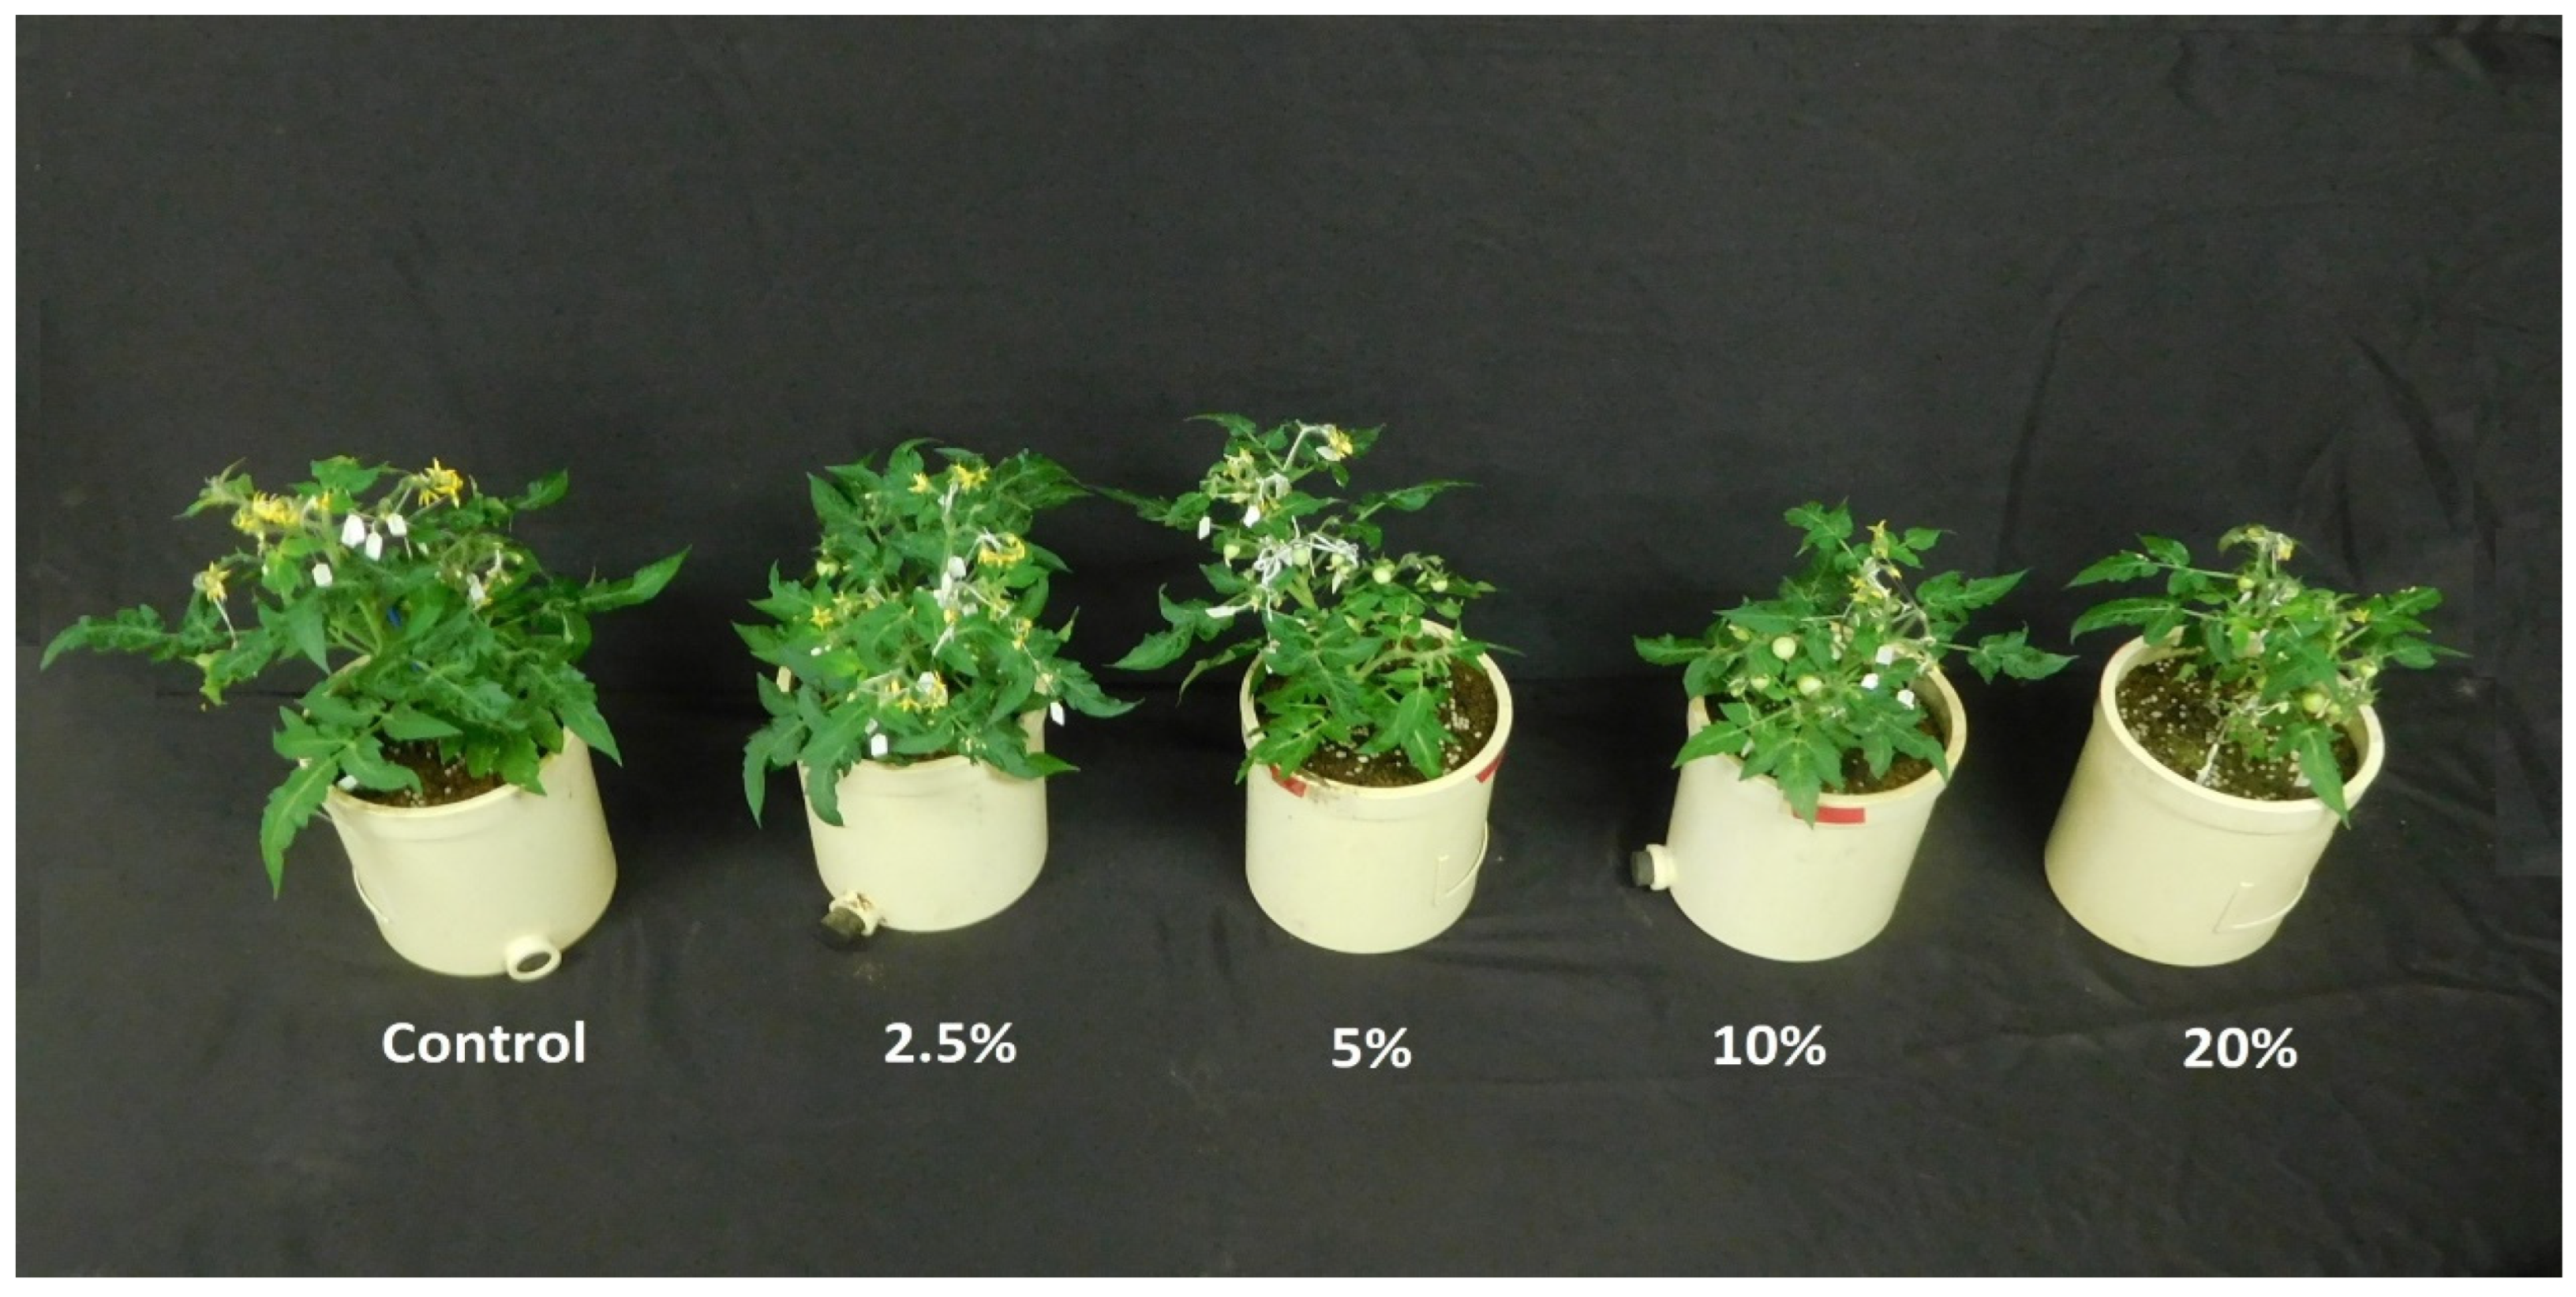
3.2. Shoot Growth and Physiology

The plant height was decreased by the addition of 2.5% concentration of CaCO3 or higher in the growing medium (Figure 1 and Figure 2). The plants treated with 5%, 10%, and 20% concentrations were significantly shorter than the control (p < 0.05). Regarding leaf length, it was significantly reduced by 10% and 20% concentrations (Figure 3 and Figure 4). In the case of the number of leaves per plant−1, a gradual increase in soil amended with CaCO3 gradually decreased the number of leaves per plant−1 (Table 2). The difference became significant at 10% and 20% concentrations (p < 0.05). Turning to leaf Ca content, the results showed that all concentrations of CaCO3 significantly increased leaf Ca content compared to the control (Table 2). The differences between the treatments were statistically significant at p < 0.05. In terms of leaf Mg content, the inclusion of CaCO3 in the soil led to a slight decrease in leaf Mg content, although this decline was not statistically significant. In the case of leaf EL, it was significantly increased when plants were subjected to 10% and 20% CaCO3 concentrations (Table 2). Regarding leaf chlorophyll content, a decrease was observed in the treatments of 5%, 10%, and 20% of CaCO3 (Table 2), while, significantly, the highest value was recorded in the control (p < 0.05).

3.3. Root Growth and Physiology

In terms of root parameters, higher concentrations (10% and 20%) significantly slowed down root length and root weight, whereas control and 2.5% concentration increased them (p < 0.05). In other words, by increasing the level of CaCO3 to 10% or higher, a gradual decline was observed in both root length and root weight (Table 3). Root activity was significantly lowered when the soil was amended with 10% and 20% of CaCO3 (p < 0.01). The results of root ethylene production and the root respiration rate were almost similar when the plants were exposed to various levels of CaCO3 (Table 3). As the levels of soil CaCO3 were gradually increased, a simultaneous rise was seen in root ethylene production and the root respiration rate. The difference was significant at higher concentrations (10% and 20%) (p < 0.01).

3.4. Number of Flowers and Fruits per Plant−1, Yield, and Its Components

The plants exposed to 10% and 20% concentrations of CaCO3, produced significantly fewer flowers per plant than control (Table 4). The difference was significant at a p < 0.01 level. As the concentration of CaCO3 was raised to 5% or more, the number of fruits per plant significantly dropped (Table 4). There was a statistically significant difference between the treatments (p < 0.01). The fruit weight was found to be significantly lower than the control at concentration of 20% (Table 4), as well as fruit with the significantly smallest diameter was produced at 20% concentration of CaCO3 (p < 0.05). In the case of yield per plant−1, the results showed that higher concentrations (10% and 20%) significantly reduced the yield (p < 0.05).

3.5. Fruit Quality Characteristics

Regarding fruit firmness, it was significantly raised at 20% concentration (Table 5). The difference was significant at a p < 0.05 level. In respect to total soluble solids, the results showed that the application of 20% CaCO3 significantly increased the accumulation of TSS in the fruit (Table 5). However, accumulation of TSS in fruit was significantly lowered in control and 2.5% (p < 0.05). In the case of total sugar content, there was no statistically significant difference among the treatments.
Ascorbic acid content (vitamin C) increased at concentrations of 5%, 10%, and 20% (Table 5). The difference was statistically significant at a p < 0.01 level. Fruit citric acid content gradually increased as the concentration of CaCO3 was elevated (Table 5). There was a statistically significant difference among the treatments at a p < 0.05 level. In the same way, the application of 10% and 20% concentrations of CaCO3 significantly enhanced accumulation of malic acid, as compared with control (at a p < 0.05 level).

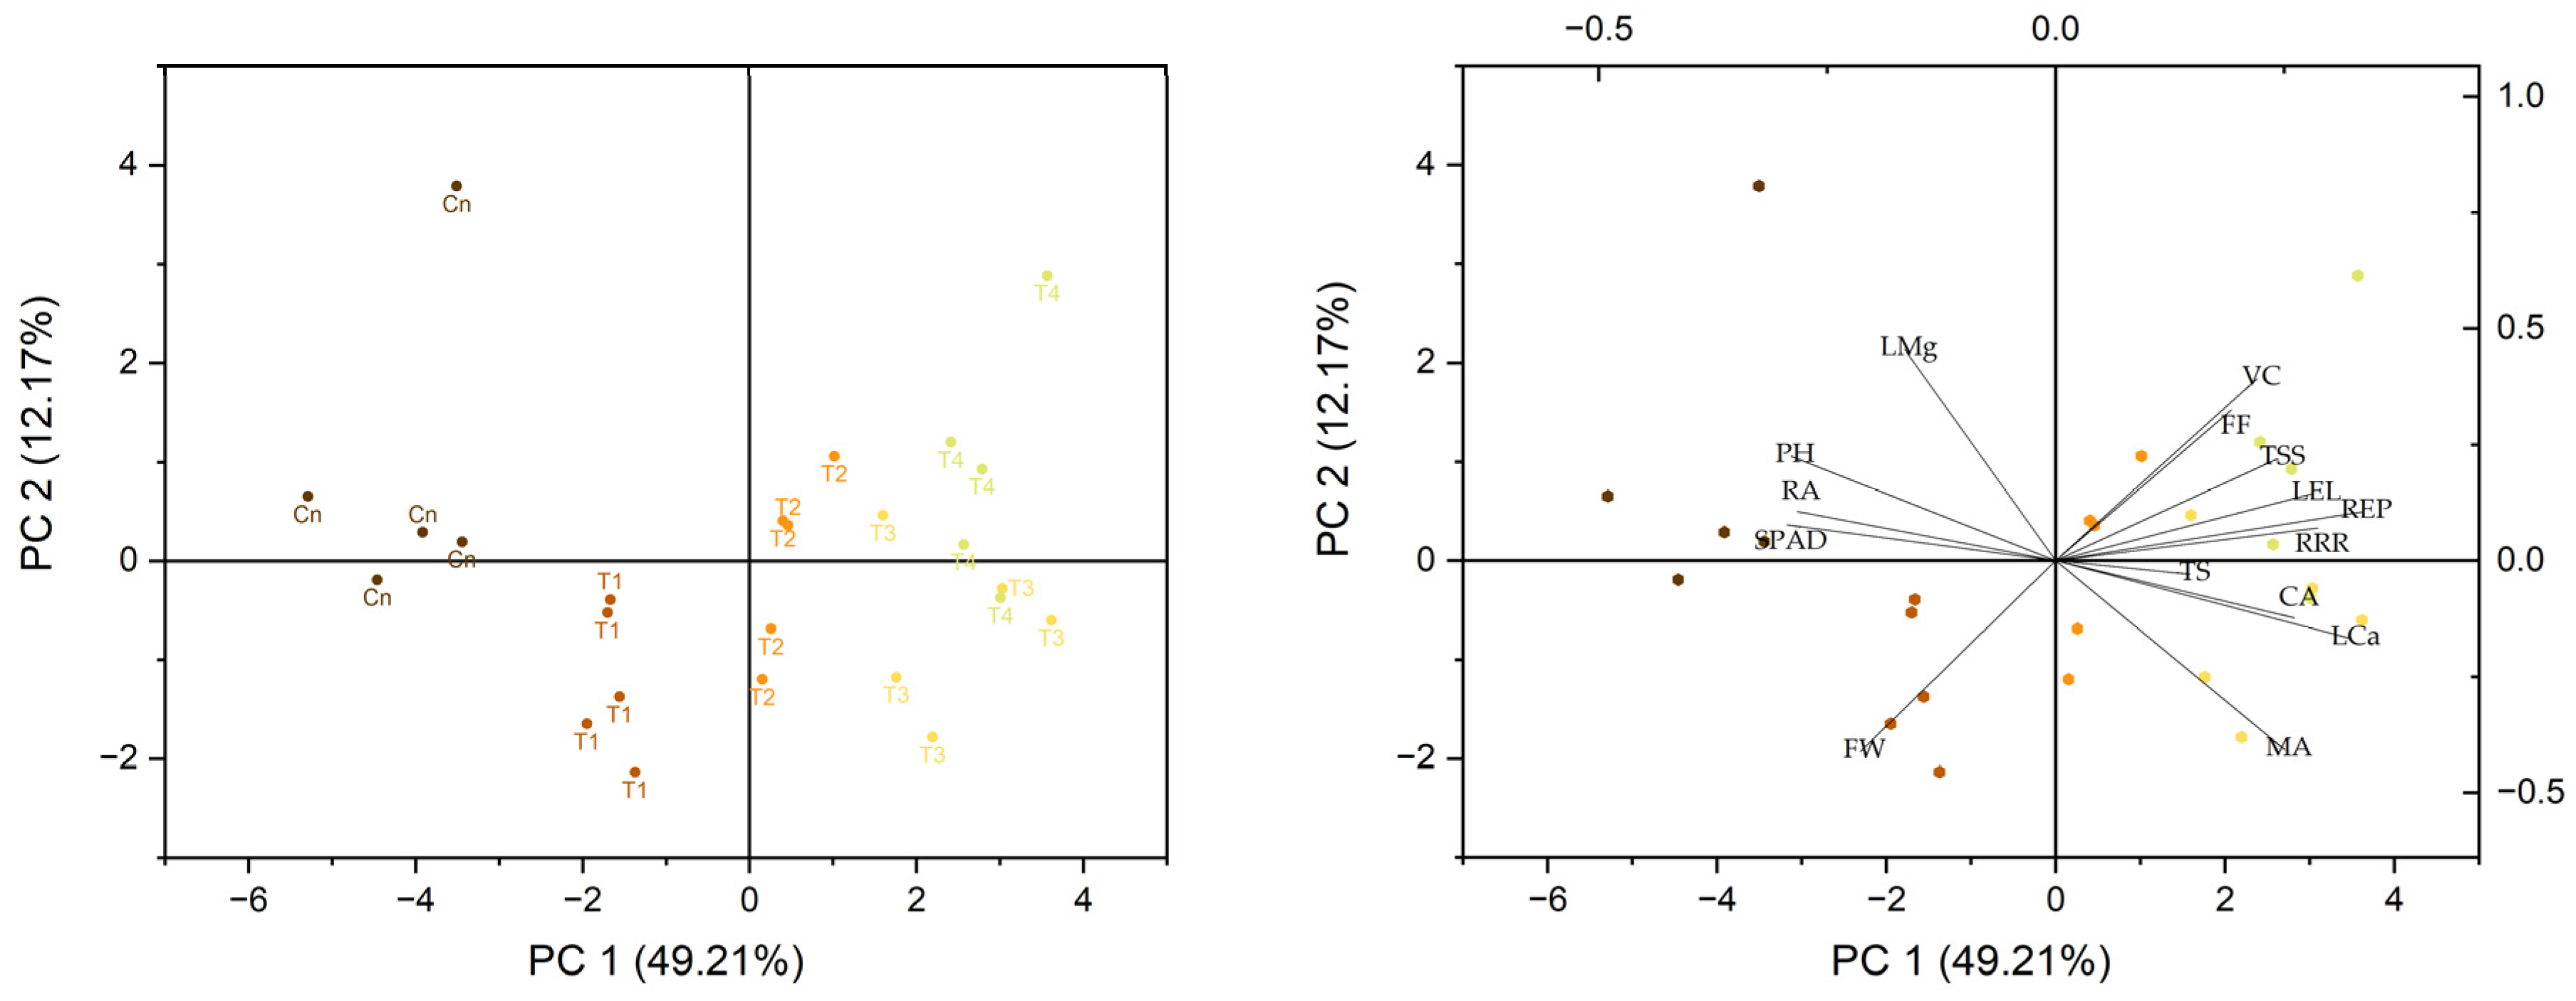
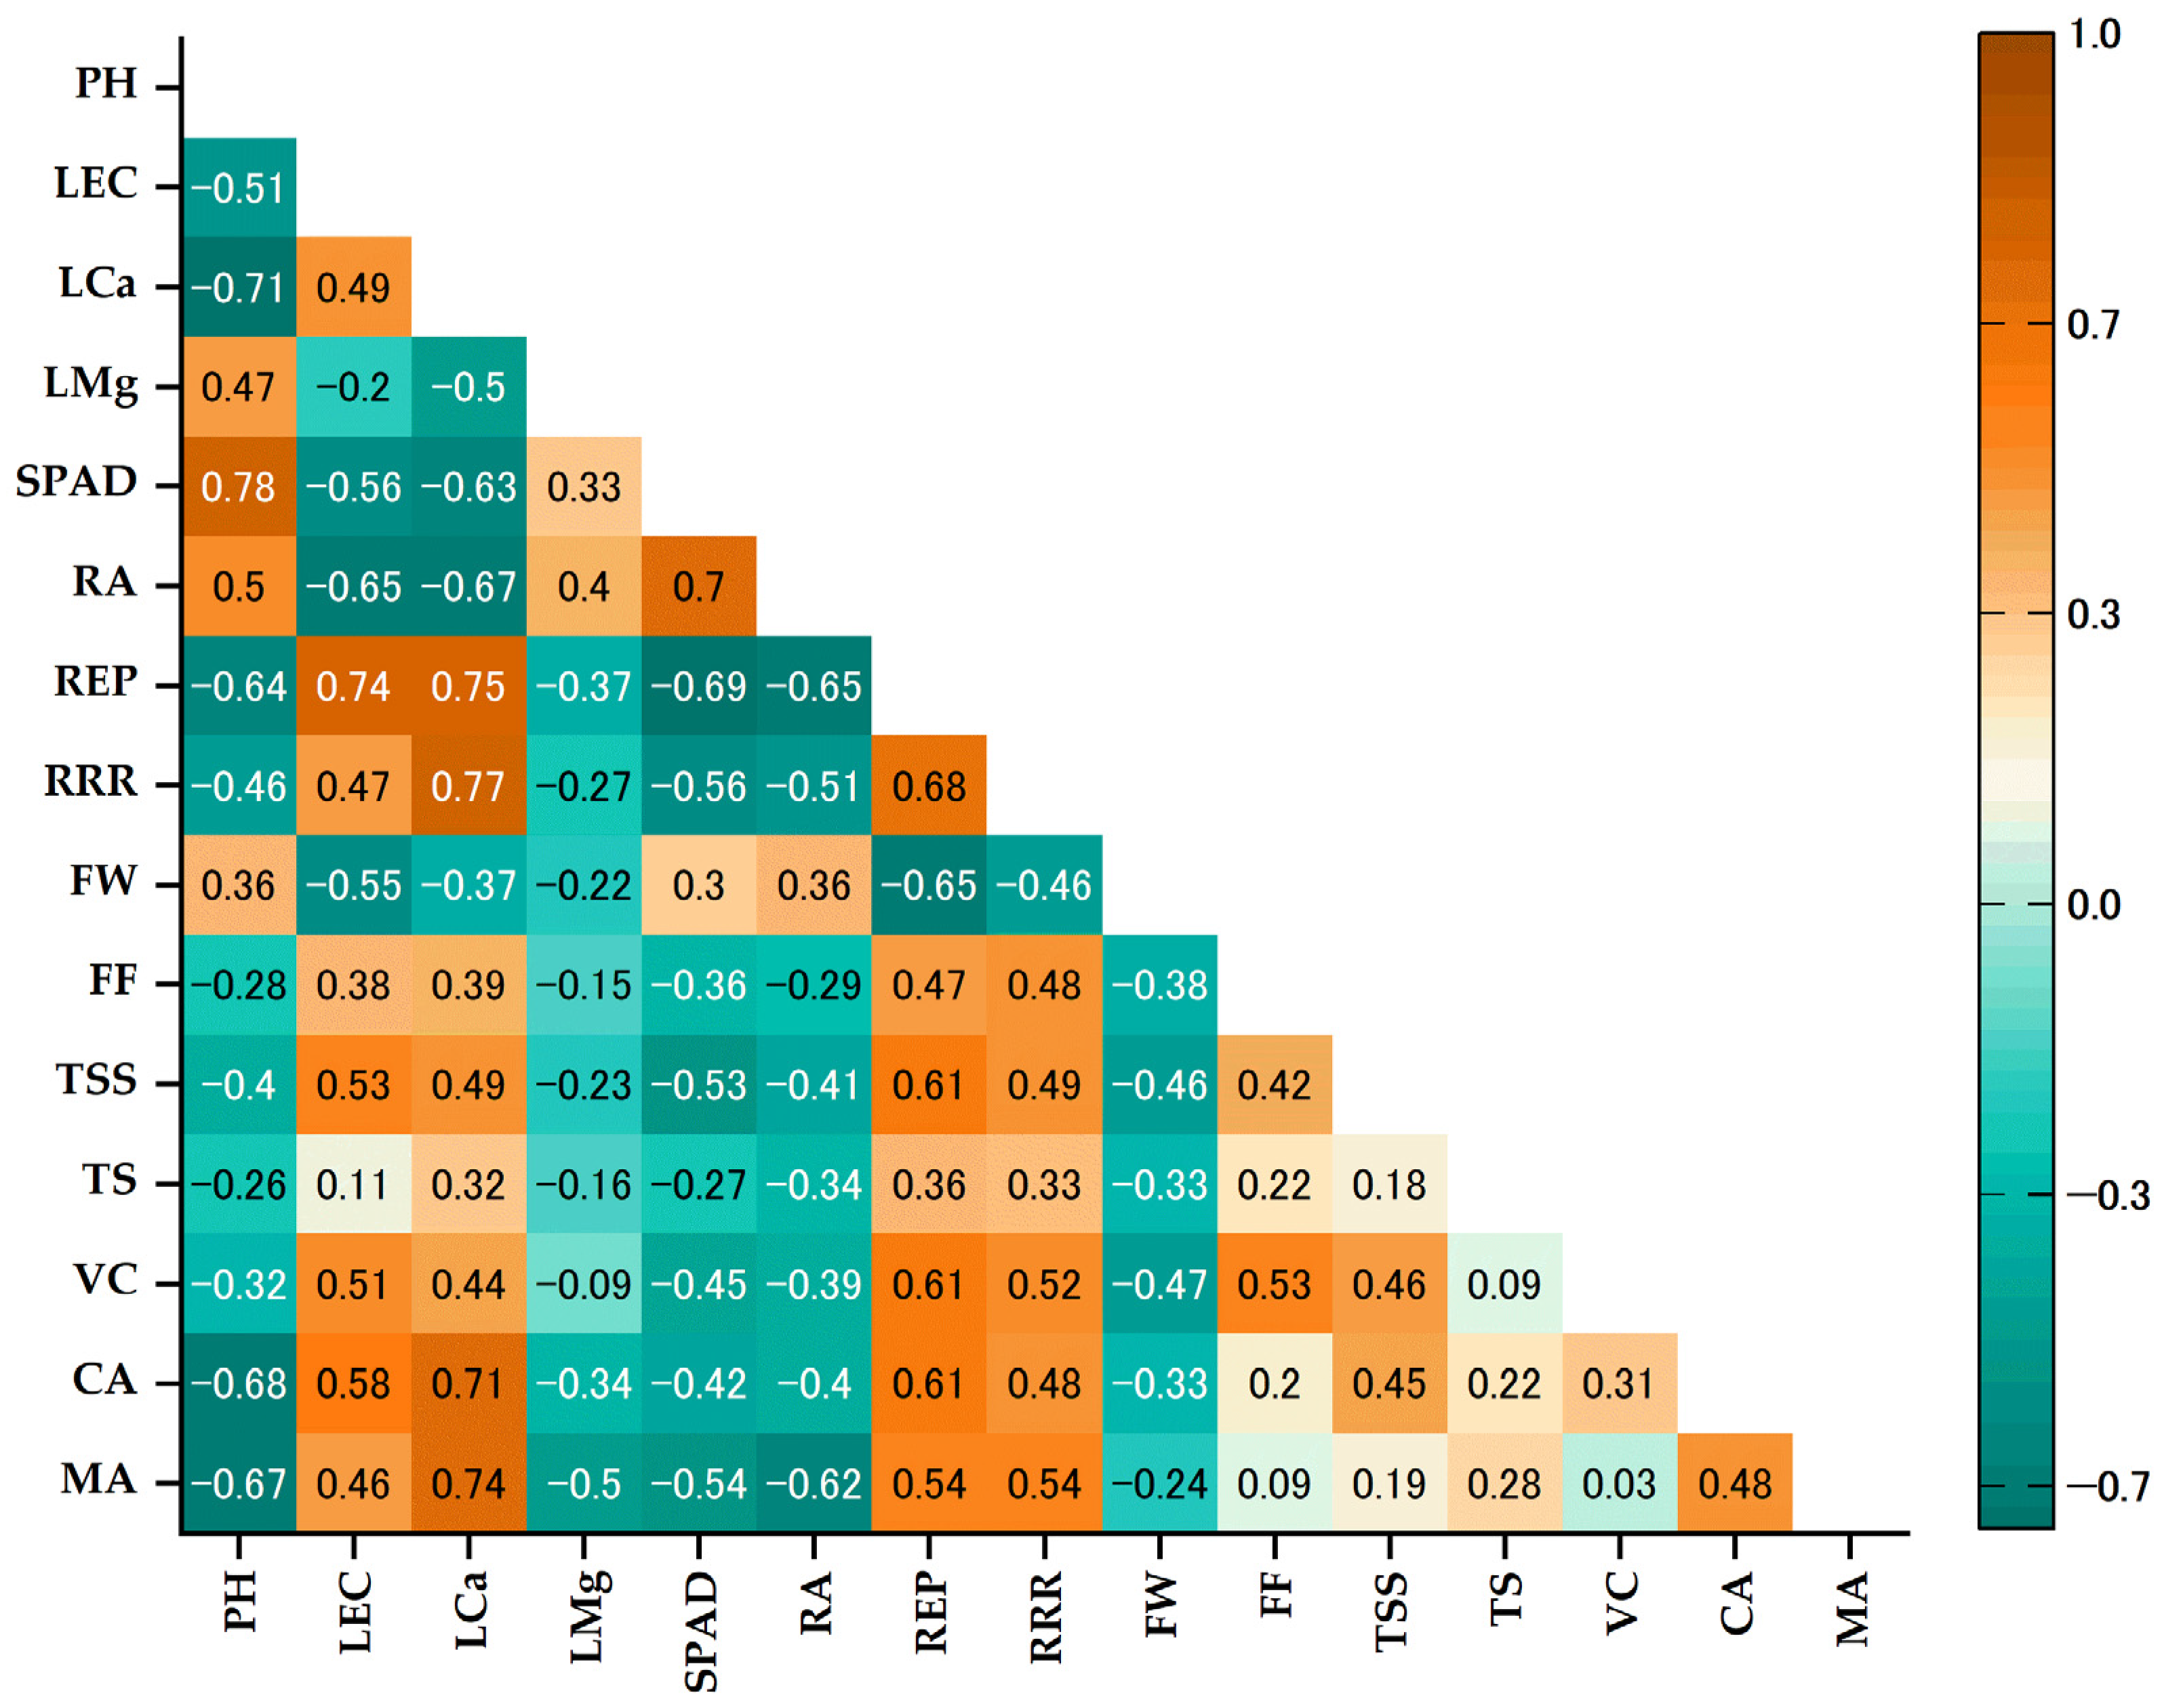
3.6. Prinicipal Component Analysis and Correlation Coeficient (Matrix)

In PCA analysis, the first two components contributed 61.38% of the variance (Figure 5), while the third component accounted for 7.7%. PC1 was closely associated with aspects such as leaf EL, leaf Ca content, root ethylene production, root respiration rate, fruit weight, total soluble solids, total sugars, citric acid, and malic acid. Conversely, PC2 was more closely related to measures such as plant height, leaf Mg content, leaf SPAD value, root activity, fruit firmness, and vitamin C. The PCA findings illustrated that plant height, leaf SPAD value, and root activity were more associated with the control, fruit weight with the 2.5% concentration, total sugars with the 5% concentration, and leaf Ca content and fruit citric acid content with the 10% concentration, while leaf EL, root ethylene production, root respiration rate, and total soluble solids were more linked to the 20% concentration. Furthermore, there was a negative correlation between plant height and leaf Ca content and root ethylene production (Figure 6). A negative correlation was found between leaf electrolyte leakage and leaf SPAD value, root activity, and fruit weight. Conversely, a positive correlation was identified between leaf electrolyte leakage and root ethylene production. This suggests that under calcareous conditions, the increment of soil pH and excess Ca triggered root ethylene production, affecting root activity and, subsequently, leaf electrolyte leakage. Ultimately, this might have resulted in the reduction in the leaf SPAD value and fruit weight. There was a highly positive correlation between leaf SPAD value and root activity, but a negative correlation existed between leaf SPAD value and both root ethylene production and root respiration rate (Figure 6). This means that healthy plants with vigorous root systems tended to exhibit higher chlorophyll content in their leaves. In contrast, the plants that suffered suboptimal root conditions, characterized by an increased root ethylene production and respiration rate, displayed poor chlorophyl content. Root activity had a negative correlation with the root respiration rate and root ethylene production (Figure 6). The plants with active roots were generally associated with lower amounts of ethylene and CO2 production than the CaCO3 treatments. Good root activity insured a lower production of ethylene and CO2 in roots. Root ethylene production had a strong correlation with root respiration rate but had a negative correlation with fruit weight. This meant that with increasing ethylene production in the roots, the rate of root respiration also increased. This association may lead to a reduction in fruit weight.

4. Discussion

The results of this research revealed that the presence of CaCO3 at higher concentrations altered soil electrical conductivity and pH, resulting in their significant increase. Supanjani and colleagues [25] observed an increase in both soil pH and EC after the application of 5 tons per hectare of CaCO3. However, Lee and Kim [26] found that adding CaCO3 did not strongly affect pH and EC in the hydroponic system. Our study showed that even with excessive CaCO3, there was no significant difference in pH. The rise in soil pH and EC caused by CaCO3 may induce stress, and this might be responsible for the differences in growth and physiochemical attributes of the tomato plants, as well as the alteration of nutrient availability [36] and absorption due to raised osmotic pressure in the root zone [37]. We observed that higher concentrations (10% and 20%) had significant effects on most of the growth parameters, compared with the control. The exposure of the plants to the higher concentrations significantly decreased plant height. The fluctuations and declines in plant height, especially evident under 5%, 10%, and 20% concentrations during incubation, may be attributed to fluctuations in soil pH and EC, impacting nutrient availability. Supanjani et al. [25], Szczepaniak et al. [38], Henschke et al. [39], and Jessop et al. [40] all agreed that higher concentrations of CaCO3 significantly decreased plant height. Stunted growth is one of the primary symptoms in plants suffering from inadequate nutrition in calcareous soils [3]. In the case of leaf length, the highest concentration (20%) significantly reduced leaf length, followed by the 10% concentration. Mumivand et al. [41] mentioned that leaf area is reduced at a higher CaCO3 concentration. Likewise, Obreza [28] found that grapefruit trees showed weaker roots when they were grown in areas where CaCO₃ was present and the soil pH exceeded 7.0; these trees had also less-dense canopies and smaller leaves. Our findings revealed that number of leaves per plant was significantly decreased by the higher concentrations (10% and 20%). Szczepaniak et al. [38] and Henschke et al. [39] exposed Helleborus lividus Aiton and Helleborus orientalis Lam plants to higher concentrations of CaCO3 and found a reduction in number of leaves per plant, although they did not find statistical differences between the treatments. Our results also showed that CaCO3 had a positive effect on leaf Ca concentration. However, it did not have any significant effect on leaf Mg concentration. According to Chao et al. [42], applying 5 mM of CaCO3 to djulis sprouts grown hydroponically, significantly boosted Ca content in both aboveground and underground parts. Dzida and Jarosz [12] suggested that CaCO3 at higher concentrations increased Mg and Ca contents in plants. Higher levels of CaCO3, as it regulates pH and nutritional balance, directly or indirectly affects Mg and other nutrient availability [3]. Additionally, precipitation of phosphorus, sulfur, and zinc was reported to be caused by a higher quantity of CaCO3 in soil, which may diminish growth [27].
Electrolyte leakage is a characteristic used to estimate the cell membrane integrity of plants in response to environmental stresses and senescence. In senescence or stressful conditions, the degradation and oxidation of proteins and lipids in these membranes can result in structural alterations, leading to the loss of integrity and gain for membrane permeability [43]. Our findings indicate that the addition of 10% and 20% of CaCO3 to soil increased EL, which might damage cell membrane integrity and induce stress in tomato plants. Lee and Kim [26] and Bessrour et al. [29] showed that the application of CaCO3 to soil resulted in a slight reduction in leaf SPAD value, but it had no major impact on leaf chlorophyll content. However, we found that the exposure of tomato plants to 5% and higher concentrations caused a significant decrease in leaf SPAD value. This reduction might be associated with a higher Ca concentration and lower Mg concentration in the leaf, suggesting that nutritional imbalances could contribute to the reduction in the leaf SPAD value.
In the case of root growth and physiology, higher concentrations (10% and 20%) significantly reduced root weight and length. This notable reduction in root and shoot measurements is considered as a distinctive plant response to stressful conditions [44]. Wahba et al. [3] noted that in calcareous soils, a hardened status of subsoil can severely restrict root expansion and hinder water flow. It was also found that root activity was inhibited by the application of higher levels of CaCO3. According to Ota [45], the reduction in root activity results from the quick senesce of older roots under unfavorable soil conditions. The plants exposed to the higher concentrations of CaCO3 (10% and 20%) produced noticeably more ethylene and CO2 in their roots in contrast to the control. The subsequent escalation of these gases, attributed to initiation of alkaline conditions, may be associated with root length and root weight reduction. Ethylene is closely connected with stress reactions, hindering expansion of the main roots by surpassing cell elongation rather than affecting cell division [46,47]. Root respiration is determinable, as it affects the use of photosynthates required for plant growth and productivity [48].
Plants exposed to higher levels of CaCO3 produced a lower number of flowers than the control. Nonetheless, Szczepaniak et al. [38] and Henschke et al. [39] findings suggested that CaCO3 had little impact on flowering. We found that application of CaCO3 resulted in fewer fruits per plant, along with a decrease in fruit weight and size, which is similar to the results presented by Lee and Kim [26]. Under the higher concentrations of 10% and 20%, our experiment resulted in a significant reduction in yield production. We expected that excessive CaCO3 would hinder root growth and activity, causing poor root development. This condition would impair the plant’s ability to absorb water and essential nutrients, consequently leading to diminished flower and fruit formation, as well as a reduction in fruit weight and size. Such conditions could be the primary factors causing reduced yield at higher concentrations.
While assessing the fruit quality, it was observed that an increase in CaCO3 brought an increase in fruit firmness. Lee and Kim [26] found a positive correlation between the introduction of Ca sources like CaCO3 in substrate and fruit firmness. This reaffirms the well-established role of Ca in enhancing this quality measure. Under the highest concentration of CaCO3 (20%), the tomato plant exhibited a significantly higher accumulation of TSS. As for total sugars, treatments involving 5%, 10%, and 20% concentrations exhibited an increased accumulation of total sugars in fruit, though no significant difference was observed between the treatments. This increase could be caused due to reduction in fruit size, a lower number of fruit production, or an increased source/sink ratio. A study conducted by Zaman et al. [49] showed that a foliar application of 3% CaCO3 resulted in an increase in TSS in Kinnow mandarin fruit. Zaman et al. [49] also reported an increase in concentration of ascorbic acid in Kinnow mandarin fruit due to the foliar application of CaCO3. Similarly, our findings also showed that ascorbic acid content in fruit had an increase in response to the addition of elevated concentrations of CaCO3 in the soil. In terms of organic acids, citric acid content, which is regarded as a predominant acid and primary contributor of titratable acidity in tomato fruit [50], was gradually increased by the CaCO3 concentrations. An increase in citric acid and malic acid is supposed to be associated with excessive absorption of Ca. This condition may disrupt ionic balance, alter cytosol pH, and reduce the solubility of certain nutrients, thus leading to the induction of stress in plants [44]. The resulting stress in our experiment might have affected the plant’s health and changed different metabolic pathways that influenced the synthesis of organic acids.

5. Conclusions

Elevated levels of CaCO3 in soil is considered to be problematic for production of horticultural crops, including tomatoes, because it affects soil pH and EC, disrupting efficient nutrient uptake from soil. Through this research, it was found that tomato plants exhibited poor growth and physiological performances when treated with higher concentrations of CaCO3. Higher CaCO3 concentrations raised both soil pH and EC, and consequently disrupted plant growth and physiological functions. The results showed that higher concentrations suppressed plant shoot and root growth, as it reduced plant height, number of leaves per plant, leaf length, SPAD value, and leaf Mg content, as well as root weight, length, and activity. On the other hand, it increased leaf EC, leaf Ca content, root ethylene production, and respiration rate. This unfavorable condition ultimately resulted in a lower number of flowers and fruit formation with reduced fruit weight and size, and also a decreasing yield. However, the higher CaCO3 content had a positive effect on firmness, TSS, ascorbic acid, and organic acid accumulation in the fruit.
The limitations of the current study include the use of a model tomato plant; thus, research should also be carried out using commercial varieties based on consumer preference. Other nutrients such as P, Fe, Zn, B, and Mn have to be considered for further studies to better understand their effects on plant nutrition. It is also recommended to conduct more research about physiological issues related to root activity and nutrient absorption. In addition, the exploration of seed priming methods as tools to enhance seedling development should be carried out to reduce the impact of CaCO3 in early stage of plant growth. Nevertheless, these findings provide valuable insights for farmers, suggesting potential strategies such as avoiding cultivation in soils with high CaCO3 content by utilizing alternative methods like soilless culture (e.g., hydroponics), using resistant varieties, or employing organic or non-organic compounds that may help mitigate the hazards associated with high soil pH and excess Ca in calcareous soils. Finally, we recommend finding low-cost measures to enhance shoot and root growth under calcareous soil conditions, aiming to help farmers overcome this soil abiotic stress and promote sustainable and productive farming in Afghanistan.

Author Contributions

Conceptualization, N.S., A.S. and K.K.; methodology, M.W.A., N.T., A.S., G.G., N.D., D.S.P. and N.S.; software, N.S., D.S.P., M.W.A. and G.G.; validation, N.T., A.S. and A.K.; formal analysis, K.K.; investigation, N.S., N.D., M.W.A. and D.S.P.; resources, N.T., A.K., A.S. and K.K.; data curation, G.G., N.D., N.S., A.S. and A.K.; writing—original draft preparation, N.S., M.W.A., G.G. and N.D.; writing—review and editing, K.K., A.S. and N.T.; visualization, D.S.P., N.D., M.W.A. and N.S.; supervision, K.K. and A.S.; funding acquisition, A.S. and A.K. All authors have read and agreed to the published version of the manuscript.

Funding

This research was funded by Japan International Corporation Agency (JICA) through their PEACE (Project for the Promotion and Enhancement of the Afghan Capacity for Effective Development) project.

Data Availability Statement

Data is contained within the article.

Acknowledgments

The authors extend their sincere gratitude to JICA organization and Tokyo University of Agriculture who supported this research. We also extend our deepest appreciation to PhD student William Viera for his valuable guidance and assistance in manuscript preparation.

Conflicts of Interest

The authors declare no conflicts of interest.

References

  1. Delgado, A.; Gómez, J.A. The soil. Physical, chemical and biological properties. In Principles of Agronomy for Sustainable Agriculture; Villalobos, F., Fereres, E., Eds.; Springer: Cham, Switzerland, 2016; pp. 15–26. [Google Scholar] [CrossRef]
  2. Kowalska, J.B.; Zaleski, T.; Józefowska, A.; Mazurek, R. Soil formation on calcium carbonate-rich parent material in the outer Carpathian Mountains–A case study. Catena 2019, 174, 436–451. [Google Scholar] [CrossRef]
  3. Wahba, M.M.; Labib, F.; Zaghloul, A. Management of calcareous soils in arid region. Int. J. Environ. Pollut. Environ. Model 2019, 2, 248–258. [Google Scholar]
  4. Chesworth, W. Calcareous soils. In Encyclopedia of Soil Science; Chesworth, W., Ed.; Springer: Dordrecht, The Netherlands, 2008; pp. 76–79. [Google Scholar]
  5. Elhusieny, A.H.; Nada, W.; Elgezery, M. Influence of sulphur compost application on some chemical properties of calcareous soil and consequent responses of Hordeum Vulgare L. plants. Egypt. J. Soil. Sci. 2020, 60, 67–82. [Google Scholar]
  6. Taalab, A.S.; Ageeb, G.W.; Siam, H.S.; Mahmoud, S.A. Some characteristics of calcareous soils. A review AS Taalab1, GW Ageeb2, Hanan S. Siam1 and Safaa A. Middle East J. 2019, 8, 96–105. [Google Scholar]
  7. Management of calcareous soils. FAO Soils Portal. 2023. Available online: https://www.fao.org/soils-portal/soil-management/management-of-some-problem-soils/calcareous-soils/en/ (accessed on 19 September 2023).
  8. Pal, D.K.; Dasog, G.S.; Vadivelu, S.; Ahuja, R.L.; Bhattacharyya, T. Secondary calcium carbonate in soils of arid and semi-arid regions of India. Glob. Clim. Chang. Pedog. Carbonates 2000, 149–185. [Google Scholar]
  9. Lehto, T. Effects of soil pH and calcium on mycorrhizas of Picea abies. Plant Soil. 1994, 163, 69–75. [Google Scholar] [CrossRef]
  10. Marschner, H. Marschner’s Mineral Nutrition of Higher Plants, 3rd ed.; Academic Press: San Diego, CA, USA, 2011; pp. 444–455. [Google Scholar]
  11. Shaaban, M.M.; El-Fouly, M.M.; Abdel-Maguid, A.A. Zinc-Boron Relationship in wheat plants grown under low or high levels of calcium carbonate in the Soil. Pak. J. Biol. Sci. 2004, 7, 633–639. [Google Scholar]
  12. Dzida, K.; Jarosz, Z. Effect of calcium carbonate and differentiated nitrogen fertilization upon the yield and chemical composition of spinach beet. Acta Scientiarum. Polonorum. Hortorum. Cultus 2010, 9, 201–210. [Google Scholar]
  13. Saidajan, A. Effects of war on biodiversity and sustainable agricultural development in Afghanistan. J. Dev. Sustain. Agric. 2012, 7, 9–13. [Google Scholar]
  14. Average Precipitation in Depth (mm per Year)–Afghanistan. World Bank. 2023. Available online: https://data.worldbank.org/indicator/AG.LND.PRCP.MM?locations=AF (accessed on 19 September 2023).
  15. Ahmadi, J. Afghanistan geography: Mountain regions and region-specific soil type. Int. J. Multidiscipl. Res. Growth Eval. 2021, 2, 326–328. [Google Scholar]
  16. Food and Agriculture Organization of the United Nations/ United Nations Development Program (FAO/UNDP). Country Reports. In Calcareous Soils. Report of the FAO/UNDP Regional Seminar on Reclamation and Management of Calcareous Soils; FAO: Cairo, Egypt, 1973; pp. 140–154. [Google Scholar]
  17. Hashimi, R.; Matsuura, E.; Komatsuzaki, M. Effects of cultivating rice and wheat with and without organic fertilizer application on greenhouse gas emissions and soil quality in Khost, Afghanistan. Sustainability 2012, 12, 6508. [Google Scholar] [CrossRef]
  18. Ayubi, A.G. Principle of Irrigation and Drainage; Aazem Publ.: Kabul, Afghanistan, 2016; Volume 31, p. 174. [Google Scholar]
  19. United Nations Office for the Coordination of Humanitarian Affairs (OCHA). Needs Assessment on Soil and Water in Afghanistan: Future Harvest Consortium to Rebuild Agriculture in Afghanistan. 2023. Available online: https://reliefweb.int/report/afghanistan/needs-assessment-soil-and-water-afghanistan (accessed on 19 September 2023).
  20. Masunaga, T.; Kamidohzono, A.; Nezam, A.W.; Sadat, S.A. Paddy soil properties in Nangarhar Province, East Afghanistan. Jpn. Agric. Res. Q. JARQ 2014, 48, 299–306. [Google Scholar] [CrossRef]
  21. Comprehensive Agricultural and Rural Development Facility (Card-F). Midline 1 Report. Upperquartile and Altai Consulting 2017. pp. 39–40. Available online: https://assets.publishing.service.gov.uk/media/5afad49440f0b622e060e2cf/Comprehensive-Agriculture-Rural-Development.pdf (accessed on 19 September 2023).
  22. Afghanistan National Horticulture Survey 2003. Available online: http://www.fao.org/docrep/007/y5163e/y5163e03.htm#bm03 (accessed on 19 September 2023).
  23. Saito, T.; Ariizumi, T.; Okabe, Y.; Asamizu, E.; Hiwasa-Tanase, K.; Fukuda, N.; Mizoguchi, T.; Yamazaki, Y.; Aoki, K.; Ezura, H. TOMATOMA: A novel tomato mutant database distributing Micro-Tom mutant collections. Plant Cell Physiol. 2011, 52, 283–296. [Google Scholar] [CrossRef] [PubMed]
  24. Marti, E.; Gisbert, C.; Bishop, G.J.; Dixon, M.S.; García-Martínez, J.L. Genetic and physiological characterization of tomato cv. Micro-Tom. J. Exp. Bot. 2006, 57, 2037–2047. [Google Scholar] [CrossRef] [PubMed]
  25. Supanjani, S.; Tawaha, A.R.M.; YangMinSuk, Y.M.; Lee KyungDong, L.K. Role of calcium in yield and medicinal quality of Chrysanthemum coronarium L. J. Agron. 2005, 4, 186–190. [Google Scholar]
  26. Lee, G.J.; Kim, T.J. Effects of the use of additional calcium sources on growth and fruit characteristics in tomato hydroponics. Hort. Environ. Biotechnol. 2010, 51, 360–366. [Google Scholar]
  27. Babalar, M.; Mumivand, H.; Hadian, J.; Tabatabaei, S.M.F. Effects of nitrogen and calcium carbonate on growth, rosmarinic acid content and yield of Satureja hortensis L. J. Agric. Sci. 2010, 2, 92–98. [Google Scholar] [CrossRef]
  28. Obreza, T.A. Soil CaCO3 concentration affects growth of young grapefruit trees on Swingle citrumelo rootstock. In Proceedings of the Florida State Horticultural Society; Florida State Horticultural Society: Gainesville, FL, USA, 1995; Volume 108, pp. 147–150. [Google Scholar]
  29. Bessrour, M.; Chelbi, N.; Moreno, D.A.; Chibani, F.; Abdelly, C.; Carvajal, M. Interaction of salinity and CaCO3 affects the physiology and fatty acid metabolism in Portulaca oleracea. J. Agric. Food Chem. 2018, 66, 6683–6691. [Google Scholar] [CrossRef] [PubMed]
  30. Rayment, G.E.; Lyons, D.J. Soil Chemical Methods: Australasia; CSIRO Publ.: Collingwood, Australia, 2011; Volume 3, pp. 38–39. [Google Scholar]
  31. Wang, Y.S.; Tian, S.P.; Xu, Y. Effects of high oxygen concentration on pro-and anti-oxidant enzymes in peach fruits during postharvest periods. Food Chem. 2005, 91, 99–104. [Google Scholar] [CrossRef]
  32. Soil Plant General Analyzer SFP-3 4i. Available online: https://www.fujihira.co.jp/english/category/soi/pdf/SFP-4i.pdf (accessed on 19 September 2023).
  33. Kusunoki, M. Measurement of activity of roots of browning root rot-infected barley by triphenyl tetrazolium chloride (TTC) method. Proc. Assoc. Plant Protec. Shikoku. 1995, 30, 17–19. [Google Scholar]
  34. Castro-Concha, L.A.; Escobedo, R.M.; Miranda-Ham, M.L. Measurement of cell viability. Plant Cell Cult. Protoc. 2012, 877, 49–56. [Google Scholar] [CrossRef]
  35. Haris, M.M.; Silva, T.M.; Gulub, G.; Terada, N.; Shinohara, T.; Sanada, A.; Gemma, H.; Koshio, K. Growth, quality and capsaicin concentration of hot pepper (Capsicum annuum) under drought conditions. J. Int. Soc. Southeast Asian Agric. Sci. 2020, 26, 100–110. [Google Scholar]
  36. The Effect of Soil pH on Plants. Available online: https://www.southlandorganics.com/blogs/news/the-effect-of-soil-ph-on-plants (accessed on 19 September 2023).
  37. Ding, X.; Jiang, Y.; Zhao, H.; Guo, D.; He, L.; Liu, F.; Zhou, Q.; Nandwani, D.; Hui, D.; Yu, J. Electrical conductivity of nutrient solution influenced photosynthesis, quality, and antioxidant enzyme activity of pakchoi (Brassica campestris L. ssp. Chinensis) in a hydroponic system. PLoS ONE 2018, 13, e0202090. [Google Scholar] [CrossRef]
  38. Szczepaniak, S.; Henschke, M.; Czuchaj, P.; Kozik, E. Growth and flowering of lenten rose (Helleborus orientalis Lam.) depending on the dose of calcium carbonate and top dressing with Peters Professional Special. Acta Scien. Pol. Hort. Cult. 2008, 7, 13–22. [Google Scholar]
  39. Henschke, M.; Szczepaniak, S.; Czuchaj, P.; Kozik, E. The effect of calcium carbonate and top dressing with Peters Professional Special on the growth and flowering of Helleborus lividus Aiton. Folia Horticulturae. 2009, 21, 105–117. [Google Scholar] [CrossRef]
  40. Jessop, R.S.; Roth, G.; Sale, P. Effects of increased levels of soil CaCO3 on lupin (Lupinus angustifolius) growth and nutrition. Soil Res. 1990, 28, 955–962. [Google Scholar] [CrossRef]
  41. Mumivand, H.; Babalar, M.; Hadian, J.; Fakhr-Tabatabaei, M. Plant growth and essential oil content and composition of Satureja hortensis L. cv. Saturn in response to calcium carbonate and nitrogen application rates. J. Med. Plants Res. 2011, 5, 1859–1866. [Google Scholar]
  42. Chao, Y.Y.; Wang, W.J.; Liu, Y.T. Effect of calcium on the growth of djulis (Chenopodium formosanum Koidz.) sprouts. Agronomy 2021, 11, 82. [Google Scholar] [CrossRef]
  43. Rolny, N.; Costa, L.; Carrión, C.; Guiamet, J.J. Is the electrolyte leakage assay an unequivocal test of membrane deterioration during leaf senescence? Plant Physiol. Biochem. 2011, 49, 1220–1227. [Google Scholar] [CrossRef]
  44. Giel, P.; Bojarczuk, K. Effects of high concentrations of calcium salts in the substrate and its pH on the growth of selected rhododendron cultivars. Acta Soc. Bot. Pol. 2011, 80, 2. [Google Scholar] [CrossRef]
  45. Ota, Y. Diagnostic method for measurement of root activity in rice plant. Jpn. Agric. Res. Q. 1970, 5, 1–6. [Google Scholar]
  46. Li, J.; Xu, H.H.; Liu, W.C.; Zhang, X.W.; Lu, Y.T. Ethylene inhibits root elongation during alkaline stress through AUXIN1 and associated changes in auxin accumulation. Plant Physiol. 2015, 168, 1777–1791. [Google Scholar] [CrossRef]
  47. Růžička, K.; Ljung, K.; Vanneste, S.; Podhorská, R.; Beeckman, T.; Friml, J.; Benková, E. Ethylene regulates root growth through effects on auxin biosynthesis and transport-dependent auxin distribution. Plant Cell 2007, 19, 2197–2212. [Google Scholar] [CrossRef]
  48. Kinhal, V. Root Respiration: Importance and Applications. CID Bio-Science. Available online: https://cid-inc.com/blog/2023-guide-to-plant-and-crop-stress/ (accessed on 19 September 2023).
  49. Zaman, L.; Shafqat, W.; Sharief, N.; Raza, K.; ud Din, S.; Qureshi, M.A.; Ahmad, S.; Jiskani, M.J. Effect of foliar spray of calcium carbonate and zinc sulphate on fruit quality of kinnow mandarin. J. Global Innov. Agric. Soc. Sci. 2020, 8, 5–9. [Google Scholar] [CrossRef]
  50. Anthon, G.E.; LeStrange, M.; Barrett, D.M. Changes in pH, acids, sugars and other quality parameters during extended vine holding of ripe processing tomatoes. J. Sci. Food Agric. 2011, 91, 1175–1181. [Google Scholar] [CrossRef]
Figure 1. Effect of different concentrations of CaCO3 on plant height. Values are represented as mean ± SE, and different letters on the bars indicate statistically significant differences among the treatments according to Tukey’s Test.
Horticulturae 10 00573 g001
Figure 2. Effect of different concentrations of CaCO3 on overall growth of tomato plants.
Horticulturae 10 00573 g002
Figure 3. Effect of different concentrations of CaCO3 on leaf length of tomato plants. Values are represented as mean ± SE, and different letters on the bars indicate statistically significant differences among the treatments according to Tukey’s Test.
Horticulturae 10 00573 g003
Figure 4. Effect of different concentrations of CaCO3 on tomato leaf length.
Horticulturae 10 00573 g004
Figure 5. Principal component analysis for growth, physiology, and biochemical attributes of tomato plants. PH = plant height, LEL = leaf electrolyte leakage, LCa = leaf calcium content, LMg = leaf magnesium content, SPAD = leaf SPAD value, RA = root activity, REP = root ethylene production, RRR = root respiration rate, FW = fruit weight, FF = fruit firmness, TSS = total soluble solids, TS = total sugars, VC = vitamin C (ascorbic acid), CA = citric acid, and MA = malic acid. Here, ‘Cn’ denotes control, ‘T1’ denotes 2.5%, ‘T2’ denotes 5%, ‘T3’ denotes 10%, and ‘T4’ denotes 20% CaCO3 concentrations. Dots with the same color represent replicates.
Horticulturae 10 00573 g005
Figure 6. Matrix of correlation coefficient depicting relationship among growth, physiology, and biochemical attributes of tomato. PH = plant height, LEL = leaf electrolyte leakage, LCa = leaf calcium content, LMg = leaf magnesium content, SPAD = leaf SPAD value, RA = root activity, REP = root ethylene production, RRR = root respiration rate, FW = fruit weight, FF = fruit firmness, TSS = total soluble solids, TS = total sugars, VC = vitamin C (ascorbic acid), CA = citric acid, and MA = malic acid.
Horticulturae 10 00573 g006
Table 1. Effect of different concentrations of CaCO3 on soil pH and soil EC.
ParametersTreatment
Control2.5%5%10%20%
Soil pH6.74 ± 0.13 b7.69 ± 0.06 a7.8 ± 0.04 a7.72 ± 0.02 a7.6 ± 0.12 a
Soil EC1.05 ± 0.01 b0.94 ± 0.06 b1.0 ± 0.12 b1.43 ± 0.11 a1.55 ± 0.04 a
Values are represented as mean ± standard deviation (SD), and different letters within rows show significant differences by Tukey’s Test.
Table 2. Effect of different concentrations of CaCO3 on leaf growth and physiology.
ParameterTreatment
Control2.5%5%10%20%
No. leaves per plant172.25 ± 23.92 a156.75 ± 34.08 ab146.25 ± 9.6 abc115.25 ± 16.46 bc105.0 ± 4.76 c
Leaf Ca content (%)2.24 ± 0.12 c2.91 ± 0.06 b2.84 ± 0.15 b3.59 ± 0.24 a3.44 ± 0.14 a
Leaf Mg content (%)0.83 ± 0.09 a0.66 ± 0.06 a0.65 ± 0.03 a0.66 ± 0.02 a0.72 ± 0.04 a
Leaf EC (%)15.11 ± 4.05 b15.87 ± 1.91 b29.26 ± 8.56 ab33.27 ± 11.68 a37.9 ± 12.64 a
Leaf chlorophyll content
(SPAD value)
46.2 ± 3.95 a43.68 ± 2.06 ab42.14 ± 0.58 b41.06 ± 0.32 b41.1 ± 1.52 b
Values are represented as mean ± SD, and different letters within rows show significant difference among the treatments according to Tukey’s Test.
Table 3. Effect of different concentrations of CaCO3 on tomato root growth and physiology.
ParameterTreatment
Control2.5%5%10%20%
Root length (cm)29.94 ± 4.9 a29.96 ± 2.43 a25.7 ± 4.89 ab23.69 ± 2.75 b21.1 ± 3.85 b
Root weight (g)5.23 ± 1.12 a4.55 ± 1.28 ab4.0 ± 1.21 ab3.13 ± 0.25 b3.1 ± 0.18 b
Root activity (mg FW g−1 h−1)0.3 ± 0.05 a0.28 ± 0.12 ab0.16 ± 0.02 abc0.06 ± 0.04 c0.13 ± 0.07 c
Root ethylene production (nL g−1 h−1)2.7 ± 0.4 c3.37 ± 0.22 bc3.89 ± 0.51 abc4.29 ± 0.5 ab5.01 ± 0.52 a
Root respiration rate [CO2 emission (µL g−1 h−1)]108.32 ± 24.84 b134.76 ± 5.73 ab151.6 ± 19.3 ab161.95 ± 35.32 a167.41 ± 15.95 a
Values are represented as mean ± SD, and different letters within rows show significant differences by Tukey’s Test.
Table 4. Effect of different concentrations of CaCO3 on number of flowers and fruits per plant, yield, and its components.
ParameterTreatment
Control2.5%5%10%20%
No. flower per plant86.25 ± 5.27 a59.0 ± 3.2 ab40.25 ± 3.0 bc34.75 ± 2.6 c35.5 ± 3.4 c
No. fruits per plant36.25 ± 6.18 a31.0 ± 2.94 ab20.25 ± 5.5 b21.25 ± 6.6 b20.0 ± 1.83 b
Fruit weight (g)2.22 ± 0.4 a2.85 ± 0.58 a2.1 ± 0.27 a2.05 ± 0.31 ab1.1 ± 0.53 b
Fruit diameter (mm)1.39 ± 0.15 ab1.47 ± 0.2 a1.49 ± 0.22 a1.43 ± 0.07 ab1.14 ± 0.14 b
Yield per plant (g)43.5 ± 1.25 a39.62 ± 12.22 ab38.68 ± 8.97 ab27.43 ± 4.15 bc24.37 ± 5.8 c
Values are represented as mean ± SD, and different letters within rows show significant differences by Tukey’s Test.
Table 5. Effect of different concentrations of CaCO3 on quality attributes of tomato.
ParameterTreatment
Control2.5%5%10%20%
Fruit firmness (N)1.63 ± 0.63 c2.17 ± 0.39 bc2.42 ± 0.8 ab2.71 ± 0.51 ab2.9 ± 0.79 a
Total soluble solids (%)6.3 ± 0.07 b6.28 ± 0.54 b7.02 ± 0.08 ab6.98 ± 0.04 ab7.2 ± 0.69 a
Total sugars (mg g−1 FW)17.83 ± 1.93 a18.5 ± 2.01 a19.22 ± 1.08 a19.66 ± 2.49 a19.65 ± 1.81 a
Ascorbic acid (mg 100 g−1 FW) 20.22 ± 2.44 b22.2 ± 2.07 ab28.81 ± 2.26 a28.44 ± 4.69 a29.9 ± 1.96 a
Citric acid content (mg g−1 FW)11.35 ± 0.69 b11.96 ± 0.5 ab11.99 ± 0.68 ab13.23 ± 1.48 a13.41 ± 0.28 a
Malic acid content (mg g−1 FW)0.76 ± 0.06 b0.89 ± 0.06 ab0.91 ± 0.09 ab0.99 ± 0.02 a0.93 ± 0.09 a
Values are represented as mean ± SD, and different letters within rows show significant differences by Tukey’s Test.
Disclaimer/Publisher’s Note: The statements, opinions and data contained in all publications are solely those of the individual author(s) and contributor(s) and not of MDPI and/or the editor(s). MDPI and/or the editor(s) disclaim responsibility for any injury to people or property resulting from any ideas, methods, instructions or products referred to in the content.

