Article

Investigating the Effect of Hydrafiber and Biochar as a Substitute for Peat-Based Substrate for Zinnia (Zinnia elegans) and Snapdragon (Antirrhinum majus) Production

1
Department of Horticulture, University of Georgia, Griffin, GA 30223, USA
2
Environmental Horticulture Department, University of Florida, Gainesville, FL 32607, USA
*
Author to whom correspondence should be addressed.
Horticulturae 2024, 10(6), 589; https://doi.org/10.3390/horticulturae10060589
Submission received: 6 May 2024 / Revised: 29 May 2024 / Accepted: 31 May 2024 / Published: 4 June 2024

Abstract

:
Increasing environmental and economic concerns necessitate the research for peat moss alternatives, aiming to balance ecological sustainability with cost-effectiveness. This study assessed whether biochar (BC) and hydrafiber (HF) could be a partial replacement for peat moss as substrate components. Twelve substrates were formulated by either mixing BC (20%, 40%, and 60%, by vol.) with HF (20%, 40%, and 60%, by vol.), with the remaining being peat moss or mixing BC (0%, 20%, 40%, and 60%, by vol.) with the commercial substrates (CS) to grow zinnia (Zinnia elegans) and snapdragon (Antirrhinum majus) plants in containers. The physical properties of the substrates, including container capacity, total porosity, air space, bulk density, and chemical properties including leachate pH and electrical conductivity (EC) were measured. Plant growth parameters including growth index (GI) and leaf greenness (indicated with SPAD), biomass, and number of flowers were measured biweekly. The results showed all the substrate mixes had similar air space, bulk density, and SPAD. Treatment with 20% BC and 80% CS yielded the highest GI, biomass, and numbers of flowers in both zinnia and snapdragon. In conclusion, BC could be used to partially (20%) replace commercial substrate mix for container-grown zinnia and snapdragon.

1. Introduction

The escalating environmental and economic concerns about peat moss have underscored the urgency of identifying viable alternatives for container substrate. The global production of peat moss reached a total of 2.89 million tons in 2020 [1]. In the United States, peat moss accounts for more than 80% usage of growing media in horticulture [1]. Peat moss has excellent chemical and physical properties for plant growth and development, such as high water-holding capacity, high cation exchange capacity, high air space, and light weight [2,3,4]. However, while having beneficial properties, peat moss faces issues with rewetting and nutrient leaching due to its hydrophobicity [5]. In addition, the extensive exploitation of peatlands for farming and agricultural purposes has raised significant environmental concerns [3,4]. Peatlands are crucial reservoirs of terrestrial carbon and play a pivotal role in the global carbon cycle [5,6,7]. Peatland disturbance not only interferes with its function as a vital carbon pool but also poses a risk of wild animal extinction, as many of these animals rely on the peatland ecosystem [6,7]. Furthermore, the increasing costs associated with peat extraction and its sustainability issues, given the slow rate at which peat regenerates, have prompted a re-evaluation of its widespread use [5,8]. As such, researchers have been exploring peat moss alternatives for the past several decades [5,9,10].
Biochar (BC) is rich in carbon and made of a variety of renewable feedstocks such as green wastes, coconut coir, rice hull, and wood bark that undergoes pyrolysis at 400 °C to 1200 °C with absent or limited oxygen [3,4,10]. Recent research has highlighted the potential of BC as a cost-effective and environmentally friendly option for container plant production. The raw materials of BC can be made from local industries and farms, which reduces the costs of transportation [4]. Substituting peat moss with BC could reduce peat moss harvesting, and protect the peatland ecosystem [3]. Biochar provides many advantages, including enhancing plant nutrient uptake and water use efficiency and mitigating nutrient leaching [5,8,11,12,13]. The formation of micropores and increased surface area enhance substrate container capacity [12,14,15]. Biochar with high cation exchange capacity (CEC), higher specific surface area, and rich micropores could decrease loss of nutrients such as NO3, NH4+, and K+, which are essential nutrients for plant growth, thereby potentially improving nutrient use efficiency [5,12,16]. For instance, the exponential nitrate release curve showed that substrate with 10% BC had less nitrate leach than 5% and 0% BC, indicating more nitrate retention in the sphagnum peat moss and perlite (85:15 v/v) glass column over time [16].
The optimal incorporation of BC into soil significantly enhances plant growth and physiological functions, but exceeding certain thresholds can inversely affect plant development. For instance, incorporating oak-derived hardwood BC, at 10% and 25% (v/v by vol.) enhanced growth, biomass, root length, and flowering in pansy (Viola cornuta), while adding 50% decreased plant growth and flowering [17]. Similarly, beach roses (Rosa rugosa) grown in 25% (v/v by vol.) conifer wood BC mixes had water use efficiency, numbers of flowers and SPAD value, rate of photosynthesis, and total pigment content (including chlorophyll and carotenoids) comparable with those in 100% peat moss substrates, whereas higher concentrations resulted in reduction of plant growth and pigment levels [18]. Furthermore, 60% BC and 15% vermicompost mixes had the highest total dry weight and growth index for basil (Ocimum basilicum) and tomato plants (Solanum lycopersicum), yet 80% BC mixes had lower total dry weight and growth indexes for tomato plants [19].
Hydrafiber (HF) has emerged as an innovative wood- and bark-based fiber product and presents potential as another peat moss alternative [20]. Hydrafiber is made through a specialized process that refines wood pulp into long, thin fibers using mechanical and thermal techniques, resulting in a porous, durable material ideal for horticulture [20]. Those unique features are proposed by the manufacturer to reduce overwatering issues, thus having the potential to partially substitute peat [14,15]. The mix of HF and peat (40:60 by vol.) reduced biomass by up to 50% and 45% for containerized tomato (Solanum lycopersicum) and chrysanthemum (Chrysanthemum morifolium), respectively, compared to a bark and peat mix [9].
Although very few studies have explored HF effects on plant growth, studies have evaluated wood fiber that shares similar bulk density, higher air space and pH, and better drainage but lower water-holding capacity than HF [8,9,10]. Petunia (Petunia hybrida) grown in 20% wood fiber mixes had similar growth compared to the control (those in commercial mixes) while adding 50% wood fiber reduced flower numbers [21]. Moreover, incorporating 40% wood fiber adversely impacted the micro- and macro-nutrient levels in the leaves and inhibited the growth of geranium (Interspecific geraniums), while adding 20% wood fiber into peat moss increased the number of flowers [22]. Similarly, the Supertunia Vista Bubblegum petunia (Petunia hybrida) grown in 30% wood fiber combined with peat moss substrate had higher leaf SPAD values but fewer flowers, and smaller plants compared with those in the peat moss mixes [23].
Most researchers have tested the effects of BC or HF on plant growth separately. The co-effects of BC and HF have not been studied much yet. Thus, the objective of this research was to (1) compare the BC and HF as a container substrate component; and (2) investigate the co-effects of BC and HF mixture as container substrate components for zinnia and snapdragon.

2. Materials and Methods

2.1. Plant Materials and Substrate Treatments

Snapdragon (Antirrhinum majus, Madame Butterfly Cherry Bronze F1, hybrid Snapdragon) and Zinnia (Zinnia elegans, Giant Dahlia Flowered Orange) seeds (Johnny’s Selected Seeds, Winslow, ME, USA) were sown in 128-cell propagation trays (cell depth: 5.72 cm; cell top length and width: 53.98 cm and 28.58 cm; volume: 25.07 cm3) on 21 February 2023, with propagation media (Pro-Mix FPX Bio-fungicide media, Quakertown, PA, USA). Uniform zinnia and snapdragon seedlings were transplanted into 6-inch (15.24 cm) azalea pots (depth: 10.8 cm; top diameter: 15.5 cm; bottom diameter: 11.3 cm; volume: 1330 mL) on 9 March 2023, after two true leaves emerged. Plants were fertilized every week with 400 mL of 240 mg L−1 water-soluble fertilizer (20 mg L−1 N, 8.6 mg L−1 P, and 16.6 mg L−1 K; Plantex Master Plant (Prod Inc., Leipsic, OH, USA)). Each substrate was irrigated at the same scheduled time and with the same amount of greenhouse tap water (pH at 6.56, and EC at 20.0 mS m−1) with 10–20% leaching rate and maintained at a greenhouse located at the University of Georgia, Griffin, Georgia. The average humidity and temperature during the experiment were 61% and 26.1 °C, respectively.
Twelve substrates were formulated by either mixing BC (20%, 40%, or 60%, by vol.) with HF (20%, 40%, or 60%, by vol.), with the remaining being peat moss (P) or mixing BC (0%, 20%, 40%, and 60%, by vol.) with the commercial substrate (CS). The twelve treatments were T1 (20BC:20HF:60P), T2 (40BC:20HF:40P), T3 (60BC:20HF:20P), T4 (20BC:40HF:40P), T5 (40BC:40HF:20P), T6 (60BC:40HF), T7 (20BC:60HF:20P), T8 (40BC:60HF), T9 (20BC:80CS), T10 (40BC:60CS), T11 (60BC:40CS), and T12 (100CS, the control, Figure 1). Substrate mix components used in the study included the mixed hardwood BC (Proton Power, Inc., Lenoir City, TN, USA), HF (HF Ultra 160WB from HF Advanced Substrate, Buffalo Grove, IL, USA), P (Peat: THE GOLD Canadian Sphagnum Peat Moss by Fertilome, Worth, TX, USA), and CS (Jolly Gardener Pro-line C/25 Growing Mix, Oldcastle Lawn & Garden Inc. Atlanta, Georgia, USA). The BC was made from fast pyrolysis with a pH of 10.6 and EC of 1010 mS m−1 [24]. The pH of HF, P, and CS was 4.89, 5.00, and 5.72, respectively, and EC was 112 mS m−1, 179 mS m−1, and 2383 mS m−1, respectively, measured with the pour-through methods [25]. The CS was used as the control and consisted of 55% aged pine bark and the remaining 45% was composed of Canadian sphagnum peat moss, perlite, and vermiculite.

2.2. Physical and Chemical Properties of the Substrates

Three replicates of the 12 substrate mixes were included to determine physical properties including the container capacity, air space, total porosity, and bulk density. The physical properties of substrates were measured by using the North Carolina State University Horticultural Substrates Laboratory porometers [26]. The pH and EC of substrates were measured using the pour-through method with a pH/EC meter (HI 98129, Hanna Instruments, Woonsocket, RI, USA) biweekly starting at 2 weeks after transplanting (WAT). Substrate particle size distribution was determined by passing 100 g of the substrate through 8.0, 4.0, 2.0, 1.0, 0.50, and 0.25 mm soil sieves. Weight was measured to determine the percentage of each particle size.

2.3. Plant Growth and Development

Height and two perpendicular widths were recorded biweekly starting at 0 WAT. The growth index (GI) was calculated using the formula: GI = height/2 + (width1 + width 2/4) [27]. Leaves’ greenness (SPAD) was recorded by averaging SPAD from three mature leaves of each plant with a chlorophyll meter (SPAD-502 Minolta Camera Co., Osaka, Japan) biweekly starting at 2 WAT for zinnia and 4 WAT for snapdragon, respectively. When the plants started flowering, the numbers of flowers, flower buds, and flower sizes (measuring two perpendicular flower widths) were recorded biweekly. Plants’ dry weights (DW) were determined at the end of 8 WAT for zinnia plants and 10 WAT for snapdragon plants by placing the shoots into the air-forced dry oven for 48 h.

2.4. Experimental Design and Statistical Analysis

The experiment was conducted in a randomized complete block design (RCBD) with 12 blocks. Each block contained all 12 treatments. The treatments with 6 replicants were randomly assigned to pots within each block. One-way analysis of variance (ANOVA) was used to test the effects of substrate mix on physical and chemical properties, plant growth, and development. Data were analyzed using R (R.3.5.2, The R Foundation, Vienna, Austria), and RStudio (R 1.1.463, Boston, MA, USA). When the main effect was significant, Tukey’s honestly significant difference (HSD) test or Dunnett’s test was used to determine the differences among treatments (p ≤ 0.05).

3. Results

3.1. Physical and Chemical Properties of the Substrates

Among all the mixes, T12 (100CS) had the highest percentages (58.5%) of particles in the coarse-sized fraction (>2 mm) and the lowest percentages (5.5%) of particles in the fine-sized fraction (<0.25 mm) (Table 1). In contrast, T7 (20BC:60HF:20P) had the lowest amount of coarse particles (>2 mm) at 36.5%. T7 (20BC:60HF:20P) had the highest percentage of particles in the fine-sized fraction at 16.5% (Table 1).
There was no significant difference in the air space and bulk density among all the treatments (Table 2). Container capacity and total porosity of T4 (20BC:40HF:40P), T5 (40BC:40HF:20P), and T7 (20BC:60HF:20P) were significantly higher than those of the control. T4 (20BC:40HF:40P) had the highest significantly different container capacity and total porosity among all the treatments, while T11 (60BC:40CS) had the significantly lowest container capacity and total porosity among all the treatments (Table 2).
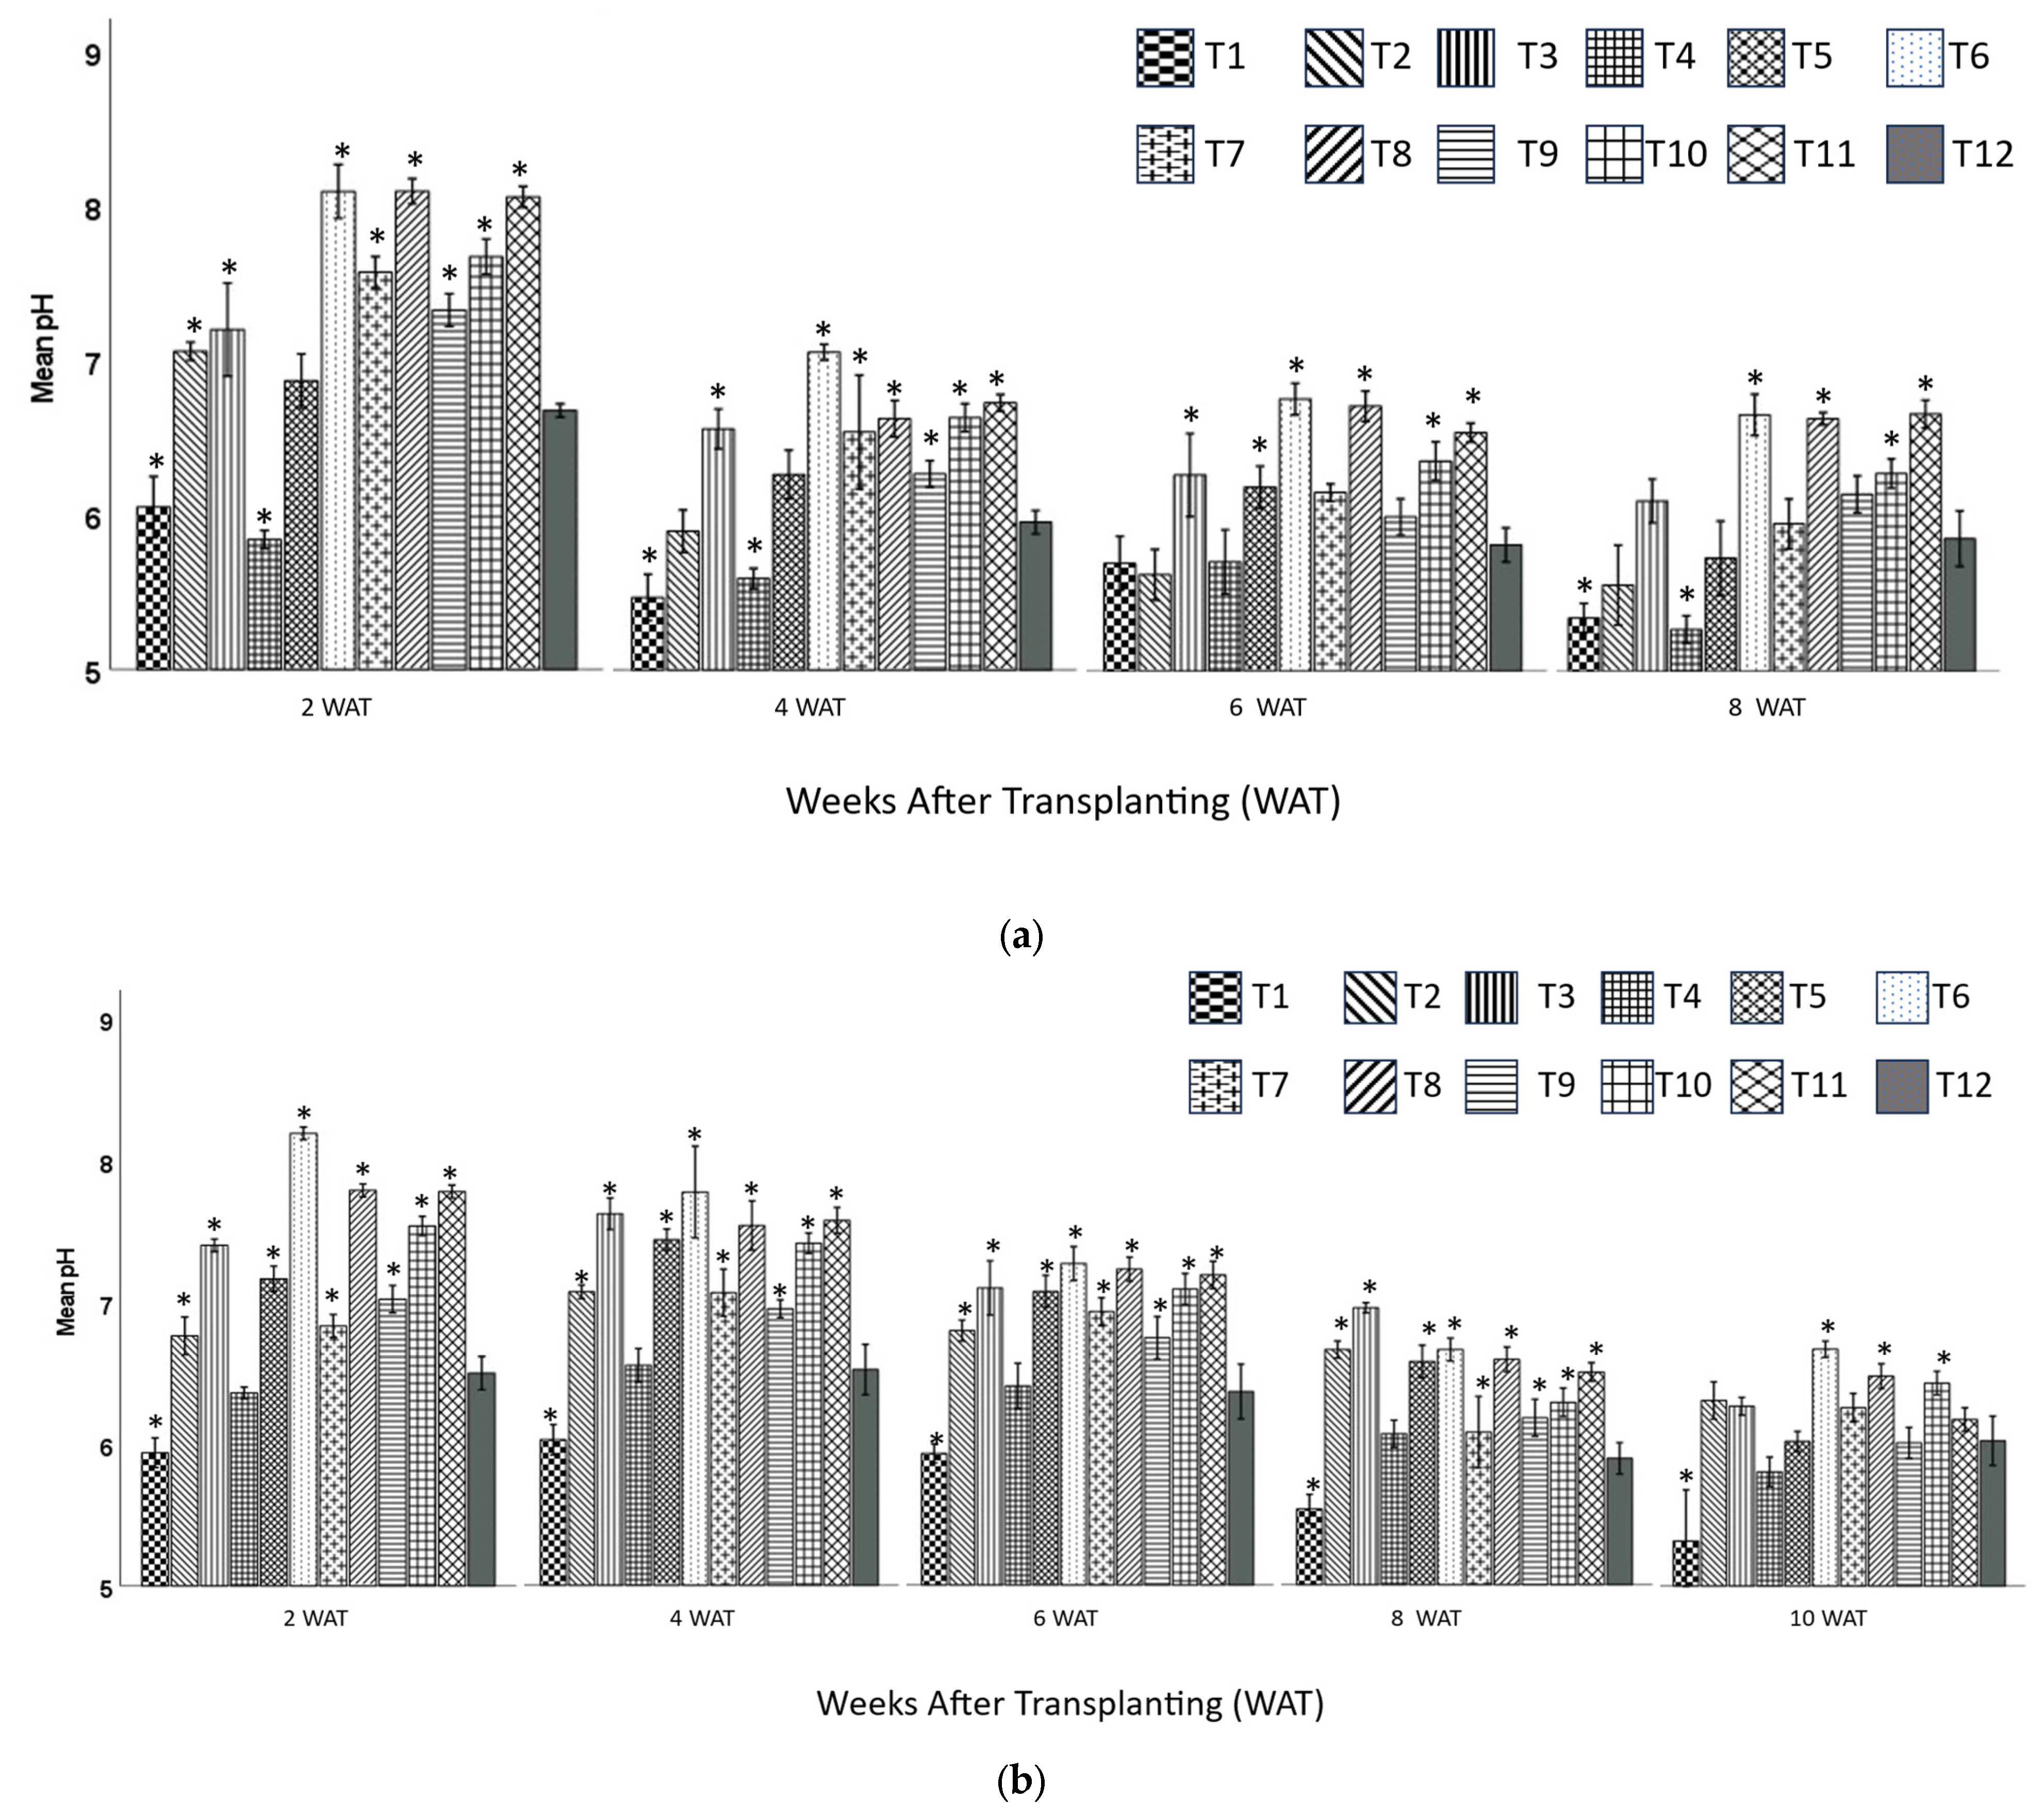
For zinnia plants at 8 WAT, T1 (20BC:20HF:60P) and T4 (20BC:40HF:40P) had significantly lower pH than the control, with T4 being the lowest (5.27). In contrast, T6 (60BC:40HF), T8 (40BC:60HF), T10 (40BC:60CS), and T11 (60BC:40CS) had significantly higher pH (6.67, 6.64, 6.29, and 6.67, respectively) than the control (5.86), with T6 and T11 being the highest (Figure 2a).
For snapdragon plants at 10 WAT, T1 (20BC:20HF:60P) had the lowest pH (5.33). whereas T6 (60BC:40HF) had the highest (6.70). Moreover, the pH values of T6 (60BC:40HF), T8 (40BC:60HF), and T10 (40BC:60CS) were 6.67, 6.64, and 6.29, respectively, and were significantly higher than that of the control (T12, 5.86) at 10 WAT (Figure 2b).
At 2 WAT, all the treatments had significantly lower or similar EC to the control except T9 (20BC:80CS) for both zinnia and snapdragon (Figure 3a,b). At 4 WAT, all the treatments had similar EC, except for T6 (60BC:40HF, zinnia), which had significantly higher EC (334 mS m−1) than the control (148 mS m−1). At 6 WAT, there was no significant difference in EC among all the treatments for either plant. At 8 WAT, EC values of T7 (20BC:60HF:20P) and T8 (40BC:60HF) were significantly higher than those of other treatments in zinnia 448.0 mS m−1 and 752.0 mS m−1, respectively), and EC values of T1 (20BC:20HF:60P), T2 (40BC:20HF:40P), and T6 (60BC:40HF) were significantly higher than those of other treatments in snapdragon (577.0 mS m−1, 468.3 mS m−1, and 357.3 mS m−1, respectively). At 10 WAT, only T1 (20BC:20HF:60P) had significantly higher EC substrate values than the other 11 substrates (607.5 mS m−1).

3.2. Plant Growth and Development

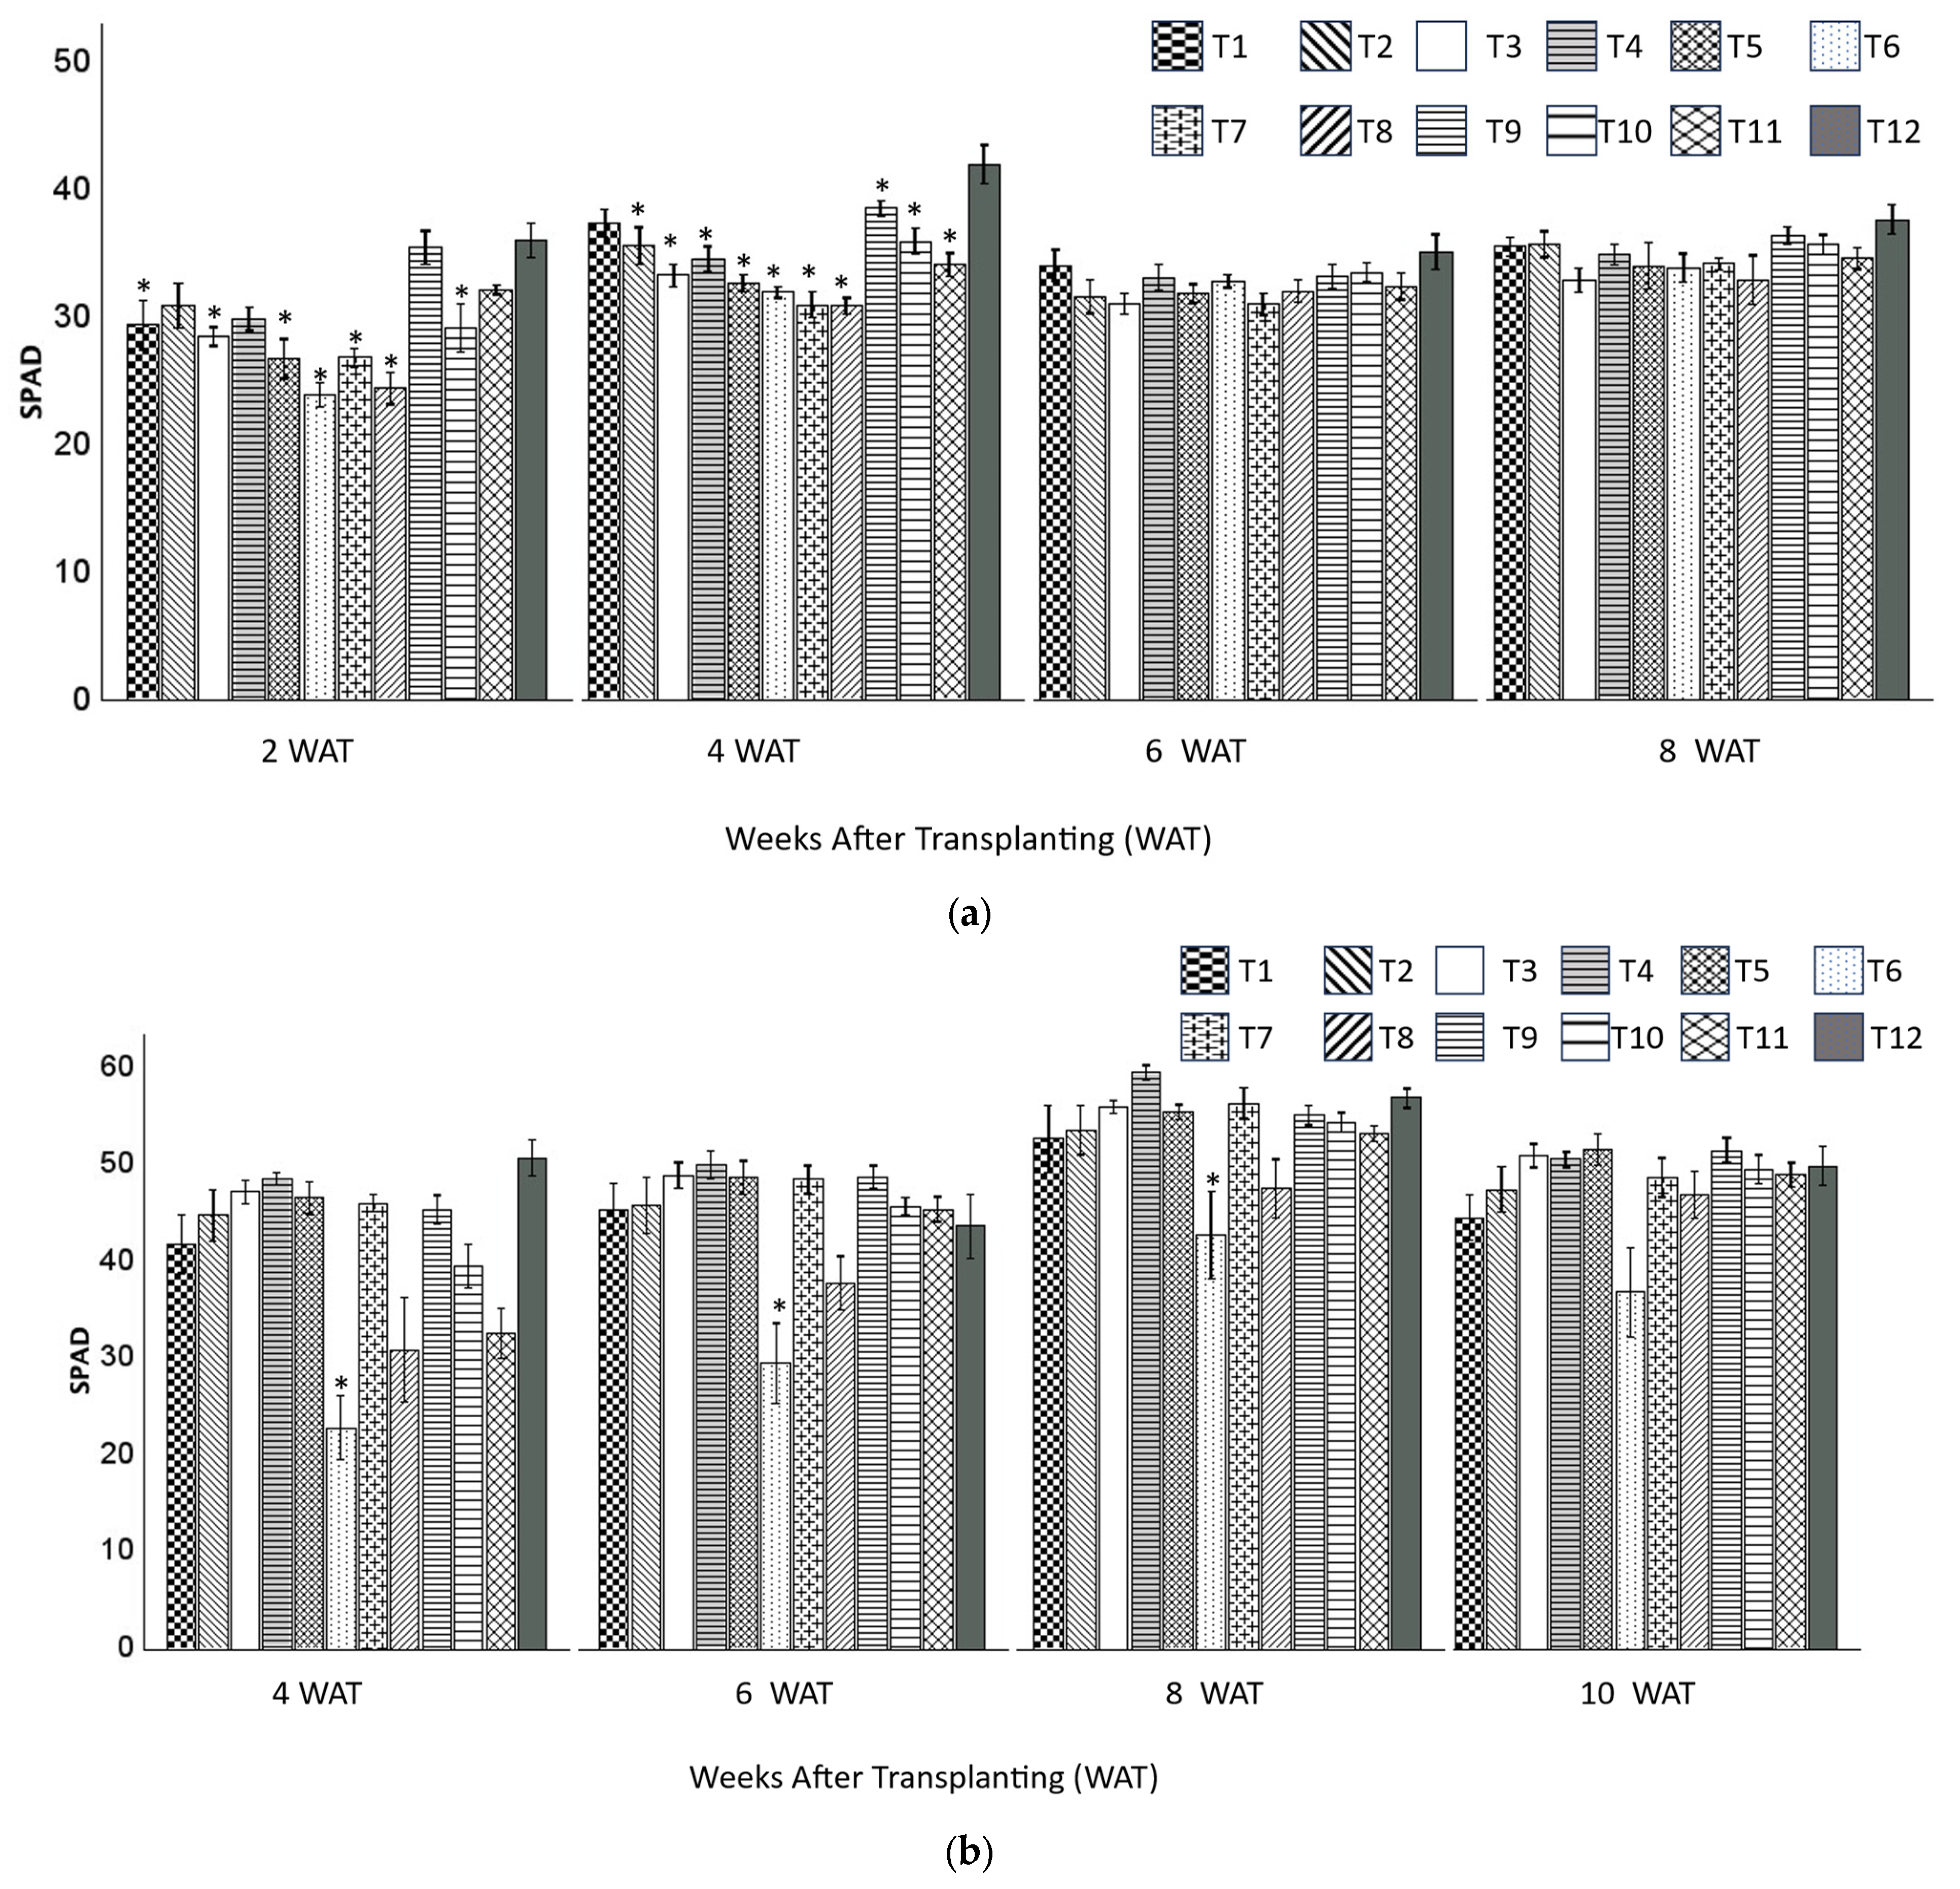
For zinnia plants, all the SPAD values were similar to or significantly lower than those of the control at 2, 4, 6, and 8 WAT (Figure 4a). AT 8 WAT, all the treatments had similar SPAD values, and there was no significant difference among all the treatments. Similarly, for snapdragon plants, all the SPAD values were similar to or significantly lower than those of the control at 4, 6, 8, and 10 WAT (Figure 4b).
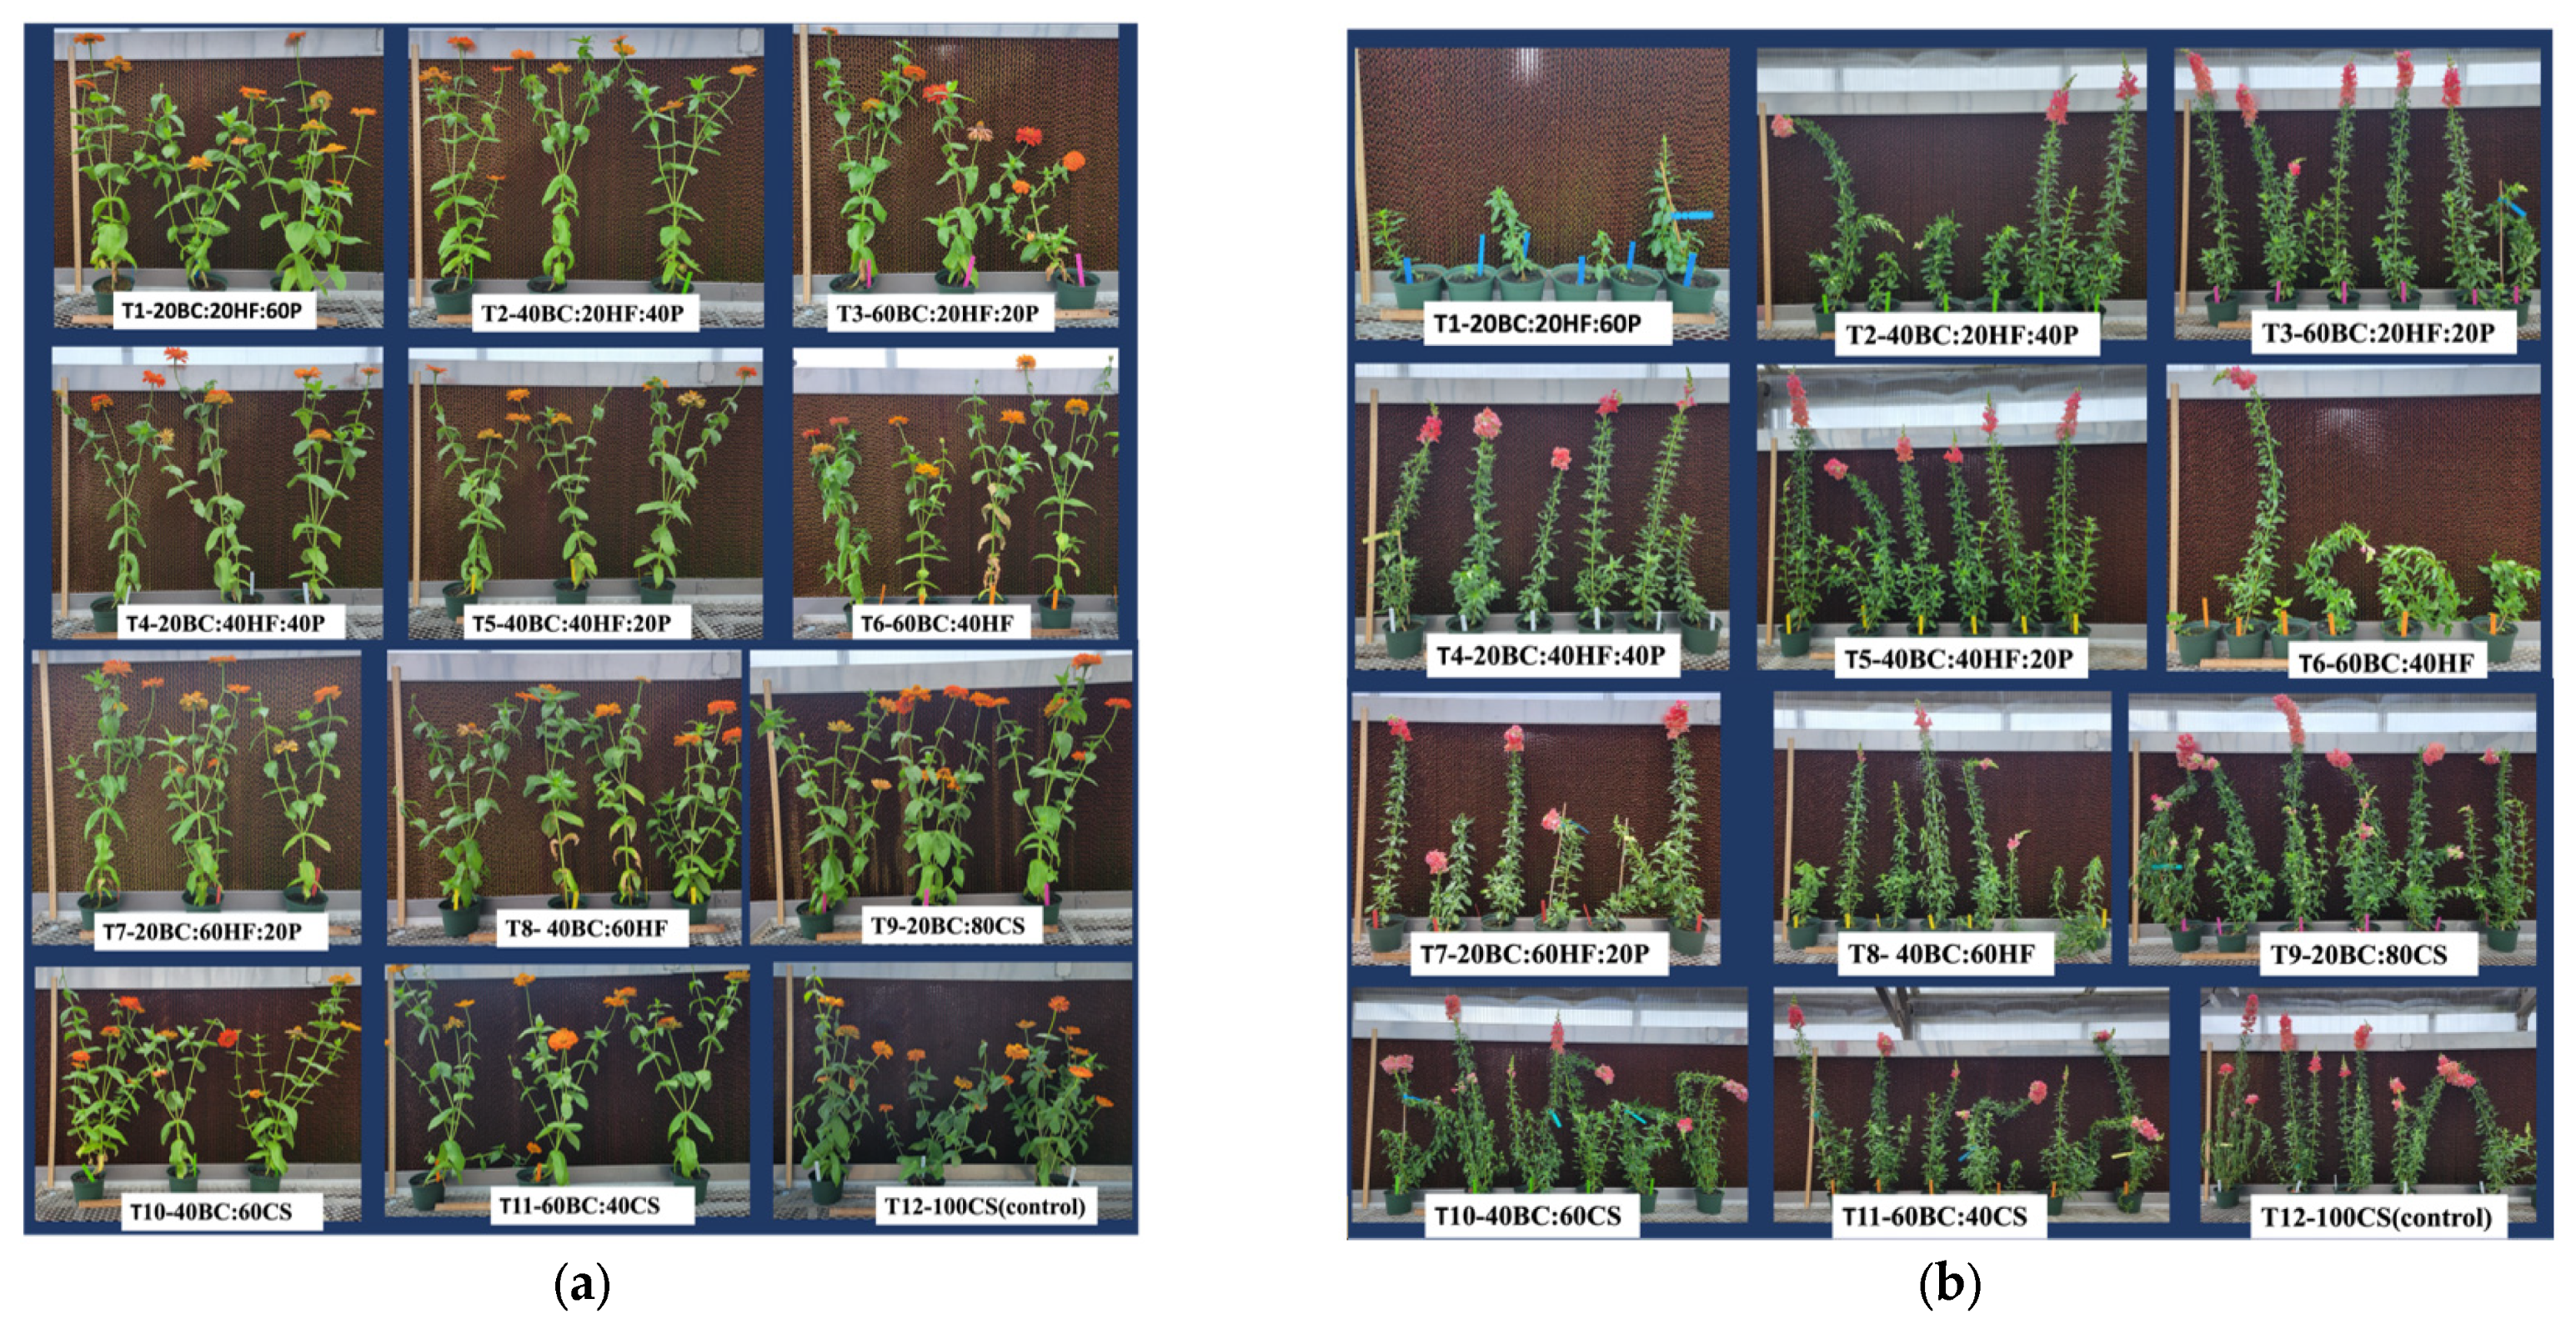
For both zinnia and snapdragon plants (Figure 5 and Figure 6), all the treatments had a similar GI to the control except for T1 (20BC:20HF:60P) and T6 (60BC:40HF) for snapdragon plants, which had a significantly lower GI than the control at 10 WAT. Snapdragon plants grown in T1 (20BC:20HF:60P) mixes had the lowest GI (14.2), while in T3 (60BC:20HF:20P), T5 (40BC:40HF:20P), T9 (20BC:80CS), T10 (40BC:60CS), T11 (60BC:40CS), and T12 (100CS), they had significantly higher GIs (62.0, 64.4, 59.2, 60.6, 62.2 and 63.8, respectively).
Zinnia plants grown in T9 (20BC:80CS) mixes had the highest shoot dry weights (26.09 g), while in T7 (20BC:60HF:20P) mixes had the lowest dry weights (11.12 g, Figure 7a). Snapdragon plants grown in T9 (20BC:80CS) and the control T12 (100CS) had the highest dry weights (23.99 g) while those grown in T1 (20BC:20HF:60P) had the lowest dry weights (1.48 g, Figure 7b).
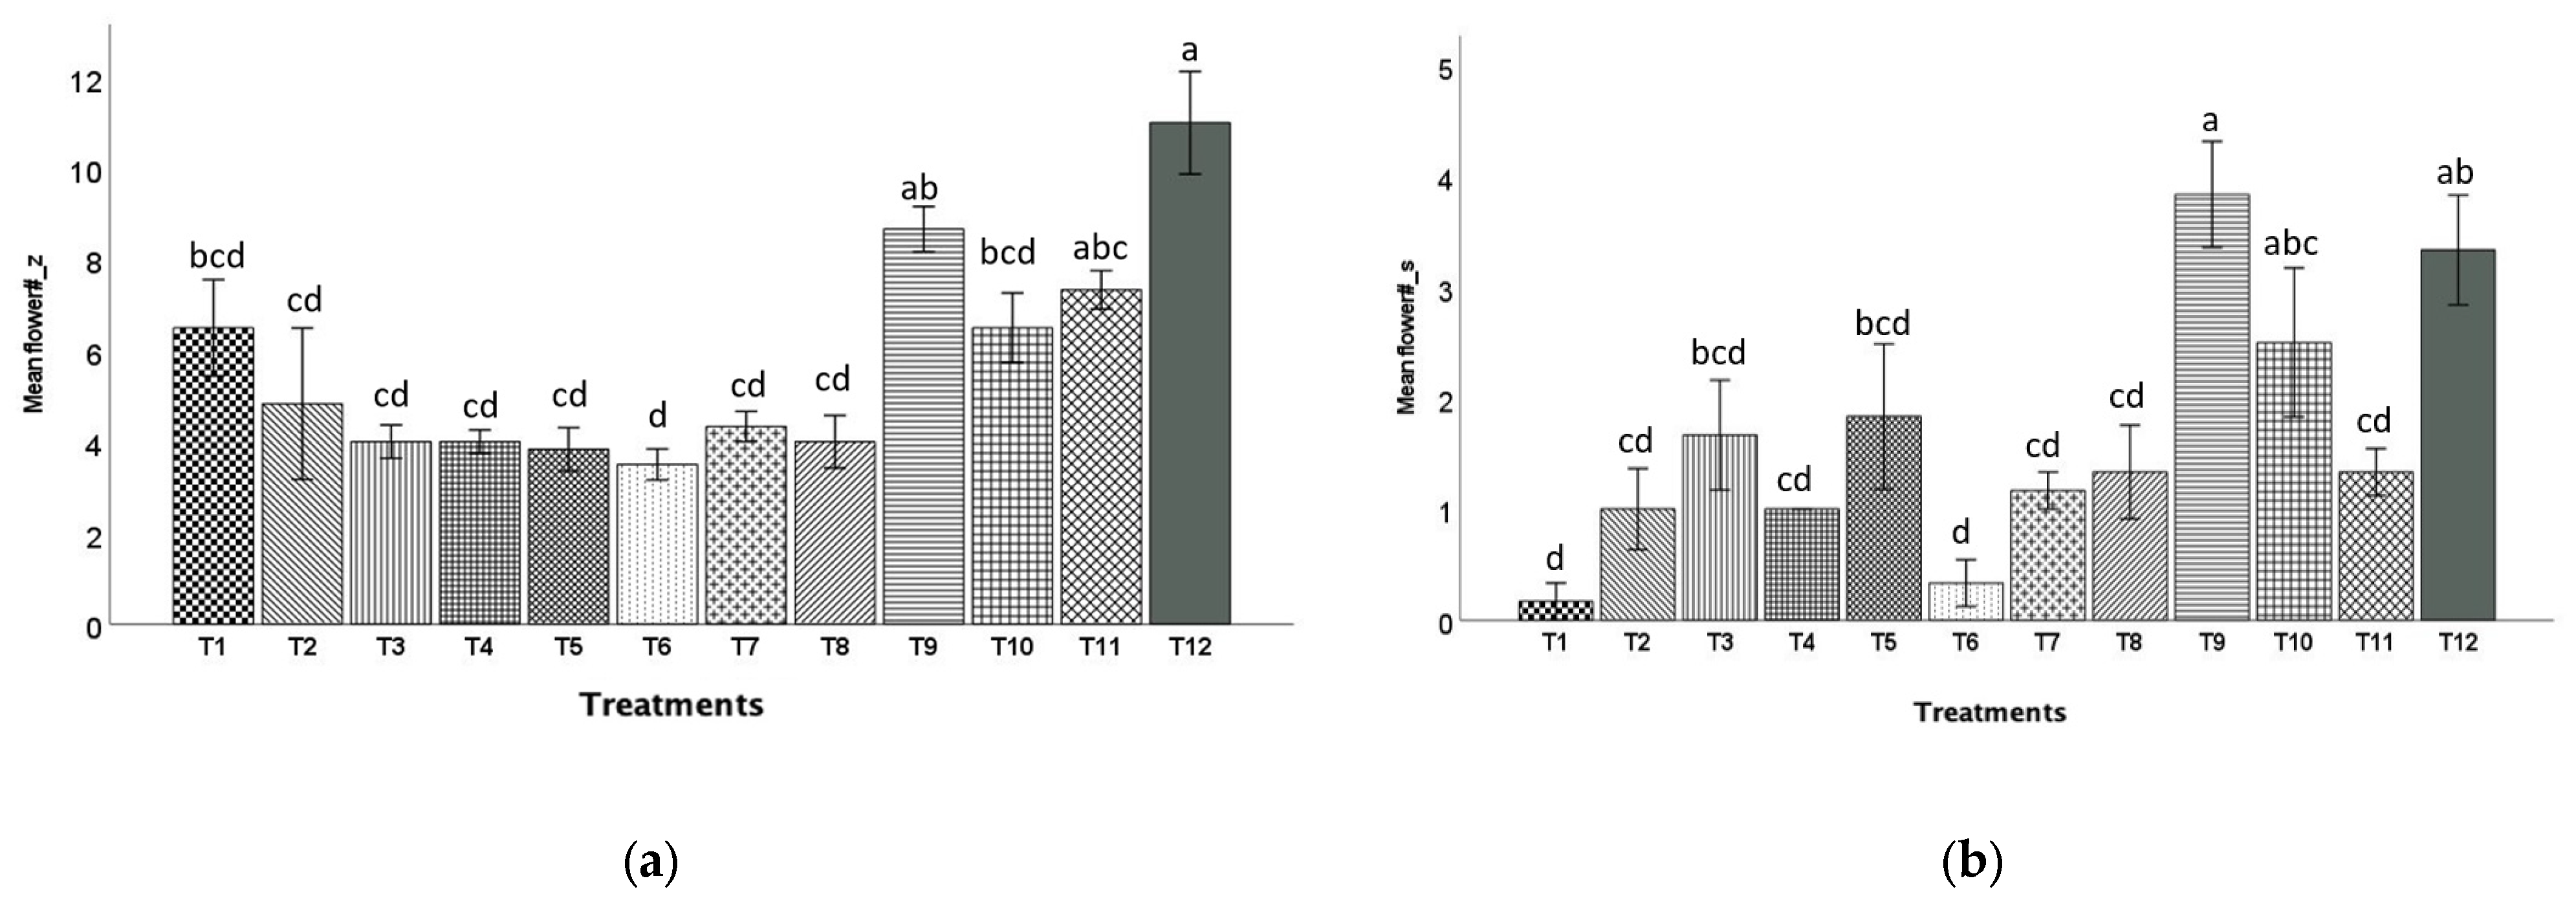
For the zinnia plants, the control (100CS) had the highest numbers of flowers (11), whereas T6 (60BC:40HF) had the least numbers of flowers on average (3.5, Figure 8a). For the snapdragon plants, T9 (20BC:80CS) had more flowers (3.8) than the control (3.3), while T1 (20BC:20HF:60P) and T6 (60BC:40HF) had the least numbers of flowers (0.17 and 0.33, Figure 8b).

4. Discussion

4.1. Physical and Chemical Properties of the Substrates

Incorporating BC into substrate affected the container capacity and total porosity [2,27,28]. For instance, integrating 20% pine wood BC into a peat-based substrate resulted in the highest total porosity and container capacity. As the percentage of BC increased from 20% to 100%, container capacity decreased [27]. Additionally, the addition of 20% and 35% BC to composted green waste substrates significantly increased substrates’ total porosity compared to the control (100% composted green waste) [28]. In our study, only T9 (20BC:80CS) and T10 (40BC:60CS) showed that an increase in BC rate increased container capacity and total porosity but this increase was not significant for either zinnia or snapdragon plants. However, mixing BC up to 60% with CS had negative effects on container capacity and total porosity of substrates. Similarly, a study found that increasing the BC rate from 0% to 75% in a peat-based substrate reduced water content from 58.7% to 44.8% and particle density from 1602.2 g L−1 to 1805.3 g L−1 [18]. Biochar contains macropores for aeration and micropores for holding water content. As the BC rate increases, increasing the macropore sizes, so does the porosity: more macropores for aeration while fewer micropores for holding water thereby reduces container capacity [29]. The total porosity is affected by both air spaces and container capacity. There was no effect of BC rate in peat-based substrate on total porosity [30]. The variation was due to the differences in substrate components used and different particle sizes of BC in each study [2].
Similarly, HF percentage influences the mix of physical properties. For instance, incorporating 30% HF with peat moss gave the highest container capacity, compared to those incorporated with 15%, 45%, and 60% HF in peat-based substrates [31]. Total porosity and bulk density increased as the HF percentage increased from 15%, 30%, and 45% to 60% [31]. Similarly, incorporating 40% HF in 20% BC and 40% P gave the highest container capacity and total porosity, however, they both decreased when HF increased from 40% to 60%. This may due to the BC rate exceeding 25%, which increases air space and bulk density, but decreases water content, container capacity, and total porosity [32]. Additionally, increasing the wood fiber percentage from 0% to 80% in peat-based substrate increased total porosity but decreased container capacity [33]. However, this study did not find this trend because T4 (20BC:40HF:40P) had higher total porosity and container capacity than T1 (20BC:20HF:60P) and T7 (20BC:60HF:20P) but not significantly higher. This may have been due to the 20% BC incorporation helping neutralize the effect of HF on container capacity, resulting in no significant differences between T1, T4, and T7 [34].
The optimal pH range for maximum container growth was between 5.4 and 6.8 [35]. All the treatments (except 2 WAT) were within this range for zinnia plants throughout the growing period. At 2 WAT, only T1 (20BC:20HF:60P), T4 (20BC:40HF:40P), T5 (40BC:40HF:20P), and T12 (100CS) were within this range. All the treatments developed into the optimal pH range at 4 WAT. For snapdragon plants, most treatments had high initial pH (many of them were above 8 at 2 WAT) and dropped to optimal range during the experiment. The increase in pH might have been due to the addition of hardwood BC, which had an initial pH of 10.1 [2]. The pH of all the treatments was lower or similar to that of the control treatments at 8 or 10 WAT due to fertilizer application throughout the experiment [2].
Biochar treatments incorporated with CS had generally higher EC than other treatments. Higher EC in BC in CS-based substrate could have been a result of the higher concentration of soluble salts in CS [36]. This explains T9(20BC:80CS), T10(40BC:60CS), T11(60BC:40CS), and T12(100CS) having almost 10 times higher EC than other treatments. The optimal EC for container-grown plants ranged from 270 to 460 (mS m−1) [37]. At 8 WAT for zinnia plants, only T7 (20BC:60HF:20P), T9 (20BC:80CS), and T11 (60BC:40CS) were within the optimal range, and at 10 WAT for snapdragon plants, only T2 (40BC:20HF:40P), T4 (20BC:40HF:40P), T5 (40BC:40HF:20P), and T6 (60BC:40HF) were within the optimal range.

4.2. Plant Growth and Development

This study found no significant difference in SPAD value associated with increasing HF percentage, aligning with previous research findings across various plant species and substrates. For example, HF percentage had no effect on SPAD for Supertunia Vista Bubblegum petunia (Petunia hybrida) compared with other treatments including hammer-milled pine wood or coconut (Cocos nucifera) coir [23]. Similarly, no difference was found in SPAD and HF percentage components in the peat-based substrate in petunia (Petunia hybrida) [31]. In addition, the SPAD value was not significantly different from the control (100% peat) when treating plants with 10%, 20%, and 30% wood fiber with 90%, 80%, and 70% peat, respectively, in geranium (Interspecific geraniums) [22]. However, 40% wood fiber in peat-based substrate led to smaller and fewer flowers, and lower SPAD value [22]. This may be explained by two reasons. First, wood material may reduce nutrient availability and uptake, and produce phytotoxic compounds. Second, the use of wood material may create the need for additional N fertilizer for geranium, which requires substantial N to achieve optimal growth in plants [22]. In our study, there were no negative effects associated with increasing HF percentage in leaf greenness because zinnia and snapdragon plants need low to medium levels of N during plant growth [38].
Our study’s findings of plant growth, plant weight, and number of flowers align with those of previous research. The previous study found a reduction in the fresh weight of geranium (Interspecific geraniums) with an increased proportion of pine wood fiber [22]. Similarly, blending pine wood fiber with peat did not significantly alter the shoot growth, height, and width of Supertunia Vista Bubblegum petunia (Petunia hybrida) when compared to substrates of hammer-milled pine wood or coconut coir [23]. One study noted a decline in both the number of flowers and dry weights with a higher percentage of HF [31]. Furthermore, incorporating 10% and 25% BC into a peat-based substrate benefited plant growth in four Viola cornuta cultivars, whereas a 50% BC mixture adversely affected plant biomass [17]. In addition, a study discovered that a high BC concentration (70%) diminished flowering and plant growth, whereas a lower BC content (30%) did not negatively impact the flowering or growth of pelargonium plants [32].

5. Conclusions

This study found incorporating mixed hardwood BC along with commercial substrate mix had better growth effects on plant biomass, and the number of flowers than HF, BC, and peat moss substrate mixes for zinnia and snapdragon plants. Mixing 20% BC with CS-based substrate and 100% CS gave the highest biomass and flower numbers for zinnia and snapdragon plants. Increasing the BC percentage reduced plant growth. No treatments were significantly different in SPAD values, air space, and bulk density. Substrate mixed with 20BC:40HF:40P had the greatest container capacity and total porosity. Among all HF-containing substrates, T1 (20BC:20HF:60P), T3 (60BC:20HF:20P), T4 (20BC:40HF:40P), T5 (40BC:40HF:20P), and T6 (60BC:40HF), generally had better performance in substrate properties, plant growth, biomass, and flower numbers of zinnia and snapdragon plants (except T1 and T6), indicating a potential value of substituting partial peat percentage in horticultural practices.
In conclusion, this study recommends 20% BC with CS or 100% CS for growing zinnia and snapdragon. While HF did not prove to be the most effective substrate component for cultivating zinnia and snapdragon, it still holds potential for partial peat substitution given its impact on biomass, plant growth, and floral yield. More studies need to be conducted to evaluate the effects of different BC types and rates and HF on a broader range of plant species.

Author Contributions

Conceptualization, P.Y.; methodology, P.Y.; software, L.C.; validation, L.C. and P.Y.; formal analysis, L.C.; investigation, J.R.; resources, P.Y.; data curation L.C. and J.R.; writing—original draft preparation, L.C.; writing—review and editing, L.C. and P.Y.; visualization, L.C.; supervision, P.Y.; project administration, J.R. and P.Y.; funding acquisition, P.Y.; All authors have read and agreed to the published version of the manuscript.

Funding

This research received no external funding.

Data Availability Statement

The original contributions presented in the study are included in the article, further inquiries can be directed to the corresponding author.

Conflicts of Interest

The authors declare no conflict of interest.

References

  1. National Minerals Information Center Peat—Historical Statistics (Data Series 140). Available online: https://www.usgs.gov/media/files/peat-historical-statistics-data-series-140 (accessed on 4 October 2023).
  2. Huang, L.; Gu, M. Effects of Biochar on Container Substrate Properties and Growth of Plants—A Review. Horticulturae 2019, 5, 14. [Google Scholar] [CrossRef]
  3. Sradnick, A.; Werner, M.; Körner, O. Make a Choice: A Rapid Strategy for Minimizing Peat in Horticultural Press Pots Substrates Using a Constrained Mixture Design and Surface Response Approach. PLoS ONE 2023, 18, e0289320. [Google Scholar] [CrossRef]
  4. Page, S.E.; Siegert, F.; Rieley, J.O.; Boehm, H.D.V.; Jaya, A.; Limin, S. The Amount of Carbon Released from Peat and Forest Fires in Indonesia during 1997. Nature 2002, 420, 61–65. [Google Scholar] [CrossRef]
  5. Yu, P.; Qin, K.; Niu, G.; Gu, M. Alleviate Environmental Concerns with Biochar as a Container Substrate: A Review. Front. Plant Sci. 2023, 14, 1176646. [Google Scholar] [CrossRef] [PubMed]
  6. Page, S.E.; Rieley, J.O.; Banks, C.J. Global and Regional Importance of the Tropical Peatland Carbon Pool. Glob. Chang. Biol. 2011, 17, 798–818. [Google Scholar] [CrossRef]
  7. McCarter, C.P.R.; Wilkinson, S.L.; Moore, P.A.; Waddington, J.M. Ecohydrological Trade-Offs from Multiple Peatland Disturbances: The Interactive Effects of Drainage, Harvesting, Restoration and Wildfire in a Southern Ontario Bog. J. Hydrol. 2021, 601, 126793. [Google Scholar] [CrossRef]
  8. Gruda, N.S. Increasing Sustainability of Growing Media Constituents and Stand-Alone Substrates in Soilless Culture Systems. Agronomy 2019, 9, 298. [Google Scholar] [CrossRef]
  9. Beaulieu, J.; Belayneh, B.; Lea-Cox, J.D.; Swett, C.L. Improving Containerized Nursery Crop Sustainability: Effects of Conservation-Driven Adaptations in Soilless Substrate and Water Use on Plant Growth and Soil-Borne Disease Development. HortScience 2022, 57, 674–683. [Google Scholar] [CrossRef]
  10. Demirbaş, A.; Arin, G. An Overview of Biomass Pyrolysis. Energy Sources 2002, 24, 471–482. [Google Scholar] [CrossRef]
  11. Weber, K.; Quicker, P. Properties of Biochar. Fuel 2018, 217, 240–261. [Google Scholar] [CrossRef]
  12. Ding, Y.; Liu, Y.; Liu, S.; Li, Z.; Tan, X.; Huang, X.; Zeng, G.; Zhou, L.; Zheng, B. Biochar to Improve Soil Fertility. A Review. Agron. Sustain. Dev. 2016, 36, 36. [Google Scholar] [CrossRef]
  13. Liu, Z.; Dugan, B.; Masiello, C.A.; Gonnermann, H.M. Biochar Particle Size, Shape, and Porosity Act Together to Influence Soil Water Properties. PLoS ONE 2017, 12, e0179079. [Google Scholar] [CrossRef]
  14. Tomczyk, A.; Sokołowska, Z.; Boguta, P. Biochar Physicochemical Properties: Pyrolysis Temperature and Feedstock Kind Effects. Rev. Environ. Sci. Biotechnol. 2020, 19, 191–215. [Google Scholar] [CrossRef]
  15. Jahromi, N.B.; Walker, F.; Fulcher, A.; Altland, J.; Wright, W.C. Growth Response, Mineral Nutrition, and Water Utilization of Container-Grown Woody Ornamentals Grown in Biochar-Amended Pine Bark. HortScience 2018, 53, 347–353. [Google Scholar] [CrossRef]
  16. Altland, J.E.; Locke, J.C. Biochar Affects Macronutrient Leaching from a Soilless Substrate. HortScience 2012, 47, 1136–1140. [Google Scholar] [CrossRef]
  17. Regmi, A.; Singh, S.; Moustaid-Moussa, N.; Coldren, C.; Simpson, C. The Negative Effects of High Rates of Biochar on Violas Can Be Counteracted with Fertilizer. Plants 2022, 11, 491. [Google Scholar] [CrossRef]
  18. Fascella, G.; Mammano, M.M.; D’Angiolillo, F.; Rouphael, Y. Effects of Conifer Wood Biochar as a Substrate Component on Ornamental Performance, Photosynthetic Activity, and Mineral Composition of Potted Rosa rugosa. J. Hortic. Sci. Biotechnol. 2018, 93, 519–528. [Google Scholar] [CrossRef]
  19. Huang, L.; Gu, M.; Yu, P.; Zhou, C.; Liu, X. Biochar and Vermicompost Amendments Affect Substrate Properties and Plant Growth of Basil and Tomato. Agronomy 2020, 10, 224. [Google Scholar] [CrossRef]
  20. HydraFiber Hub. Available online: https://www.hydrafiber.com/ (accessed on 26 February 2024).
  21. Lahti, S.; Fridefors, L.; Heinänen, S. The Effects of Added Wood Fibre in Peat-Based Growing Medium on Petunia × hybrida. Master’s Thesis, Novia University, Vaasa, Finland, 2022. [Google Scholar]
  22. Zawadzińska, A.; Salachna, P.; Nowak, J.S.; Kowalczyk, W. Response of Interspecific Geraniums to Waste Wood Fiber Substrates and Additional Fertilization. Agriculture 2021, 11, 119. [Google Scholar] [CrossRef]
  23. Harris, C.N.; Dickson, R.W.; Fisher, P.R.; Jackson, B.E.; Poleatewich, A.M. Evaluating Peat Substrates Amended with Pine Wood Fiber for Nitrogen Immobilization and Effects on Plant Performance with Container-Grown Petunia. Horttechnology 2020, 30, 107–116. [Google Scholar] [CrossRef]
  24. Yu, P.; Ong, K.; Ueckert, J.; Gu, M. Biochar and Trichoderma Reduce Containerized Poinsettia Root Rot Caused by Pythium aphanidermatum. HortScience 2023, 58, 846–854. [Google Scholar] [CrossRef]
  25. Wright, R.D. The Pour-through Nutrient Extraction Procedure. HortScience 1986, 21, 227–229. [Google Scholar] [CrossRef]
  26. Holcomb, E.J.; Berghage, R.; Fonteno, W. Student Laboratory Exercise to Understand Air and Water Relations in Container Substrates. HortScience 1995, 30, 900B-900. [Google Scholar] [CrossRef]
  27. Guo, Y.; Niu, G.; Starman, T.; Volder, A.; Gu, M. Poinsettia Growth and Development Response to Container Root Substrate with Biochar. Horticulturae 2018, 4, 1. [Google Scholar] [CrossRef]
  28. Zhang, L.; Sun, X.; Tian, Y.; Gong, X. Biochar and Humic Acid Amendments Improve the Quality of Composted Green Waste as a Growth Medium for the Ornamental Plant Calathea Insignis. Sci. Hortic. 2014, 176, 70–78. [Google Scholar] [CrossRef]
  29. Garrett Owen, W.; Lopez, R.G. Evaluating Container Substrates and Their Components Commercial Greenhouse and Nursery Production Local Faces Countless Connections. Available online: https://www.extension.purdue.edu/extmedia/HO/HO-255-W.pdf (accessed on 22 March 2024).
  30. Vaughn, S.F.; Kenar, J.A.; Thompson, A.R.; Peterson, S.C. Comparison of Biochars Derived from Wood Pellets and Pelletized Wheat Straw as Replacements for Peat in Potting Substrates. Ind. Crop. Prod. 2013, 51, 437–443. [Google Scholar] [CrossRef]
  31. Dickson, R.W.; Helms, K.M.; Jackson, B.E.; Machesney, L.M.; Lee, J.A. Evaluation of Peat Blended with Pine Wood Components for Effects on Substrate Physical Properties, Nitrogen Immobilization, and Growth of Petunia (Petunia × hybrida Vilm.-Andr.). HortScience 2022, 57, 304–311. [Google Scholar] [CrossRef]
  32. Conversa, G.; Bonasia, A.; Lazzizera, C.; Elia, A. Influence of Biochar, Mycorrhizal Inoculation, and Fertilizer Rate on Growth and Flowering of Pelargonium (Pelargonium zonale L.) Plants. Front. Plant Sci. 2015, 6, 127299. [Google Scholar] [CrossRef]
  33. Harris, C. Evaluating Wood Fiber Soilless Soilless Substrates for Effect Aluating Wood Fiber on Plant Performance and Nutrient Management in Container Crops. Master’s Thesis, University of New Hampshire, Durham, NH, USA, 2019. [Google Scholar]
  34. Atkinson, C.J. How Good Is the Evidence That Soil-Applied Biochar Improves Water-Holding Capacity? Soil Use Manag. 2018, 34, 177–186. [Google Scholar] [CrossRef]
  35. Pennisi, B.; Thomas, P.A. Essential pH Management in Greenhouse Crops: pH and Plant Nutrition|UGA Cooperative Extension. Available online: https://extension.uga.edu/publications/detail.html?number=B1256&title=essential-ph-management-in-greenhouse-crops-ph-and-plant-nutrition# (accessed on 2 November 2023).
  36. Garcia-Gomez, A.; Bernal, M.P.; Roig, A. Growth of Ornamental Plants in Two Composts Prepared from Agroindustrial Wastes. Bioresour. Technol. 2002, 83, 81–87. [Google Scholar] [CrossRef] [PubMed]
  37. Torres, A.P.; Mickelbart, M.V.; Lopez, R.G. Measuring pH and EC of Large Container Crops. Available online: https://www.canr.msu.edu/uploads/resources/pdfs/measuring_ph_and_ec_of_crops_grown_in_large_containers.pdf (accessed on 2 November 2023).
  38. Whipker, B.E.; Henry, J.; Owen, W.G. Nutritional Monitoring Series Zinnia (Zinnia elegans). Available online: https://fertdirtsquirt.com/pdf/zinnia.pdf (accessed on 20 December 2023).
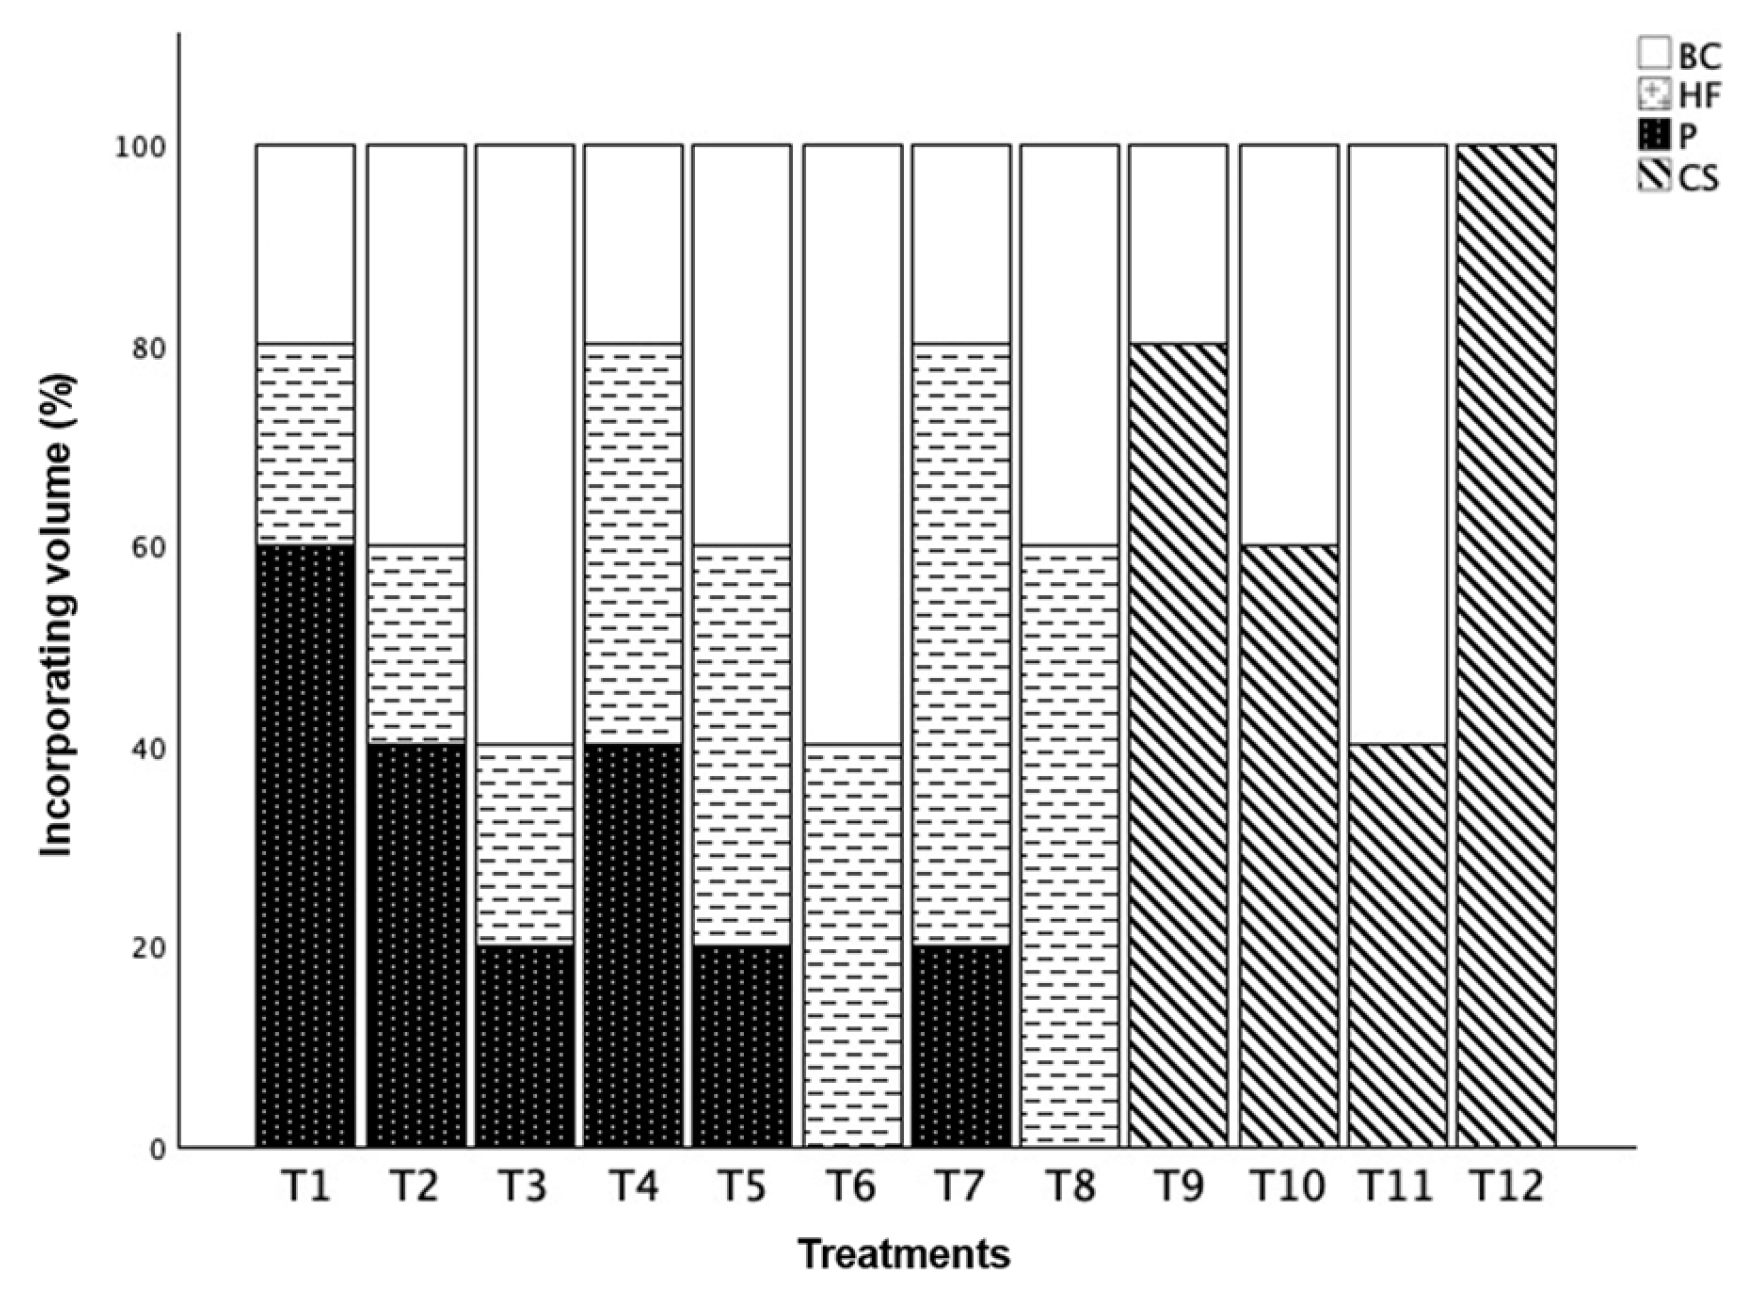
Figure 1. Twelve substrates used in this study with different ratio in biochar (BC), hydrafiber (HF), peat moss (P), and commercial substrate mix (CS), by vol. Treatment 1 (20BC:20HF:60P), T2 (40BC:20HF:40P), T3 (60BC:20HF:20P), T4 (20BC:40HF:40P), T5 (40BC:40HF:20P), T6 (60BC:40HF), T7 (20BC:60HF:20P), T8 (40BC:60HF), T9 (20BC:80CS), T10 (40BC:60CS), T11 (60BC:40CS), T12 (100CS, control). Chemical properties of BC: pH at 10.6 and EC at 1010 mS m−1. Chemical properties of HF: pH was 4.89 and EC was 112 mS m−1. Chemical properties of P: pH was 5.0 and EC was 179 mS m−1. Chemical properties of CS: pH was 5.72, EC was 2383 mS m−1.
Horticulturae 10 00589 g001
Figure 2. Substrates’ pH (mean ± standard error) in leachates of containers of zinnia (a) and snapdragon (b) at 2, 4, 6, 8, 10 (snapdragon only) weeks after transplanting (WAT), respectively. Treatment 1 (20BC:20HF:60P), T2 (40BC:20HF:40P), T3 (60BC:20HF:20P), T4 (20BC:40HF:40P), T5 (40BC:40HF:20P), T6 (60BC:40HF), T7 (20BC:60HF:20P), T8 (40BC:60HF), T9 (20BC:80CS), T10 (40BC:60CS), T11 (60BC:40CS), T12 (100CS, control). * Indicates that means were significantly different from the control using Dunnett’s test at p ≤ 0.05.
Horticulturae 10 00589 g002
Figure 3. Substrates’ EC (mean ± standard error) in leachates of containers of zinnia (a) and snapdragon (b) at 2, 4, 6, 8, 10 (snapdragon only) weeks after transplanting (WAT). Treatment 1 (20BC:20HF:60P), T2 (40BC:20HF:40P), T3 (60BC:20HF:20P), T4 (20BC:40HF:40P), T5 (40BC:40HF:20P), T6 (60BC:40HF), T7 (20BC:60HF:20P), T8 (40BC:60HF), T9 (20BC:80CS), T10 (40BC:60CS), T11 (60BC:40CS), and T12 (100 CS, control). * Indicates that means were significantly different from the control using Dunnett’s test at p ≤ 0.05.
Horticulturae 10 00589 g003
Figure 4. The SPAD values (mean ± standard error) of zinnia (a) and snapdragon (b) plants grown in 12 substrates at 2, 4, 6, 8, and 10 (snapdragon only) weeks after transplanting (WAT). Treatment 1 (20BC:20HF:60P), T2 (40BC:20HF:40P), T3 (60BC:20HF:20P), T4 (20BC:40HF:40P), T5(40BC:40HF:20P), T6 (60BC:40HF), T7 (20BC:60HF:20P), T8 (40BC:60HF), T9 (20BC:80CS), T10 (40BC:60CS), T11 (60BC:40CS), and T12 (100CS, control). * Indicates that means are significantly different from the control using Dunnett’s test at p ≤ 0.05.
Horticulturae 10 00589 g004
Figure 5. Growth indexes (mean ± standard error) of zinnia (a) and snapdragon (b) plants grown in 12 substrates at 8 and 10 weeks after transplanting (WAT), respectively. There were no significant differences among treatment for zinnia. Treatment 1 (20BC:20HF:60P), T2 (40BC:20HF:40P), T3 (60BC:20HF:20P), T4 (20BC:40HF:40P), T5(40BC:40HF:20P), T6 (60BC:40HF), T7 (20BC:60HF:20P), T8 (40BC:60HF), T9 (20BC:80CS), T10 (40BC:60CS), T11 (60BC:40CS), and T12 (100CS, control). Means indicated by the same alphabet letters are not significantly different according to Tukey–Kramer’s HSD test at p ≤ 0.05.
Horticulturae 10 00589 g005
Figure 6. Plant growth of zinnia (a) and snapdragon (b) plants at 8 and 10 WAT, respectively. Treatment 1 (20BC:20HF:60P), T2 (40BC:20HF:40P), T3 (60BC:20HF:20P), T4 (20BC:40HF:40P), T5 (40BC:40HF:20P), T6 (60BC:40HF), T7 (20BC:60HF:20P), T8 (40BC:60HF), T9 (20BC:80CS), T10 (40BC:60CS), T11 (60BC:40CS), and T12 (100CS, control).
Horticulturae 10 00589 g006
Figure 7. Shoot dry weight (mean ± standard error) of zinnia (a) and snapdragon (b) plants harvested at 8 and 10 weeks after transplanting, respectively. Treatment 1 (20BC:20HF:60P), T2 (40BC:20HF:40P), T3 (60BC:20HF:20P), T4 (20BC:40HF:40P), T5 (40BC:40HF:20P), T6 (60BC:40HF), T7 (20BC:60HF:20P), T8 (40BC:60HF), T9 (20BC:80CS), T10 (40BC:60CS), T11 (60BC:40CS), and T12 (100CS, control). Means indicated by the same alphabet letters are not significantly different according to Tukey–Kramer’s HSD test at p ≤ 0.05.
Horticulturae 10 00589 g007
Figure 8. Numbers of flowers (unopened and opened flowers) (mean ± standard error) of zinnia (a) and snapdragon (b) plants harvested at 8 or 10 weeks after transplanting, respectively. Treatment 1 (20BC:20HF:60P), T2 (40BC:20HF:40P), T3 (60BC:20HF:20P), T4 (20BC:40HF:40P), T5 (40BC:40HF:20P), T6 (60BC:40HF), T7 (20BC:60HF:20P), T8 (40BC:60HF), T9 (20BC:80CS), T10 (40BC:60CS), T11 (60BC:40CS), and T12 (100CS, control). Means indicated by the same alphabet letters are not significantly different according to Tukey–Kramer’s HSD test at p ≤ 0.05.
Horticulturae 10 00589 g008
Table 1. Percentage of particle size of substrates mixes containing biochar (BC), hydrafiber (HF), peat (P), and commercial substrate (CS) with ± standard deviation (n = 3).
SubstrateSize Fraction (%)
<0.25 mm0.25–0.5 mm0.5–1 mm1–2 mm>2 mm
1-20BC:20HF:60P13.2 ± 1.2 abc Z12.2 ± 2.1 ab16.0 ± 0.2 ab16.9 ± 1.0 ab41.8 ± 1.9 def
2-40BC:20HF:40P14.7 ± 2.0 ab11.7 ± 1.4 ab15.8 ± 0.8 ab17.7 ± 0.3 a40.1 ± 3.7 def
3-60BC:20HF:20P11.8 ± 2.1 bc9.6 ± 1.0 bcd14.0 ± 0.7 bcd17.7 ± 0.0 a46.9 ± 3.8 cd
4-20BC:40HF:40P14.0 ± 0.9 abc11.0 ± 0.4 abc14.3 ± 0.5 bc16.4 ± 0.5 abc44.3 ± 2.0 cde
5-40BC:40HF:20P16.2 ± 1.3 ab11.9 ± 0.5 ab15.4 ± 0.4 ab17.5 ± 0.7 a39.0 ± 1.4 ef
6-60BC:40HF10.0 ± 1.3 cd8.7 ± 0.7 cd13.0 ± 0.7 cd17.8 ± 0.5 a50.6 ± 3.0 bc
7-20BC:60HF:20P16.5 ± 2.8 a12.9 ± 0.7 a16.4 ± 0.8 a17.7 ± 1.4 a36.5 ± 2.3 f
8-40BC:60HF15.2 ± 1.5 ab12.0 ± 0.8 ab15.2 ± 0.1 ab17.1 ± 0.9 ab40.5 ± 1.4 def
9-20BC:80CS6.3 ± 1.1 de8.5 ± 0.7 cd12.5 ± 0.7 cd14.7 ± 0.3 c58.0 ± 2.9 ab
10-40BC:60CS12.8 ± 0.8 abc12.6 ± 0.8 a15.4 ± 0.7 ab15.4 ± 0.4 bc43.8 ± 2.6 cdef
11-60BC:40CS6.7 ± 0.7 de7.5 ± 1.0 d12.1 ± 1.3 d17.2 ± 0.2 ab56.5 ± 3.3 ab
12-100CS5.5 ± 0.7 e8.7 ± 0.8 cd12.8 ± 0.5 cd14.5 ± 0.2 c58.5 ± 1.9 a
Z Means within a column followed by the same letter were not significantly different according to Tukey–Kramer’s HSD test at p ≤ 0.05.
Table 2. Container capacity, air space, total porosity, and bulk density of biochar (BC), hydrafiber (HF), peat (P), and commercial substrate (CS) mixes (by vol. three replications) ± standard deviation.
SubstrateContainer Capacity (%)Air Space (%)Total Porosity (%)Bulk Density (g cm−3)
20BC:20HF:60P56.89 ± 1.8 abc Z4.58 ± 2.161.47 ± 3.2 abc0.16 ± 0.05
40BC:20HF:40P57.25 ± 1.3 abc5.06 ± 0.862.31 ± 2.1 abc0.13 ± 0.00
60BC:20HF:20P56.18 ± 3.7 bc8.39 ± 3.764.57 ± 2.1 abc0.14 ± 0.09
20BC:40HF:40P68.11 ± 0.9 a9.83 ± 4.177.95 ± 3.2 a0.12 ± 0.00
40BC:40HF:20P60.38 ± 1.7 ab13.35 ± 1.773.73 ± 2.5 ab0.11 ± 0.00
60BC:40HF47.05 ± 1.8 cd11.09 ± 5.258.14 ± 4.3 bc0.11 ± 0.01
20BC:60HF:20P61.97 ± 1.7 ab11.57 ± 1.573.54 ± 0.4 ab0.10 ± 0.00
40BC:60HF51.75 ± 1.0 bcd13.79 ± 6.965.53 ± 7.6 abc0.12 ± 0.01
20BC:80CS44.36 ± 5.6 d9.01 ± 0.553.37 ± 6.0 c0.15 ± 0.00
40BC:60CS53.56 ± 1.2 bcd5.98 ± 1.259.53 ± 1.5 bc0.18 ± 0.00
60BC:40CS30.55 ± 3.1 e5.78 ± 1.436.34 ± 2.7 d0.12 ± 0.01
100CS47.17 ± 1.7 cd6.03 ± 0.553.19 ± 1.1 c0.16 ± 0.01
Z Means within a column followed by the same difference were not significantly different according to Tukey–Kramer’s HSD test at p ≤ 0.05 test.
Disclaimer/Publisher’s Note: The statements, opinions and data contained in all publications are solely those of the individual author(s) and contributor(s) and not of MDPI and/or the editor(s). MDPI and/or the editor(s) disclaim responsibility for any injury to people or property resulting from any ideas, methods, instructions or products referred to in the content.