Article

Exploring the Genetic Landscape of Tilia Spp. with Molecular and Statistical Tools

1
Department of Horticulture, Faculty of Engineering and Applied Technologies, University of Life Sciences “King Mihai I” from Timisoara, 119 Calea Aradului Street, 300645 Timisoara, Romania
2
Department of Food Science, Faculty of Food Engineering, University of Life Sciences “King Mihai I” from Timisoara, 119 Calea Aradului Street, 300645 Timisoara, Romania
3
Genetic Department, Faculty of Engineering and Applied Technologies, University of Life Sciences “King Mihai I” from Timisoara, 119 Calea Aradului Street, 300645 Timisoara, Romania
4
Department of Sustainable Development and Environmental Engineering, Faculty of Agriculture, University of Life Sciences “King Mihai I” from Timisoara, 119 Calea Aradului Street, 300645 Timisoara, Romania
*
Author to whom correspondence should be addressed.
Horticulturae 2024, 10(6), 596; https://doi.org/10.3390/horticulturae10060596
Submission received: 13 April 2024 / Revised: 28 May 2024 / Accepted: 2 June 2024 / Published: 6 June 2024
(This article belongs to the Section Floriculture, Nursery and Landscape, and Turf)

Abstract

:
Tree species with high ecological plasticity are recommended for use in urban green infrastructures. This study explores the genetic diversity of Tilia cordata, Tilia platyphyllos, and Tilia argentea, highlighting their contribution to urban landscapes. In this respect, the genetic variability of individuals from four populations of the Tilia genus has been analyzed using Inter Simple Sequence Repeats (ISSR) molecular markers, and some of their phenotypic characters were naked-eyed observed or determined by dendrometric measurements. Significant variability between the populations studied was determined. Cluster analysis identified two main groups: Tilia cordata I and Tilia cordata II populations formed the first cluster, and Tilia platyphyllos and Tilia argentea populations formed the second cluster. The results of the phenotypic analysis confirmed the genetic results separating the two populations of Tilia cordata from the populations of Tilia platyphyllos and Tilia argentea in relation to their visible morphological characters. Results obtained from dendrometric measurements analysis represent the foundation for further investigations on urban ecology. An essential potential practical use of the results: the establishment of more efficient ISSR primers to identify the Tilia species analyzed: UBC864, A12, UBC840, and A7 for Tilia cordata, A13 for Tilia platyphyllos and A7 for Tilia argentea has been demonstrated.

1. Introduction

Genotypes adaptability to local abiotic factors determine tree species diversity in urban landscapes. Globally, 2023 was the warmest year on record in terms of the annual average [1,2,3]. In the last four decades, Europe has become the fastest-warming continent on Earth [4]. In 2023, there were numerous contrasting weather events, with heatwaves and wildfires alongside flooding and drought in Europe [5]. Due to climate change impacts, including prolonged periods of excessive heat that negatively affect people’s physical and mental health, the climate crisis has been declared a health emergency by the European Office of the World Health Organization in 2023 [6,7,8]. Extreme weather events have negative impacts on public infrastructure and biodiversity, causing huge economic losses [9,10,11]. The shifting of weather patterns subjects plants to biological threats, such as insect attacks and pathogen outbreaks, mainly in urban environments with high levels of air, water, and soil pollution [12,13]. Urban trees are strongly affected by recent climate change [14,15]. Suitable growing conditions were negatively impacted, which caused a disturbance in the well-being and even survival of urban trees [16]. Abiotic stress caused by climate change negatively affects tree growth by initiating a defense mechanism that impacts the ability to maintain homeostasis [17]. In the severe drought years, a significant decline in tree ring growth of several tree species was demonstrated [18]. Exposure to abiotic stress severely affects normal growth and development, leading to tree decline and even tree death, thereby diminishing the ecosystem services that urban trees provide [19,20,21,22].
The appearance and expansion of Urban Heat Island is one of the multiple negative effects of climate change in Timisoara, a city in Western Romania known as the “city of gardens and parks” [23].
In the last three decades, many ornamental varieties of trees have been planted, both in two-century-old parks and in newly developed green infrastructures [24]. This has contributed to enriching the city’s biodiversity since trees have more genetic diversity at population and species levels than other plants [25].
Identifying Tilia spp. in urban environments can be very challenging due to the presence of numerous genotypes, including species, subspecies, hybrids, and ornamental varieties. The Tiliaceae family comprises about 40 genera. Tilia spp. are among the most widespread urban trees in Europe [26,27,28], out of which Tilia cordata—Mill, Tilia platyphyllos Scop, and Tilia tomentosa—Moench are indigenous species in Romania [29].
It is a demanding challenge for city dwellers to prepare for extreme future events that could strongly affect urban environments [30]. The negative effects of climate change can be mitigated by applying effective measures such as the use of clean energy, the construction of green buildings and green infrastructure, and the development of new varieties of plants that are resistant to the impact of climate change [31].
In order to align with the European Climate Risk Assessment (EUCRA) strategy, new green infrastructures should be designed in Timișoara, using trees with high ecological plasticity. Tilia spp. are highly suitable as urban trees and adaptable to climate changes [32]. There are many cultural, social, ornamental, and ecological benefits of Tilia spp. as urban trees [33,34]. Tilia spp. are used as bioaccumulators and bioindicators of trace elements in urban environments [35,36,37,38,39,40,41]. Many studies have proven the antibacterial and antioxidant activity of flavonoid, glycoside, and alkaloid extracts of Tilia spp. [42,43].
Adding genetic profiles of trees will improve understanding of tree diversity in urban ecosystems [44]. Strong correspondence between morphological identification and genetic determinations of Tilia species in urban green spaces was proved [45]. Recent studies revealed that a high level of genetic diversity characterizes Tilia spp. The first set of microsatellite markers for T. platyphyllos was developed, and it was reported the markers’ transferability to other Tilia species [46]. The genetic structure of ancient woodland species T. cordata and T. platyphyllos in the UK was studied. 13 microsatellite markers were tested for the first time to discriminate the species and hybrid and to assess the population genetic diversity of T. platyphyllos and T. cordata [47]. In order to determine the genetic diversity of Tilia spp., DNA markers were used [48,49,50,51,52].
Therefore, molecular markers are an essential technique in DNA analysis for genetic diversity and identification and conservation of linden species. ISSR markers are commonly used in intraspecies and interspecies DNA analysis and are based on amplifying DNA sequences between single repetitive regions. The use of ISSR markers does not require prior knowledge of the DNA sequence, unlike other molecular markers, making them suitable for genetic diversity analysis, species conservation, and the phylogenetic study of hybridization and species relationships.
In this study, the genetic variability of the Tilia genus was analyzed using ISSR molecular markers. In addition, the sequence blooming and some morphologic characters of individuals from four populations planted in different green spaces of Timișoara were studied.
This study is significant because it provides new data regarding ornamental urban trees with remarkable ecological plasticity. Understanding the responses of Tilia spp. to climatic fluctuations is essential for their future conservation. The research results may contribute to understanding the relationship between tree growth and climate change.
They will provide valuable support in the decision-making process for selecting Tilia spp. adaptable to new local conditions caused by the inevitable impact of climate change. They could be used by different stakeholders who engage in urban green infrastructure assessment and planning, including citizen volunteers, researchers, and governments.

2. Materials and Methods

2.1. Site Description and Data Collection

Timișoara is located in the Western Romanian Plains, Timiș County (45.75372° N; 21.22571° E), being the core of one of the most significant metropolitan areas in the country (Figure 1). It has a surface of 6870.24 ha, of which 362.36 ha are green spaces [53]. The number of citizens is 250.849 [54], so there are 14.44 sqm of green spaces/inhabitant, below the World Health Organization (WHO) recommendation of 50 sqm/inhabitant [55].
Timișoara’s climate is warm and temperate. The mean annual air temperature is 132.05 °C, based on climate data from 2021 to 2022. Regarding precipitation, the annual average was 649 L/m2, but it was unevenly distributed [56,57].
The city was chosen as the research area because local authorities are very interested in increasing the extent of green infrastructure. In 2023, the General Urban Plan proposed an extension up to 883.31 ha, raising the proposed ratio to 35.21 sqm per inhabitant [53]. Also, there is much interest in enriching the city biodiversity by introducing ornamental varieties of tree species with remarkable ecological plasticity, adaptable to local climate conditions (great precipitations during spring and summer, continental polar air masses and cyclones, and warm air masses that cause snow thaw during winters and stifling heat during summers) [58], predictable (common maximum temperatures above 30 °C) [59], and unpredictable climate changes.
Tree data were collected from 120 tree individuals of Tilia spp., planted in four different green infrastructures of Timișoara, as follows:
Population T1 Tilia cordata: 30 trees (T1-1–T1-30)—Albinelor Street alignment.
Population T2 Tilia cordata: 30 trees (T2-1–T2-30)—I.I de la Brad green areas.
Population T3 Tilia platyphyllos: 30 trees (T3-1–T3-30)—Lorena Street alignment.
Population T4 Tilia argentea: 30 trees (T4-1–T4-14)—Torontalului green areas.

2.2. Molecular Analysis of Genetic Variability in the Genus Tilia

In order to determine genetic variability in the genus Tilia, molecular analyses were performed in the Molecular Biology Laboratory, USV “King Michael I” of Timișoara. Genetic variability was determined by using ISSR molecular markers, a method that results in PCR amplification of DNA fragments located between microsatellite sequences.

2.3. Plant Genomic DNA Extraction by Modified CTAB Method

The biological material consisted of young leaves. For each population, a bulk sample was obtained from 30 different trees, and the DNA extraction was performed based on the modified CTAB method [60].
The DNA samples were labeled T1, T2, T3, and T4. Their concentration was determined spectrophotometrically with Nanodrop 8000 (Thermo Fisher Scientific, Waltham, MA, USA) and diluted at an equal 50 ng/µL concentration.

2.4. Amplification of Plant Genomic DNA Samples with ISSR Primers

Ten ISSR primers recommended in the literature were tested (Table 1). The amplification mixture contained DNA—1 µL, Go Taq Green Master Mix 2x, (Promega, Madison, WI, USA)—12.5 µL, primer 20 µM–1 µL, MgCl2 10 µM—1 µL and sterile distilled water up to 25 µL.
For amplification, an Eppendorf Mastercycler Pro S PCR was used, following the program: Denaturing 94 °C, 3 min, 45 cycles: Denaturing 94 °C for 30 s, primer annealing 54 °C for 45 s, DNA synthesis 72 °C for 2 min, and a final DNA synthesis of 5 min at 72 °C.
After amplification, the samples were stored at −20 °C and subsequently analyzed by 2% agarose gel electrophoresis in TAE (Tris-acetate-EDTA) buffer, using CloneSizer 100 bp DNA Ladder, Norgen, as the molecular weight marker. The amplified fragments were visualized in UV light in ethidium bromide presence.

2.5. Image Processing

VisionWorks®LS software v7.0 (UVP, Upland, CA, USA) was used to process the experimental data. By utilizing the analysis function, the software automatically determines the sizes of the identified bands by comparing their patterns with those of the molecular weight marker. The fragments observed for each population were examined and recorded based on their size order (locus1-...n). Subsequently, they were assigned a score of 1 if the band was present at a particular locus and 0 if it was absent. These data was then introduced into a binary matrix and subjected to statistical analysis.

2.6. Dendrometric Measurements

The dendrometric measurements made for each tree consist of the following:
(1) Measurement of two diameters at breast height (1.3 m) (DBH1, DBH2) at 1800 intervals, using aluminum tree caliper (Haglöf Sweden AB, Långsele, Sweden) with a precision of 1 mm;
(2) Measurement of tree height (H) using a SUUNTO hypsometer with an accuracy of +/−0.5 m (2.5%) or a Nedo MessFix 8 m Telescopic Pole for trees under 8 m height;
(3) Measurement of trunk height (ht) using a Nedo MessFix 8 m Telescopic Pole with a precision of 1 cm;
(4) Measurement of two crown diameters (P1, P2) at 180° intervals for all trees using a tape with a precision of 1 cm.
The average diameter at breast height (DBHm), the crown height (hc) (the difference between tree height and trunk height), and the average crown diameter (Pm) were calculated.
Naked-eye observations were made on tree morphological characters, such as twigs, buds, leaves, and the blooming sequence of the studied Tilia spp.

2.7. Statistical Analysis

All analyses were performed using R Statistical Software (v4.3.3; R Core Team 2023) [61]. Non-parametric Kruskal–Wallis tests were employed to assess significant differences in mean values of dendrometric indices (medium diameter at breast height (DBHm), total tree height (Htot), trunk height (ht), crown height (hc), and medium crown spread (Pm)) across populations (T1, T2, T3, and T4). Dunn’s post-hoc test was used for pairwise comparisons in cases where the Kruskal–Wallis test indicated significant overall differences. Linear relationships between dendrometric indices were evaluated using Pearson’s correlation coefficients. Simple linear regression models were further developed to quantify these relationships. To explore the underlying structure within the dendro-metric data of 120 trees, principal component analysis (PCA) was conducted based on a correlation matrix. This technique reduces data dimensionality by identifying a smaller set of uncorrelated principal components that capture the majority of the variance in the original data. Subsequently, cluster analysis was performed on the derived principal components to group trees with similar dendrometric characteristics.
A binary presence/absence matrix reflecting polymorphic band patterns was generated for the four populations. This matrix was then employed to construct a dendrogram depicting genetic similarity among populations.

3. Results

3.1. Results of the Genetic Variability in the Tilia Genus Using ISSR Primers

Analysis of variance regarding the presence or absence of bands generated by the ten ISSR primers used to assess the genetic diversity of the studied populations determined a high degree of genetic polymorphism (p < 0.001). This indicates the efficiency of using ISSR primers to assess genetic polymorphism in the four populations and that this technique can be applied to genetic diversity and conservation studies of these species (Table 2).
The ISSR primers used resulted in polymorphic bands, with a polymorphism rate of 61.54% for A17 and 93.33% for A13 (Table 3 and Figure 2), which indicates significant genetic diversity among the Tilia spp. samples analyzed.
The ISSR primers A7, A12, A13, A21, UBC873, and UBC886 generated the highest levels of polymorphism (75% and 93.33%) (Table 2 and Figure 2).
The primer UBC873 generated 20 polymorphic bands out of 22, indicating a polymorphism rate of 90.91%.
A17 and UBC864 showed a polymorphism percentage of 61.54% and 71.43%, respectively (Table 3 and Figure 2).
Regarding the polymorphism value (PIC), the highest value was registered at the primer A17 (0.484), followed by A13 (0.438), UBC884 (0.433), UBC873 (0.425), UBC864 (0.425), UBC886 (0.422), A21 (0.420), A7 (0.417), UBC840 (0.403) and A12 (0.398) with the lowest value (Table 3).
The Discrimination Index (PI) measures the efficiency of a particular primer in detecting polymorphism. The highest value was recorded at UBC873 of 8.500 and the lowest at UBC840 of 3.625 (Table 3).
Therefore, UBC873 was the most efficient primer in detecting species variability between Tilia spp. studied populations. Also, UBC873 recorded the highest amplified fragment size amplitude, 150–1430 bp. In contrast, the lowest range of amplified fragments was recorded for UBC864 (200–590) bp and UBC840 (125–550) bp.
The analysis of all gels revealed 165 alleles (10 primers) with an average of 16.5 alleles/primer, the distribution of which was statistically analyzed (Table 4).
The ten primers generated 165 bands, of which 134 were polymorphic, resulting in an average polymorphism rate of 81.20%, associated with a marker index of 5.569 (Table 4).
Depending on the presence (1) or absence (0) of polymorphic bands in the four populations, a matrix of genetic similarity between them was generated and used to construct the dendrogram (Figure 3) according to the cluster averaging method.
Cluster analyses showed that the studied populations were grouped in two clusters with a genetic similarity of 45%.
The first cluster consists of populations (T1) and (T2), with 78.79% common alleles among the studied primers.
The second cluster consists of populations (T3) and (T4), with a genetic diversity of 36.36%. Populations (T3) and (T4) showed a high genetic diversity of 52.42–56.66% compared to the two populations (T1) and (T2) from the first cluster (Figure 3).
Therefore, it was observed that (T1) and (T2) were in the same cluster, with a similarity percentage of 78.79%. Phenotypic analysis of these populations confirmed the genetic results, framing the two populations in the Tilia cordata species because they had common traits such as hairs in the vein axils on the lower surface of their leaves, glabrous buds, and glabrous and brown-reddish twigs.
Population (T3), which differs genetically from the others, having a similar degree, has been classified as Tilia platyphyllos because tree leaves are hairy on the front, and on the reverse, they have tufts of hair, and very prominent veins, glabrous buds, and glabrous and brown-reddish twigs.
According to the phenotypic characteristics, the (T4) population has been classified as a T. argentea species because it has pubescent grey twigs and pubescent buds, and the trees’ leaves are silvery on the reverse, without tufts of hair in the axils of the veins.
The morphological characters of the analyzed trees are in accordance with the literary description of Tilia spp. [62].
The observed sequence of blooming in the period May-June-beginning of July was T. platyphyllos (T3), T. cordata I (T1), T. cordata II (T2), and then T. argentea (T4), similar with previously recorded sequence by other researchers [63,64].

3.1.1. Specific Alleles Analysis of Tilia spp. Populations Using ISSR Primers

Analyses using the ten primers identified unique DNA fragments present only in specific populations (Table 5). These bands can be used as DNA markers for the identification of the respective populations [65] or in the compilation of genetic maps [65,66]. Of the four populations in which specific alleles were identified, population T. platyphyllos (T3) had the most significant number of specific DNA fragments (17). In contrast, the T. cordata I (T1) population had only six specific bands (Table 5).
The number of specific DNA fragments generated by each primer for each species was analyzed to select the best primers for identifying different Tilia species.
For the T. cordata I (T1) population, primers UBC864 and A12 generated the most specific bands, each contributing with two bands.
For the T. cordata II (T2) population, primers UBC840 and A7 each generated four specific DNA fragments.
For the population T. platyphyllos (T3), the A13 primer generated four specific DNA fragments.
For the population T. argentea (T4), primer A7 generated three specific DNA fragments.
Thus, primers UBC864, A12, UBC840, and A7 are more efficient in identifying Tilia cordata species; primer A13 can be used to identify T. platyphyllos species, and primer A7 can be used to identify T. argentea species. In contrast, primer A17 did not generate specific DNA fragments from the analyses of the studied populations.
The three Tilia species analyzed showed a high level of diversity among their populations, which is in accordance with their taxonomy. Thus, even if all four populations belong to the genus Tilia, their grouping into two distinct clusters indicates that we have populations belonging to different species groups within the same genus Tilia.
Polymorphism within the T. cordata species at the two sites, particularly of specific DNA fragments generated by primers UBC864 and A12 (T1) and UBC840 and A7 (T2), highlights the importance of using molecular markers to maintain the genetic purity of the Tilia species.

3.1.2. Optimization of ISSR Primers Analysis in Monitoring Populations of Tilia spp.

Statistical correlations were observed between most of the used primers (Figure 4). These results showed good efficiency in identifying polymorphism and establishing genetic diversity between different populations.
To optimize a 50% more economically efficient method for analyzing larger populations, we investigated the correlations between ISSR markers in the context of the genetic structure of studied populations. In this respect, only the primers that covered all significant negative correlations were selected: UBC840, UBC864, UBC873, UBC886, and A17.
In contrast, we selected positively correlated markers such as A7, A12, A13, A21, and UBC884 (primers that determine the same banding patterns) to cover all areas of positive correlations.
Primer selection is essential in the research of Tilia spp. variability to achieve economically efficient results.
The use of primers group UBC840, UBC864, UBC873, UBC886, and A17 resulted in significant variation in genetic polymorphism among T. cordata, T. platyphyllos, and T. argentea species (p < 0.001) (Table 6). These results are similar to the initial ten primers (Table 2). Thus, this method reduced the number of ISSR primers from 10 to 5.
In contrast, the use of primers A7, A12, A13, A21, and UBC884 that showed positive correlations did not result in significant variation in genetic polymorphism in the Tilia populations analyzed (p > 0.085) (Table 7). This suggests that this group of primers was not sufficiently effective in identifying polymorphism in the analyzed Tilia populations due to their correlative similarities (Figure 4).
Selecting suitable primers is essential to ensure adequate genetic diversity coverage and polymorphism coverage.
The selection of primers with strong negative correlations, such as UBC840, UBC864, UBC873, UBC886, and A17, was advantageous for obtaining significant results in genetic polymorphism analysis. Also, depending on the species analyzed and the specific morphological characters, the group of primers can be adapted to obtain more accurate and representative results.
Thus, (i) primers UBC864, A12, UBC840, and A7 might be more suitable to identify the species T. cordata; (ii) primer A13 might be more suitable to identify the species T. platyphyllos and (iii) primer A7 to identify the species T. argentea.
This method allows for more efficient genetic diversity analysis of Tilia populations. It uses groups of primers selected according to the species analyzed and their ability to generate a high degree of polymorphism.
Tillia spp. tree diversity can be assessed efficiently using the ISSR primers as they reveal many alleles, which is in accordance with the literature data.
At the same time, the genetic degree of similarity and the grouping of the clusters were correlated with the morphological characteristics of the twigs, buds, and leaves, showing that this category of markers can be helpful in taxonomy studies.
Advanced statistical evaluations have allowed us to efficiently restrict the number of markers used to assess variability in Tillia spp. trees, thus reducing the cost of analysis.

3.2. Results Regarding Statistical Analyses Made on Dendrometric Indices of Studied Tilia Species

3.2.1. Descriptive Statistics of Dendrometric Measurements

According to dendrometric measurements and statistic descriptive analyses, the four populations of Tilia spp. have the following phenotypic characteristics:
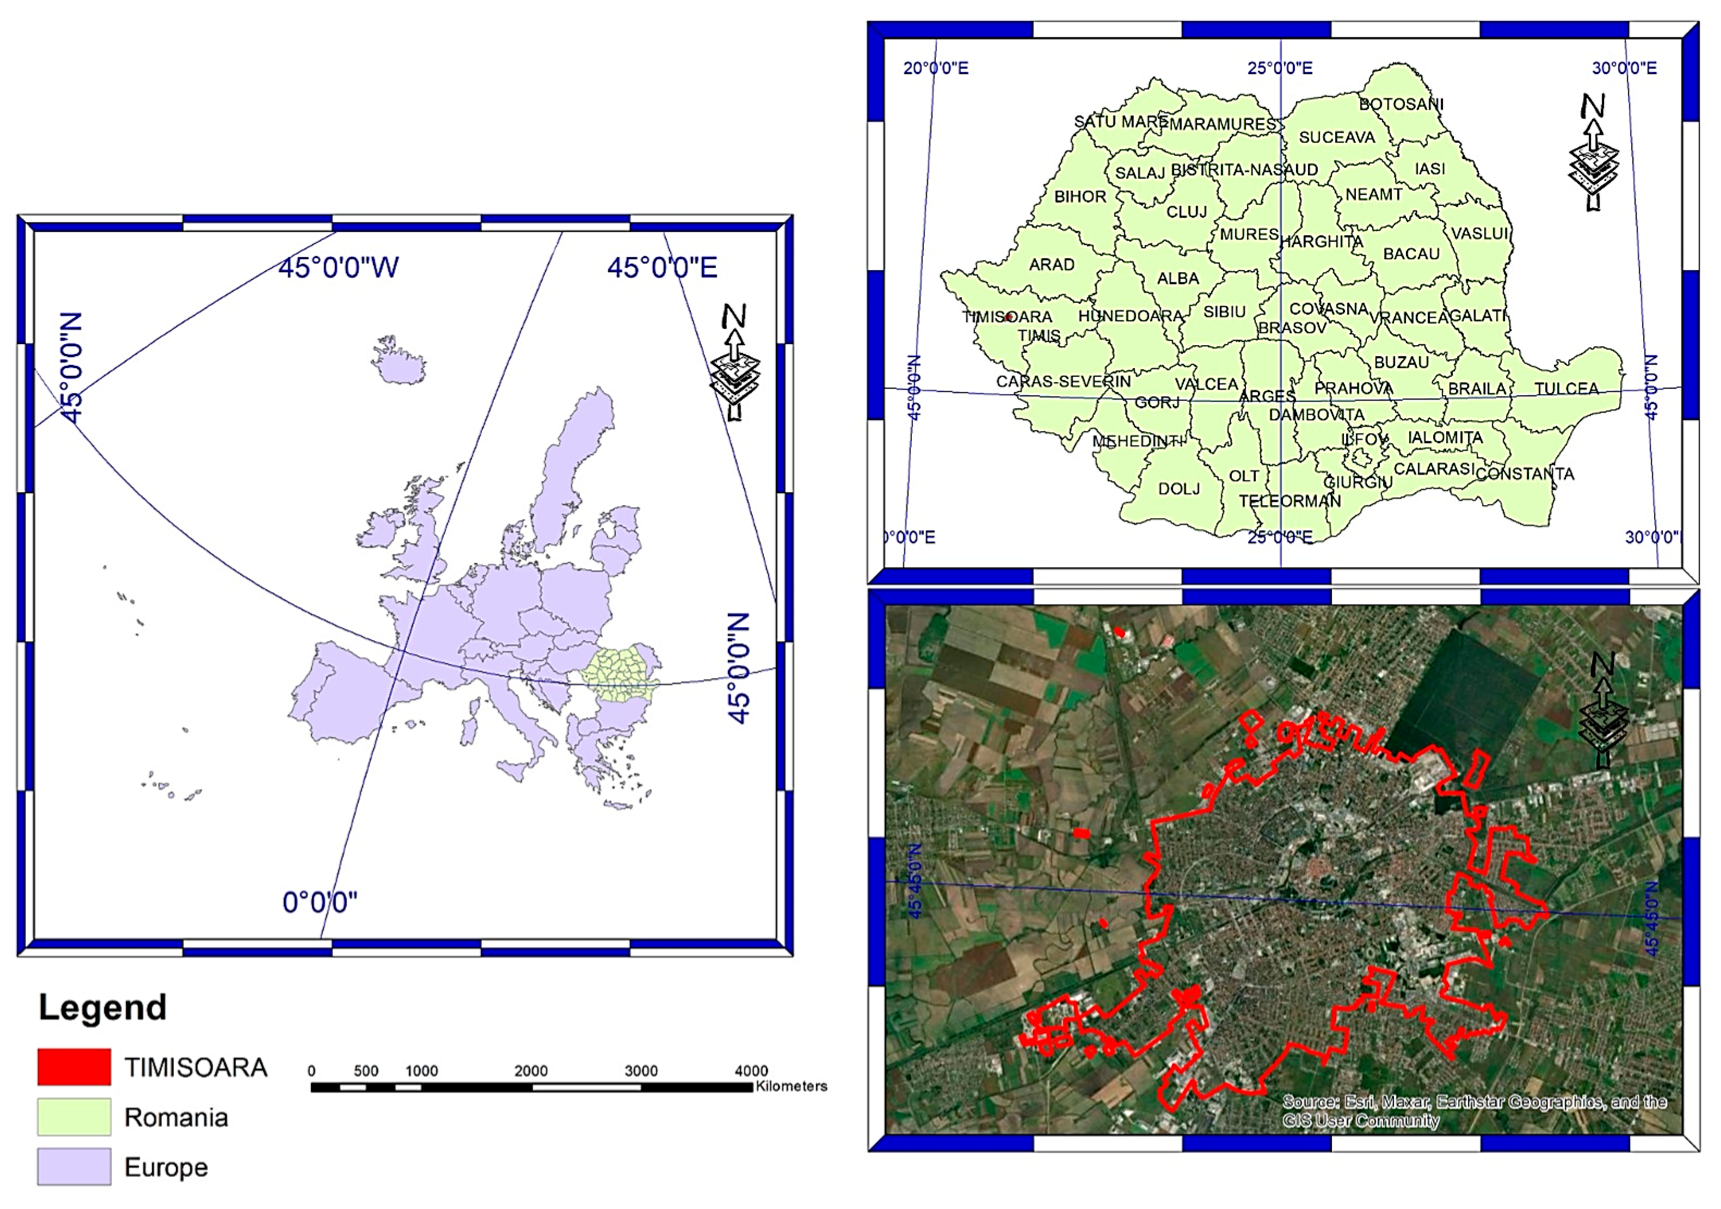
Population T1 is formed of 30 T. cordata tree individuals planted in the Albinelor Street alignment; the trees have the following:
-
Average medium trunk diameter at breast height (DBHmT1) = 11.16 cm; with a standard deviation of 5.38; minimum (DBHmT1) = 5.25 cm and maximum (DBHmT1) = 36.35 cm;
-
Mean of total tree heights (HtotT1) = 7.11 m, with a standard deviation of 1.17; minimum (HtotT1) = 4.8 m and maximum (HtotT1) = 10.1 m;
-
Mean of trunk height (htT1) = 5.37 m, with a standard deviation of 1.06; minimum (htT1) = 3.2 m and maximum (htT1) = 8.2 m;
-
Mean of crown height (hcT1) = 1.74 m, with a standard deviation of 0.18; minimum (hcT1) = 1.4 m and maximum (hcT1) = 2.2 m;
-
Average medium crown spread (PmT1) = 3.31 m; with a standard deviation of 1.21; minimum (PmT1) = 1.7 m and maximum (PmT1) = 7.35 m
Population T2 is formed of 30 T. cordata tree individuals planted in I.I de la Brad green spaces; the trees have the following:
-
Average medium trunk diameter at breast height (DBHmT2) = 17.4 cm; with a standard deviation of 7.11; minimum (DBHmT2) = 6.1 cm and maximum (DBHmT2) = 27 cm;
-
Mean of total tree heights (HtotT2) = 8.72 m, with a standard deviation of 1.32; minimum (HtotT2) = 6 m and maximum (HtotT2) = 10.04 m;
-
Mean of trunk height (htT2) = 6.83 m, with a standard deviation of 1.27; minimum (htT2) = 4.2 m and maximum (htT2) = 8.2 m;
-
Mean of crown height (hcT2) = 1.88 m, with a standard deviation of 0.17; minimum (hcT2) = 1.5 m and maximum (hcT2) = 2.2 m;
-
Average medium crown spread (PmT2) = 5.62 m; with a standard deviation of 2.4; minimum (PmT2) = 2 m and maximum (PmT2) = 8.1 m.
Population T3 is formed of 30 T. platyphyllos tree individuals planted in the Lorena Street alignment; the trees have the following:
-
Average medium trunk diameter at breast height (DBHmT3) = 20.06 cm; with a standard deviation of 10.82; minimum (DBHmT3) = 4.25 cm and maximum (DBHmT3) = 43.15 cm;
-
Mean of total tree heights (HtotT3) = 10.93 m, with a standard deviation of 3.21; minimum (HtotT3) = 4.17 m and maximum (HtotT3) = 18 m;
-
Mean of trunk height (htT3) = 9.05 m, with a standard deviation of 3.05; minimum (htT3) = 3 m and maximum (htT3) = 16 m;
-
Mean of crown height (hcT3) = 1.88 m, with a standard deviation of 0.25; minimum (hcT3) = 1.3 m and maximum (hcT3) = 2.4 m;
-
Average medium crown spread (PmT2) = 6.40 m; with a standard deviation of 2.36; minimum (PmT3) = 1.15 m and maximum (PmT3) = 8.8 m
Population T4 is formed of 30 T. argentea tree individuals planted in Torontalului green areas; the trees have the following:
-
Average medium trunk diameter at breast height (DBHmT4) = 13.85 cm; with a standard deviation of 7.25; minimum (DBHmT4) = 4.9 cm and maximum (DBHmT4) = 26.05 cm;
-
The mean of total tree heights (HtotT4) = 7.7 m, with a standard deviation of 1.53; minimum (HtotT4) = 5 m and maximum (HtotT4) = 10.6 m;
-
The mean of trunk height (htT4) = 5.88 m, with a standard deviation of 1.36; minimum (htT4) = 3.2 m and maximum (htT4) = 8.4 m;
-
The mean of crown height (hcT4) = 1.81 m, with a standard deviation of 0.3; minimum (hcT4) = 1.3 m and maximum (hcT4) = 2.4 m;
-
Average medium crown spread (PmT4) = 3.68 m; with a standard deviation of 1.72; minimum (PmT4) = 1.25 m and maximum (PmT4) = 6.65 m.

3.2.2. Comparations between Dendrometric Indices

Medium trunk diameter at breast height (DBHm)
There are significant differences (p < 0.05) between medium trunk diameter at breast height (DBHm) of
-
T. cordata I (DBHmT1) = 11.16 cm and T. cordata II (DBHmT2) = 17.4 cm (p = 0.0218);
-
T. cordata I (DBHmT1) = 11.16 cm and T. platyphyllos (DBHmT3) = 20.06 cm (p = 0.0039).
In contrast, there are no significant differences (p > 0.05) between medium trunk diameter at breast height DBHm of
-
T. cordata I (DBHm T1) = 11.16 cm and T. argentea (DBHmT4) = 13.85 cm;
-
T. cordata II (DBHmT2) = 17.4 cm and T. platyphyllos (DBHmT3) = 20.06 cm;
-
T. cordata II (DBHmT2) = 17.4 cm and T. argentea (DBHmT4) = 13.85 cm (Figure 5A).
The higher value of average medium trunk diameter at breast height was recorded at population T. platyphyllos (DBHmT3) = 20.06 cm, and the lowest value was recorded at population T. cordata I (DBHmT1) = 11.16 cm.
Analyzing the DBHm values of all four populations, we observed that population T. platyphyllos (T3) recorded both the minimum (DBHmT3) = 4.25 cm and the maximum (DBHmT3) = 43.15 cm.
Total tree height (Htot)
There are significant differences (p < 0.05) between total tree high (Htot) of T. cordata I (HtotT1) = 7.11 m and T. cordata II (HtotT2) = 8.72 m (p = 0.0059); T. cordata I (HtotT1) = 7.11 m and T. platyphyllos (HtotT3) = 10.93 m (p < 0.0001); T. platyphyllos (HtotT3) = 10.93 m and T. argentea (HtotT4) = 7.7 m (p < 0.0001).
In contrast, there are no significant differences (p > 0.05) between the total tree height (Htot) of T. cordata II (HtotT2) = 8.72 m and T. platyphyllos (HtotT3) = 10.93 m; T. cordata II (HtotT2) = 8.72 m and T. argentea (HtotT4) = 7.7 m; T. cordata I (HtotT1) = 7.11 m and T. argentea (HtotT4) = 7.7 m; (Figure 5B).
The higher value of the mean total tree height (Htot) was recorded at population T. platyphyllos (HtotT3) = 10.93 m, and the lowest value was recorded at population T. cordata I (HtotT1) = 7.11 m.
Analyzing the Htot values of all four populations, we observed that population T. platyphyllos (T3) recorded both a minimum (HtotT3) of 4.17 m and a maximum (HtotT3) of 18 m.
Trunk height (ht)
There are significant differences (p < 0.05) between trunk height (ht) of T. cordata I (htT1) = 5.37 m and T. cordata II (htT2) = 6.83 m (p = 0.0081); T. cordata I (htT1) = 5.37 m and T. platyphyllos (htT3) = 9.05 m (p < 0.0001); T. platyphyllos (htT3) = 9.05 m and T. argentea (ht T4) (p < 0.0001). In contrast, there are no significant differences (p > 0.05) between trunk height (ht) of: T. cordata I (htT1) = 5.37 m and T. argentea (htT4) = 5.88 m; T. cordata II (htT2) = 6.83 m and T. platyphyllos (htT3) = 9.05 m; T. cordata (htT2) = 6.83 m and T. argentea (htT4) = 5.88 m (Figure 5C).
The higher value of the mean of trunk high (ht) was recorded at population T. Platyphyllos (htT3) = 10.93 m, and the lowest value was recorded at population T. cordata I (htT1) = 5.37 m;
Analyzing the (ht) values of all four populations, we observed that population T. platyphyllos (T3) recorded both the minimum (ht) values (htT3) = 3 m and the maximum (htT3) = 16 m.
Crown height (hc)
There are significant differences (p < 0.05) between crown height (hc) of T. cordata I (hcT1) = 1.74 m and T. cordata II (hcT2) = 1.88 m (p = 0.009); T. cordata I (hcT1) = 1.74 m and T. platyphyllos (hcT3) = 1.88 m (p = 0.028). In contrast, there are no significant differences (p > 0.05) between crown height (hc) of T. cordata I (hcT1) = 1.74 m and T. argentea (hcT4) = 1.81 m; T. cordata II (hcT2) = 1.88 m and T. argentea (hc T4); T. platyphyllos (hcT3) = 1.88 m and T. argentea (hcT4) = 1.81 m (Figure 5D).
The higher value of the mean of crown high (hc) was recorded at population T. platyphyllos (hcT3) = 1.88 m and T. cordata II (hcT2) = 1.88 m; the lowest value was recorded at population T. cordata I (hcT1) = 1.74 m.
Analyzing the (hc) values of all four populations, we observed that the minimum values (hc) = 1.3 m and the maximum (hc) = 2.4 m were recorded at both populations, T. platyphyllos and T. argentea.
Medium crown spread (Pm)
There are significant differences (p < 0.05) between medium crown spread (Pm) of: T. cordata I (PmT1) = 3.31 m and T. cordata II (PmT2) = 5.62 m (p = 0.0029); T. cordata I (PmT1) = 3.31 m and T. platyphyllos (PmT3) = 6.40 m (p < 0.0001); T. cordata II (PmT2) = 5.62 m and T. argentea (PmT4) = 3.68 m (p = 0.0145); T. platyphyllos (PmT3) = 6.40 m and T. argentea (PmT4) = 3.68 m (p < 0.0001). In contrast, there are no significant differences (p > 0.05) between medium crown spread (Pm) of T. cordata I (PmT1) = 3.31 m and T. platyphyllos (PmT3) = 6.40 m; T. platyphyllos (PmT3) = 6.40 m and T. argentea (PmT4) = 3.68 m (Figure 5E).
The higher value of average medium crown spread (Pm) was recorded at population T. platyphyllos (PmT3) = 6.40 m, and the lowest value was recorded at population T. cordata I (PmT1) = 3.31 m.
Analyzing the medium crown spread (Pm) values between all four populations, we observed that population T. platyphyllos (T3) recorded both the minimum (PmT3) = 1.15 m and the maximum (PmT3) = 8.8 m.

3.2.3. Correlation and Linear Regressions

Pearson correlation coefficients (Figure 6) and simple linear regressions (Figure 7) computed to assess the linear relationships between dendrometric measurements of trees showed that there are:
-
Statistically significant high positive correlations between medium diameter of the trunk at breast height (DBHm) and medium trunk height (ht) for: T1 (r(28) = 0.76, p < 0.0001, DBHmT1 = 0.15htT1 + 3.7); T3 (r (28) = 0.87, p < 0.0001, DBHmT3 = 4.1htT3 + 0.25); T4 (r (28) = 0.89, p < 0.0001, DBHmT4 = 3.6htT4 + 0.17); and statistically very significant high positive correlations between DBHm and ht for T2 (r (28) = 0.93, p < 0.0001, DBHmT2 = 3.9htT2 + 0.17).
This means that the larger the medium diameter of the trunk at breast height (DBHm1–DBHm120) is, the greater the medium trunk high (ht1–ht120) is for all 120 analyzed trees of the four populations of Tilia spp. analyzed.
-
Statistically significant very high positive correlations between medium trunk height (ht) and medium total tree height (Htot) for all four populations: T1 (r (28) = 0.99, p < 0.0001, HtotT1 = 1.2 + 1.1htT1); T2 (r (28) = 0.99, p < 0.0001, HtotT2 =1.7 + htT2); T3 (r (28) = 1 p < 0.0001, HtotT3 = 1.4 + htT3); T4 (r (28) = 0.99, p < 0.0001, HtotT4 = 1.2 + 1.1htT4).
This means that the higher the medium trunk height (ht1–ht120) is, the higher the medium total tree height (Htot1–Htot120) is for all 120 analyzed trees of the four populations of Tilia spp. analyzed.
-
Statistically significant high positive correlations between the medium diameter of the trunk at breast height (DBHm) and medium crown spread (Pm) for T1 (r (28) = 0.85, p < 0.0001, PmT1 = 1.2 + 0.19 DBHmT1) and for T3 (r (28) = 0.82, p < 0.0001, PmT3 = 2.8 + 0.18DBHmT3) and—statistically very significant high positive correlations between the medium diameter of the trunk at breast height (DBHm) and medium crown spread (Pm) for T2 (r (28) = 0.93, p < 0.0001, PmT2 = 01.2 + 0.31 DBHmT2) and for T4 (r (28) = 0.95, p < 0.0001, PmT1 = 0.56 + 0.23 DBHmT4).
This means that the larger the medium diameter of the trunk at breast height (DBHm) is, the larger the medium crown spread (Pm) is for all 120 analyzed trees of the four populations of Tilia spp. analyzed.
Figure 7 show the data, the regression lines and regression equations, the linear correlation coefficients, the level of statistical significance, and the density curves for the two data distributions.

3.2.4. Principal Component Analysis and Cluster Analysis

The inertia of the first principal components shows if there are strong relationships between variables and suggests the number of components that should be studied. The first two principal components of analysis express 92.75% of the total dataset inertia; that means that 92.75% of the individual’s cloud total variability is explained by the plane spanned by the first two principal components (Figure 8B).
This percentage is very high; thus, the first plane represents data variability very well. This value is greater than the reference value (50.39%); the variability explained by this plane is thus highly significant (the reference value is the 0.95-quantile of the inertia percentages distribution obtained by simulating 6543 data tables of equivalent size based on a normal distribution).
The first principal component factor is significant: it expresses itself in 78.42% of the data variability (Figure 8A). Note that in such a case, the variability related to the other components might be meaningless despite a high percentage. This axis presents an amount of inertia more significant than those obtained by the 0.95-quantile of random distributions (78.42% against 27.78%) (Figure 8B). This observation suggests that this axis carries great information. The most important contribution for this component comes from the following variables: Htot, ht, DBHm, and Pm (which are all highly positively correlated) (Figure 8C). The second principal component expresses itself 14.33% of the data variability (Figure 8A). The most important contribution of this component comes from the variable hc (Figure 8D). Cluster analysis, the dendrogram for all 120 studied trees is presented in Figure 9. This highlights the clustering of trees according to the values of measured dendrometric parameters of each individual, regardless of the species they belong to.

4. Discussion and Recommendation

Municipalities must adopt new strategies for planning urban green infrastructures, using trees with high ecological plasticity and adaptability to climate change. In this respect, studying urban trees is a priority. Exploring the genetic landscape of Tilia spp. with molecular and statistical tools proved that primer selection is essential in the research of Tilia spp. variability for economically obtaining results. Thus, primers UBC864, A12, UBC840, and A7 are more efficient in identifying T. cordata species; primer A13 can be used to identify T. platyphyllos species, and primer A7 to identify T. argentea species. In contrast, primer A17 did not generate specific DNA fragments from the analyses of the studied populations.
The three Tilia species analyzed showed a high level of diversity among their populations, which is in accordance with their taxonomy. Thus, even if all four populations belong to the genus Tilia, their grouping into two distinct clusters indicates that there are populations belonging to different species groups within the same genus Tilia. Analysis of genetic profiles allowed us to distinguish three genetic groups correlated to T. cordata, T. platyphyllos, and T. argentea.
Polymorphism within T. cordata species at the two sites, particularly of specific DNA fragments generated by primers UBC864 and A12 (T1) and UBC840 and A7 (T2), highlights the importance of using molecular markers in maintaining the genetic purity of the Tilia species.
Phuekvilai and Wolf (2013) [46] investigated genetic diversity within the genus Tilia using 15 SSR markers (Simple Sequence Repeat). Their results revealed that Tc918 amplifies in T. platyphyllos but not in T. cordata [47]. This locus could be helpful in detecting the two species and their hybrid. The molecular markers were also effectively utilized by Logan et al. (2018) to assess the genetic diversity among a total of 229 T. platyphyllos trees and 376 T. cordata trees. The study identified clones within the populations of both T. platyphyllos and T. cordata, affecting approximately 19% of the trees [49].
In their studies, Zandalinas S.I. et al. (2020) [67] proved that plant growth and reproduction are restricted in harsh environments because they have to consume more energy to resist abiotic stresses. Y. Shen et al. (2022) [19] showed that unsuitable environments determine plants to develop mechanisms to adapt to environmental stresses.
Gauli, A. et al. (2022) [18] used tree ring information of the three different species to understand better the long-term impact of climate change on forest productivity and carbon sequestration. According to their dendroclimatological analysis, precipitation positively impacted tree species growth in Europe, but that trend declined over the years, indicating that drier summers could have a negative impact on tree growth. Vacek et al. (2023) [14] concluded that the most significant consequences of climate change include forest disturbances such as (wildfire, wind storms, drought, flood, bark beetle, root rot) and migration of tree species.
In urban environments, it is fundamental to know how all the tree cycles—planting, growth, pruning, removal, and replacement—are managed through human intervention [16]. To avoid tree mortality and to improve the condition of urban trees, human activities such as irrigation, treatments against diseases and pests, and application of soil amendments should be done. In addition, planting species adapted to abiotic stress is economically efficient.
Our phenotypic analysis was made on twigs, buds, leaves, and the duration of the flowering period of the studied Tilia spp. tree individuals confirmed the genetic results, indicating that (T1) and (T2) are T. cordata, (T3) are T. platyphyllos, and (T4) are T. argentea. Thanks to their phenotypic features, the 120 studied tree individuals of the Tilia genus embellish Timișoara’s environment. The high ornamental value of Tilia spp. in urban landscapes results from the long period of blooming (May–June–beginning of July) thanks to the sequence of the blooming of the three species T. platyphyllos (T3), T. cordata (T1), and (T2) and then T. argentea (T4).
We observed that both the minimum and the maximum values of medium trunk diameter at breast height DBHm, total tree heights Htot, and the medium crown spreads (Pm) values of all four populations were recorded at population T. platyphyllos (T3).
It was revealed that the higher value of average medium trunk diameter at breast height, the mean total tree height (Htot), and average medium crown spread (Pm) was recorded at population T. platyphyllos, and the lowest values were recorded at population T. cordata.
Linear relationships between dendrometric measurements of trees showed that (i) the larger medium diameter of the trunk at breast height (DBHm1–DBHm120) is, the greater the medium trunk height (ht1–ht120) is; (ii) the medium trunk height (ht1–ht120) is, the higher the medium total tree height (Htot1–Htot120) is; and (iii) the larger medium diameter of the trunk at breast height (DBHm) is, the larger the medium crown spread (Pm) is for all 120 analyzed trees.
The results provided by dendrometric measurements of the studied Tilia spp. tree individuals represent a foundation for further investigations on urban tree status monitoring [68]. The data obtained allow us to assess tree growth and biomass, which are relevant for estimating the ecosystem services provided by trees, such as shade, rainfall interception, pollution removal, carbon storage and sequestration, and oxygen release [44,45,46].
This study acknowledges limitations that highlight areas for future research improvements. Environmental factors such as soil type, microclimate, and urban pollution were not comprehensively controlled, potentially introducing variability. Dendrometric measurements, although precise, are subject to human error and seasonal variations, affecting accuracy. Additionally, relying on phenotypic observations for species identification introduces a degree of subjectivity, as morphological traits can be influenced by environmental conditions [69,70].
Despite these limitations, the study provides valuable insights into the adaptability and genetic diversity of Tilia species. This study introduces innovative methods for understanding and managing the genetic diversity of Tilia species in urban environments. By using ISSR molecular markers, the research identifies significant genetic variability among Tilia populations. The targeted selection of specific ISSR primers enhances the accuracy of genetic identification and reduces costs.
This study introduces innovative methods for managing the genetic diversity of Tilia species in urban environments. Combining molecular markers with phenotypic analyses, we can obtain a comprehensive view of the species’ adaptability to climate change. This approach aids in planning sustainable urban green infrastructures and supports the selective planting of urban spaces with Tilia individuals that have greater adaptability, thereby contributing to more resilient urban ecosystems.

5. Conclusions

The efficiency of using ISSR primers to assess genetic polymorphism in the four populations and the possibility of applying this technique to genetic diversity and conservation studies of Tilia species were revealed.
Cluster analyses showed that the studied populations were grouped in two clusters with a genetic similarity of 45%. Populations (T1) T. cordata I and (T2) T. cordata II make up the first cluster with a background of 78.79% common alleles among the studied primers. The populations (T3) T. platyphyllos and (T4) T. argentea formed the second cluster and showed a high genetic diversity of 52.42–56.66% compared to the two populations T. cordata I and (T2) T. cordata II, forming the first cluster.
T. platyphyllos was distinguished by the most specific alleles, compared to T. cordata, which had the fewest particular alleles.
Selecting suitable primers is essential to ensure adequate coverage of genetic diversity and genetic polymorphism. The selection of primers with strong negative correlations, such as UBC840, UBC864, UBC873, UBC886, and A17, was advantageous for obtaining significant results in genetic polymorphism analysis. Also, depending on the species analyzed and the specific morphological characters, adapting the group of primers is possible to obtain more accurate and representative results.
Thus, (i) primers UBC864, A12, UBC840, and A7 might be more suitable to identify the species Tilia cordata; (ii) primer A13 might be more suitable to identify the species Tilia platyphyllos and (iii) primer A7 to identify the species Tilia argentea.
In this way, the genetic diversity analysis of Tilia populations can be carried out more efficiently, using groups of primers selected according to the species analyzed and their ability to generate a high degree of polymorphism.
Tilia sp. tree diversity can be assessed efficiently using the ISSR primers as they reveal many alleles, which is in accordance with the literature data.
At the same time, the genetic degree of similarity and the grouping of the clusters were correlated with the morphological characteristics of twigs, buds, and leaves, showing that this category of markers can be helpful in taxonomy studies.
Advanced statistical evaluations have allowed us to efficiently restrict the number of markers used to assess variability in Tillia spp. trees, thus reducing the cost of analysis.
The first two principal components of analysis express 92.75% of the total dataset inertia; that means that 92.75% of the individual’s cloud total variability is explained by the plane spanned by the first two principal components. This suggests that these axes carry great Information about the data.
Results obtained from dendrometric measurements analyses represent the foundation for further investigations on urban ecology.
This highlights the clustering of trees according to the values of measured dendrometric parameters of each individual, regardless of the species they belong to.

Author Contributions

Conceptualization: A.-M.T.-C., E.O., D.V.L., S.P., I.S.; Methodology: A.-M.T.-C., S.P., D.V.L., I.P., C.P., D.C., A.H., C.A.P., C.B.; Formal analysis: D.V.L., E.O., C.A.P., C.B.; Fund acquisition: D.C., A.H., C.A.P.; Investigation: A.-M.T.-C., S.P., I.S., I.P., C.P., E.O.; Project administration: A.-M.T.-C., E.O., D.V.L.; Writing—original version: A.-M.T.-C., E.O., D.V.L.; All authors have read and agreed to the published version of the manuscript.

Funding

The payment for the article was made from the research funds of the University of Life Sciences “King Mihai I” from Timișoara.

Data Availability Statement

Data are contained within the article.

Acknowledgments

The authors are grateful to the University of Life Sciences, “King Mihai I” from Timișoara, for support with the publication fee.

Conflicts of Interest

The authors declare no conflicts of interest.

References

  1. European Climate Risk Assessment—European Environment Agency. Available online: https://www.eea.europa.eu/publications/european-climate-risk-assessment (accessed on 18 March 2024).
  2. Core Writing Team; Lee, H.; Romero, J. (Eds.) Summary for Policymakers IPCC, 2023: Summary for Policymakers. In Climate Change 2023: Synthesis Report. Contribution of Working Groups I, II and III to the Sixth Assessment Report of the Intergovernmental Panel on Climate Change; IPCC: Geneva, Switzerland, 2023; pp. 1–34. [Google Scholar] [CrossRef]
  3. Kisvarga, S.; Horotán, K.; Wani, M.A.; Orlóci, L. Plant Responses to Global Climate Change and Urbanization: Implications for Sustainable Urban Landscapes. Horticulturae 2023, 9, 1051. [Google Scholar] [CrossRef]
  4. Andrews, H. Europe Warming Almost Twice as Fast as Global Average, Report Says. Available online: https://www.foxweather.com/extreme-weather/europe-warming-twice-as-fast-as-global-average (accessed on 24 May 2024).
  5. European State of the Climate 2023, Compiled by the Copernicus Climate Change Service (C3S) and the World Meteorological Organization (WMO). Available online: https://climate.copernicus.eu/esotc/2023/temperature-and-thermal-stress (accessed on 19 March 2024).
  6. World Health Organization’s European office. Available online: https://climate.copernicus.eu/esotc/2023/extreme-weather-and-human-health (accessed on 14 March 2024).
  7. Li, M. Research on the effects of extreme heat exposure on humanhealth. Theor. Nat. Sci. 2024, 29, 194–199. [Google Scholar] [CrossRef]
  8. Ebi, K.L.; Capon, A.; Berry, P.; Broderick, C.; de Dear, R.; Havenith, G.; Honda, Y.; Kovats, R.S.; Ma, W.; Malik, A.; et al. Hot weather and heat extremes: Health risks. Lancet 2021, 398, 698–708. [Google Scholar] [CrossRef] [PubMed]
  9. Perkins Kirkpatrick, S.E.; Lewis, S.C. Increasing trends in regional heatwaves. Nat. Commun. 2020, 11, 3357. [Google Scholar] [CrossRef]
  10. Sulikowska, A.; Wypych, A. Seasonal Variability of Trends in Regional Hot and Warm Temperature Extremes in Europe. Atmosphere 2021, 12, 612. [Google Scholar] [CrossRef]
  11. Rübbelke, D.; Vögele, S. Impacts of climate change on European critical infrastructures: The case of the power sector. Environ. Sci. Pol. 2011, 14, 53–63. [Google Scholar] [CrossRef]
  12. Huang, J.; Kautz, M.; Trowbridge, A.M.; Hammerbacher, A.; Raffa, K.F.; Adams, H.D.; Goodsman, D.W.; Xu, C.; Meddens, A.J.H.; Kandasamy, D.; et al. Tree defence and bark beetles in a drying world: Carbon partitioning, functioning and modelling. New Phytol. 2020, 225, 26–36. [Google Scholar] [CrossRef] [PubMed]
  13. Hamann, E.; Blevins, C.; Franks, S.J.; Jameel, M.I.; Anderson, J.T. Climate change alters plant–herbivore interactions. New Phytol. 2021, 229, 1894–1910. [Google Scholar] [CrossRef] [PubMed]
  14. Vacek, Z.; Vacek, S.; Cukor, J. European forests under global climate change: Review of tree growth processes, crises and management strategies. J. Environ. Manag. 2023, 332, 117353. Available online: https://www.sciencedirect.com/science/article/abs/pii/S030147972300141X (accessed on 20 March 2024). [CrossRef]
  15. Leppänen, P.-K.; Kinnunen, A.; Hautamäki, R.; Järvi, L.; Havu, M.; Junnila, S.; Tahvonen, O. Impact of changing urban typologies on residential vegetation and its climate-effects—A case study from Helsinki, Finland. Urban For. Urban Green. 2024, 96, 128343. [Google Scholar] [CrossRef]
  16. Hilbert, D.R.; Roman, L.A.; Koeser, A.K.; Vogt, J.; van Doorn, N.S. Urban Tree Mortality: A Literature Review. Arboric. Urban For. 2019, 45, 167–200. [Google Scholar] [CrossRef]
  17. Ju, J.-H.; Yoon, Y.-H.; Shin, S.-H.; Ju, S.-Y.; Yeum, K.-J. Recent Trends in Urban Agriculture to Improve Bioactive Content of Plant Foods. Horticulturae 2022, 8, 767. [Google Scholar] [CrossRef]
  18. Gauli, A.; Neupane, P.R.; Mundhenk, P.; Köhl, M. Effect of Climate Change on the Growth of Tree Species: Dendroclimatological Analysis. Forests 2022, 13, 496. [Google Scholar] [CrossRef]
  19. Shen, Y.; Tu, Z.; Zhang, Y.; Zhong, W.; Xia, H.; Hao, Z.; Zhang, C.; Li, H. Predicting the impact of climate change on the distribution of two relict Liriodendron species by coupling the MaxEnt model and actual physiological indicators in relation to stress tolerance. J. Environ. Manag. 2022, 322, 116024. [Google Scholar] [CrossRef] [PubMed]
  20. Shen, F.; Yang, L.; Zhang, L.; Guo, M.; Huang, H.; Zhou, C. Quantifying the direct effects of long-term dynamic land use intensity on vegetation change and its interacted effects with economic development and climate change in Jiangsu, China. J. Environ. Manag. 2023, 325 Pt B, 116562. [Google Scholar] [CrossRef]
  21. Shen, X.; Liu, B.; Henderson, M.; Wang, L.; Jiang, M.; Lu, X. Vegetation Greening, Extended Growing Seasons, and Temperature Feedbacks in Warming Temperate Grasslands of China. J. Clim. 2022, 35, 5103–5117. [Google Scholar] [CrossRef]
  22. Matskovsky, V.; Venegas-González, A.; Garreaud, R.; Roig, F.A.; Gutiérrez, A.G.; Muñoz, A.A.; Le Quesne, C.; Klock, K.; Canales, C. Tree growth decline as a response to projected climate change in the 21st century in Mediterranean mountain forests of Chile. Glob. Planet. Chang. 2021, 198, 103406. [Google Scholar] [CrossRef]
  23. Vass, H.; Mateoc, T.; Adamov, T.; Orboi, D.; Mateoc-Sîrb, N. Effects of Pollution and Climate Change in Timişoara Municipality and Its Periurban Area. 2020. Available online: https://www.cabidigitallibrary.org/doi/full/10.5555/20210051948 (accessed on 22 March 2024).
  24. Székely, G.; Berar, C. The Social Role of Green Spaces in Timișoara. 2021. Available online: https://www.cabidigitallibrary.org/doi/full/10.5555/20220078763 (accessed on 22 March 2024).
  25. Chung, M.Y.; Son, S.; Herrando-Moraira, S.; Tang, C.Q.; Maki, M.; Kim, Y.; López-Pujol, J.; Hamrick, J.L.; Chung, M.G. Incorporating differences between genetic diversity of trees and herbaceous plants in conservation strategies. Conserv. Biol. 2020, 34, 1142–1151. [Google Scholar] [CrossRef] [PubMed]
  26. Șofletea, N.; Curtu, A. Dendrology (in Romanian); ResearchGate: Berlin, Germany, 2007. [Google Scholar]
  27. Sõukand, R.; Quave, C.L.; Pieroni, A.; Pardo-de-Santayana, M.; Tardío, J.; Kalle, R.; Łuczaj, Ł.; Svanberg, I.; Kolosova, V.; Aceituno-Mata, L.; et al. Plants used for making recreational tea in Europe: A review based on specific research sites. J. Ethnobiol. Ethnomed. 2013, 9, 58. [Google Scholar] [CrossRef] [PubMed]
  28. Pigott, D. Lime-Trees and Basswoods: A Biological Monograph of the Genus Tilia; Cambridge University Press: Cambridge, UK, 2012. [Google Scholar]
  29. Fulton, D.D.G. Handbook of Evolutionary Dendrology; Dorrance Publishing: Pittsburgh, PA, USA, 2024. [Google Scholar]
  30. Luigi, P.; Emanuela, M.; Antonio, T.; Mariagrazia, A. 2023, Could Climate Change and Urban Growth Make Europeans Regard Urban Trees as an Additional Source of Danger? Available online: https://www.frontiersin.org/articles/10.3389/ffgc.2023.1155016/full (accessed on 22 March 2024).
  31. Renée Cho, 2019, How Climate Change Impacts the Economy. Available online: https://news.climate.columbia.edu/2019/06/20/climate-change-economy-impacts/ (accessed on 14 March 2024).
  32. Latte, N.; Taverniers, P.; de Jaegere, T.; Claessens, H. Dendroecological assessment of climate resilience of the rare and scattered forest tree species Tilia cordata Mill. in northwestern Europe. For. Int. J. For. Res. 2020, 93, 675–684. [Google Scholar] [CrossRef]
  33. Țenche-Constantinescu, A.M.; Borlea, G.F.; Szekely, G.; Hernea, C.; Madoșa, E. Lime Trees in Green Areas of Timisoara. 2015. Available online: https://www.usab-tm.ro/Journal-HFB/romana/2015/Lucrari%20PDF/Lucrari%20PDF%2019(2)/40Tenche%20Alina.pdf (accessed on 18 March 2024).
  34. Țenche-Constantinescu, A.M.; Varan, C.; Borlea, F.; Madoșa, E.; Szekely, G. The Symbolism of the Linden Tree. 2015. Available online: https://www.usab-tm.ro/Journal-HFB/romana/2015/Lucrari%20PDF/Lucrari%20PDF%2019(2)/41Tenche%20Alina%202.pdf (accessed on 18 March 2024).
  35. Ţenche-Constantinescu, A.M.; Chira, D.; Madoşa, E.; Hernea, C.; Ţenche-Constantinescu, R.-V.; Lalescu, D.; Borlea, G.F. Tilia sp.-urban trees for future. Not. Bot. Horti Agrobot. Cluj-Napoca 2015, 43, 259–264. [Google Scholar] [CrossRef]
  36. Molnár, V.É.; Tőzsér, D.; Szabó, S.; Tóthmérész, B.; Simon, E. Use of leaves as bioindicator to assess air pollution based on composite proxy measure (APTI), dust amount and elemental concentration of metals. Plants 2020, 9, 1743. [Google Scholar] [CrossRef] [PubMed]
  37. Nebesnyi, V.B.; Grodzinskaya, A.A.; Gonchar, A.Y.; Konyakin, S.M.; Schur, К.Y. The use of Tilia cordata Mill. as bioindicator for the evaluation of the ecological state of Kyiv urbanized areas (Ukraine). J. Med. Plants Stud. 2016, 4, 277–282. [Google Scholar]
  38. Terekhina, N.V.; Ufimtseva, M.D. Leaves of trees and shrubs as bioindicators of air pollution by particulate matter in Saint Petersburg. Geogr. Environ. Sustain. 2020, 13, 224–232. [Google Scholar] [CrossRef]
  39. Ianovici, N.; Batalu, A.; Hriscu, D.; Datcu, A.D. Phytomonitoring study on intra urban variations of leaves of some evergreen and deciduous trees. Ecol. Indic. 2020, 114, 106313. [Google Scholar] [CrossRef]
  40. Łukowski, A.; Popek, R.; Karolewski, P. Particulate matter on foliage of Betula pendula, Quercus robur, and Tilia cordata: Deposition and ecophysiology. Environ. Sci. Pollut. Res. 2020, 27, 10296–10307. [Google Scholar] [CrossRef] [PubMed]
  41. Mitrović, M.; Blanusa, T.; Pavlović, M.; Pavlović, D.; Kostić, O.; Perović, V.; Jarić, S.; Pavlović, P. Using Fractionation Profile of Potentially Toxic Elements in Soils to Investigate Their Accumulation in Tilia sp. Leaves in Urban Areas with Different Pollution Levels. Sustainability 2021, 13, 9784. [Google Scholar] [CrossRef]
  42. Ali, S.A.; Al-Atbi, H.S.; Moein, F.; Ali, B.M. Antibacterial and antioxidant activity of flavonoid, glycoside and alkaloid extracts of Tilia Cordata. Int. J. Health Sci. 2022, III, 3976–3983. [Google Scholar] [CrossRef]
  43. Negri, G.; de Santi, D.; Tabach, R. Flavonol glycosides found in hydroethanolic extracts from Tilia cordata, a species utilized as anxiolytics. Rev. Bras. Plantas Med. 2013, 15, 217–224. [Google Scholar] [CrossRef]
  44. Farinati, S.; Betto, A.; Palumbo, F.; Scariolo, F.; Vannozzi, A.; Barcaccia, G. The New Green Challenge in Urban Planning: The Right Genetics in the Right Place. Horticulturae 2022, 8, 761. [Google Scholar] [CrossRef]
  45. Andrianjara, I.; Bordenave-Jacquemin, M.; Roy, V.; Cabassa, C.; Federici, P.; Carmignac, D.; Marcangeli, Y.; Rouhan, G.; Renard, M.; Nold, F. Urban tree management: Diversity of Tilia genus in streets and parks of Paris based on morphological and genetic characteristics. Urban For. Urban Green. 2021, 66, 127382. [Google Scholar] [CrossRef]
  46. Phuekvilai, P.; Wolff, K. Characterization of microsatellite loci in Tilia platyphyllos (Malvaceae) and cross-amplification in related species. Appl. Plant Sci. 2013, 1, 1200386. [Google Scholar] [CrossRef]
  47. Logan, S.A.; Phuekvilai, P.; Wolff, K. Ancient woodlands in the limelight: Delineation and genetic structure of ancient woodland species Tilia cordata and Tilia platyphyllos (Tiliaceae) in the UK. Tree Genet. Genomes 2015, 11, 52. [Google Scholar] [CrossRef]
  48. Lobo, A.; Hansen, O.K.; Hansen, J.K.; Erichsen, E.O.; Jacobsen, B.; Kjær, E.D. Local adaptation through genetic differentiation in highly fragmented Tilia cordata populations. Ecol. Evol. 2018, 8, 5968–5976. [Google Scholar] [CrossRef] [PubMed]
  49. Logan, S.A.; Chytrỳ, M.; Wolff, K. Genetic diversity and demographic history of the Siberian lime (Tilia sibirica). Perspect. Plant Ecol. Evol. Syst. 2018, 33, 9–17. [Google Scholar] [CrossRef]
  50. Erichsen, E.O.; Wolff, K.; Hansen, O.K. Genetic and clonal structures of the tree species Tilia cordata mill. in remnants of ancient forests in Denmark. Popul. Ecol. 2019, 61, 243–255. [Google Scholar] [CrossRef]
  51. Danusevičius, D.; Kembrytė, R.; Buchovska, J.; Baliuckas, V.; Kavaliauskas, D. Genetic signature of the natural gene pool of Tilia cordata Mill. in Lithuania: Compound evolutionary and anthropogenic effects. Ecol. Evol. 2021, 11, 6260. [Google Scholar] [CrossRef] [PubMed]
  52. Tóth, E.G.; Szilágyi, K.; Patyi, A.; György, Z. Genetic diversity in a historic lime tree allée of Széchenyi Castle in Nagycenk, Hungary. Genet. Resour. Crop Evol. 2022, 69, 1407–1418. [Google Scholar] [CrossRef]
  53. Timișoara General Urban Plan, 2023. Available online: https://www.primariatm.ro/hcl/2023/457 (accessed on 24 March 2024).
  54. Resident Population by Age Group, by Counties and Municipalities, Cities, Communes. INSSE. Available online: https://insse.ro/cms/sites/default/files/field/publicatii/romania_in_figures_2021.pdf (accessed on 1 December 2021). (In Romanian).
  55. World Health Organization Regional Office for Europe. Urban Green Spaces and Health; World Health Organization Regional Office for Europe: Copenhagen, Denmark, 2016. [Google Scholar]
  56. Mihuț, A.; Nytrai, J.; Mihuț, C.; Copcea, A.D.; Okros, A. Efficient Use Of Agricultural Land In The Current Context Of Climate Change. Res. J. Agric. Sci. 2023, 55, 152. [Google Scholar]
  57. Meteo Romania | Site-ul Administratiei Nationale de Meteorologie. Available online: https://www.meteoromania.ro/ (accessed on 24 May 2024).
  58. Timișoara Climate: Weather Timișoara & Temperature by Month. Available online: https://en.climate-data.org/europe/romania/timis/timisoara-997/#google_vignette (accessed on 11 April 2024).
  59. Varga, L.-A.; Zaman, G.; Emilia, D. Considerations regarding the adaptation of cities to thermal stress, effect of climate change. MATEC Web Conf. 2021, 342, 03017. [Google Scholar] [CrossRef]
  60. Doyle, J.J.; Doyle, J.L. Isolation of Plant DNA from Fresh Tissue. Focus 1990, 12, 13–15. [Google Scholar]
  61. R Core Team. R: A Language and Environment for Statistical Computing; R Foundation for Statistical Computing: Vienna, Austria, 2023; Available online: https://www.R-project.org/ (accessed on 14 March 2024).
  62. Ivanov, P.; Loghin, C.; Enescu, C.M. Morphological differentiation between Romanian lime species (Tilia spp.): A case study. Bull. Transilv. Univ. Bras. Ser. II For. Wood Ind. Agric. Food Eng. 2014, 7, 21–28. [Google Scholar]
  63. Weryszko-Chmielewska, E.; Piotrowska-Weryszko, K.; Dąbrowska, A. Response of Tilia sp. L. to climate warming in urban conditions—Phenological and aerobiological studies. Urban For. Urban Green. 2019, 43, 126369. [Google Scholar] [CrossRef]
  64. Ražná, K.; Žiarovská, J.; Ivanišová, E.; Urbanová, L.; Harenčár, L.; Kováčik, A.; Kučka, M.; Hrubík, P. Flowers Characteristics of Selected Species of Lime-Tree (Tilia spp.) in Terms of miRNA-Based Markers Activity, Mannose Expression and Biological Compounds Content. Forests 2021, 12, 1748. [Google Scholar] [CrossRef]
  65. El-Sayed, N.M.; Myler, P.J.; Blandin, G.; Berriman, M.; Crabtree, J.; Aggarwal, G.; Caler, E.; Renauld, H.; Worthey, E.A.; Hertz-Fowler, C.; et al. Comparative Genomics of Trypanosomatid Parasitic Protozoa. Science 2005, 309, 404–409. [Google Scholar] [CrossRef] [PubMed]
  66. Ovesna, J.; Polakova, K.; Lisova, L. DNA analyses and their applications in plant breeding. Czech. J. Genet. Plant Breed. 2002, 38, 29–40. [Google Scholar] [CrossRef]
  67. Zandalinas, S.I.; Fichman, Y.; Devireddy, A.R.; Sengupta, S.; Azad, R.K. Mittler Systemic signaling during abiotic stress combination in plants. Proc. Natl. Acad. Sci. USA 2020, 117, 13810–13820. [Google Scholar] [CrossRef]
  68. Pace, R.; Biber, P.; Pretzsch, H.; Grote, R. Modeling ecosystem services for park trees: Sensitivity of i-tree eco simulations to light exposure and tree species classification. Forests 2018, 9, 89. [Google Scholar] [CrossRef]
  69. Ma, B.; Hauer, R.J.; Ostberg, J.; Koeser, A.K.; Wei, H.; Xu, C. A global basis of urban tree inventories: What comes first the inventory or the program. Urban For. Urban Green. 2021, 60, 127087. [Google Scholar] [CrossRef]
  70. Pace, R.; Masini, E.; Giuliarelli, D.; Biagiola, L.; Tomao, A.; Guidolotti, G.; Agrimi, M.; Portoghesi, L.; De Angelis, P.; Calfapietra, C. Tree Measurements in the Urban Environment: Insights from Traditional and Digital Field Instruments to Smartphone Applications. Arboric. Urban For. AUF 2022, 48, 113–123. [Google Scholar] [CrossRef]
Figure 1. Site description: Timișoara.
Horticulturae 10 00596 g001
Figure 2. Analysis of gels obtained from the amplification of Tilia species with ten molecular markers: (T1) T. cordata I, (T2) T. cordata II, (T3) T. platyphyllos and (T4) T. argentea; (MM) Molecular Weight Marker.
Horticulturae 10 00596 g002
Figure 3. Cluster analysis of Tilia spp. populations T. cordata I (T1), T. cordata II (T2), T. platyphyllos (T3), and T. argentea (T4).
Horticulturae 10 00596 g003
Figure 4. Correlation between ISSR markers.
Horticulturae 10 00596 g004
Figure 5. (A) Comparations between the medium diameter of the trunk at breast height (DBHm) of T. cordata I (DBHm T1), T. cordata II (DBHm T2), T. platyphyllos (DBHm T3), and T. argentea (DBHm T4). (B) Comparations between medium total tree height (Htot) of T. cordata I (Htot T1), T. cordata II (Htot T2), T. platyphyllos (Htot T3), and T. argentea (Htot T4). (C) Comparations between medium trunk height (ht) of T. cordata I (ht T1), T. cordata II (ht T2), T. platyphyllos (ht T3), and T. argentea (ht T4). (D) Comparations between medium crown height (hc) values of T. cordata I (hc T1), T. cordata II (hc T2), T. platyphyllos (hc T3), and T. argentea (hc T4). (E) Comparations between medium crown spread (Pm) of T. cordata I (Pm T1), T. cordata II (Pm T2), T. platyphyllos (Pm T3), and T. argentea (Pm T4). “ns”—not significant, “*”—p < 0.05, “**”—p < 0.01, “***”—p < 0.001, “****”—p < 0.0001.
Horticulturae 10 00596 g005
Figure 6. (A) Linear correlations between dendrometric parameters within population T1: T. cordata I. (B) Linear correlations between dendrometric parameters within population T2: T. cordata II. (C) Linear correlations between dendrometric parameters within population T3: T. platyphyllos. (D) Linear correlations between dendrometric parameters within population T4: T. argentea.
Horticulturae 10 00596 g006
Figure 7. (A) Linear regression equations of dendrometric parameters for population T1: T. cordata I. (B) Linear regression equations of dendrometric parameters for population T2: T. cordata II. (C) Linear regression equations of dendrometric parameters for population T3: T. platyphyllos. (D) Linear regression equations of dendrometric parameters for population T4: T. argentea.
Horticulturae 10 00596 g007
Figure 8. (A) Scree plot of PCA. (B) Biplot of PCA. (C) Contribution of variables to the first dimension of PCA. (D) Contribution of variables to the second dimension of PCA.
Horticulturae 10 00596 g008aHorticulturae 10 00596 g008b
Figure 9. Cluster phylogenetic tree of individuals from T1, T2, T3, and T4 populations produced by Agglomerative Hierarchical Clustering.
Horticulturae 10 00596 g009
Table 1. ISSR primer sequences.
Crt. no.Primer Name ISSRPrimer Sequence (5′-3′)
1UBC840(GA) YT8
2UBC864(ATG)6
3UBC873(GACA)4
4UBC884HBH(AG)7
5UBC886VDV(CT)7
6A7(AG) T10
7A 12(GA)6 CC
8A 13(GT)6 CC
9A 17(GTG)3 GC
10A 21(CA)6 AC
Y = (C, T), H = (non G), B = (non A), V = (non T), D = (non C).
Table 2. Analysis of variance on polymorphism of Tilia spp. populations using ISSR primers.
SourceSSdfMean SquareFSig.
Tilia spp.1,591,766.1853530,588.7286730***
Residuals49,352,590.39065478,838.004
Total88,848,358.000658
“ns”—not significant, “*”—p < 0.05, “**”—p < 0.01, “***”—p < 0.001.
Table 3. Polymorphism rates for Tilia spp. populations analyzed using ISSR primers.
NrPrimersTotalPolymorphismPercent Polymorphism (%)Band Size (bp)PIC *IP **
1A7161275195–9500.417 + 0.0185
2A12201680105–10400.398 + 0.0136.375
3A13151493.33230–9000.438 + 0.0176.125
4A1713861.54165–6500.484 + 0.0173.875
5A21161487.5225–10500.420 + 0.0175.875
6Ubc84012975125–5500.403 + 0.0183.625
7Ubc864141071.43200–5900.425 + 0.0204.25
8Ubc873222090.91150–14300.425 + 0.0148.5
9Ubc884191578.95190–10700.433 + 0.0176.5
10Ubc886181688.89140–6400.422 + 0.0166.75
Average values16.513.481.2-0.4255.56
* PIC—Total polymorphism generated by a specific primer; ** IP—Discrimination index.
Table 4. Analysis of polymorphic bands generated by ISSR primers in populations of Tilia spp.
NrParametersValue
1Number of receivers10
2Total number of bands165
3Average number of bands/primers 16.5
4Polymorphic strips134
5Polymorphism rate (%)81.2
6Polymorphism analysis index efficiency (Average number of polymorphic bands)13.4
7Average polymorphism rate/primer (Average PIC)0.425
8Average Discrimination Index (Average IP)5.569
9Amplitude of band size variation (bp)105–1430
Table 5. Specific alleles for populations of Tilia spp.
Nr.crt.PopulationsSpecific Alleles
1Tilia cordata I (T1)UBC840-550; UBC864-380; UBC864-360; UBC873-290; UBC886-195; A12-660;
2Tilia cordata II (T2) UBC840-440; UBC840-300; UBC840-270; UBC840-240; UBC864-230; UBC873-430; UBC886-160; A7-880; A7-830; UBC884-250;
3Tilia platypyllos (T3)UBC864-280; UBC873-875; UBC873-550; UBC873-165; UBC886-490; UBC886-360; A12-880; A12-210; UBC884-800; UBC884-635; UBC884-430; A13-900; A13-780; A13-710; A13-300; A21-815; A21-430;
4Tilia argentea (T4)A7-425; A7-365; A7-225; A12-525; A12-370; A21-695; A21-310.
Table 6. Analysis of variance on polymorphism of Tilia spp. populations using ISSR primers UBC840, UBC864, UBC873, UBC886, and A17.
SourceSSdfMean SquareFSig.
Tilia spp.1,761,209.5863587,069.86210,804***
Residuals16,899,467.39031254,339.123
Total31,563,677.390316
“ns”—not significant, “*”—p < 0.05, “**”—p < 0.01, “***”—p < 0.001.
Table 7. Analysis of variance on polymorphism of Tilia spp. populations using primers ISSR A7, A12, A13, A21 and UBC884.
SourceSSDfMean SquareFSig.
Tilia spp.968,558.6863322,852.89533790.019 (ns)
Residuals32,007,969.72139095,546.178
Total57,284,681.000394
“ns”—not significant, “*”—p < 0.05, “**”—p < 0.01, “***”—p < 0.001.
Disclaimer/Publisher’s Note: The statements, opinions and data contained in all publications are solely those of the individual author(s) and contributor(s) and not of MDPI and/or the editor(s). MDPI and/or the editor(s) disclaim responsibility for any injury to people or property resulting from any ideas, methods, instructions or products referred to in the content.

