Abstract
The identification of reliable physiological and biochemical indicators for assessing tomato salt tolerance can increase the efficiency of plant breeding to create new varieties and lines. The purpose of our study was to identify available physiological and biochemical relevant characteristics for assessing the sensitivity to sodium chloride salinity of different tomato genotypes at the seedling stage. A complex analysis was carried out based on indicators such as biomass growth, water content of plant tissues, content of readily soluble salts, sodium and chlorine ions, photosynthetic pigments, carotenoids, phenolic compounds and flavonoids. Additionally, the stomata area of the upper and lower epidermis was taken into account. The comprehensive assessment carried out made it possible to reliably divide the eight studied tomato varieties into two groups: sensitive (Belyij Naliv, Geya, YaLF, Paradigma) and tolerant (Recordsmen, Yuryevskij, Bych’e Serdce, Astrakhanskij). Tomato genotypes that can be classified as sensitive (in order of increasing sensitivity to high concentrations of NaCl (150 mM)) were Belyij Naliv > Geya > YaLF ≥ Paradigma. Tomato genotypes that can be classified as resistant to salt stress (in order of increasing tolerance to high concentrations of NaCl (150 mM)) were Recordsmen < Yuryevskij < Bych’e Serdce < Astrakhanskij. The advisability of only using complex physiological and biochemical indicators to obtain relevant assessments for salinity tolerance at the early stages of tomato plant development has been demonstrated.
1. Introduction
Salinity is a serious threat to crop production, significantly reducing plant yields. The global area of salt-affected soils in the world is approximately 831 million hectares, of which about 770 million hectares are the result of human-induced degradation [1]. Plants have evolved complex mechanisms for responding to different external signals. As a result, such responses appear as physiological, biochemical, morphological and other changes [2,3]. These include changes in the regulation of photosynthesis, ion efflux, synthesis of osmolytes, and scavenging of reactive oxygen species (ROS) [4]. To produce high-quality food products from agricultural crops, the selection and cultivation of salt-tolerant varieties is actively applied [1]. The use of lands with primary and secondary salinity is due to the increasing consumer demand of the human population, shortage of arable land, desertification, and other environmental reasons [5,6,7].
The problem of arable land salinization is especially acute for farms due to limited water resources. Soil salinity has significantly reduced vegetable production on farms, although effective attempts have been made in some regions to utilize saline soils [8]. Different varieties of tomato (Solanum lycopersicum L.) are widely available in local markets. They are the second most commonly grown plant objects when studying the influence of salt stress in various zoning conditions [9,10].
Tomato fruits are consumed both fresh and processed due to their specific taste, color, aroma and nutrient content [8,11]. Most modern tomato varieties are classified as moderately salt tolerant and can be used as model objects for analyzing the underlying mechanism of salt tolerance. However, tomatoes’ tolerance in the field may not exhibit similar properties when grown under greenhouse conditions [12]. Additionally, instead of testing plants under soil conditions (pots in a growth chamber or soil ridges in a greenhouse), hydroponic growth testing can be used, at least by immersing the roots in a nutrient solution with varying salt concentrations [13]. Thus, Seth R. et al. [14] germinated tomato seeds in vitro on one-half MS culture medium supplemented with various concentrations of NaCl (0, 40, 60, 80 and 100 mM). Other studies on salinity tolerance in tomato using Hoagland’s solution both in vivo [15,16,17] and in vitro [18,19] have been conducted.
Some estimations have shown that high salt concentrations cause disruption of biochemical processes [20]. Plant tolerance to salt stress is mediated by various biochemical pathways that promote water retention and/or uptake and maintenance of ionic homeostasis [21]. Cellular turgor is a critical factor under salinity treatments and depends on the concentration of salt ions in the solution [22]. Maintenance of ion homeostasis throughout absorption and accumulation of cations and anions in the cellular compartments is an efficient plant strategy under stressful conditions. During salt stress, competition between sodium and potassium ions increases outside and inside the plant cell, since they both share the same transport mechanism [23]. Na+ uptake through Na+-transporters has been shown to be related for the functioning of K+-transporters [24]. Membrane depolarization caused by high Na+ concentrations leads to increased efflux and decreased K+ influx [25]. Excessive Na+ content in the cytosol leads to the displacement of K+ and a decrease in the activity of most proteins. Potassium ions perform important structural, signaling and metabolic functions in the plant. A high Na+/K+ ratio leads to nutritional imbalance [26]. Cytoplasmic Na+ is removed from the cytoplasm using tonoplast Na+/H+ antiporters, the operation of which depends on the concentration gradient [27]. Various ion channels are involved in passive transport and also contribute to the influx of chloride ions into root and shoot tissues under salinity conditions [28].
High concentration levels of Na+ and/or Cl− are toxic to the cell, as they disrupt the stomata regulation, leading to decreased growth and photosynthesis. Chlorophylls are important plant pigments, the most common of which are chlorophylls a and b. They are closely related to the absorption of sunlight and are used to absorb photons and release electrons [29]. Both chlorophylls a and b are key components of photosystems. The chlorophyll content in leaves is generally inversely proportional to salinity levels [30]. Thus, Amirjani et al. [31] observed a decrease in the chlorophyll a and b content in rice when grown under salt stress. A decrease in chlorophyll content in canola under salt stress was reported by Nazarbeygi et al. [32]. Suppression of chlorophyll synthesis, leading to loss of photosynthetic activity and senescence of leaves, causes a decrease in crop growth [33,34]. Carotenoids also contribute to the absorption of light during photosynthesis, and they influence the protection of unsaturated fatty acids, phospholipids and galactolipids [35,36]. Another important mechanism for preventing osmotic stress is reducing transpiration water losses. Leaf transpiration is regulated not only by the closure of stomata but also by through control of their density. Thus, Albaladejo et al. [37] demonstrated increasing water content in tomato leaves under salinity conditions. This fact was associated with a decrease in the stomatal opening, as well as a decrease in stomatal density on both the abaxial and adaxial surfaces under salinity conditions. Using this mechanism, the plant can optimize water use under salinity conditions by concentrating cuticular pores around the stomata [38].
Phenols are secondary metabolites of plants. They perform a variety of functions that are critical to plant growth and development [39]. Flavonoids are a major group of polyphenolic compounds with a diphenylpropane skeleton. The high diversity of flavonoids is due to the large amount of compounds of formed by the hydroxylation, methoxylation and glycosylation processes [40]. Hydroxyl groups play a decisive role in the functional activity of flavonoids, and the greater their number in the molecule, the higher the antioxidant activity of the compound [41]. Polyphenolic compounds are present in most plant seeds, protecting them from pathogens and pests and participating in seed maturation [42]. Salt stress causes both inhibition and stimulation of phenolic compound’s accumulation. An increase in flavonol content under biotic and abiotic stresses indicates their protective function in plants. Parvin et al. [43] studied the morpho-physiological characteristics of tomatoes under salinity conditions and noted increasing synthesis of chlorophylls and carotenoids under quercetin influence. They suggested that this fact may be due to a quercetin-induced decrease in Na+/K+ ratio, acute osmotic stress and ROS production. Quercetin has been reported to reduce the activity of lipoxygenase, superoxide dismutase, catalase and malonyl dialdehyde.
In most cases, physiological and biochemical studies are targeted both for understanding the adaptive plant responses under salinity conditions and for searching for appropriate markers to identify resistance. To develop diagnostic tests, it is very important to identify criteria that can serve as indicators of resistance. Previously, we identified morphometric and cytological characteristics in tomato genotypes for in vitro salt tolerance [44,45].
The aim of our study was to identify the available and relevant physiological and biochemical characteristics for assessing various tomato genotypes’ tolerance to NaCl salinity at the seedling stage, as well as to conduct a comparative assessment of tolerance methods using simple and combined approaches. As potential markers, the content of total easily soluble salts, the content of individual ions (Cl−, Na+, K+), the content of pigments (chlorophylls and carotenoids), and the content of total phenolic compounds and flavonoids were also studied.
2. Materials and Methods
2.1. Plant Material
The object of our research was tomato genotypes at the seedling stage (Solanum lycopersicum L.) from various ecological and geographical origins (Central and Lower Volga regions of the Russian Federation). The territories of these regions differ significantly in the degree of soil salinity, as a result of which the studied genotypes may differ in salt tolerance. Seeds of the tomato cultivars Yur’evskij, Paradigma, Bych’e Serdce, Astrakhanskij and Recordsmen were obtained at the All-Russian Research Institute of Irrigated Vegetable and Melon Growing, the scientific and production enterprise “Agrovnedrenie” (Lower Volga Region, Astrakhan, Russia). The YaLF selection line was isolated from the Yamal variety at the N.N. Timofeev Breeding Station of the Russian State Agrarian University—Moscow K.A. Timiryazev Agricultural Academy (Central region, Moscow, Russia). The cultivars Belyij Naliv and Geya were obtained from Agrofirm AELITA LLC (Central Region, Moscow, Russia), as well as Agrofirm SeDeK LLC (Central Region, Moscow, Russia), respectively.
2.2. Growth Conditions
Tomato plants were cultured on the ½ MS liquid medium in 200 mL vessels. At the stage of the first true leaf, the plants were transferred to a ½ MS culture medium supplemented with 150 mM NaCl. A culture medium without NaCl was used as a control. Cultivation was carried out in a light room at a temperature of 23 °C, illumination of 3.0 klx and a 16/8 h (day/night) photoperiod. On the 8th day of culture, plant material was prepared for biochemical analysis. The experiment included three biological replicates of 15 plants each. All variants were performed in triplicate analytical repetition.
2.3. Morphometric Indicators
After 8 days of culture, morphological characteristics were assessed, including wet and dry biomass (mg) of roots and shoot. Wet and dry biomass was determined gravimetrically using an analytical balance (Sartorius, Göttingen, Germany). To determine dry biomass, roots and shoots were dried at 65 °C to constant weight. The model of analytical balances was Sartorius Analytical A200S (Sartorius, Göttingen, Germany).
2.4. Determination of Electrolyte Leakage and Ion Absorption
To determine the ion content (Cl−, Na+, K+) in the tissues of tomato leaves, the elements were extracted for 30 min at 40 °C with 25 mL of deionized water using an ultrasonic device (Sapphire, Moscow, Russia) from 200 mg a fresh sample The ultrasound power level was 35 kHz. The samples were cooled, passed through a 0.45 μm porous filter and used for ion content analysis. Determination of ion content was carried out using ion-selective electrodes: potassium electrode (ELIT-031), sodium–sodium electrode (ELIS-112) and chlorine–chloride electrode (ELIT-261). The ion content (mg L−1) was determined on the ITAN ionometer (TomskAnalit, Tomsk, Russia) by plotting the dependence of the electrical conductivity on the ion concentration on a pre-constructed scale of standard solutions in the studied concentration range (10−1–10−4 M). A silver chloride electrode (EVL-1M3.1) was used as a reference. The electrolyte content in the samples was determined by the electrical conductivity of the solution using an Expert-002 conductometer (Econix, Tomsk, Russia). The change in electrical conductivity of samples in mg L−1 is proportional to the concentration of electrolytes and reflects the degree of ion accumulation in plant tissues.
2.5. Transmission Scanning Electron Microscopy of Leaf Surface
For fixation, fragments of first true leaves 2–3 mm long were cut off from each experimental treatment. A 2.5% solution of glutaraldehyde (Merck, Darmstadt, Germany) prepared in 0.1 M phosphate buffer (pH 7.2) supplemented with 1.5% sucrose was used as a fixative. Fixation was carried out for 24 h at +4 °C. Then, samples were washed five times for 30 min each with 0.1 M phosphate buffer and passed through a series of increasing concentrations of ethanol. Afterwards, drying was carried out using the critical point drying method. The samples were glued onto stages and viewed on a JSM-6380 scanning electron microscope. The area of stomatal cells was measured in µm2.
2.6. Determination of Chlorophyll Pigments
The content of chlorophylls and carotenoids (mg L−1 of fresh weight) was measured by standard method using a Spekol 1300 spectrophotometer (Analitik Jena AG, Jena, Germany) [46]. Leave samples (200 mg) were homogenized in 96% ethanol, after which the absorption was measured at 663 nm and 644 nm for chlorophylls and 452.5 nm for carotenoids. The following formulas were used for calculations:
Chlorophyll a = 10.3 × Abs663 − 0.918 × Abs644;
Chlorophyll b = 9.7 × Abs644 − 3.87 × Abs663;
Carotenoids = 4.2 × Abs452.5 − (0.0264 × chlorophyll a + 0.4260 × chlorophyll b).
2.7. Determination of Phenolic Compounds and Flavonoids
The total polyphenol content was measured using the Folin–Ciocalteu reagent [47]. A quantity of 0.075 mL from each sample was mixed with 0.075 mL of the Folin–Ciocalteu reagent diluted 5-fold. After 3 min incubation, 0.15 mL of 20% (w/v) sodium carbonate and 1.2 mL of distilled water were added. After 60 min of dark incubation, the absorbance at 725 nm with the spectrophotometer Spekol 1300 (Analitik Jena AG, Jena, Germany) was measured. Gallic acid (25–300 mg L−1; R2 = 0.998) was used as the standard. The results were expressed in mg g−1 DW (dry weight) gallic acid equivalent.
The total flavonoid content was determined using the modified method described by [48]. An aliquot of 1 mL from each sample was mixed with 2 mL of 2% (w/v) ethanolic solution of aluminum chloride, 0.5 mL of 1 M hydrochloric acid, and 6.5 mL of ethanol (96%). After 40 min in darkness, the absorbance at 415 nm was measured using the spectrophotometer Spekol 1300 (Analitik Jena AG, Jena, Germany). Quercetin (1–400 mg L−1; R2 = 0.9977) was used as the standard. The results were expressed in mg g−1 DW quercetin equivalent.
2.8. Statistical Analysis
In the salinity experiments, the normality of the result value distributions was tested using a Shapiro–Wilk test. As normality was rejected (p < 0.05) for some replications and for some experimental treatments (invasive species), we applied the non-parametric Kruskal–Wallis test for multisampling comparisons and the non-parametric Mann–Whitney pair-wise test. Since no significant differences were found among replicates within each experimental treatment, further between-treatment comparisons with the Kruskal–Wallis test were carried out for joint samples [49]. To analyze biomass, water content, accumulation of easily soluble salts, sodium and chlorine ions in the plant tissues of various tomato genotypes, and differences in salt tolerance, the difference between the average value in the control variant and the average value in the experimental variant was used.
3. Results
Tomato plants of eight different genotypes cultured equally well within seven days under control conditions (mM NaCl), whereas under 150 mM NaCl salinity, clear phenotypic differences in seedlings appeared within a week. Thus, in the cvs. Belyij Naliv, Geya and the YaLF line, a decrease in height was observed compared to the control. Additionally, the leaves of these tomatoes were chlorotic. In other genotypes (cvs. Astrakhanskij, Bych’e Serdce and Recordsmen), no differences in plant height and leaf color were found compared to the control.
3.1. Morphometric Indicators
Salt stress reduced the biomass of the above-ground part of seedlings in three tomato genotypes (cvs. Belyij Naliv, Geya and YaLF line), with a maximum decrease of 11.6% compared to the control recorded in the cv. Belyij Naliv (Figure 1). The increase in biomass in two cultivars (Recordsmen and Paradigma) was 3.3 and 4.1% compared to the control, respectively. In three cultivars (Yur’evskij, Bych’e Serdce and Astrakhanskij), the biomass of the above-ground part was increased at a high NaCl concentration (150 mM), and the cv. Astrakhanskij recorded a maximum increase in biomass of 53.1% compared to the control (Figure S1).
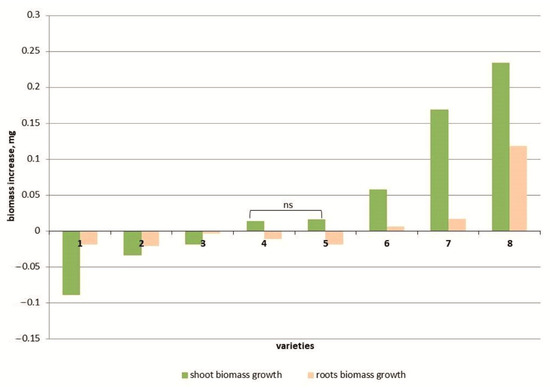
Figure 1.
Shoot and root weight increase in 8 tomato varieties: cv. Belyij Naliv—1, cv. Geya—2, line YaLF—3, cv. Paradigma—4, cv. Recordsmen—5, cv. Yurevskij—6, cv. Bych’e Serdce—7, cv. Astrakhanskij—8. The overall difference was significant according to Kruskal–Wallis test (p < 0.01). All pairwise differences were significant as well, except those designated in the plot as “ns” (not significant).
The root weight in most tomato genotypes also decreased under salt treatment (Figure 1). The root weight under 150 mM NaCl in three tomato cultivars, Yur’evsky, Bych’e Serdce and Astrakhanskij, significantly increased compared to the control by 4.0, 18.8 and 72.4%, respectively (Figure S1).
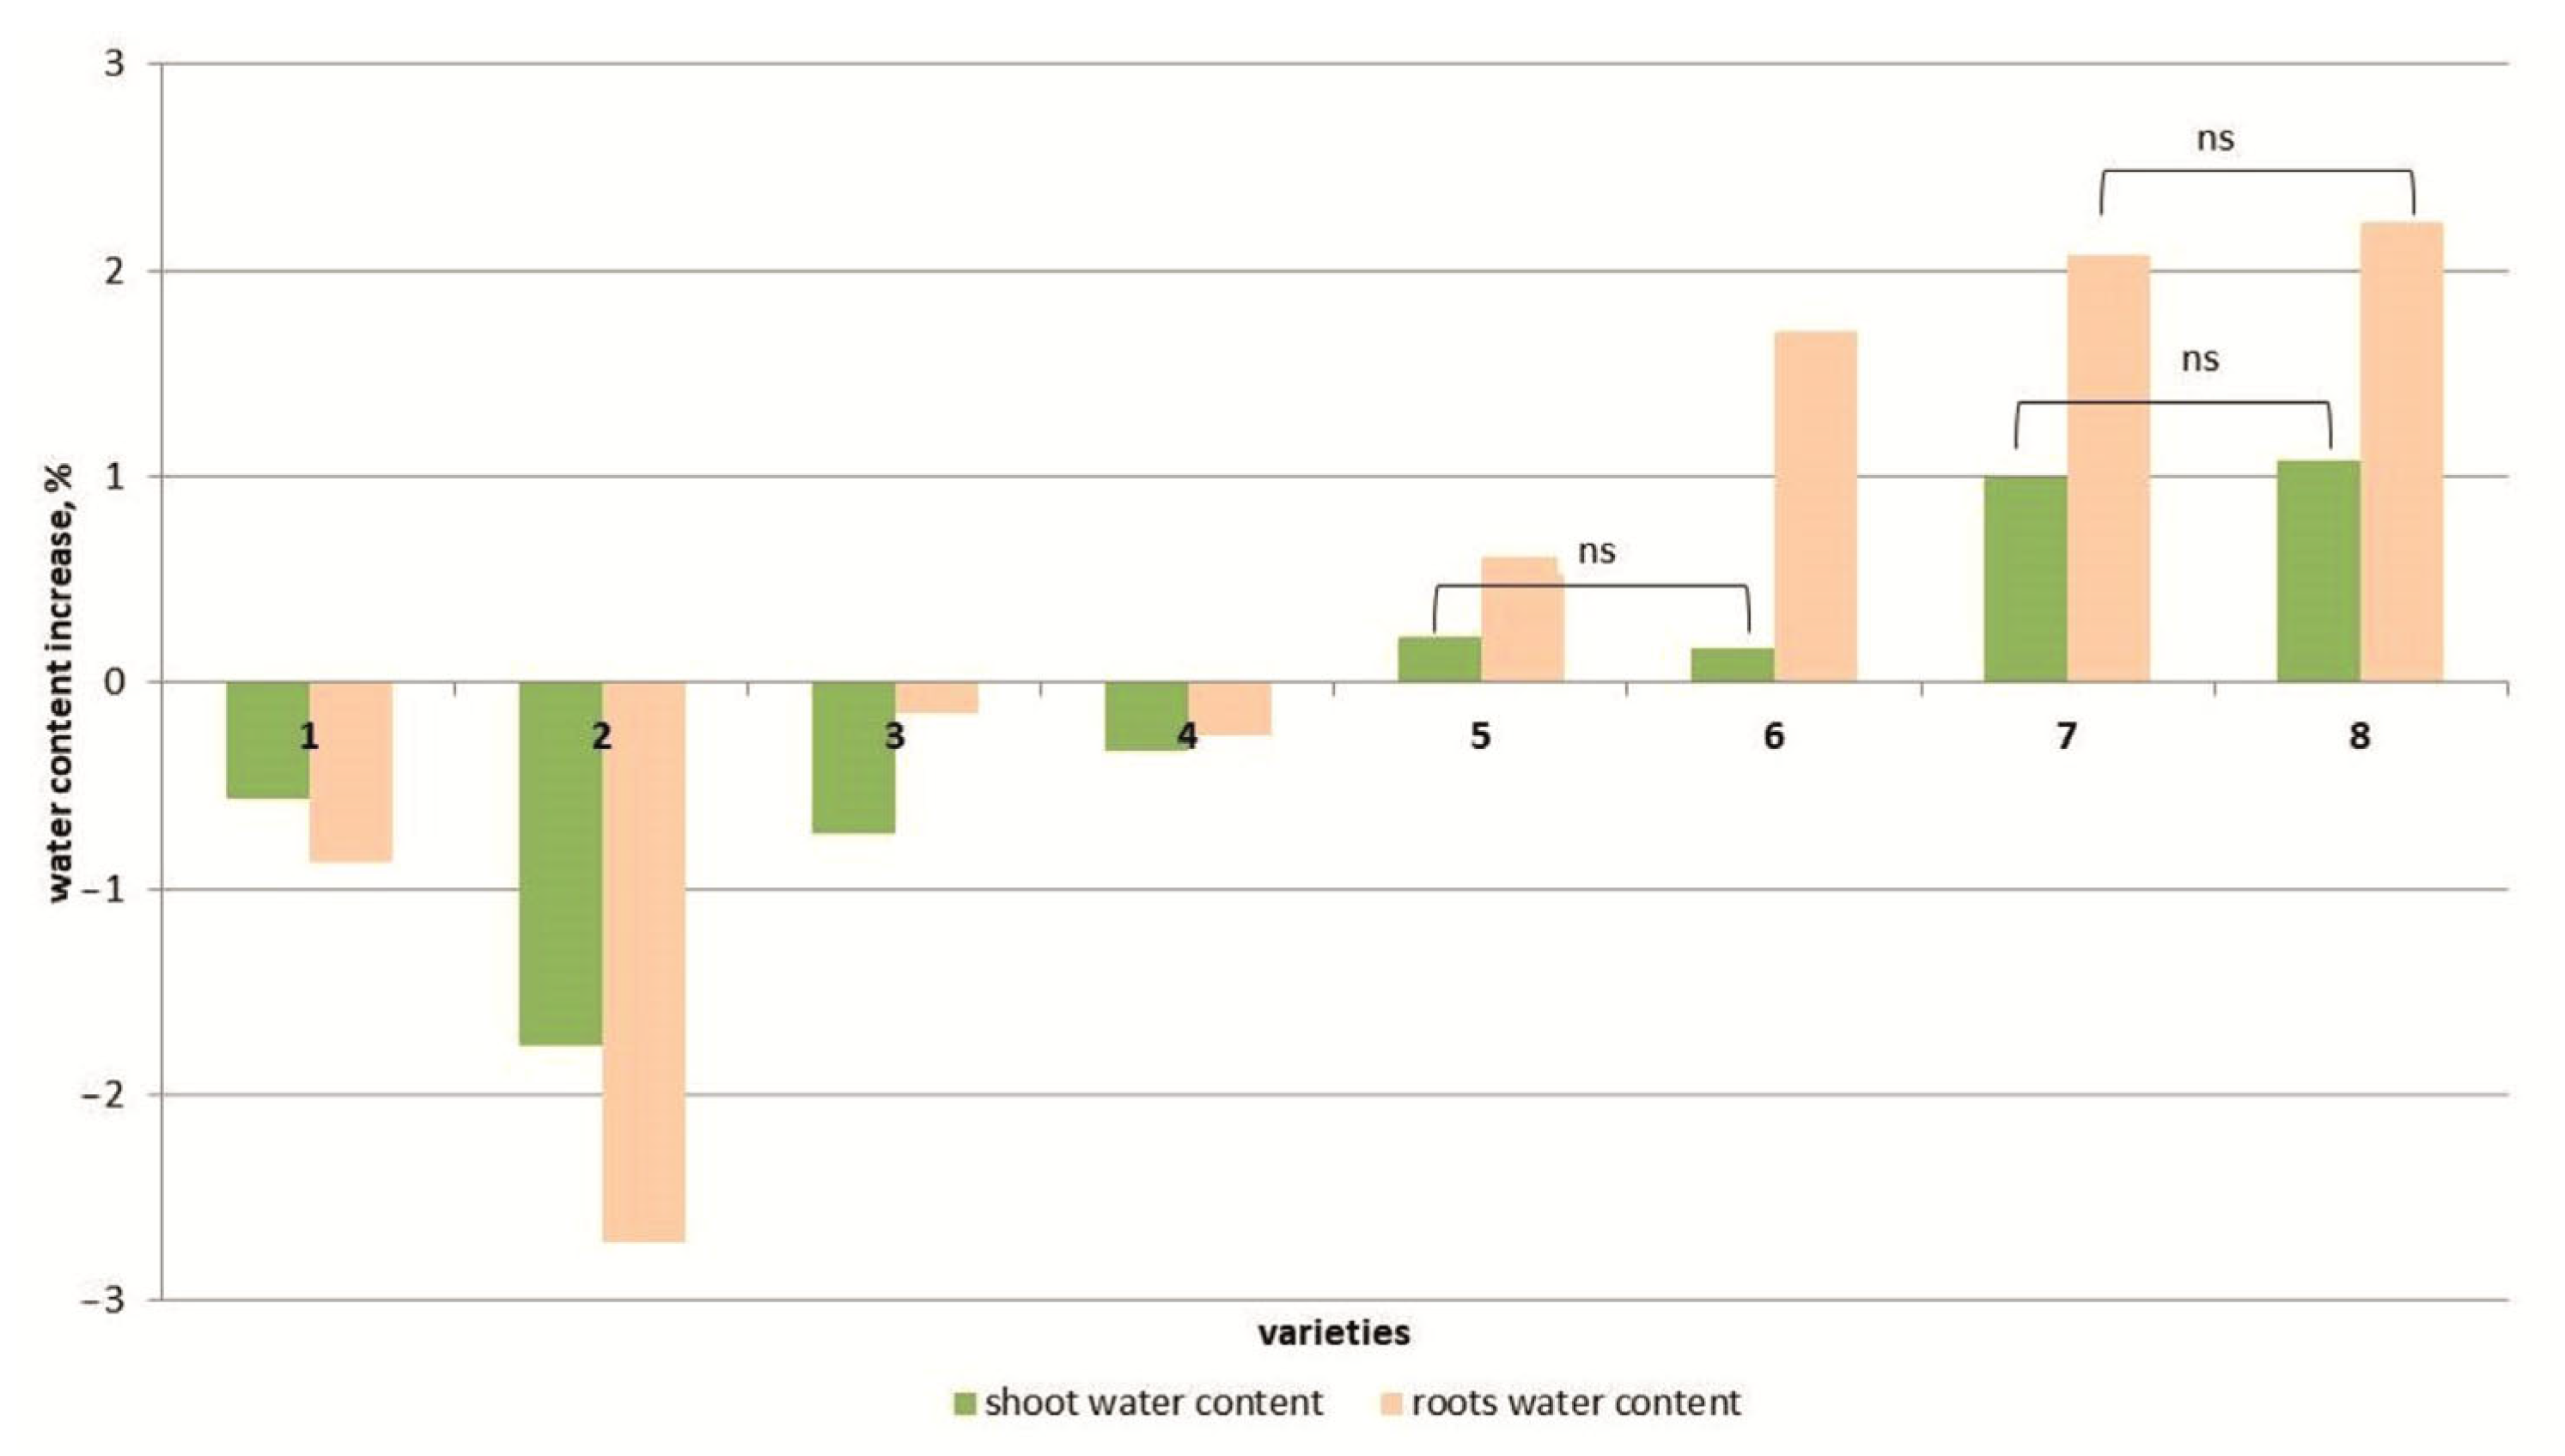
Another parameter characterizing the plant’s tolerance to salt stress is the water content of plant tissues. Under salt stress, the water content of the above-ground parts of the plants decreased compared to the control in four cultivars but increased in the four other tomato cultivars (Figure 2 and Figure S2). At the same time, the increase in water content in the shoots of the YaLF and Yur’evskij genotypes did not exceed 0.2% or ~1% in the cvs. Bych’e Serdce and Astrakhanskij compared to the control. The water content in the roots at a high NaCl concentration (150 mM) significantly decreased in the genotypes Geya, Recordsmen, Belyij Naliv and Paradigma compared to the control (by 1.7–0.4%) and increased in the genotypes Astrakhanskij, Bych’e Serdce, Yur’evskij and YaLF.
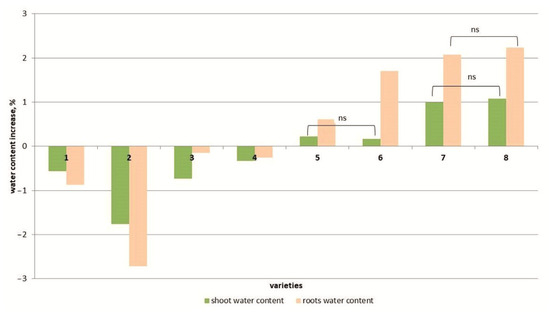
Figure 2.
Differences in water content among 8 tomato cultivars. cv. Belyij Naliv—1, cv. Geya—2, cv. Recordsmen—3, cv. Paradigma—4, line YaLF—5, cv. Yur’evskij—6, cv. Bych’e Serdce—7, cv. Astrahanskij—8. The overall difference was significant according to Kruskal–Wallis test (p < 0.01). All pairwise differences were significant as well, except those designated in the plot as “ns” (not significant).
To determine the plant’s tolerance to salt stress according to two classical tests (biomass growth and water content of plant tissues), all studied genotypes can be divided into three groups (Table 1).

Table 1.
Classification of tomato varieties according to resistance to salinity using classical methods.
3.2. Physiological and Biochemical Parameters: Content of Easily Soluble Salts and Individual Ions
As additional indicators for assessing salt tolerance, an evaluation of the accumulation of easily soluble salts and individual ions (Na+ and Cl−) in the above-ground mass of tomatoes was used (Figure 3 and Figure S3). Salt stress caused an increase in these indicators in all eight tomato genotypes. At the same time, the maximum increase in the content of easily soluble salts was noted for the cvs. Belyij Naliv (2.8 times) and for the cvs. Geya, YaLF, Yur’evskij and Paradigma (2.1–1.6 times) compared to the control, while only a minimal increase in the content of easily soluble salts in tomato tissues was recorded in three cultivars, Bych’e Serdce, Recordsmen and Astrakhanskij (1.3–1.1 times), compared to the control. The increase in Na+ content was maximal in the Geya, Belyij Naliv and YaLF (5.8–5.4 times) genotypes compared to the control (Figure 2). In the cv Yur’evskij, the Na+ content increased by 3.0 times and by 2.3 and 2.0 times in the cv Paradigma and Bych’e Serdce, respectively. And for two cultivars (Recordsmen and Astrakhanskij), the increase in Na+ content was only 1.4 times higher than the control. Also, a similar pattern of increase in Cl− ions was observed in the tissues of eight tomato varieties under salt stress. The maximum increase in the content of this highly toxic ion in the tissues of the YaLF line and cvs. Belyij Naliv, Geya was 4.6, 3.8 and 3.6 times higher compared to the control, respectively. The minimum increase was observed in the tissues of cvs. Recordsmen and Astrakhanskij (1.5 and 1.7 times) compared to the control, respectively.
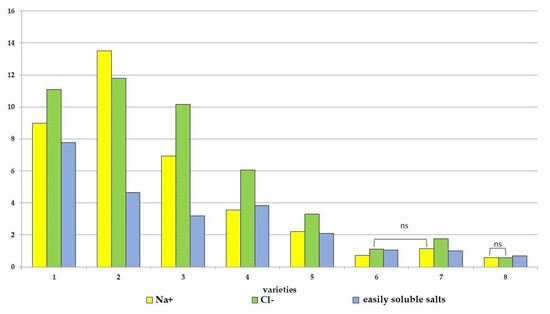
Figure 3.
Accumulation of easily soluble salts, sodium ions and chlorine in the plant tissues of various tomato genotypes, differing in salt tolerance. cv. Belyij Naliv—1, cv. Geya—2, cv. Recordsmen—3, cv. Paradigma—4, line YaLF—5, cv. Yur’evskij—6, cv. Bych’e Serdce—7, cv. Astrahanskij—8. The overall difference was significant according to Kruskal–Wallis test (p < 0.01). All pairwise differences were significant as well, except those designated in the plot as “ns” (not significant). The accumulation of readily soluble salts was calculated as N/100 and measured in mkSm. Ion accumulation was measured in mg g−1.
Another important indicator of tomato salt tolerance may be the K+/Na+ ion content ratio. This indicator of eight tomato cultivars ranged from 0.73 to 1.51. At the same time, a lower K+/Na+ ratio was observed in four cultivars: Geya, Belyij Naliv, YaLF and Yur’evskij (0.73; 0.78; 0.98 and 0.81, respectively). In four more salt-tolerant varieties, the content of K+ ions more significantly exceeded the content of Na+ ions: Paradigma—1.29, Bych’e Serdce—1.36, Recordsmen—1.41 and Astrakhanskij—1.51. Salt stress caused a loss of K+ ions from tomato tissues, resulting in a decrease in the K+/Na+ ratio. At the same time, the maximum decrease was recorded in the cvs. Belyij Naliv and Geya (0.18 and 0.19, respectively). In the cv. Yur’evskij and YaLF line, it was 0.26 and 0.54. And only in salt-tolerant cultivars was this indicator significantly higher: 0.82 in the cv Paradigma, 0.88 in the cv Bych’e Serdce, 0.98 in the cv Astrakhanskij and 1.07 in the cv Recordsmen, which indicated a lower loss of K+ ions and lower permeability of cell membranes.
3.3. Transmission Scanning Electron Microscopy of Leaf Surfaces
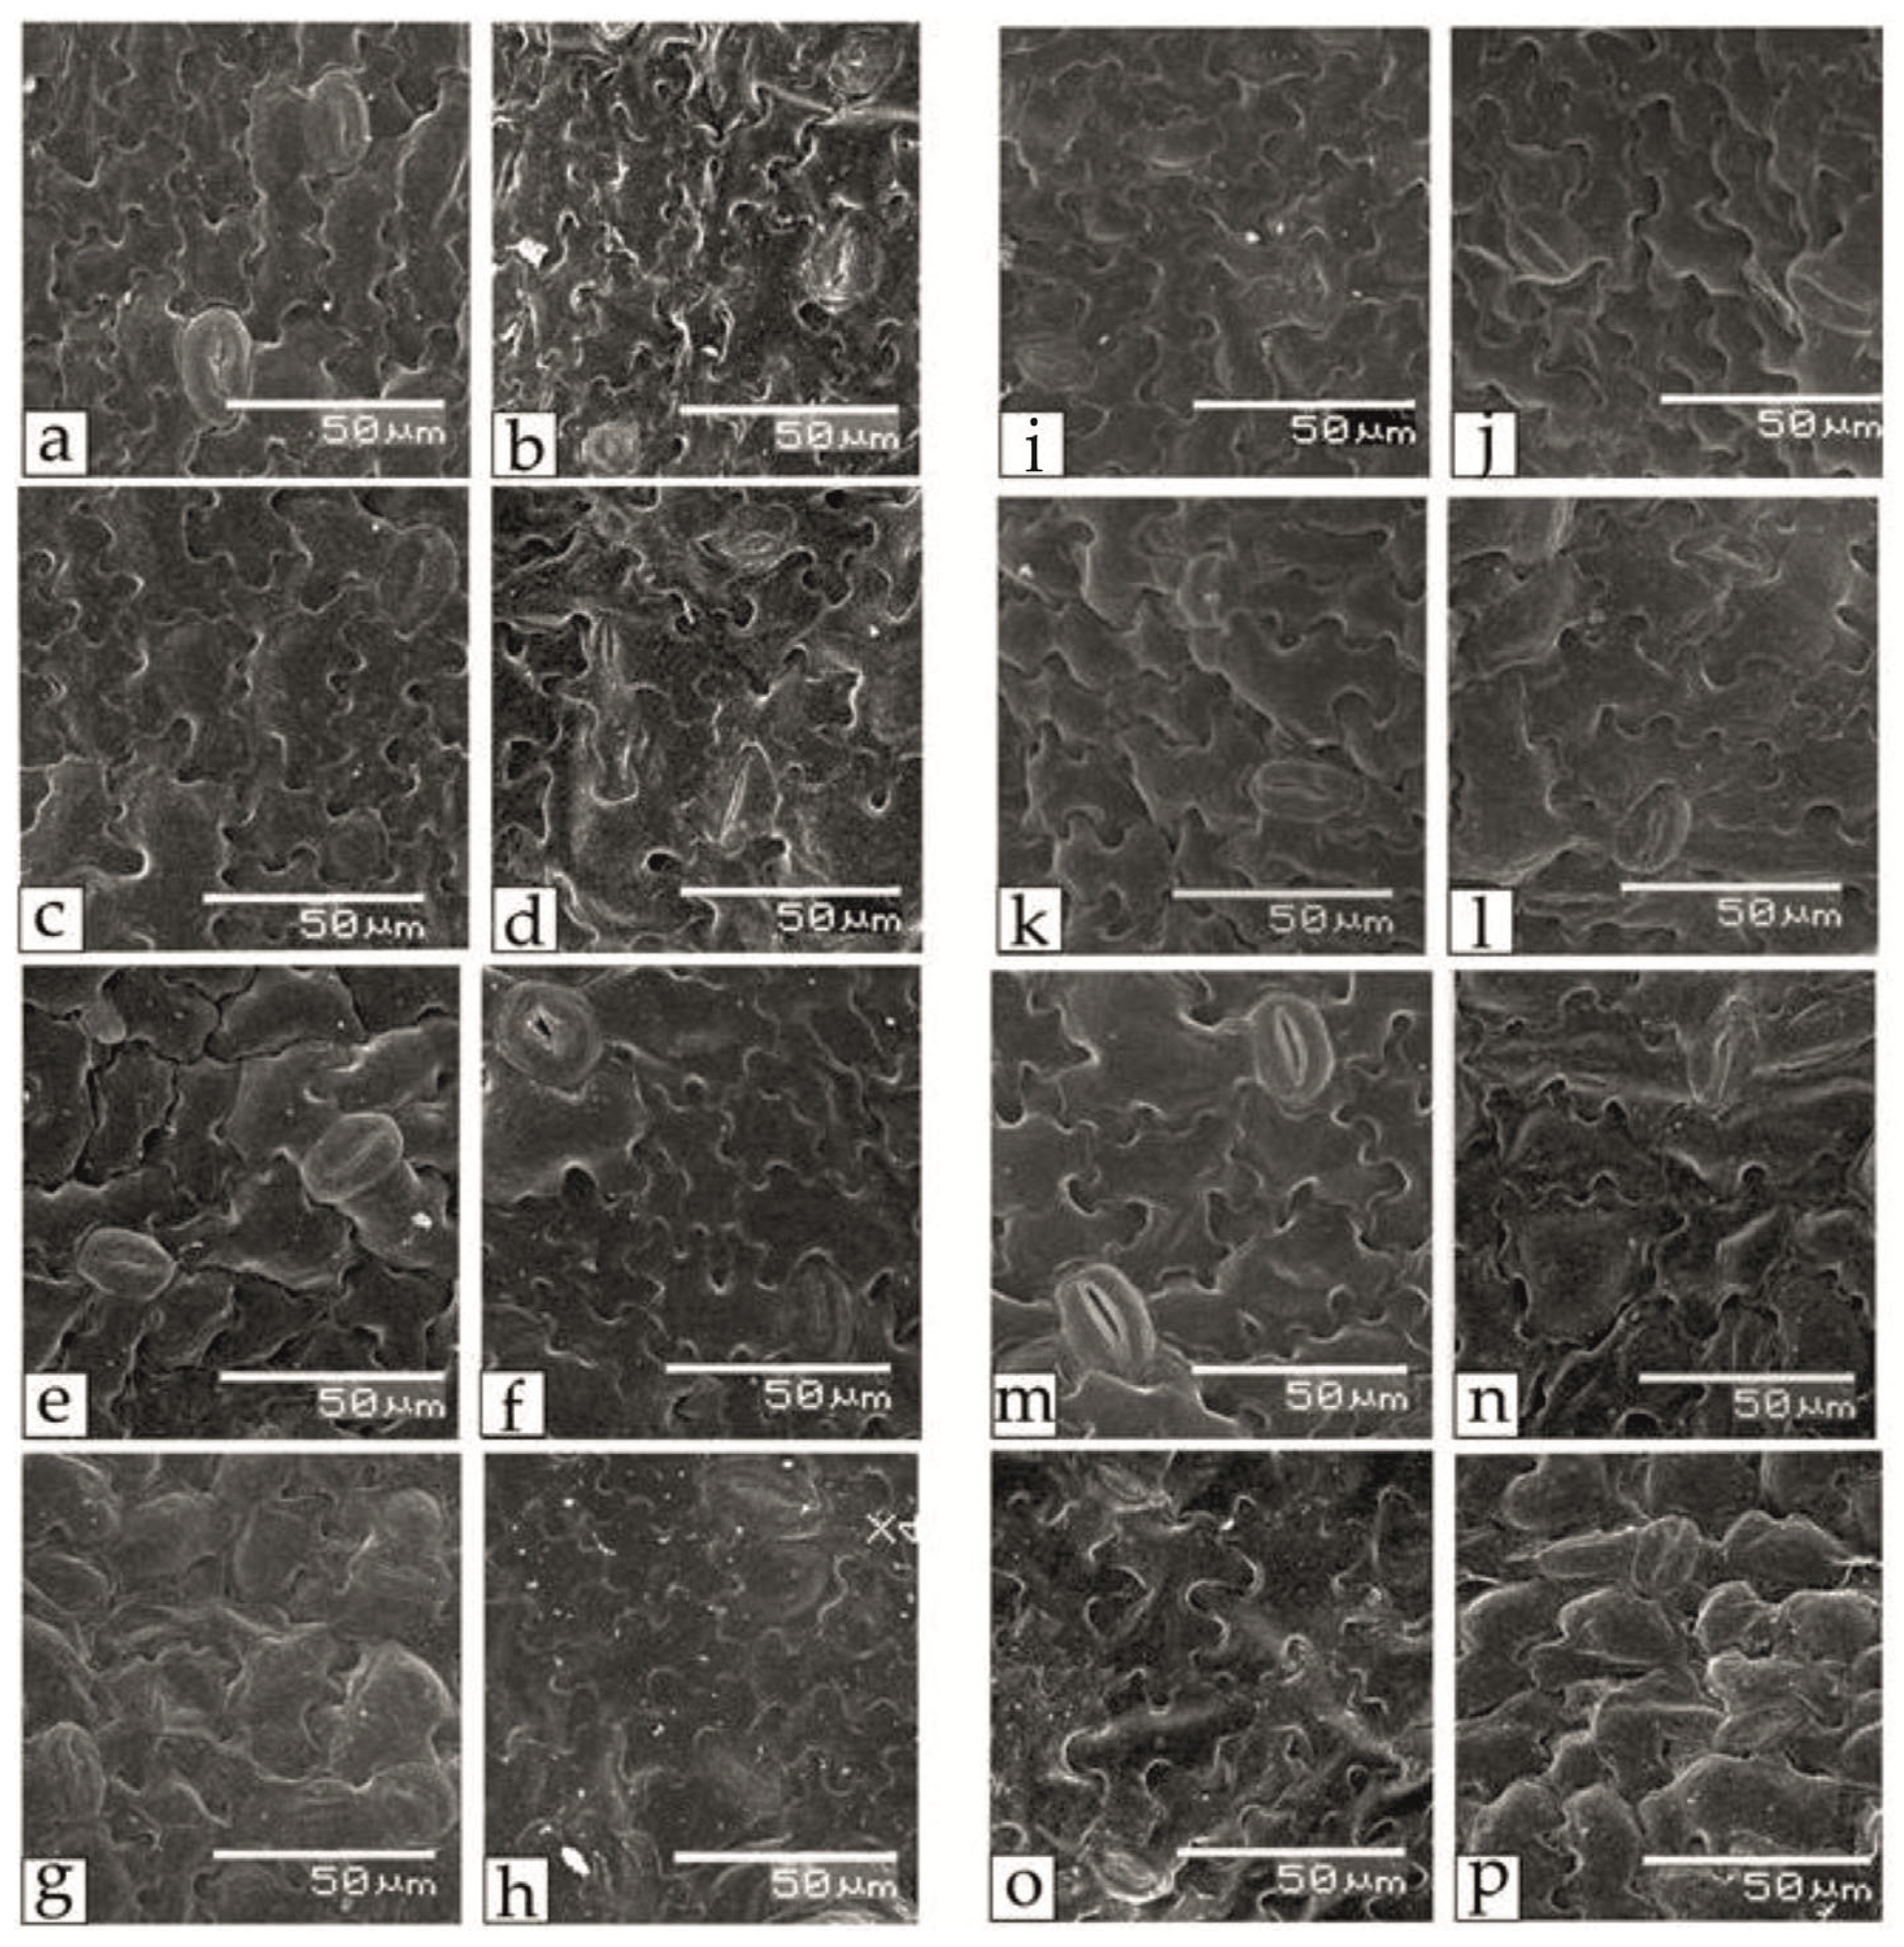
Salt stress also affected the regulation of respiration and transpiration in tomato leaves; in particular, noticeable asymmetry and differences in the sizes of paired stomata and changes in the shape of guard cells, their relative position and the stomatal pore were observed (Figure 4). One of the promising criteria for assessing salt tolerance may be the stomatal area. Thus, the guard cells of the lower epidermis of tomato leaves of the Belyij Naliv, Geya and YaLF genotypes had larger sizes and a more rounded shape under salt stress.
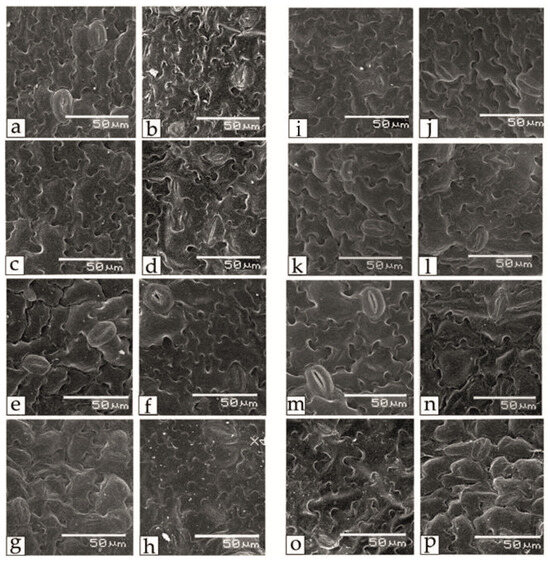
Figure 4.
The effect of salinity on the stomata area at 0 mM NaCl (a,c,e,g,i,k,m,o) and 150 mM NaCl (b,d,f,h,j,l,n,p) in lower epidermal leaf tissue of various tomato genotypes that differ in salt tolerance. (a,b)—cv. Astrahanskij; (c,d)—cv. Bych’e Serdce; (e,f)—cv. Geya; (g,h)—cv. Paradigma; (i,j)—cv. Recordsmen; (k,l)—line YaLF; (m,n)—cv. Belyij Naliv; (o,p)—cv. Yur’evskij.
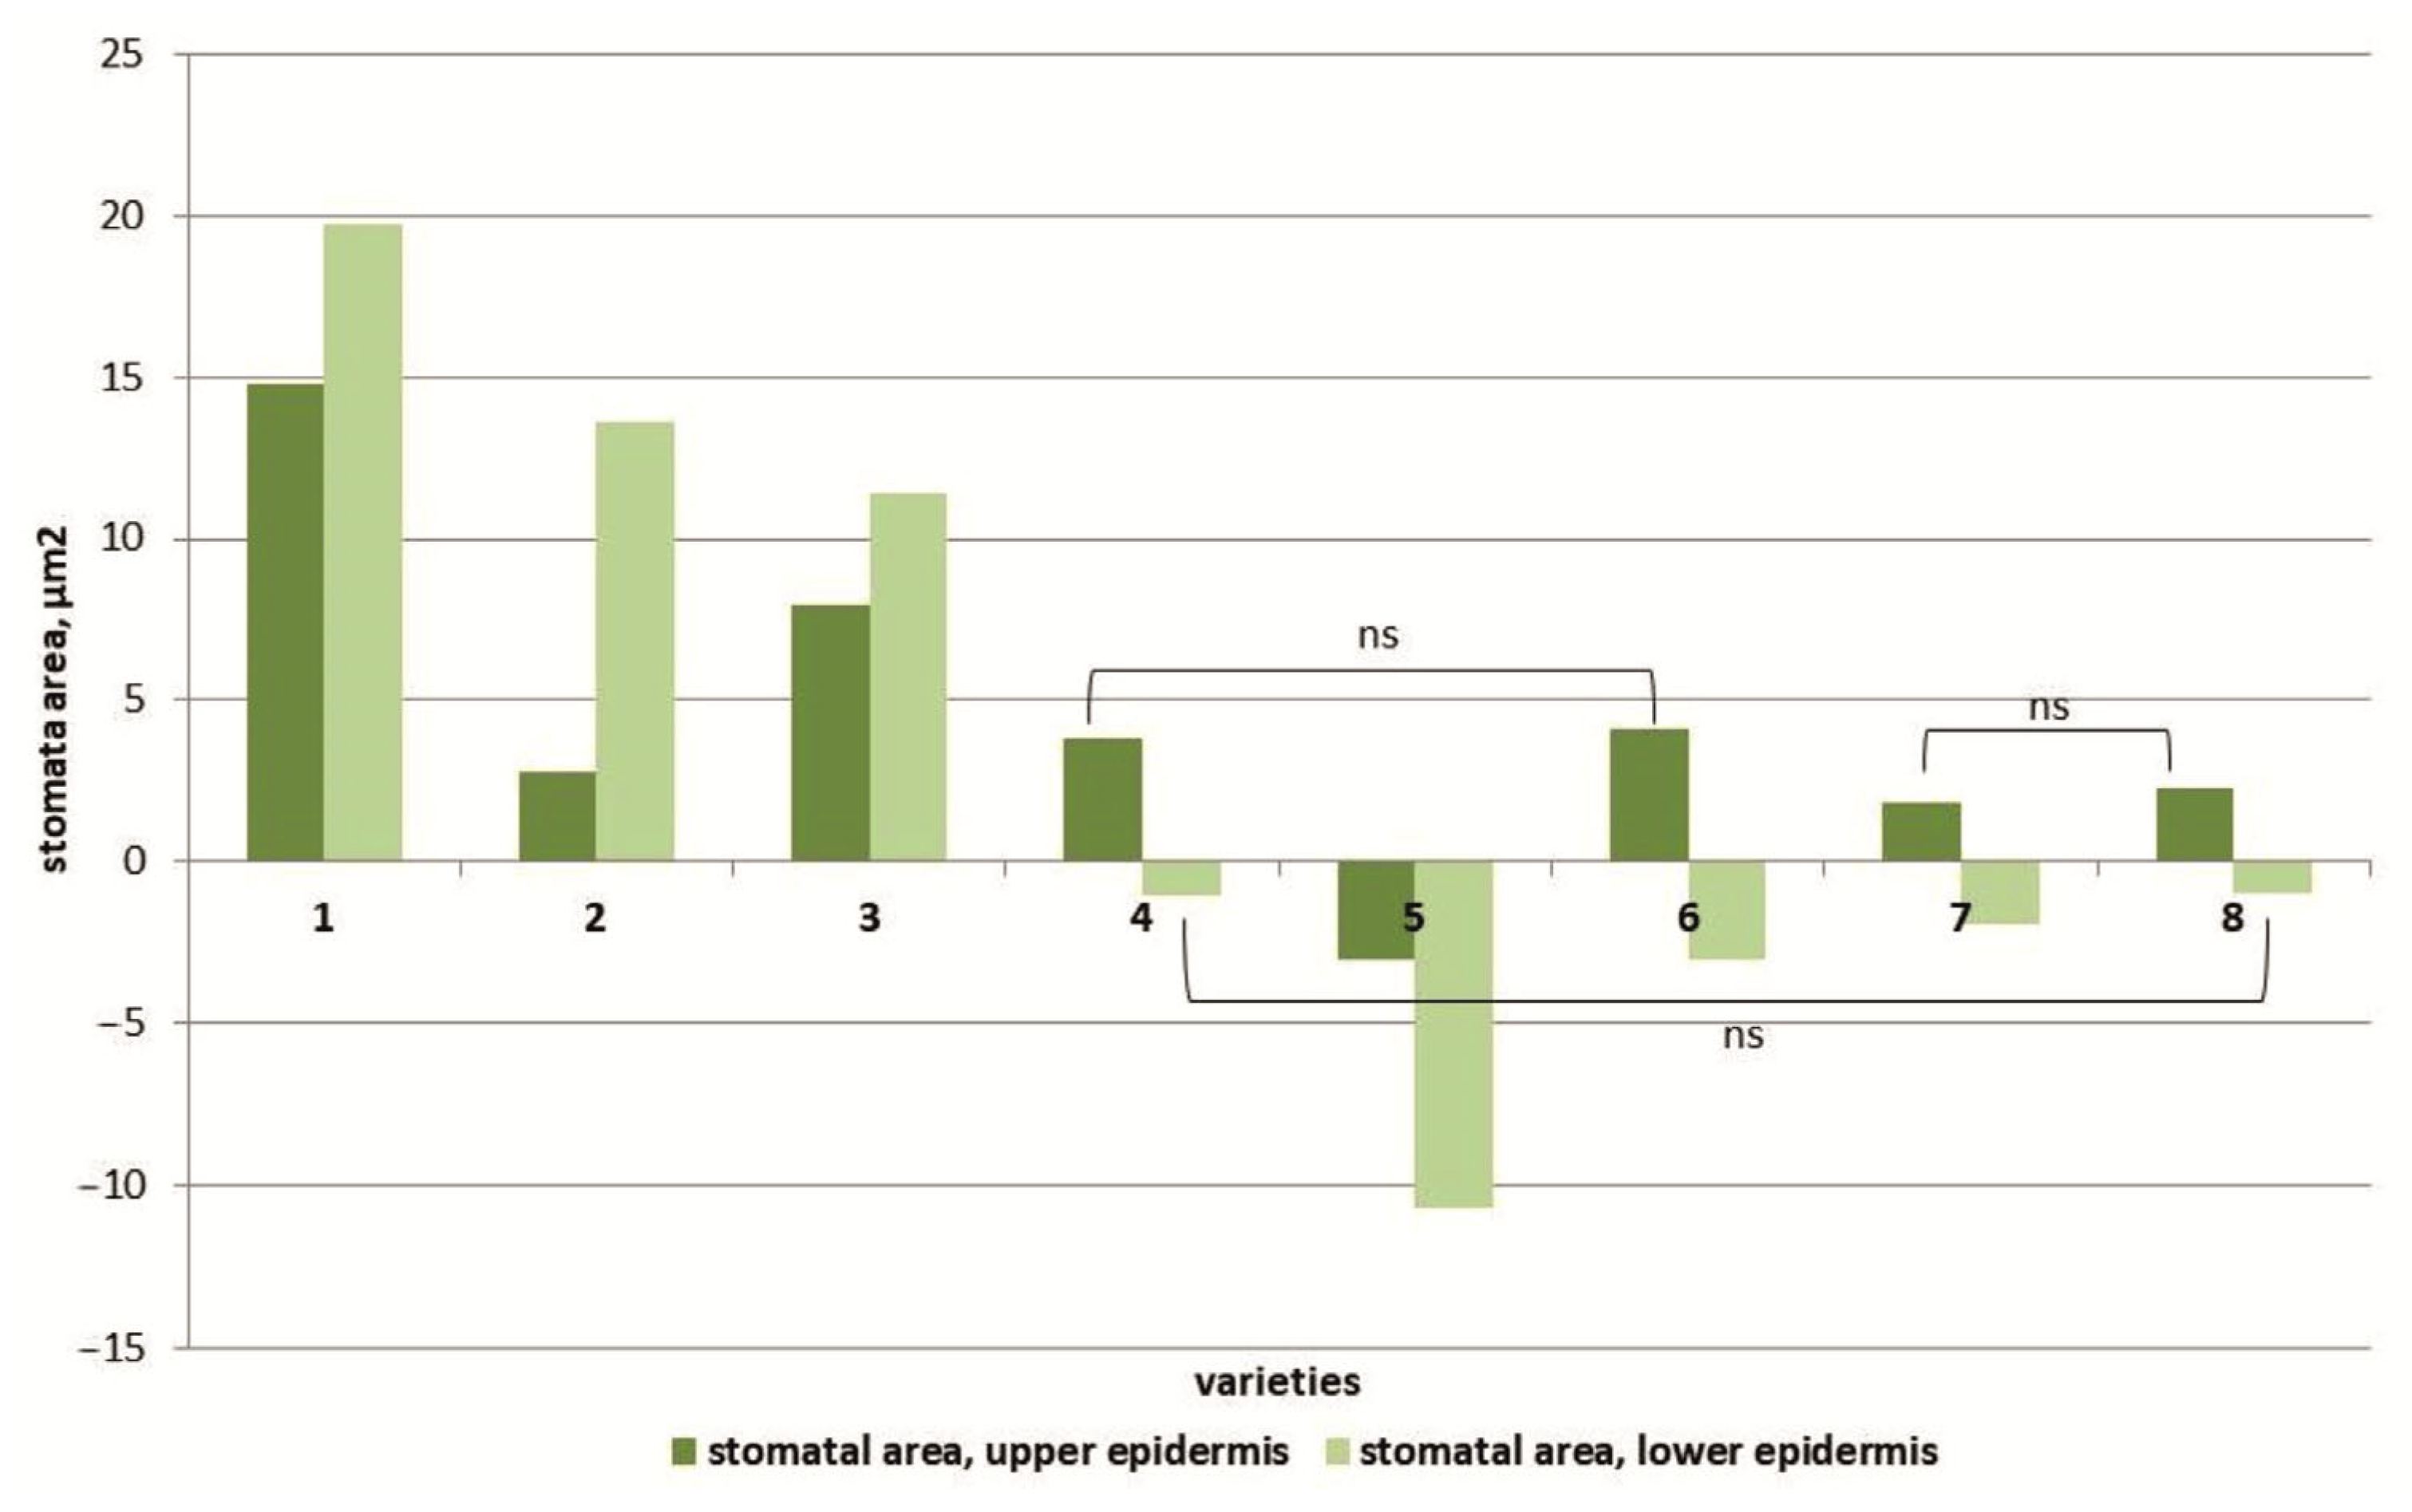
At 150 mM NaCl, an increase in the area of stomata in the upper epidermis of the leaves of almost all studied tomato cultivars was observed, with the only exception being plants of the cv. Paradigma (Figure 5). Moreover, the maximum increase in stomatal area was observed in the Belyij Naliv and YaLF genotypes (1.6 and 1.4 times, respectively) compared to the control. The stomata size of the lower epidermis under salt stress increased only in three cultivars: cv. Belyij Naliv and Geya and the YaLF line (by 1.9, 1.7 and 1.5 times, respectively, compared to the control). In all other cultivars, the stomatal size of the lower epidermis of leaves was decreased. The maximum decrease in stomatal area was recorded in the cv. Paradigma: at high NaCl concentrations (150 mM), the stomatal area was 0.7 times less than in control plants (Figure S4).
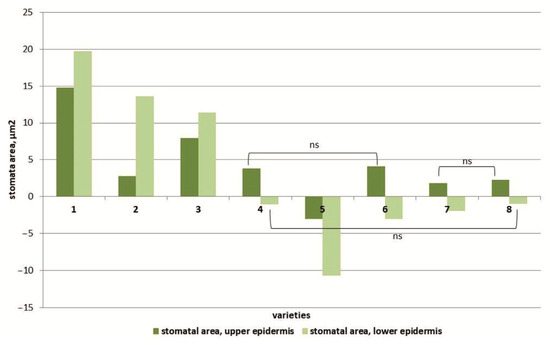
Figure 5.
The effect of salinity on the stomata area in the upper epidermal leaf tissues and in the lower epidermal leaf tissues of various tomato genotypes that differ in salt tolerance. Legend: cv. Belyij Naliv—1, cv. Geya—2, cv. Recordsmen—3, cv. Paradigma—4, line YaLF—5, cv. Yur’evskij—6, cv. Bych’e Serdce—7, cv. Astrahanskij—8. The overall difference was significant according to Kruskal–Wallis test (p < 0.01). All pairwise differences were significant as well, except those designated in the plot as “ns” (not significant).
3.4. Determination of Pigment Content
Under salt stress conditions, the amount of photosynthetic pigments, namely chlorophylls and carotenoids, was changed (Figure 6 and Figure S5). In four genotypes (cvs. Belyij Naliv, Geya, Paradigma and YaLF line), a decrease in the chlorophyll a and chlorophyll b content (more significant) was observed compared to the control. Additionally, the cvs. Belyij Naliv and Geya were characterized by a decrease in the carotenoid content; for the YaLF line and cv. Paradigm, the content of these pigments, although it increased, was not statistically significantly different from the control. In four other cultivars (Recordsmen, Yur’evskij, Bych’e Serdce and Astrakhanskij), an increase in the content of chlorophyll a and b was observed, and in the most salt-tolerant cultivar, Astrakhanskij, the increase in the content of these pigments was 1.6 and 2.1 times greater compared to the control (Figure 6 and Figure S6). At the same time, the content of carotenoids did not differ in a statistically significant manner from that in control plants.
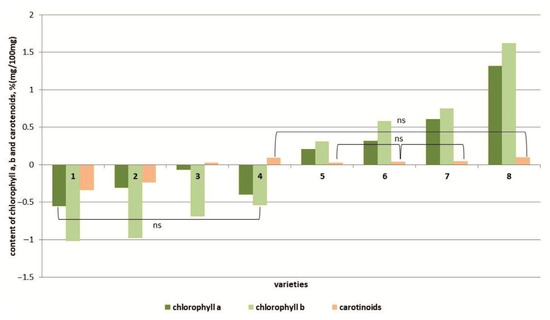
Figure 6.
Content of chlorophyll a, b and carotenoids in tomato genotypes differing in salt tolerance under salinity conditions. Legend: cv. Belyij Naliv—1, cv. Geya—2, cv. Recordsmen—3, cv. Paradigma—4, line YaLF—5, cv. Yur’evskij—6, cv. Bych’e Serdce—7, cv. Astrahanskij—8. The overall difference was significant according to Kruskal–Wallis test (p < 0.01). All pairwise differences were significant as well, except those designated in the plot as “ns” (not significant).
3.5. Determination of the Phenolics and Flavonoids
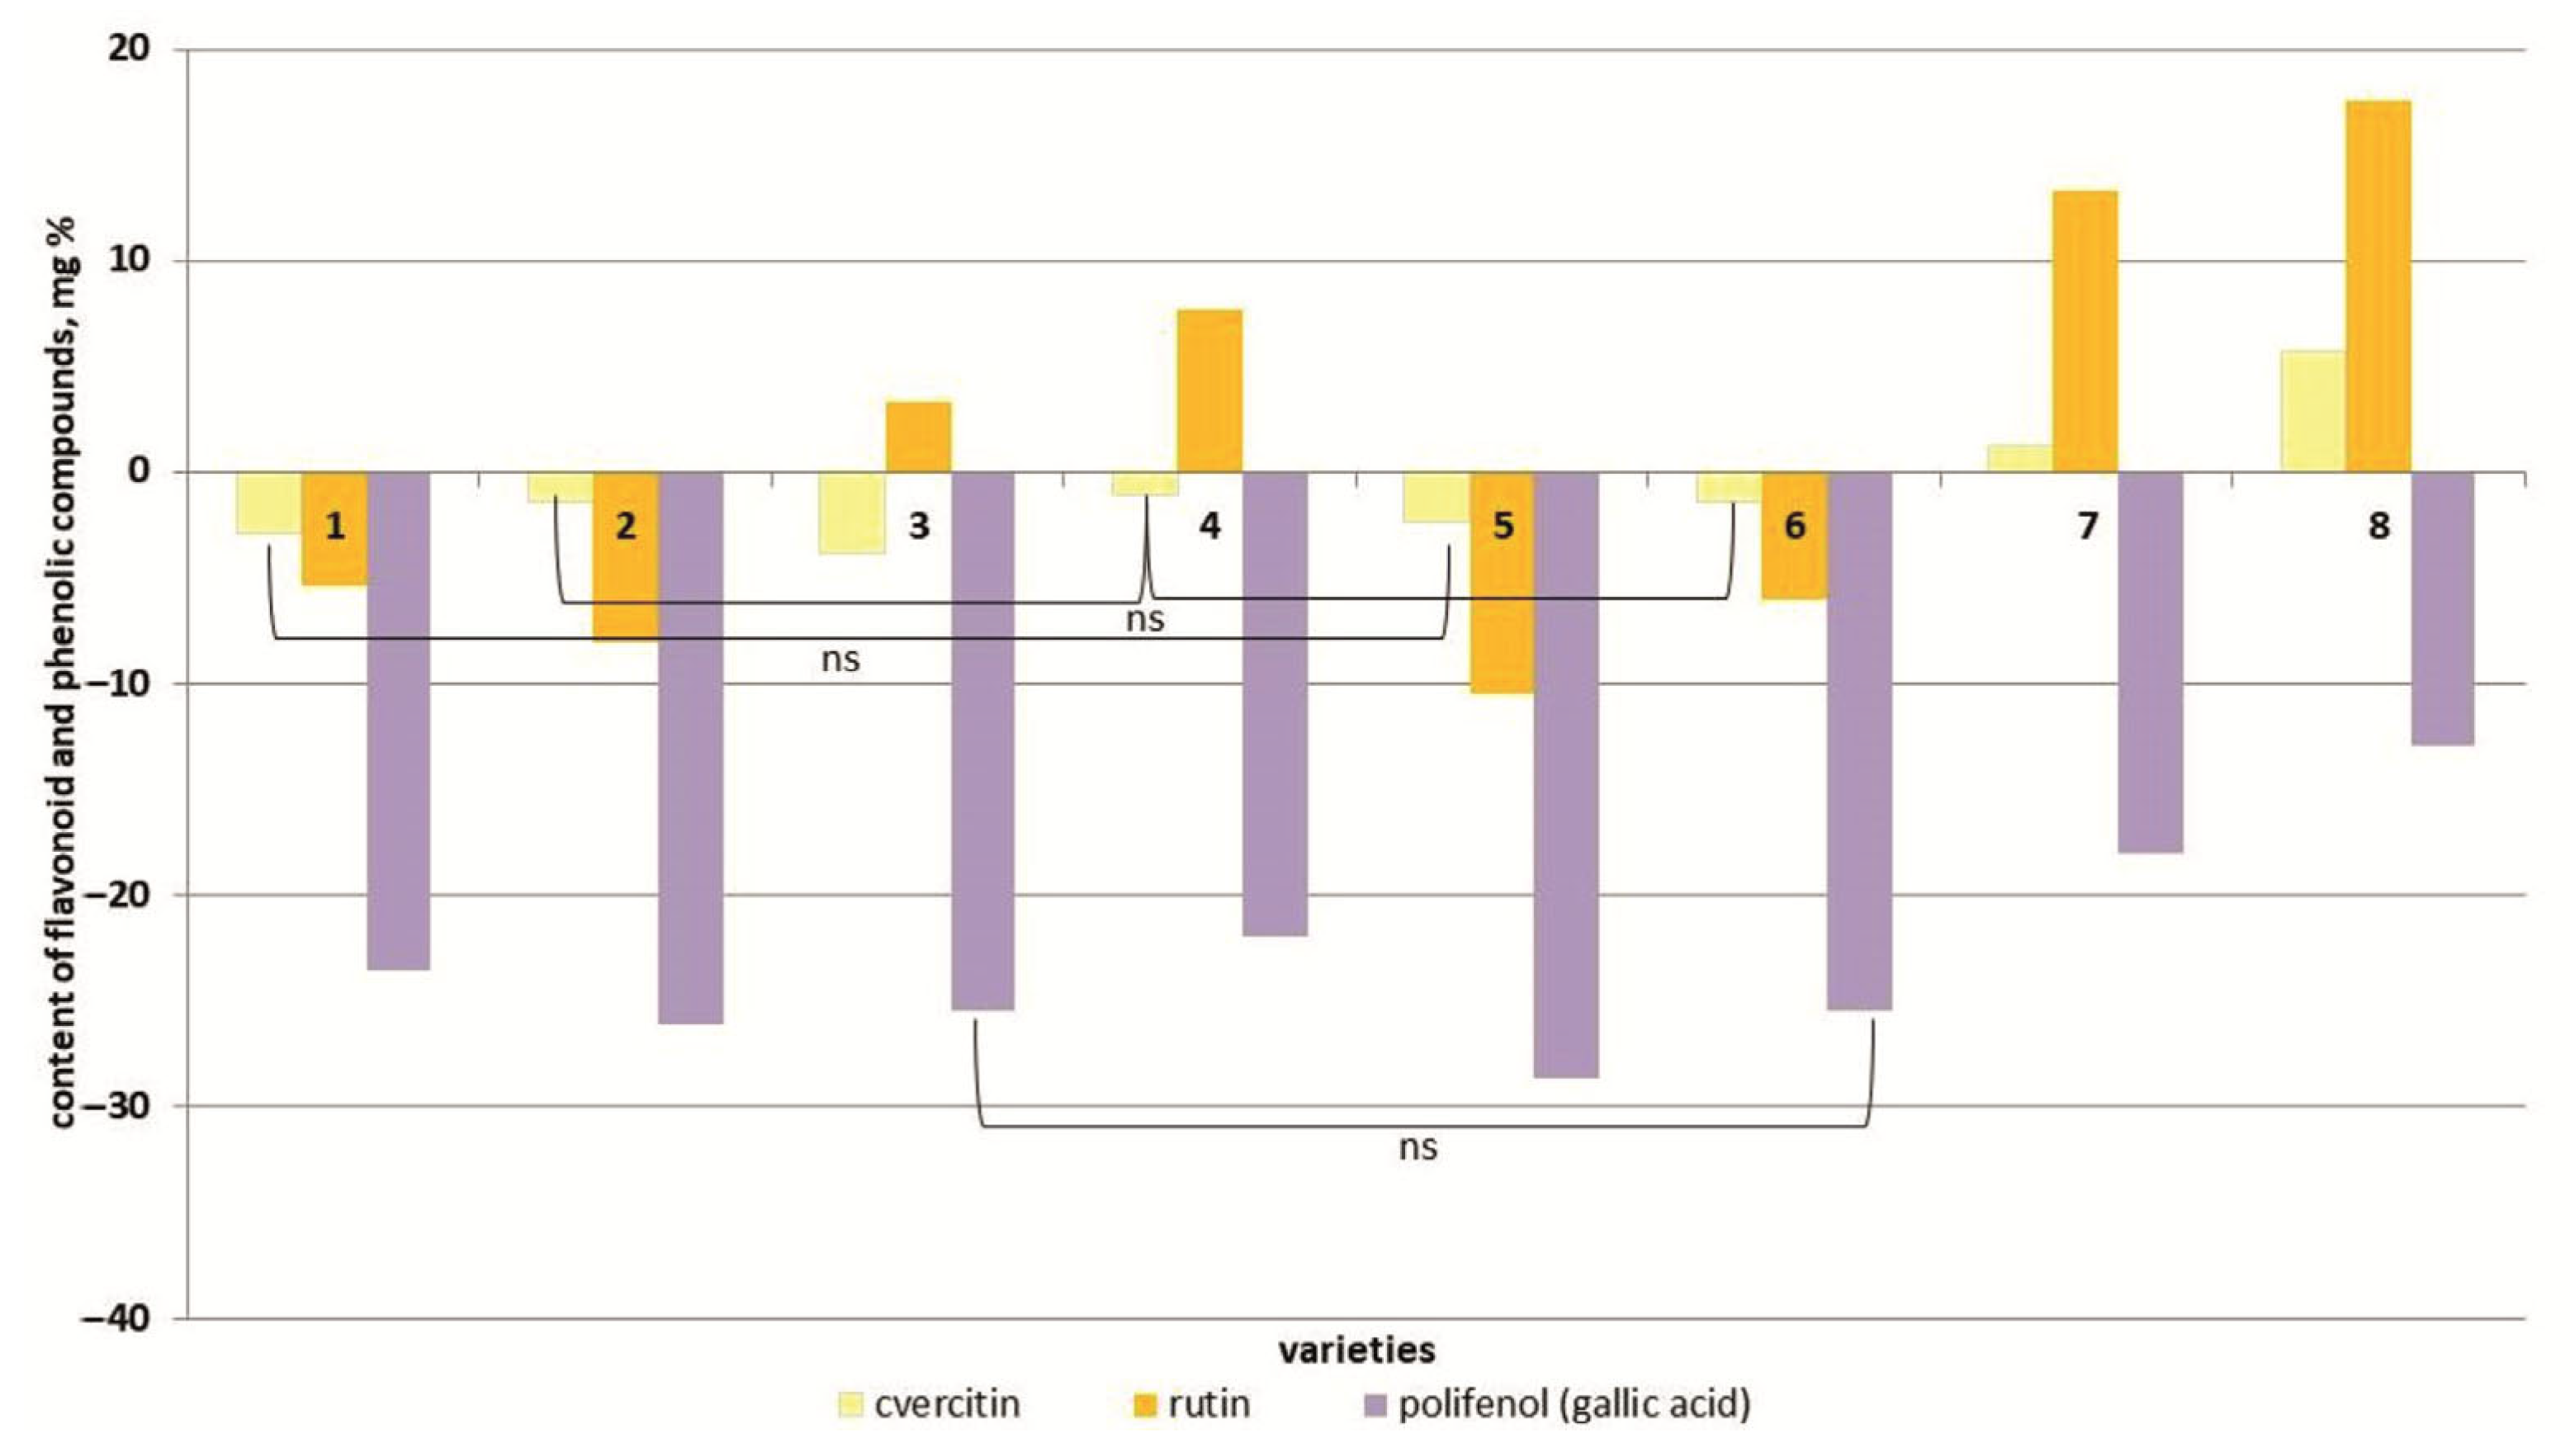
Salt stress caused a decrease in quercetin content in the plant tissues of six tomato cultivars (Figure 7 and Figure S6). And only in the two most salt-tolerant cultivars (Bych’e Serdce and Astrakhanskij) did the content of this flavonoid increase by 1.1 and 1.3 times, respectively, compared to the control.

Figure 7.
Content of flavonoid and phenolic compounds (quercetin, rutin, polifenol (gallic acid)) in tomato genotypes differing in salt tolerance under 150 mM NaCl. Legend: cv. Belyij Naliv—1, cv. Geya—2, cv. Recordsmen—3, cv. Paradigma—4, line YaLF—5, cv. Yur’evskij—6, cv. Bych’e Serdce—7, cv. Astrahanskij—8. The overall difference was significant according to Kruskal–Wallis test (p < 0.01). All pairwise differences were significant as well, except those designated in the plot as “ns” (not significant).
In general, a similar pattern was typical for the rutin dynamics. Only in the line YaLF and the cv. Paradigma was an increase in rutin content observed at 150 mM NaCl concentrations (Figure 7 and Figure S6). The content of phenolic compounds (gallic acid) in plant tissues of all tomato cultivars studied under salt stress decreased by 0.7–1.1 times compared to the control (Figure 7 and Figure S6).
Thus, the sensitive cvs. Geya and Belyi Naliv, as well as the YaLF line, showed a decrease in other additional indicators, such as chlorophyll a and b and quercetin. In these three genotypes, an increase in stomatal cell size of the lower epidermis was observed, in contrast to the group of resistant cultivars. In resistant cultivars such as Astrakhansky and Bych’e Serdce, as well as the cultivars Recordsman, Yur’evsky and Paradigma, the content of chlorophylls a and b and quercetin either increased with salinity or remained at the control level. The electrolyte leakage and the sodium and chlorine ions content, as well as the content of polyphenols, cannot serve as good criteria for salt tolerance since they changed equally in all genotypes studied.
4. Discussion
The physiological response to salinity often depends on the salt concentration, genotype characteristics and the combined effects of other biotic and abiotic factors [50,51]. They are often associated with stabilizing effects, not inhibiting plant growth but also retaining intracellular osmotic pressure [52,53]. When choosing a collection screening method, a researcher is often limited by the methods. For this reason, we reviewed some popular studies to understand whether they are sufficient for such an assessment [54,55,56].
In previous studies of salinity tolerance, various morphological and physiological characteristics were recommended to assess salt tolerance: the fresh and dry weight of shoots and roots [57,58], absorption of K+ and Na+ ions by plant tissues [59,60], ratios of K+/Na+ and Ca2+/Na+ ions [61] and the metabolite content [18].
4.1. Morphometric Indicators
During the vegetative stage, shoot and root growth may be impaired by salt stress due to low soil water potential, nutrient imbalances and ion toxicity [62]. Both decreases and increases in plant biomass have been shown to occur under salinity conditions. At the 7–8 leaf stage, wild-type tomato accessions showed a lower decrease in total plant biomass at 200 mM NaCl [58]. This is consistent with our data on changes in the biomass of tomato seedlings. A disturbance in water balance may be the cause of the observed differences in the fresh biomass of seedlings [62,63].
Water deficiency can result from a decrease in the water potential of the soil solution and limited water uptake by the roots. So, under salt stress, a decrease in the dry biomass of the roots of three rice varieties was shown compared to the control variant [64]. Our data on a decrease in root dry biomass in tomato genotypes are consistent with previously obtained results. A decrease in dry mass of plant tissue reflects an increase in energy expenditure for metabolism and a decrease in carbon input [65,66].
4.2. Determination of Electrolyte Leakage and Ion Absorption
The higher the degree of ion content in solution, the higher the electrolyte leakage from plant tissues is under salt stress conditions [66,67]. This explains the change in electrical conductivity shown in our work in tomato plants under salinity conditions compared to control ones. Electrolyte leakage made it possible to single out the cv. Astrakhanskij as the most tolerant, since no changes in this parameter were observed in it under experimental conditions. The remaining genotypes were divided into two groups: the tolerant group (Paradigma, Bych’e Serdce, Recordsmen and Yur’evskij) and the sensitive one, including the YaLF line and the cultivars Geya and Belyij Naliv. In the tolerant group, changes in electrical conductivity under the control and experimental conditions were minimal. In the sensitive group, electrical conductivity increased compared to the control conditions.
It is known that some salt-tolerant genotypes maintain low concentrations of sodium and chlorine ions in the cytoplasm, throwing the ions outside the plasma membrane [68]. Various studies have shown that salinity-sensitive genotypes contain more sodium and chlorine ions and less potassium. The opposite situation was observed in tolerant genotypes [69,70]. According to the results of the analysis of ion content, a tendency to an increase in the concentration of chlorine ions in all studied genotypes with the addition of salt was found. This was consistent with data obtained in wheat [71]. The content of potassium ions in the group of tolerant cultivars was higher than in the sensitive ones when compared with the cv. Astrakhanskij, in which the content of potassium ions was at the level of statistical error. The opposite trend with the accumulation of chlorine and sodium ions was characteristic of the group of sensitive genotypes. The changes in the content of salt ions in tomato leaves under salinity conditions shown in the study do not contradict previous works describing this parameter [69]. The decrease in ion content in tolerant genotypes can be explained by the removal of Na+ and Cl− ions from vacuoles with a concomitant blocking of the transport of Na+ ions into the cell [71].
4.3. Changes in the Leaf Stomata
Thus, stomata characteristics may contribute to the salt tolerance of crops [72,73]. We cannot yet offer this indicator as a clear criterion due to obvious contradictions in the tomato cv. Paradigma and the cv. Recordsmen. It can be assumed that in the future we will find a way to reveal the reason for the established differences. Stomatal conductance is often negatively affected by soil salinity levels [74,75]. Thus, a decrease in stomatal conductance can be influenced by low soil water potential caused by salinity. The study showed that changes in stomata are associated with minimal water loss by the plant under conditions of “physiological drought” [76].
4.4. Detection of Pigments
Measuring chlorophyll fluorescence is a good indicator of the effects of salt stress on the photosynthetic apparatus [77]. So, a decrease in the content of chlorophyll a and b, as well as the ratio between them, indicates inhibition of the development of the photosynthetic apparatus in plants under salinity conditions [78,79]. In the work of Singh et al. [80], it was found that with an increase in the level of NaCl, there was a decrease in both the total chlorophylls and chlorophyll b. In our work, similar results were obtained regarding the content of chlorophyll b, which was lower in most genotypes than in the control under salinity conditions. The total chlorophylls in the group of tolerant varieties tended to increase, which was presumably due to the demonstrated increase in the content of chlorophyll a in these plants. In the group of sensitive varieties, this indicator decreased, not only due to a decrease in the content of chlorophyll b but also due to a decrease in chlorophyll a. The results obtained may be caused by disturbances in metabolic processes, which lead to the activity of the chlorophyllase enzyme with a subsequent decrease in chlorophyll content [30]. A decrease in the values of these parameters may be due to the closure of stomata caused by water deficiency [81].
Plant carotenoids are lipophilic pigments and are widely found in nature [33]. Increased carotenoid concentrations in response to salinity are a variety-specific trait, and most salt-tolerant varieties exhibit increased carotenoid synthesis [82]. In our study, YaLF and Paradigma genotypes showed an increase in carotenoids content. The remaining genotypes showed either a decrease or no statistically significant difference from the control. This is consistent with the data obtained earlier and may be associated with a smaller contribution of carotenoids in response to salt stress [83].
4.5. Determination of Phenolic Compounds and Flavonoids
Phenolic compounds, including flavonoids, are the most abundant secondary metabolites present in plants [84]. Gallic acid, which has antioxidant properties, is one of the phenolic compounds found in plants at high concentrations under stressful conditions [85,86]. Our study showed a reduced content of polyphenol (gallic acid) compared to the control. Al Hassan et al. [83] analyzed total phenolics and total flavonoids in S. cerasiforme. They showed that total flavonoid content increased at all salt concentrations except 150 mM 25 days after treatment. However, growing plants in saline soils does not always lead to the accumulation of phenolic compounds or flavonoids [86].
Salinity has also been shown to lead to the synthesis of the most common flavanol, rutin. Accumulation of rutin in the cytosol removes or attenuates hydroxyl radical formation, thereby preventing K+ leakage. Quercetin, being a powerful antioxidant, ensures a plant’s resistance to a number of biotic and abiotic stresses [43]. With the addition of sodium chloride, an increase in quercetin content was observed in the varieties Bych’e Serdtse and Astrahanskij. An increase in rutin was only observed in two genotypes (YaLF and Paradigma). The increase in this parameter in resistant plants was consistent with the observations of Hichem et al. [87]. They reported a significant effect of salt stress on the total content of phenolic compounds and flavonoids in two varieties of corn (Zea mays L.). Changes in this indicator may be due to the fact that salt stress has both an inhibitory and stimulating effect on the synthesis of phenolic acids [88].
5. Conclusions
The classical methodology for assessing the sensitivity of new tomato genotypes to salt stress is carried out at the seedling stage. Two comparative tests form the basis of this methodology to assess potentially tolerant genotypes: increases in the biomass and water content of plant tissues, which often does not allow a proper evaluation of the salt tolerance of tomato plants.
Indicators such as the content of easily soluble salts, sodium and chlorine ions; the area of the stomata of the upper and lower epidermis of leaves; and indicators of the content of certain types of pigments, phenolic compounds and flavonoids can serve as a valuable addition to such an assessment procedure. These make it possible to more reliably diagnose tomato genotypes for tolerance/sensitivity to salt stress, evaluate the difference between sensitive and tolerant tomato genotypes, and further use this comprehensive assessment in breeding to evaluate tomato genotypes for salt tolerance.
Supplementary Materials
The following supporting information can be downloaded at: https://www.mdpi.com/article/10.3390/horticulturae10060598/s1, Figure S1: Shoot and root weight increase in 8 tomato varieties. Means ± standard errors followed by the same letter are not significantly different at α = 0.05 according to Duncan’s multiple range test (n = 30). Figure S2. Differences in water content among 8 tomato cultivars. Figure S3. Accumulation of easily soluble salts, sodium ions and chlorine in the plant tissues of various tomato genotypes, differing in salt tolerance. Means ± standard errors followed by the same letter are not significantly different at α = 0.05 according to Duncan’s multiple range test (n = 30). Figure S4. The effect of salinity on the stomata area in the upper epidermal leaf tissues and in the lower epidermal leaf tissues of various tomato genotypes that differ in salt tolerance. Means ± standard errors followed by the same letter are not significantly different at α = 0.05 according to Duncan’s multiple range test (n = 30). Figure S5. Content of chlorophyll a, b and carotenoids in tomato genotypes differing in salt tolerance under salinity conditions. Means ± standard errors followed by the same letter are not significantly different at α = 0.05 according to Duncan’s multiple range test (n = 30). Figure S6. Content of flavonoid and phenolic compounds (quercetin, rutin, polifenol) in tomato genotypes differing in salt tolerance under salinity conditions. Means ± standard errors followed by the same letter are not significantly different at α = 0.05 according to Duncan’s multiple range test (n = 30).
Author Contributions
Conceptualization, E.N.B.; formal analysis, L.R.B., I.A.C., M.R.K. and E.N.B.; investigation, L.R.B. and O.V.S.; data curation, L.R.B., I.A.C., M.R.K., A.A.G., O.V.S. and E.N.B.; writing—original draft preparation, L.R.B., O.V.S. and E.N.B.; writing—review and editing, L.R.B., A.A.G., O.V.S. and E.N.B.; visualization, L.R.B., A.A.G. and E.N.B.; supervision, I.A.C. and E.N.B. All authors have read and agreed to the published version of the manuscript.
Funding
The research was carried out within the state assignment theme No. 124030100058-4 (MBG RAS) and FGUM-2022-0003 (ARRIAB RAS) with support of the Ministry of Science and Higher Education of the Russian Federation. The APC was funded by the authors.
Data Availability Statement
The original contributions presented in the study are included in the article and Supplementary Materials, further inquiries can be directed to the corresponding author.
Acknowledgments
The authors thank Anatoly G. Bogdanov and the Center for Electron Microscopy in the Life Sciences, a Unique Scientific Installation for Three-Dimensional Electron Microscopy and Spectroscopy (Biological Faculty of M.V. Lomonosov Moscow State University).
Conflicts of Interest
The authors declare no conflicts of interest.
References
- Huang, L.; Lim, Z.; Liu, Q.; Pu, G.; Zhang, Y.; Li, J. Research on the adaptive mechanism of photosynthetic apparatus under salt stress: New directions to increase crop yield in saline soils. Ann. Appl. Biol. 2019, 175, 1–17. [Google Scholar] [CrossRef]
- Gupta, B.; Huang, B. Mechanism of salinity tolerance in plants: Physiological, biochemical, and molecular characterization. Int. J. Genom. 2014, 2014, 701596. [Google Scholar] [CrossRef] [PubMed]
- Suo, J.; Zhao, Q.; David, L.; Chen, S.; Dai, S. Salinity response in chloroplasts: Insights from gene characterization. Int. J. Mol. Sci. 2017, 18, 1011. [Google Scholar] [CrossRef] [PubMed]
- Achenbach, L.; Brix, H. Monitoring the short-term response to salt exposure of two genetically distinct Phragmites australis clones with different salinity tolerance levels. Am. J. Plant Sci. 2014, 5, 1098–1109. [Google Scholar] [CrossRef]
- Tester, M.; Davenport, R. Na+ tolerance and Na+ transport in higher plants. Ann. Bot. 2003, 91, 503–507. [Google Scholar] [CrossRef] [PubMed]
- Baranova, E.N.; Gulevich, A.A. Problems and perspectives of genetic engineering approach to the resolving of the tasks of plant resistance to salinity. Sel’skokhozyaistvennaya Biol. 2006, 41, 39–56. [Google Scholar]
- Thiam, S. Land Use Change, Modelling of Soil Salinity and Households’ Decisions under Climate Change Scenarios in the Coastal Agricultural Area of Senegal. Ph.D. Thesis, Kwame Nkrumah University of Science and Technology, Kumasi, Ghana, 2019. [Google Scholar]
- Sainju, U.M.; Dris, R. Sustainable production of tomato. In Crops: Quality, Growth, and Biotechnology; Dris, R., Ed.; WFL Publisher: Helsinki, Finland, 2006; pp. 190–216. [Google Scholar]
- Reina-Sanchez, A.; Romero-Aranda, R.; Cuartero, J. Plant Water Uptake and Water Use Efficiency of Greenhouse Tomato Cultivars Irrigated with Saline Water. Agric. Water Manag. 2005, 78, 54–66. [Google Scholar] [CrossRef]
- Maas, E.V. Salt Tolerance of Plants. Appl. Agric. Res. 1986, 1, 12–26. [Google Scholar]
- Ognev, V.V.; Tereshonkova, T.A.; Khovrin, A.N. Tomatoes for the south: Market needs and responses from domestic selection. Potatoes Veg. 2017, 11, 34–36. [Google Scholar]
- Li, Y. Physiological responses of tomato seedlings (Lycopersicon esculentum) to salt stress. Mod. Appl. Sci. 2009, 3, 171–176. [Google Scholar] [CrossRef]
- Gupta, A.; Shaw, B.P. Field-and laboratory-based methods of screening salt tolerant genotypes in rice. Crop Pasture Sci. 2021, 72, 85–94. [Google Scholar] [CrossRef]
- Seth, R.; Kendurkar, S. In vitro screening: An effective method for evaluation of commercial cultivars of tomato towards salinity stress. Int. J. Curr. Microbiol. Appl. Sci. 2015, 4, 725–730. [Google Scholar]
- Alian, A.; Altman, A.; Heuer, B. Genotypic difference in salinity and water stress tolerance of fresh market tomato cultivars. Plant Sci. 2000, 152, 59–65. [Google Scholar] [CrossRef]
- Dasgan, H.Y.; Aktas, H.; Abak, K.; Cakmar, I. Determination screening techniques to salinity tolerance in tomatoes and investigation of genotypes response. Plant Sci. 2002, 163, 695–703. [Google Scholar] [CrossRef]
- Singh, J.; Divakar Sastry, E.V.; Singh, V. Effect of salinity on tomato (Lycopersicon esculentum Mill.) during seed germination stage. Physiol. Mol. Biol. Plant. 2012, 18, 45–50. [Google Scholar] [CrossRef] [PubMed]
- Amini, F.; Ehsanpour, A.A. Response of tomato (Lycopersicon esculentum Mill.) cultivars to MS, water agar and salt stress in in vitro culture. Pak. J. Biol. Sci. 2006, 9, 170–175. [Google Scholar]
- Mohamed, A.N.; Ismail, M.R.; Kadir, M.A.; Saud, H.M. In vitro performances of hypocotyl and cotyledon explants of tomato cultivars under sodium chloride stress. Afr. J. Biotechnol. 2011, 10, 8757–8764. [Google Scholar]
- Bazihizina, N.; Barrett-Lennard, E.G.; Colmer, T.D. Plant growth and physiology under heterogeneous salinity. Plant Soil. 2012, 354, 1–19. [Google Scholar] [CrossRef]
- Ludwiczak, A.; Osiak, M.; Cárdenas-Pérez, S.; Lubińska-Mielińska, S.; Piernik, A. Osmotic stress or ionic composition: Which affects the early growth of crop species more? Agronomy 2021, 11, 435. [Google Scholar] [CrossRef]
- Singh, M.; Kumar, J.; Singh, S.; Singh, V.P.; Prasad, S.M. Roles of osmoprotectants in improving salinity and drought tolerance in plants: A review. Rev. Environ. Sci. Bio/Technol. 2015, 14, 407–426. [Google Scholar] [CrossRef]
- Anschütz, U.; Becker, D.; Shabala, S. Going beyond nutrition: Regulation of potassium homoeostasis as a common denominator of plant adaptive responses to environment. J. Plant Physiol. 2014, 171, 670–687. [Google Scholar] [CrossRef] [PubMed]
- Assaha, D.V.; Ueda, A.; Saneoka, H.; Al-Yahyai, R.; Yaish, M.W. The role of Na+ and K+ transporters in salt stress adaptation in glycophytes. Front. Physiol. 2017, 8, 509. [Google Scholar] [CrossRef] [PubMed]
- Shabala, S.; Hariadi, Y.; Jacobsen, S.E. Genotypic difference in salinity tolerance in quinoa is determined by differential control of xylem Na(+) loading and stomatal density. J. Plant Physiol. 2013, 170, 906–914. [Google Scholar] [CrossRef] [PubMed]
- Hussain, S.; Hussain, S.; Ali, B.; Ren, X.; Chen, X.; Li, Q.; Sagib, M.; Ahmad, N. Recent progress in understanding salinity tolerance in plants: Story of Na+/K+ balance and beyond. Plant Physiol. Biochem. 2021, 160, 239–256. [Google Scholar] [CrossRef]
- Silva, P.; Façanha, A.R.; Tavares, R.M.; Gerós, H. Role of tonoplast proton pumps and Na+/H+ antiport system in salt tolerance of Populus euphratica Oliv. J. Plant Growth Regul. 2010, 29, 23–34. [Google Scholar] [CrossRef]
- Teakle, N.L.; Tyerman, S.D. Mechanisms of Cl-transport contributing to salt tolerance. Plant Cell Environ. 2010, 33, 566–589. [Google Scholar] [CrossRef]
- Kunugi, M.; Satoh, S.; Ihara, K.; Shibata, K.; Yamagishi, Y.; Kogame, K.; Obokata, J.; Takabayashi, A.; Tanaka, A. Evolution of green plants accompanied changes in light-harvesting systems. Plant Cell Physiol. 2016, 57, 1231–1243. [Google Scholar] [CrossRef] [PubMed]
- Yadav, S.P.; Bharadwaj, R.; Nayak, H.; Mahto, R.; Singh, R.K.; Prasad, S.K. Impact of salt stress on growth, productivity and physicochemical properties of plants: A Review. Int. J. Chem. Stud. 2019, 7, 1793–1798. [Google Scholar]
- Amirjani, M.R. Effect of salinity stress on growth, sugar content, pigments and enzyme activity of rice. Int. J. Bot. 2011, 7, 73–81. [Google Scholar] [CrossRef]
- Nazarbeygi, E.; Yazdi, H.L.; Naseri, R.; Soleimani, R. The effects of different levels of salinity on proline and A-, B chlorophylls in canola. Am. Eurasian J. Agric. Environ. Sci. 2011, 10, 70–74. [Google Scholar]
- De, R.M.; Formentin, E.; Lo, F.S. Legume leaf senescence: A transcriptional analysis. Plant Signal. Behav. 2009, 4, 319–320. [Google Scholar]
- Edge, R.; McGarvey, D.J.; Truscott, T.G. The carotenoids as anti-oxidants—A review. J. Photochem. Photobiol. B Biol. 1997, 41, 189–200. [Google Scholar] [CrossRef] [PubMed]
- Cazzonelli, C.I. Carotenoids in nature: Insights from plants and beyond. Funct. Plant Biol. 2011, 38, 833–847. [Google Scholar] [CrossRef] [PubMed]
- Shabala, L.; Mackay, A.; Tian, Y.; Jacobsen, S.E.; Zhou, D.; Shabala, S. Oxidative stress protection and stomatal patterning as components of salinity tolerance mechanism in quinoa (Chenopodium quinoa). Physiol. Plant. 2012, 146, 26–38. [Google Scholar] [CrossRef] [PubMed]
- Albaladejo, I.; Meco, V.; Plasencia, F.; Flores, F.B.; Bolarin, M.C.; Egea, I. Unravelling the strategies used by the wild tomato species Solanum pennellii to confront salt stress: From leaf anatomical adaptations to molecular responses. Environ. Exp. Bot. 2017, 135, 1–12. [Google Scholar] [CrossRef]
- Shabala, S. Learning from halophytes: Physiological basis and strategies to improve abiotic stress tolerance in crops. Ann. Bot. 2013, 112, 1209–1221. [Google Scholar] [CrossRef] [PubMed]
- Škerget, M.; Kotnik, P.; Hadolin, M.; Hraš, A.R.; Simonič, M.; Knez, Ž. Phenols, proanthocyanidins, flavones and flavonols in some plant materials and their antioxidant activities. Food Chem. 2005, 89, 191–198. [Google Scholar] [CrossRef]
- Alzand, K.I.; Mohamed, M.A. Flavonoids: Chemistry, biochemistry and antioxidant activity. J. Pharm. Res. 2012, 5, 37. [Google Scholar]
- Musialik, M.; Kuzmicz, R.; Pawłowski, T.S.; Litwinienko, G. Acidity of hydroxyl groups: An overlooked influence on antiradical properties of flavonoids. J. Org. Chem. 2009, 74, 2699–2709. [Google Scholar] [CrossRef]
- Amalesh, S.; Das, G.; Das, S.K. Role of flavonoids in plants. Int. J. Pharm. Sci. Technol. 2011, 6, 12–35. [Google Scholar]
- Parvin, K.; Hasanuzzaman, M.; Bhuyan, M.H.M.B.; Mohsin, S.M.; Fujita, M. Quercetin mediated salt tolerance in tomato through the enhancement of plant antioxidant defense and glyoxalase systems. Plants 2019, 8, 247. [Google Scholar] [CrossRef] [PubMed]
- Bogoutdinova, L.R.; Baranova, E.N.; Kononenko, N.V.; Chaban, I.A.; Konovalova, L.N.; Gulevich, A.A.; Lazareva, E.M.; Khaliluev, M.R. Characteristics of root cells during in vitro rhizogenesis under action of NaCl in two tomato genotypes differing in salt tolerance. Int. J. Plant Biol. 2023, 14, 104–119. [Google Scholar] [CrossRef]
- Khaliluev, M.R.; Bogoutdinova, L.R.; Raldugina, G.N.; Baranova, E.N. A simple and effective bioassay method suitable to comparative in vitro study of tomato salt tolerance at early development stages. Methods Protoc. 2022, 5, 11. [Google Scholar] [CrossRef] [PubMed]
- Lichtenthaler, H.K.; Buschmann, C. Chlorophylls and carotenoids: Measurement and characterization by UV-VIS spectroscopy. Curr. Protoc. Food Anal. Chem. 2001, 1, F.4.3.1–F.4.3.8. [Google Scholar] [CrossRef]
- Nikolaeva, T.N.; Lapshin, P.V.; Zagoskina, N.V. Method for determining the total content of phenolic compounds in plant extracts with Folin-Denis reagent and Folin-Ciocalteu reagent: Modification and comparison. Russ. J. Bioorg. Chem. 2022, 48, 1519–1525. [Google Scholar] [CrossRef]
- Krasnyuk, I.I. Modifikatsiya metodiki kolichestvennogo opredeleniya flavonoidov v trave zolotarnika kanadskogo (Solidago canadensis). Vestn. Mosk. Univ. Ser. 2 Khimiya 2019, 60, 49–54. [Google Scholar]
- Albano Pérez, E.; Ruiz Téllez, T.; Sánchez Guzmán, J.M. Influence of physico-chemical parameters of the aquatic medium on germination of Eichhornia crassipes seeds. Plant Biol. 2011, 13, 643–648. [Google Scholar] [CrossRef] [PubMed]
- Ragaey, M.M.; Sadak, M.S.; Dawood, M.F.A.; Mousa, N.H.S.; Hanafy, R.S.; Latef, A. Role of signaling molecules sodium nitroprusside and arginine in alleviating salt-induced oxidative stress in wheat. Plants 2022, 11, 1786. [Google Scholar] [CrossRef] [PubMed]
- Sadak, M.S.; Ahmed, M.R.M. Physiological role of cyanobacteria and glycine betaine on wheat plants grown under salinity stress. Int. J. PharmTech Res. 2016, 9, 78–92. [Google Scholar]
- Baranova, E.N.; Gulevich, A.A. Asymmetry of plant cell divisions under salt stress. Symmetry 2021, 13, 1811. [Google Scholar] [CrossRef]
- Lopez-Mendez, A.G.; Rodriguez-Perez, J.E.; Mascorro-Gallardo, J.O.; Sahagun-Castellanos, J.; Lobato-Ortiz, R. NaCl tolerance during germination and seedling stages of tomato (Solanum lycopersicum L.) lines native to Mexico. Preprints 2023, 2023120538. [Google Scholar] [CrossRef]
- Aniskina, T.S.; Baranova, E.N.; Lebedev, S.V.; Reger, N.S.; Besaliev, I.N.; Panfilov, A.A.; Kryuchkova, V.A.; Gulevich, A.A. Unexpected effects of sulfate and sodium chloride application on yield qualitative characteristics and symmetry indicators of hard and soft wheat kernels. Plants 2023, 12, 980. [Google Scholar] [CrossRef]
- Gul, J.; Shah, S.H. Screening of chickpea genotypes against salinity stress in Petri dish environment. Pak. J. Sci. 2023, 75, 1–8. [Google Scholar]
- Negrao, S.; Schmockel, S.M.; Tester, M. Evaluating physiological responses of plants to salinity stress. Ann. Bot. 2017, 119, 1–11. [Google Scholar] [CrossRef] [PubMed]
- Pailles, Y.; Awlia, M.; Julkowska, M.; Passone, L.; Zemmouri, K.; Negrão, S.; Schmöckel, S.M.; Tester, M. Diverse traits contribute to salinity tolerance of wild tomato seedlings from the Galapagos Islands. Plant Physiol. 2020, 182, 534–546. [Google Scholar] [CrossRef]
- Cuartero, J.; Yeo, A.R.; Flowers, T.J. Selection of donors for salt-tolerance in tomato using physiological traits. New Phytol. 1992, 121, 63–69. [Google Scholar] [CrossRef]
- Foolad, M.R. Genetic analysis of salt tolerance during vegetative growth in tomato, Lycopersicon esculentum Mill. Plant Breed. 1996, 115, 245–250. [Google Scholar] [CrossRef]
- Turhan, A.; Seniz, V. Salt tolerance during vegetative growth in cross of tomato and effect of cytoplasm in response to salt tolerance. Bulg. J. Agric. Sci. 2012, 18, 207–218. [Google Scholar]
- Tal, M.; Shannon, M.C. Salt tolerance in the wild relatives of the cultivated tomato: Responses of Lycopersicon esculentum, L. cheesmanii, L. peruvianum, Solanum pennellii and F1 hybrids to high salinity. Aust. J. Plant Physiol. 1983, 10, 109–117. [Google Scholar] [CrossRef]
- Sun, J.; Chen, S.; Dai, S.; Wang, R.; Li, N.; Shen, X.; Zhou, X.; Lu, C.; Zheng, X.; Hu, Z.; et al. NaCl-induced alternations of cellular and tissue ion fluxes in roots of salt-resistant and salt-sensitive poplar species. Plant Physiol. 2009, 149, 1141–1153. [Google Scholar] [CrossRef]
- Geilfus, C.M. Chloride: From nutrient to toxicant. Plant Cell Physiol. 2018, 59, 877–886. [Google Scholar] [CrossRef] [PubMed]
- Puvanitha, S.; Mahendran, S. Effect of salinity on plant height, shoot and root dry weight of selected rice cultivars. Schol. J. Agric. Vet. Sci. 2017, 4, 126–131. [Google Scholar]
- Netondo, G.W.; Onyango, J.C.; Beck, E. Sorghum and salinity. Crop Sci. 2004, 44, 797–805. [Google Scholar]
- Corwin, D.L.; Lesch, S.M. Application of soil electrical conductivity to precision agriculture: Theory, principles, and guidelines. Agron. J. 2003, 95, 455–471. [Google Scholar] [CrossRef]
- Corwin, D.L.; Yemoto, K. Salinity: Electrical conductivity and total dissolved solids. Soil Sci. Soc. Am. J. 2020, 84, 1442–1461. [Google Scholar] [CrossRef]
- Shi, H.; Lee, B.H.; Wu, S.J.; Zhu, J.K. Overexpression of a plasma membrane Na+/H+ antiporter gene improves salt tolerance in Arabidopsis thaliana. Nat. Biotechnol. 2003, 21, 81–85. [Google Scholar] [CrossRef] [PubMed]
- Saddiq, M.S.; Afzal, I.; Basra, S.M.; Ali, Z.; Ibrahim, A.M. Sodium exclusion is a reliable trait for the improvement of salinity tolerance in bread wheat. Arch. Agron. Soil Sci. 2018, 64, 272–284. [Google Scholar] [CrossRef]
- Saddiq, M.S.; Iqbal, S.; Hafeez, M.B.; Ibrahim, A.M.; Raza, A.; Fatima, E.M.; Baloch, H.; Jahanzaib; Woodrow, P.; Ciarmiello, L.F. Effect of salinity stress on physiological changes in winter and spring wheat. Agronomy 2021, 11, 1193. [Google Scholar] [CrossRef]
- Bhusal, N.; Lee, M.; Lee, H.; Adhikari, A.; Han, A.R.; Han, A.; Kim, H.S. Evaluation of morphological, physiological, and biochemical traits for assessing drought resistance in eleven tree species. Sci. Total Environ. 2021, 779, 146466. [Google Scholar] [CrossRef]
- Kimura, H.; Hashimoto-Sugimoto, M.; Iba, K.; Terashima, I.; Yamori, W. Improved stomatal opening enhances photosynthetic rate and biomass production in fluctuating light. J. Exp. Bot. 2020, 71, 2339–2350. [Google Scholar] [CrossRef]
- Liu, X.; Fan, Y.; Mak, M.; Babla, M.; Holford, P.; Wang, F.; Chen, G.; Scott, G.; Wang, G.; Shabala, S.; et al. QTLs for stomatal and photosynthetic traits related to salinity tolerance in barley. BMC Genom. 2017, 18, 9. [Google Scholar] [CrossRef] [PubMed]
- Soltabayeva, A.; Ongaltay, A.; Omondi, J.O.; Srivastava, S. Morphological, physiological and molecular markers for salt-stressed plants. Plants 2021, 10, 243. [Google Scholar] [CrossRef] [PubMed]
- Rasouli, F.; Kiani-Pouya, A.; Shabala, L.; Li, L.; Tahir, A.; Yu, M.; Hedrich, R.; Chen, Z.; Wilson, R.; Zhang, H.; et al. Salinity effects on guard cell proteome in Chenopodium quinoa. Int. J. Mol. Sci. 2021, 22, 428. [Google Scholar] [CrossRef] [PubMed]
- Dourado, P.R.M.; de Souza, E.R.; Santos, M.A.D.; Lins, C.M.T.; Monteiro, D.R.; Paulino, M.K.S.S.; Schaffer, B. Stomatal regulation and osmotic adjustment in sorghum in response to salinity. Agriculture 2022, 12, 658. [Google Scholar] [CrossRef]
- Allakhverdiev, S.I.; Sakamoto, A.; Nishiyama, Y.; Inaba, M.; Murata, N. Ionic and osmotic effects of NaCl-induced inactivation of photosystems I and II in Synechococcus sp. Plant Physiol. 2000, 123, 1047–1056. [Google Scholar] [CrossRef] [PubMed]
- Abadía, A.; Belkhodja, R.; Morales, F.; Abadía, J. Effects of salinity on the photosynthetic pigment composition of barley (Hordeum vulgare L.) grown under a triple-line-source sprinkler system in the field. J. Plant Physiol. 1999, 154, 392–400. [Google Scholar] [CrossRef]
- Shahba, Z.; Baghizadeh, A.; Yosefi, M. The salicylic acid effect on the tomato (Lycopersicum esculentum Mill.) germination, growth and photosynthetic pigment under salinity stress (NaCl). J. Stress Physiol. Biochem. 2010, 6, 4–16. [Google Scholar]
- Singh, M.; Singh, V.P.; Prasad, S.M. Responses of photosynthesis, nitrogen and proline metabolism to salinity stress in Solanum lycopersicum under different levels of nitrogen supplementation. Plant Physiol. Biochem. 2016, 109, 72–83. [Google Scholar] [CrossRef] [PubMed]
- Misra, A.N.; Latowski, D.; Strzalka, K. The xanthophyll cycle activity in kidney bean and cabbage leaves under salinity stress. Russ. J. Plant Physiol. 2006, 53, 102–109. [Google Scholar] [CrossRef]
- Aryal, S.; Baniya, M.K.; Danekhu, K.; Kunwar, P.; Gurung, R.; Koirala, N. Total phenolic content, flavonoid content and antioxidant potential of wild vegetables from Western Nepal. Plants 2019, 8, 96. [Google Scholar] [CrossRef]
- Al Hassan, M.; Martinez Fuertes, M.; Ramos Sanchez, F.J.; Vicente, O.; Boscaiu, M. Effects of salt and water stress on plant growth and on accumulation of osmolytes and antioxidant compounds in cherry tomato. Not. Bot. Horti Agrobot. 2015, 43, 1–11. [Google Scholar] [CrossRef]
- Weidner, S.; Król, A.; Karamać, M.; Amarowicz, R. Phenolic compounds and the antioxidant properties in seeds of green-and yellow-podded bean (Phaseolus vulgaris L.) varieties. CyTA J. Food 2018, 16, 373–380. [Google Scholar] [CrossRef]
- Farghaly, F.A.; Salam, H.K.; Hamada, A.M.; Radi, A.A. The role of benzoic acid, gallic acid and salicylic acid in protecting tomato callus cells from excessive boron stress. Sci. Hortic. 2021, 278, 109867. [Google Scholar] [CrossRef]
- Ismail, H.; Maksimović, J.D.; Maksimović, V.; Shabala, L.; Živanović, B.D.; Tian, Y.; Jacobsen, S.-E.; Shabala, S. Rutin, a flavonoid with antioxidant activity, improves plant salinity tolerance by regulating K+ retention and Na+ exclusion from leaf mesophyll in quinoa and broad beans. Funct. Plant Biol. 2015, 43, 75–86. [Google Scholar]
- Hichem, H.; Mounir, D. Differential responses of two maize (Zea mays L.) varieties to salt stress: Changes on polyphenols composition of foliage and oxidative damages. Ind. Crops Prod. 2009, 30, 144–151. [Google Scholar] [CrossRef]
- Sharma, A.; Shahzad, B.; Rehman, A.; Bhardwaj, R.; Landi, M.; Zheng, B. Response of phenylpropanoid pathway and the role of polyphenols in plants under abiotic stress. Molecules 2019, 24, 2452. [Google Scholar] [CrossRef]


Disclaimer/Publisher’s Note: The statements, opinions and data contained in all publications are solely those of the individual author(s) and contributor(s) and not of MDPI and/or the editor(s). MDPI and/or the editor(s) disclaim responsibility for any injury to people or property resulting from any ideas, methods, instructions or products referred to in the content. |
© 2024 by the authors. Licensee MDPI, Basel, Switzerland. This article is an open access article distributed under the terms and conditions of the Creative Commons Attribution (CC BY) license (https://creativecommons.org/licenses/by/4.0/).