Article

Exploring the Genomic Landscape: A Comprehensive Analysis of the Genetic Diversity and Population Structure of Thai Tomato Germplasm through Whole-Genome Sequencing (WGS)

by
Arweewut Yongsuwan
1,2,†,
Wasin Poncheewin
3,†,
Wittaya Sastawittaya
4,
Akarachai Somkul
4,
Burin Thunnom
3,
Wanchana Aesomnuk
5,
Anjana Bhunchoth
3,
Namthip Phironrit
3,
Bencharong Phuangrat
3,
Ratree Koohapitakthum
3,
Rungnapa Deeto
3,
Nuchnard Warin
3,
Samart Wanchana
3,
Siwaret Arikit
5,6,
Orawan Chatchawankanphanich
3,
Paweena Chuenwarin
7,* and
Vinitchan Ruanjaichon
3,*
1
Center for Agricultural Biotechnology, Kasetsart University, Kamphaeng Saen Campus, Nakhon Pathom 73140, Thailand
2
Center of Excellence on Agricultural Biotechnology—(AG-BIO/MHESI), Bangkok 10900, Thailand
3
National Center for Genetic Engineering and Biotechnology (BIOTEC), National Science and Technology Development Agency (NSTDA), Pathum Thani 12120, Thailand
4
Tropical Vegetable Research Center, Department of Horticulture, Faculty of Agriculture at Kamphaeng Saen, Kasetsart University, Kamphaeng Saen Campus, Nakhon Pathom 73140, Thailand
5
Rice Science Center, Kasetsart University, Nakhon Pathom 73140, Thailand
6
Department of Agronomy, Faculty of Agriculture at Kamphaeng Saen, Kasetsart University, Kamphaeng Saen Campus, Nakhon Pathom 73140, Thailand
7
Department of Horticulture, Faculty of Agriculture at Kamphaeng Saen, Kasetsart University, Kamphaeng Saen Campus, Nakhon Pathom 73140, Thailand
*
Authors to whom correspondence should be addressed.
These authors contributed equally to this work.
Horticulturae 2024, 10(6), 602; https://doi.org/10.3390/horticulturae10060602
Submission received: 22 April 2024 / Revised: 23 May 2024 / Accepted: 5 June 2024 / Published: 7 June 2024

Abstract

:
Tomatoes (Solanum lycopersicum L.) represent a valuable crop species cultivated on a global scale, with Thailand playing a notable role in Southeast Asia’s agricultural landscape. However, a comprehensive understanding of the genetic underpinnings, population dynamics, and genetic correlations among tomato cultivars within Thailand remains relatively nascent. This study conducted an extensive analysis of 283 tomato accessions sourced from Thailand’s largest germplasm repository, employing approximately 2.4 million single-nucleotide polymorphisms (SNPs) obtained through whole-genome sequencing (WGS). The results of the genetic diversity assessment demonstrate a consistent delineation of groups, as indicated by UPGMA clustering, revealing five distinct clusters, while population structure analysis unveils twelve subpopulations. These findings underscore the limited genetic reservoir within Thai tomato germplasm, providing valuable insights for germplasm management strategies and offering a promising avenue for the refinement of breeding programs aimed at enhancing tomato genetics.

1. Introduction

Tomatoes (Solanum lycopersicum L.) are recognized as a highly significant global crop, extensively cultivated for their nutritional value, versatile gastronomic uses, and as a model organism [1] (https://www.fao.org/faostat/, accessed on 19 February 2024). Within the context of Thailand, with its diverse climatic conditions, tomatoes have assumed a pivotal role in agricultural production, establishing Thailand as a prominent seed contributor in Southeast Asia. Notably, Thailand’s tomato market is rapidly growing and engages in exports to various international partners, such as Myanmar, Laos, Singapore, Malaysia, and Cambodia. The aggregate area of tomato cultivation accounts for 22% of the total agricultural area, spanning approximately 6.3 thousand hectares and resulting in a yield of over 137 thousand tons of tomatoes in 2022 (Office of Agricultural Economics, Bangkok, Thailand).
In order to maintain Thailand’s competitiveness and adapt to evolving factors, such as consumer demands and climate change, the development of new tomato varieties is essential. In the field of crop breeding, understanding the genetic diversity and population structure of the available tomato varieties in Thailand and globally is crucial for effective germplasm management and conservation, and especially for the development of breeding programs. Previous studies have shown that the success of improved cultivars is contingent upon the diversification of existing genetic resources [2,3,4,5,6,7,8,9]. Genetic diversity refers to the range of variation in genetic makeup within a species based on genetic similarities and differences, while population structure can provide insights into the genetic relationships among different varieties and help identify distinct populations or subgroups. This knowledge provides the raw material for breeding programs targeted at improving valuable traits present within specific populations, such as yield, quality, and tolerance to biotic and abiotic stresses [10,11,12].
Advancements in sequencing and genotyping technologies have revolutionized the study of genetic diversity in living organisms, including the tomato. Various technologies have been widely utilized in previous studies to investigate this topic, such as Simple Sequence Repeat (SSR), Random Amplified Polymorphic DNA (RAPD), Inter-Simple Sequence Repeat (ISSR), insertion–deletion (InDel), genotype by sequencing (GBS), and others, including whole-genome sequencing (WGS) [13,14,15,16,17,18,19,20,21]. Despite being the most computationally intensive approach, WGS provides the most comprehensive genetic content and has served as an important early step towards the utilization of more precise genome-wide association studies (GWAS), which directly leads to Marker-Assisted Selection (MAS), capable of drastically decreasing the time and cost of the seed-to-seed cycle in conventional methods.
Prior investigations in Thailand have extensively delved into the genetic characteristics of rice [22,23,24]. However, there is a scarcity of data regarding the genetic landscape of tomato cultivars, despite their significant agricultural importance. Consequently, this study focuses on elucidating the population structure of 283 tomato accessions, categorized into two major groups: cherry and table varieties, sourced from the largest genetic collection in Thailand, comprising both Thai and international cultivars. Single-nucleotide polymorphism (SNP) markers, derived from whole-genome sequencing (WGS), were utilized to infer subpopulations. The results provide valuable insights into the germplasm of Thai tomatoes, thereby contributing to enhanced germplasm characterization, conservation, and utilization in the fields of tomato genetics and breeding.

2. Materials and Methods

2.1. Plant Materials

A total of 283 tomato accessions were obtained from the Tropical Vegetable Research Center (TVRC) at Kasetsart University, Kamphaeng Saen campus. The panel comprises two primary categories: 145 cherry tomatoes and 138 table tomatoes. The collection is also labeled by source, with 37.81% labeled as Thai varieties, denoted as “TH”, and 62.19% labeled as international varieties, denoted as “INT”, including some with a known origin spanning across 20 different sources (Figure 1). Detailed information regarding the accessions is reported in Table S1.

2.2. DNA Extraction

Genomic DNA of all accessions was extracted from young tomato leaves (approximately 1–2 weeks after germination) using the Dneasy Plant Mini Kit (QIAgen, Hilden, Germany). The concentration of the extracted DNA was assessed using a NanoDrop 8000 (Thermo Scientific, Waltham, MA, USA), and the DNA samples with a concentration of more than 50 nanograms per microliter (ng/µL) were selected. The quality of the extracted DNA was assessed using agarose gel electrophoresis.

2.3. Sequencing and SNP Discovery

The raw whole-genome sequencing data were obtained using Illumina’s Hiseq2500 and NovaSeq600 platforms. The pair-ended cleaned reads underwent alignment with the International Tomato Genome Sequencing Project version SL4.0 using the Burrow–Wheeler aligner (BWA) v2.2.2.9 and Samtools [25,26]. GATK HaplotypeCaller v3.8-1 was used for variant calling [27]. Post-processing involved excluding the InDels and multiallelic sites, retaining SNPs without missing data, and a minor allele frequency (MAF) of more than 5%, as measured using VCFtools version 0.1.17 [28]. Additionally, transition/transversion (Ts/Tv) ratio and density calculations were conducted. SNP density was visualized using the CMplot package version 4.4.3 in R [29].

2.4. Estimation of Population Parameters and Genetic Differentiation Analysis

The population parameters of the 283 tomato accessions were analyzed. Linkage disequilibrium (LD) was assessed and visualized using PopLDdecay [30], with a maximum distance of 100 Mb considered for the calculation. For clarity in visualization, bin1 of 1 Mb and bin2 of 10 Mb were employed. VCF-kit facilitated the conversion of the VCF file to FASTA format [31]. Phylogenetic distances were calculated using MEGA 11, employing the Maximum Composite Likelihood method and inference through the Unweighted Pair Group Method with Arithmetic Mean (UPGMA) approach [32]. The determination of the optimal number of clusters involved a comprehensive analysis using Multidimensional Scaling (MDS), K-means clustering, and silhouette approaches. Subpopulation (K) assessments were conducted through fastStructure, encompassing K values ranging from 1 to 15 [33]. The optimal number of K was determined utilizing the “chooseK.py” script from the fastStructure guidelines. The number of SNPs was pruned using plink1.9 [34]. The genetic differences between the two subpopulations of Thai and international varieties were calculated using HIERFSTAT version 0.5–11 [35]. An Analysis of Molecular Variance (AMOVA) was calculated using POPPR version 2.9.4 [36].

3. Results

3.1. DNA Extraction, Sequencing and SNP Discovery

The purity of the extracted DNA from all tomato accessions was assessed using the OD 260/280 ratio, resulting in values between 1.8 and 2.0. DNA concentrations ranged between 30 and 150 nanograms per microliter (ng/µL) (Table S1). Both measurements indicated that the extracted DNA was suitable for whole-genome sequencing.
The whole-genome sequencing of all accessions yielded approximately 32 billion raw reads, with an average of 116,260,658 ± 10,839,534 reads per individual, providing coverage of approximately 22× compared with the reference genome. The average base pair count per individual was approximately 17.55 ± 2 Gb. Quality assessment revealed Phred scores of 99.94% at Q20 and 96.83% at Q30, with an average GC content of 35.73 ± 0.69%. Alignment of reads with the reference genome achieved an average mapping rate of 97.93%.
Genetic variation analysis identified approximately 16.7 million variation sites, comprising 14.7 million SNPs and 1.9 million InDels. Following stringent filtering, 2,440,708 high-quality SNPs were retained, with a Ts/Tv ratio of 1.26. The average SNP density was 3.14 per kb, with chromosome 5 exhibiting the highest concentration (406,953 SNPs) and chromosome 3 the lowest (47,783 SNPs). A graphical representation of SNP density per chromosome is presented in Figure 2.

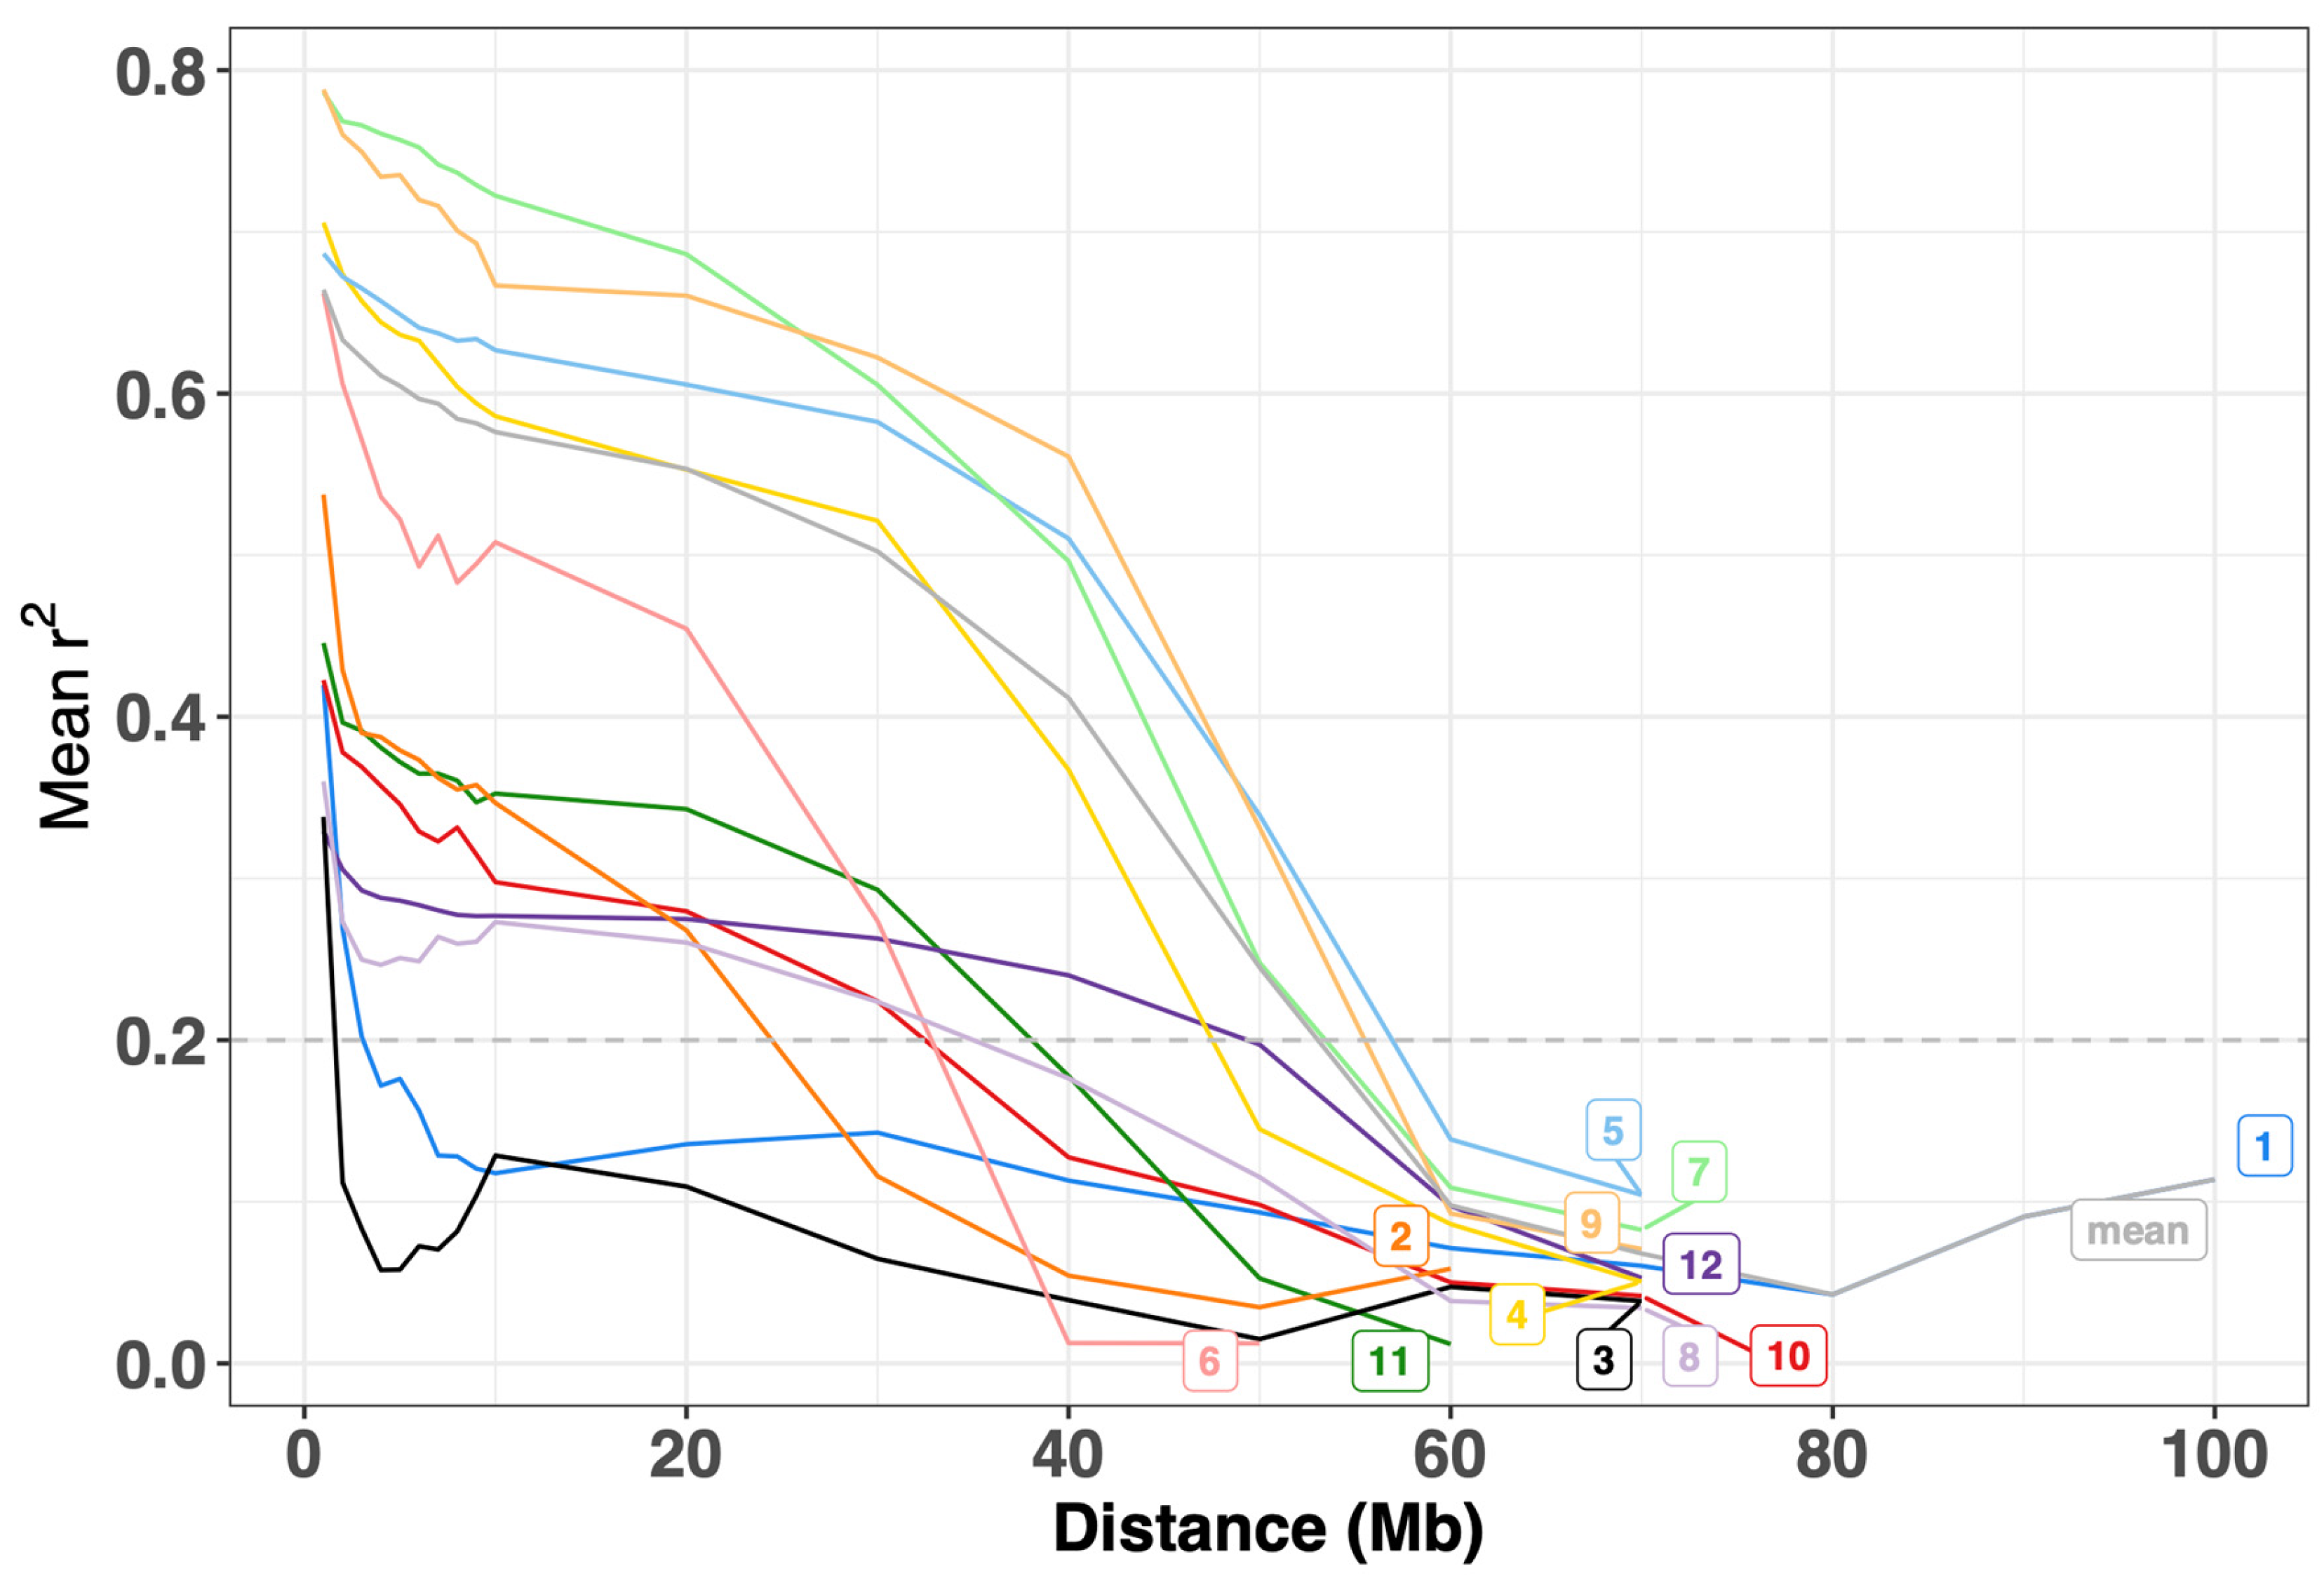
3.2. Linkage Disequilibrium (LD) Decay

The filtered SNP dataset was used to calculate the intra-chromosomal marker pairs’ linkage disequilibrium (LD), aiming to ascertain the chromosome-wide average LD decay rate across all 12 chromosomes. The result reveals a gradual LD decay rate, denoted by a substantial r2 value (r2 > 0.2), covering considerable distances. Notably, the minimum LD decay distance is observed on chromosome 3 at approximately 2 Mb, while the maximum extends to approximately 60 Mb on chromosomes 5, 7, and 9, along with the overall average (“mean”), as shown in Figure 3.

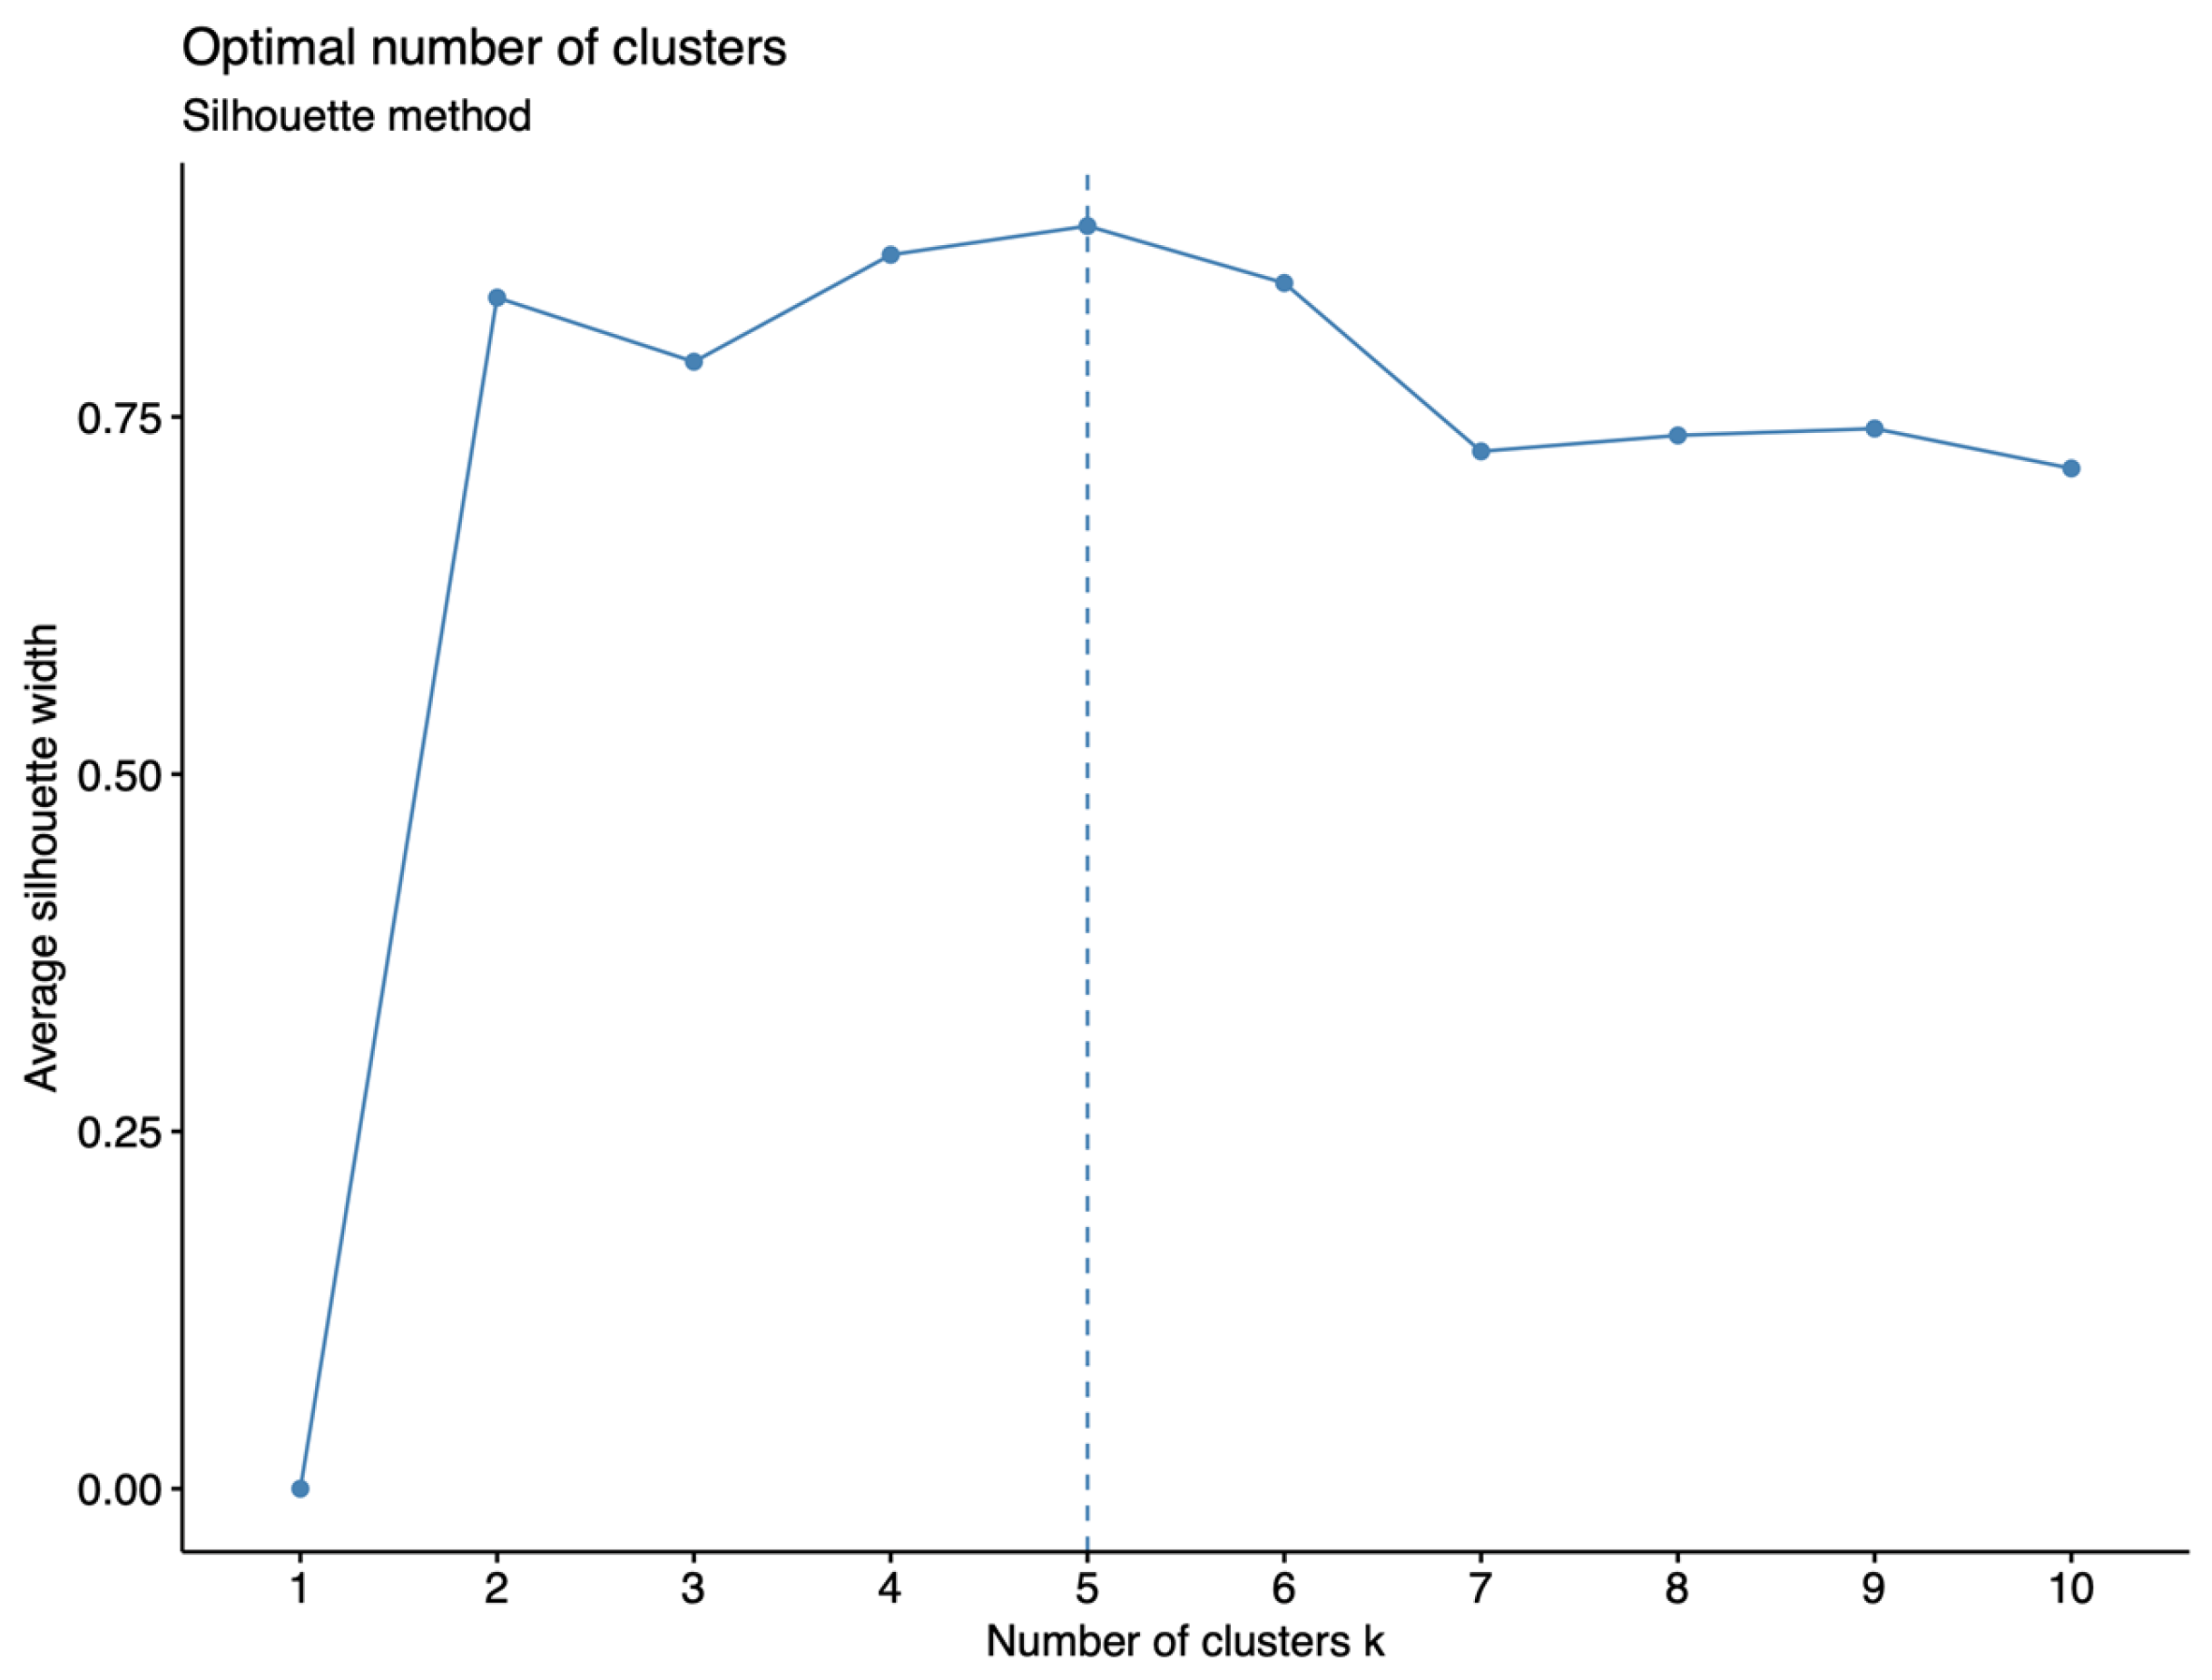
3.3. Genetic Diversity and Population Structure

The collection is labeled based on two criteria: fruit type and source. In terms of fruit type, there are 145 cherry tomatoes and 138 table tomatoes. Regarding the sources, there are 107 Thai varieties and 176 international varieties. A summary of the data analysis is presented in Figure 4, which is divided into two major parts: genetic diversity and population structure (Table S1).
Genetic diversity is represented by the innermost dendrogram, with bootstrap values at all branches averaging 97.09 ± 6.6, signifying a high level of reliability. The dendrogram illustrates that the 283 tomato accessions are divided into 5 main groups (Figure 5), and the topology aligns coherently with the population structure. The group composition includes 38, 23, 168, 28, and 26 tomato accessions, ranging from Group 1 to 5, respectively. However, these clusters do not fully explain the categorized fruit types, whose names are color-coded differently, with red representing cherry and blue for table varieties.
The analysis of the population structure reveals an optimal K value of 12. Utilizing a probability threshold of 0.8, over half of the accessions (52.3%) were assigned to major groups (Q1–Q12), as outlined in Table 1. Excluding the admix group, Q4 comprises the largest membership with 42 accessions, representing cherry and table varieties at 14 and 28 accessions, respectively. Cherry-predominant clusters include Q7, Q8, and Q9, which are the top three groups exclusively associated with this variety. Conversely, Q2 is predominantly associated exclusively with table varieties.

3.4. Principal Component Analysis (PCA)

The Principal Component Analysis (PCA) result aligns consistently with the observed population structure, evident in the close proximity of individuals within each major group and the dispersion of distinct fruit types (Figure 6). The variances explained in PC1 and PC2 are 26.46% and 12.81%, respectively. Major groups Q3, Q7, and Q12 are distinctively separated from the other groups based along PC1, with a further separation of Q9 and Q12 along PC2.

3.5. Analysis of Population Differentiation and Analysis of Molecular Variance (AMOVA)

For further statistical analyses, the number of SNPs was pruned using a LD of 60 MB, as indicated in the previous analysis, resulting in 6,558 SNPs remaining. This SNP set was then subjected to AMOVA and Weir and Cockerham’s FST to calculate the differences between the two subpopulations of Thai and international varieties. The AMOVA results show that the two subpopulations were extremely close, with only 0.7% variation caused by differences among populations, while the remaining 99.3% was caused by differences within populations (Table 2). The results were corroborated by the average genetic differentiation coefficient (FST) between the two subpopulations, calculated to be 0.0009022445.

4. Discussion

Thailand holds a significant role as a major exporter of tomato seeds in Southeast Asia, with a rapidly growing market for fresh tomatoes. The genetic diversity and population structure of tomatoes are pivotal in plant breeding for devising efficient breeding programs and ensuring sustainable production of tomatoes [8]. Despite numerous studies addressing this aspect, until recent times, Thai varieties were overlooked [17,37,38]. Consequently, our comprehension of the genetic diversity and resources within Thai tomatoes remains considerably restricted. This comprehensive investigation seeks to address this gap by elucidating the genetic diversity and population structure within the largest whole-genome sequenced collection of Thai tomatoes.
The collection encompasses a total of 283 tomato accessions, encompassing two distinct fruit types, cherry and table, with 145 and 138 accessions, respectively. These are accompanied by a diverse array of associated metadata, including information on origin, pathogenic resistance, particularly for Thai pathovars, and morphological characteristics. Whole-genome sequencing of all accessions yielded high-quality genomes, with an average coverage of 22x and a mapping rate of 97%. This process generated a dataset of 2.4 million high-quality SNPs after rigorous filtering, establishing one of the densest SNP datasets reported for tomatoes [18,20,39,40]. To our knowledge, this represents the most comprehensive compilation of tomato information in Thailand, providing a fundamental framework for future breeding initiatives and academic inquiries into the genetic composition of Thai tomato cultivars.
The linkage disequilibrium (LD) analysis reveals an exceptionally slow LD decay, covering approximately 60 Mb on genomic distances. Studies have shown similar LD decay characteristics, where the LD decay rate did not fall below an r2 of 0.2 within the first 1000 kb [18,41]. Other studies have reported large variations in LD decay, ranging from 3 to 20 cM [42,43,44]. A notable finding in this study is the most rapid LD decay observed in chromosome 3, highlighting its significant contribution to distinguishing tomato varieties within the collection. Previous studies have linked chromosome 3 to varying capabilities in both biotic and abiotic stress resistance [45], as well as fruit characteristics [46,47,48]. This suggests that chromosome 3 may be a key factor influencing the observed variations in tomatoes.
Clustering analysis and population structure, based on the SNP dataset, determined 5 and 12 as the optimal number of clusters, respectively. Neither grouping was able to differentiate between fruit types or regions of origin. This indicates an extreme closeness among the cultivars, possibly resulting from early domestication and selective breeding [16,37,49,50,51]. AMOVA analysis using a SNP subset yielded consistent results, showing only 0.7% variation attributable to population differences. These findings align with the slow LD decay rate as reported in studies, indicating that LD decay spans a long distance in domesticated tomatoes compared to their wild relatives [52,53]. On the other hand, leveraging wild relatives as genetic resources in modern plant breeding approaches, such as Marker-Assisted Selection (MAS) or genome editing, could capitalize on this potential and enhance diversity in cultivated tomatoes, resulting in the development of superior tomato cultivars [54,55,56,57,58].
For similar objectives, the diverse collection of tomatoes in this study holds promise as a valuable genetic reservoir for breeding programs in Thailand. Of particular significance is a distinct subgroup, Q7, which served as the focal point of our breeding program aimed at enhancing disease-resistant traits for cherry tomatoes. These 16 varieties are primarily susceptible to both bacterial wilt disease and tomato leaf-curl disease, which are common occurrences in Thailand (Table S1). Genetically, this subgroup emerges as the largest cluster exclusive to cherry tomatoes and the second largest cluster overall, as revealed by population structure and PCA analyses. Therefore, this diverse assortment of tomatoes could serve as a valuable genetic contributor for breeding programs, with notable varieties including, for example, four Thai cultivars (WT00254, WT00257, WT00262, and WT00273) and three international cultivars (WT00194, WT00222, and WT00276).

5. Conclusions

Genetic diversity is essential for cultivating novel tomato varieties endowed with distinct characteristics. This study serves as a foundational platform for future breeding endeavors and scholarly inquiry into the genetic makeup of Thai tomato cultivars. This SNP dataset represents the 2.4 million high-quality SNPs on tomato genomes generated through whole-genome sequencing (WGS) technology. Examination of 283 tomato accessions reveals a spectrum of diversity in terms of varieties and their origins, distributed across 12 admixture groups. However, it also underscores a limited reservoir of genetic resources within the population, particularly noticeable within our targeted breeding lines (Q7). Hence, there is an urgent imperative to integrate a broader spectrum of tomato genetic resources in order to facilitate the development of robust breeding programs. Our findings provide insights into the selection of parental lines for tomato improvement initiatives aimed at producing resilient varieties suited to the Thai environment. However, further investigation is warranted to genetically validate disease-resistant traits and other characteristics attributed to each tomato accession.

Supplementary Materials

The following supporting information can be downloaded at: https://www.mdpi.com/article/10.3390/horticulturae10060602/s1, Table S1: list of tomato accessions used in this publication and their associated details.

Author Contributions

Conceptualization, O.C., P.C., S.W., S.A. and V.R.; methodology, W.P., B.T., W.A., S.W. and V.R.; formal analysis, A.Y., W.P., W.S., A.S., B.T., W.A., A.B., N.P., B.P., R.K., R.D. and N.W.; resources, A.B., N.P., B.P., R.K., R.D. and N.W.; writing—original draft preparation, A.Y. and W.P.; writing—review and editing, W.P., O.C. and V.R.; visualization, W.P.; supervision, P.C. and V.R. All authors have read and agreed to the published version of the manuscript.

Funding

The authors declare financial support was received for the research, authorship, and/or publication of this article: the scholarship from the National Science and Technology Development Agency (NSTDA) under the Thailand Graduate Institute of Science and Technology (TGIST) program (No. SCA-CO-2565-17202-TH); the National Science and Technology Development Agency (NSTDA) (Grant No. P1951264, P2250455, and P2351489); and the National Science, Research and Innovation Fund, Thailand Science Research and Innovation (TSRI).

Data Availability Statement

The raw data supporting the conclusions of this article will be made available by the authors on request.

Acknowledgments

The authors would like to thank the Rice Science Center and the Center of Excellence on Agricultural Biotechnology, Office of the Permanent Secretary, Ministry of Higher Education, Science, Research and Innovation. (AG-BIO/MHESI), Kasetsart University, Thailand, for providing research facilities.

Conflicts of Interest

The authors declare no conflicts of interest.

References

  1. Frusciante, L.; Barone, A.; Carputo, D.; Ercolano, M.R.; della Rocca, F.; Esposito, S. Evaluation and Use of Plant Biodiversity for Food and Pharmaceuticals. Fitoterapia 2000, 71, S66–S72. [Google Scholar] [CrossRef] [PubMed]
  2. Sim, S.-C.; Robbins, M.D.; Deynze, A.V.; Michel, A.P.; Francis, D.M. Population Structure and Genetic Differentiation Associated with Breeding History and Selection in Tomato (Solanum lycopersicum L.). Heredity 2011, 106, 927–935. [Google Scholar] [CrossRef] [PubMed]
  3. Bauchet, G.; Causse, M. Genetic Diversity in Tomato (Solanum lycopersicum) and Its Wild Relatives. In Genetic Diversity in Plants; Mahmut, C., Ed.; InTech: Rijeka, Croatia, 2012; ISBN 978-953-51-0185-7. [Google Scholar]
  4. Carbonell, P.; Alonso, A.; Grau, A.; Salinas, J.F.; García-Martínez, S.; Ruiz, J.J. Twenty Years of Tomato Breeding at EPSO-UMH: Transfer Resistance from Wild Types to Local Landraces—From the First Molecular Markers to Genotyping by Sequencing (GBS). Diversity 2018, 10, 12. [Google Scholar] [CrossRef]
  5. Kandel, D.R.; Bedre, R.H.; Mandadi, K.K.; Crosby, K.; Avila, C.A. Genetic Diversity and Population Structure of Tomato (Solanum lycopersicum) Germplasm Developed by Texas A&M Breeding Programs. Am. J. Plant Sci. 2019, 10, 1154–1180. [Google Scholar]
  6. Brbaklić, L.; Trkulja, D.; Mikić, S.; Mirosavljević, M.; Momčilović, V.; Dudić, B.; Procházková, L.; Aćin, V. Genetic Diversity and Population Structure of Serbian Barley (Hordeum vulgare L.) Collection during a 40-Year Long Breeding Period. Agronomy 2021, 11, 118. [Google Scholar] [CrossRef]
  7. Pandey, J.; Scheuring, D.C.; Koym, J.W.; Coombs, J.; Novy, R.G.; Thompson, A.L.; Holm, D.G.; Douches, D.S.; Miller, J.C.; Vales, M.I. Genetic Diversity and Population Structure of Advanced Clones Selected over Forty Years by a Potato Breeding Program in the USA. Sci. Rep. 2021, 11, 8344. [Google Scholar] [CrossRef] [PubMed]
  8. Swarup, S.; Cargill, E.J.; Crosby, K.; Flagel, L.; Kniskern, J.; Glenn, K.C. Genetic Diversity Is Indispensable for Plant Breeding to Improve Crops. Crop Sci. 2021, 61, 839–852. [Google Scholar] [CrossRef]
  9. Tiwari, J.K.; Yerasu, S.R.; Rai, N.; Singh, D.P.; Singh, A.K.; Karkute, S.G.; Singh, P.M.; Behera, T.K. Progress in Marker-Assisted Selection to Genomics-Assisted Breeding in Tomato. Crit. Rev. Plant Sci. 2022, 41, 321–350. [Google Scholar] [CrossRef]
  10. Rothan, C.; Diouf, I.; Causse, M. Trait Discovery and Editing in Tomato. Plant J. 2019, 97, 73–90. [Google Scholar] [CrossRef]
  11. Cappetta, E.; Andolfo, G.; Di Matteo, A.; Ercolano, M.R. Empowering Crop Resilience to Environmental Multiple Stress through the Modulation of Key Response Components. J. Plant Physiol. 2020, 246–247, 153134. [Google Scholar] [CrossRef]
  12. Ayenan, M.A.T.; Danquah, A.; Hanson, P.; Asante, I.K.; Danquah, E.Y. Identification of New Sources of Heat Tolerance in Cultivated and Wild Tomatoes. Euphytica 2021, 217, 33. [Google Scholar] [CrossRef]
  13. The 100 Tomato Genome Sequencing Consortium; Aflitos, S.; Schijlen, E.; de Jong, H.; de Ridder, D.; Smit, S.; Finkers, R.; Wang, J.; Zhang, G.; Li, N.; et al. Exploring Genetic Variation in the Tomato (Solanum Section Lycopersicon) Clade by Whole-Genome Sequencing. Plant J. 2014, 80, 136–148. [Google Scholar] [CrossRef] [PubMed]
  14. Al Shaye, N.; Migdadi, H.; Charbaji, A.; Alsayegh, S.; Daoud, S.; AL-Anazi, W.; Alghamdi, S. Genetic Variation among Saudi Tomato (Solanum lycopersicum L.) Landraces Studied Using SDS-PAGE and SRAP Markers. Saudi J. Biol. Sci. 2018, 25, 1007–1015. [Google Scholar] [CrossRef]
  15. Kiani, G.; Siahchehreh, M. Genetic Diversity in Tomato Varieties Assessed by ISSR Markers. Int. J. Veg. Sci. 2018, 24, 353–360. [Google Scholar] [CrossRef]
  16. Gonias, E.D.; Ganopoulos, I.; Mellidou, I.; Bibi, A.C.; Kalivas, A.; Mylona, P.V.; Osanthanunkul, M.; Tsaftaris, A.; Madesis, P.; Doulis, A.G. Exploring Genetic Diversity of Tomato (Solanum lycopersicum L.) Germplasm of Genebank Collection Employing SSR and SCAR Markers. Genet. Resour. Crop Evol. 2019, 66, 1295–1309. [Google Scholar] [CrossRef]
  17. Jin, L.; Zhao, L.; Wang, Y.; Zhou, R.; Song, L.; Xu, L.; Cui, X.; Li, R.; Yu, W.; Zhao, T. Genetic Diversity of 324 Cultivated Tomato Germplasm Resources Using Agronomic Traits and InDel Markers. Euphytica 2019, 215, 69. [Google Scholar] [CrossRef]
  18. Esposito, S.; Cardi, T.; Campanelli, G.; Sestili, S.; Díez, M.J.; Soler, S.; Prohens, J.; Tripodi, P. ddRAD Sequencing-Based Genotyping for Population Structure Analysis in Cultivated Tomato Provides New Insights into the Genomic Diversity of Mediterranean ‘Da Serbo’ Type Long Shelf-Life Germplasm. Hortic. Res. 2020, 7, 134. [Google Scholar] [CrossRef] [PubMed]
  19. Alzahib, R.H.; Migdadi, H.M.; Ghamdi, A.A.A.; Alwahibi, M.S.; Afzal, M.; Elharty, E.H.; Alghamdi, S.S. Exploring Genetic Variability among and within Hail Tomato Landraces Based on Sequence-Related Amplified Polymorphism Markers. Diversity 2021, 13, 135. [Google Scholar] [CrossRef]
  20. Kim, M.; Jung, J.-K.; Shim, E.-J.; Chung, S.-M.; Park, Y.; Lee, G.P.; Sim, S.-C. Genome-Wide SNP Discovery and Core Marker Sets for DNA Barcoding and Variety Identification in Commercial Tomato Cultivars. Sci. Hortic. 2021, 276, 109734. [Google Scholar] [CrossRef]
  21. Villanueva-Gutierrez, E.E.; Johansson, E.; Prieto-Linde, M.L.; Centellas Quezada, A.; Olsson, M.E.; Geleta, M. Simple Sequence Repeat Markers Reveal Genetic Diversity and Population Structure of Bolivian Wild and Cultivated Tomatoes (Solanum lycopersicum L.). Genes 2022, 13, 1505. [Google Scholar] [CrossRef]
  22. Pathaichindachote, W.; Panyawut, N.; Sikaewtung, K.; Patarapuwadol, S.; Muangprom, A. Genetic Diversity and Allelic Frequency of Selected Thai and Exotic Rice Germplasm Using SSR Markers. Rice Sci. 2019, 26, 393–403. [Google Scholar] [CrossRef]
  23. Vejchasarn, P.; Shearman, J.R.; Chaiprom, U.; Phansenee, Y.; Suthanthangjai, A.; Jairin, J.; Chamarerk, V.; Tulyananda, T.; Amornbunchornvej, C. Population Structure of Nation-Wide Rice in Thailand. Rice 2021, 14, 88. [Google Scholar] [CrossRef] [PubMed]
  24. Aesomnuk, W.; Ruengphayak, S.; Ruanjaichon, V.; Sreewongchai, T.; Malumpong, C.; Vanavichit, A.; Toojinda, T.; Wanchana, S.; Arikit, S. Estimation of the Genetic Diversity and Population Structure of Thailand’s Rice Landraces Using SNP Markers. Agronomy 2021, 11, 995. [Google Scholar] [CrossRef]
  25. Li, H.; Durbin, R. Fast and Accurate Short Read Alignment with Burrows-Wheeler Transform. Bioinformatics 2009, 25, 1754–1760. [Google Scholar] [CrossRef] [PubMed]
  26. Danecek, P.; Bonfield, J.K.; Liddle, J.; Marshall, J.; Ohan, V.; Pollard, M.O.; Whitwham, A.; Keane, T.; McCarthy, S.A.; Davies, R.M.; et al. Twelve Years of SAMtools and BCFtools. GigaScience 2021, 10, giab008. [Google Scholar] [CrossRef] [PubMed]
  27. Van der Auwera, G.A.; O’Connor, B.D. Genomics in the Cloud: Using Docker, GATK, and WDL in Terra; O’Reilly Media: Sebastopol, CA, USA, 2020; ISBN 1-4919-7516-4. [Google Scholar]
  28. Danecek, P.; Auton, A.; Abecasis, G.; Albers, C.A.; Banks, E.; DePristo, M.A.; Handsaker, R.E.; Lunter, G.; Marth, G.T.; Sherry, S.T.; et al. The Variant Call Format and VCFtools. Bioinformatics 2011, 27, 2156–2158. [Google Scholar] [CrossRef] [PubMed]
  29. Yin, L.; Zhang, H.; Tang, Z.; Xu, J.; Yin, D.; Zhang, Z.; Yuan, X.; Zhu, M.; Zhao, S.; Li, X.; et al. rMVP: A Memory-Efficient, Visualization-Enhanced, and Parallel-Accelerated Tool for Genome-Wide Association Study. Genom. Proteom. Bioinform. 2021, 19, 619–628. [Google Scholar] [CrossRef]
  30. Zhang, C.; Dong, S.-S.; Xu, J.-Y.; He, W.-M.; Yang, T.-L. PopLDdecay: A Fast and Effective Tool for Linkage Disequilibrium Decay Analysis Based on Variant Call Format Files. Bioinformatics 2019, 35, 1786–1788. [Google Scholar] [CrossRef] [PubMed]
  31. Cook, D.E.; Andersen, E.C. VCF-Kit: Assorted Utilities for the Variant Call Format. Bioinformatics 2017, 33, 1581–1582. [Google Scholar] [CrossRef]
  32. Tamura, K.; Stecher, G.; Kumar, S. MEGA11: Molecular Evolutionary Genetics Analysis Version 11. Mol. Biol. Evol. 2021, 38, 3022–3027. [Google Scholar] [CrossRef]
  33. Raj, A.; Stephens, M.; Pritchard, J.K. fastSTRUCTURE: Variational Inference of Population Structure in Large SNP Data Sets. Genetics 2014, 197, 573–589. [Google Scholar] [CrossRef] [PubMed]
  34. Chang, C.C.; Chow, C.C.; Tellier, L.C.; Vattikuti, S.; Purcell, S.M.; Lee, J.J. Second-Generation PLINK: Rising to the Challenge of Larger and Richer Datasets. GigaScience 2015, 4, 7. [Google Scholar] [CrossRef] [PubMed]
  35. Goudet, J. Hierfstat, a Package for r to Compute and Test Hierarchical F-Statistics. Mol. Ecol. Notes 2005, 5, 184–186. [Google Scholar] [CrossRef]
  36. Kamvar, Z.N.; Tabima, J.F.; Grünwald, N.J. Poppr: An R Package for Genetic Analysis of Populations with Clonal, Partially Clonal, and/or Sexual Reproduction. PeerJ 2014, 2, e281. [Google Scholar] [CrossRef] [PubMed]
  37. Labate, J.A. DNA Variation in a Diversity Panel of Tomato Genetic Resources. J. Am. Soc. Hortic. Sci. 2021, 146, 339–345. [Google Scholar] [CrossRef]
  38. Caramante, M.; Rouphael, Y.; Corrado, G. Genetic Diversity among and within Tomato (Solanum lycopersicum L.) Landraces Grown in Southern Italy. Genet. Resour. Crop Evol. 2023, 71, 157–166. [Google Scholar] [CrossRef]
  39. Sim, S.-C.; Durstewitz, G.; Plieske, J.; Wieseke, R.; Ganal, M.W.; Van Deynze, A.; Hamilton, J.P.; Buell, C.R.; Causse, M.; Wijeratne, S.; et al. Development of a Large SNP Genotyping Array and Generation of High-Density Genetic Maps in Tomato. PLoS ONE 2012, 7, e40563. [Google Scholar] [CrossRef]
  40. Lin, Y.-P.; Liu, C.-Y.; Chen, K.-Y. Assessment of Genetic Differentiation and Linkage Disequilibrium in Solanum pimpinellifolium Using Genome-Wide High-Density SNP Markers. G3 GenesGenomesGenetics 2019, 9, 1497–1505. [Google Scholar] [CrossRef]
  41. Bauchet, G.; Grenier, S.; Samson, N.; Bonnet, J.; Grivet, L.; Causse, M. Use of Modern Tomato Breeding Germplasm for Deciphering the Genetic Control of Agronomical Traits by Genome Wide Association Study. Theor. Appl. Genet. 2017, 130, 875–889. [Google Scholar] [CrossRef]
  42. van Berloo, R.; Zhu, A.; Ursem, R.; Verbakel, H.; Gort, G.; van Eeuwijk, F.A. Diversity and Linkage Disequilibrium Analysis within a Selected Set of Cultivated Tomatoes. Theor. Appl. Genet. 2008, 117, 89–101. [Google Scholar] [CrossRef]
  43. Robbins, M.D.; Sim, S.-C.; Yang, W.; Van Deynze, A.; van der Knaap, E.; Joobeur, T.; Francis, D.M. Mapping and Linkage Disequilibrium Analysis with a Genome-Wide Collection of SNPs That Detect Polymorphism in Cultivated Tomato. J. Exp. Bot. 2011, 62, 1831–1845. [Google Scholar] [CrossRef] [PubMed]
  44. Sim, S.-C.; Van Deynze, A.; Stoffel, K.; Douches, D.S.; Zarka, D.; Ganal, M.W.; Chetelat, R.T.; Hutton, S.F.; Scott, J.W.; Gardner, R.G.; et al. High-Density SNP Genotyping of Tomato (Solanum lycopersicum L.) Reveals Patterns of Genetic Variation Due to Breeding. PLoS ONE 2012, 7, e45520. [Google Scholar] [CrossRef] [PubMed]
  45. Brake, M.; Al-Qadumii, L.; Hamasha, H.; Migdadi, H.; Awad, A.; Haddad, N.; Sadder, M.T. Development of SSR Markers Linked to Stress Responsive Genes along Tomato Chromosome 3 (Solanum lycopersicum L.). BioTech 2022, 11, 34. [Google Scholar] [CrossRef]
  46. Chen, L.; Li, W.; Li, Y.; Feng, X.; Du, K.; Wang, G.; Zhao, L. Identified Trans-Splicing of YELLOW-FRUITED TOMATO 2 Encoding the PHYTOENE SYNTHASE 1 Protein Alters Fruit Color by Map-Based Cloning, Functional Complementation and RACE. Plant Mol. Biol. 2019, 100, 647–658. [Google Scholar] [CrossRef] [PubMed]
  47. Mata-Nicolás, E.; Montero-Pau, J.; Gimeno-Paez, E.; Garcia-Carpintero, V.; Ziarsolo, P.; Menda, N.; Mueller, L.A.; Blanca, J.; Cañizares, J.; van der Knaap, E.; et al. Exploiting the Diversity of Tomato: The Development of a Phenotypically and Genetically Detailed Germplasm Collection. Hortic. Res. 2020, 7, 66. [Google Scholar] [CrossRef] [PubMed]
  48. Çolak, N.G.; Eken, N.T.; Ülger, M.; Frary, A.; Doğanlar, S. Mapping of Quantitative Trait Loci for the Nutritional Value of Fresh Market Tomato. Funct. Integr. Genom. 2023, 23, 121. [Google Scholar] [CrossRef] [PubMed]
  49. de Souza, L.M.; Paterniani, M.E.A.; Melo, P.C.T.; de Melo, A.M. Diallel Cross among Fresh Market Tomato Inbreeding Lines. Hortic. Bras. 2012, 30, 246–251. [Google Scholar] [CrossRef]
  50. Bergougnoux, V. The History of Tomato: From Domestication to Biopharming. Biotechnol. Adv. 2014, 32, 170–189. [Google Scholar] [CrossRef]
  51. Sun, L.; Chen, J.; Xiao, K.; Yang, W. Origin of the Domesticated Horticultural Species and Molecular Bases of Fruit Shape and Size Changes during the Domestication, Taking Tomato as an Example. Hortic. Plant J. 2017, 3, 125–132. [Google Scholar] [CrossRef]
  52. Lin, T.; Zhu, G.; Zhang, J.; Xu, X.; Yu, Q.; Zheng, Z.; Zhang, Z.; Lun, Y.; Li, S.; Wang, X.; et al. Genomic Analyses Provide Insights into the History of Tomato Breeding. Nat. Genet. 2014, 46, 1220–1226. [Google Scholar] [CrossRef]
  53. Zhu, G.; Wang, S.; Huang, Z.; Zhang, S.; Liao, Q.; Zhang, C.; Lin, T.; Qin, M.; Peng, M.; Yang, C.; et al. Rewiring of the Fruit Metabolome in Tomato Breeding. Cell 2018, 172, 249–261.e12. [Google Scholar] [CrossRef] [PubMed]
  54. Wang, C.; Hu, S.; Gardner, C.; Lübberstedt, T. Emerging Avenues for Utilization of Exotic Germplasm. Trends Plant Sci. 2017, 22, 624–637. [Google Scholar] [CrossRef] [PubMed]
  55. Schouten, H.J.; Tikunov, Y.; Verkerke, W.; Finkers, R.; Bovy, A.; Bai, Y.; Visser, R.G.F. Breeding Has Increased the Diversity of Cultivated Tomato in The Netherlands. Front. Plant Sci. 2019, 10, 1606. [Google Scholar] [CrossRef] [PubMed]
  56. Sumalan, R.M.; Ciulca, S.I.; Poiana, M.A.; Moigradean, D.; Radulov, I.; Negrea, M.; Crisan, M.E.; Copolovici, L.; Sumalan, R.L. The Antioxidant Profile Evaluation of Some Tomato Landraces with Soil Salinity Tolerance Correlated with High Nutraceuticaland Functional Value. Agronomy 2020, 10, 500. [Google Scholar] [CrossRef]
  57. Rouphael, Y.; Corrado, G.; Colla, G.; De Pascale, S.; Dell’Aversana, E.; D’Amelia, L.I.; Fusco, G.M.; Carillo, P. Biostimulation as a Means for Optimizing Fruit Phytochemical Content and Functional Quality of Tomato Landraces of the San Marzano Area. Foods 2021, 10, 926. [Google Scholar] [CrossRef]
  58. Tiwari, J.K.; Singh, A.K.; Behera, T.K. CRISPR/Cas Genome Editing in Tomato Improvement: Advances and Applications. Front. Plant Sci. 2023, 14, 1121209. [Google Scholar] [CrossRef]
Figure 1. World map displaying the origin of the tomato accessions utilized in this study. Regions shaded in grey indicate the areas from which the tomato accessions originate, with labels indicating the number of tomato accessions in parentheses. Tomato accessions with unknown origins are denoted in the bottom left corner of the map.
Horticulturae 10 00602 g001
Figure 2. The SNP density plot illustrates the distribution of 2.4 million high-quality filtered SNPs across 12 chromosomes in 283 tomato accessions. The average SNP density was 3.14 per kb, with chromosome 5 having the highest concentration of SNPs, while chromosome 3 had the lowest concentration.
Horticulturae 10 00602 g002
Figure 3. Average LD decay rates across all 12 tomato chromosomes. The y-axis represents the average pairwise correlation coefficient (r2), while the x-axis represents the physical distance between SNPs in megabases (Mb). A dashed horizontal line at the mean r2 value of 0.2 serves as a reference. Chromosomes are differentiated by colored labels.
Horticulturae 10 00602 g003
Figure 4. Summary of 283 tomato accessions and associated information. The central dendrogram illustrates the genetic diversity of the tomato accessions, with inner colored dots corresponding to each group. Fruit types are color-coded in the text, with red representing cherry and blue for table varieties. The innermost ring represents the source of the varieties, where “INT” refers to international varieties and “TH” refers to Thai varieties, with the adjacent ring representing their origin. The largest ring illustrates the population structure of K = 12. The outermost ring denotes the grouping of the admixture group using a 0.8 threshold.
Horticulturae 10 00602 g004
Figure 5. Identification of the optimal number of clusters using the 2.4 million SNPs from the 283 tomato accessions. A combination of MDS, K-means clustering, and silhouette methods was used to determine the clusters.
Horticulturae 10 00602 g005
Figure 6. PCA plot of different types of tomatoes through SNP data. A PCA representing a natural grouping of the data where PC1 explains 26.46% of the variance and PC2 explains 12.81% of the variance. The data points are color-coded to denote different admixture groups, and distinct fruit types are distinguished by various shapes.
Horticulturae 10 00602 g006
Table 1. Population structure of each fruit type.
Admixture GroupCherryTableTHINT
Q111065
Q2010010
Q35014
Q41428240
Q52819
Q61726
Q7160151
Q8130112
Q96024
Q10411150
Q112736
Q123003
admix78575085
Table 2. Summary of AMOVA for the two subpopulations of “TH” and “INT”.
Source of VariationdfSum Sq.Mean Sq.SigmaPercentage of Total Variance
Between populations13683.593683.59013.538060.7167299
Within populations281526,966.711875.3261875.3263899.2832701
Total282530,650.301881.7391888.86444100.0000000
Disclaimer/Publisher’s Note: The statements, opinions and data contained in all publications are solely those of the individual author(s) and contributor(s) and not of MDPI and/or the editor(s). MDPI and/or the editor(s) disclaim responsibility for any injury to people or property resulting from any ideas, methods, instructions or products referred to in the content.

