Article

Nitrogen Fixation and Growth of Potted Olive Plants through Foliar Application of a Nitrogen-Fixing Microorganism

by
Manuel Ângelo Rodrigues
1,2,*,
Soraia Raimundo
1,2,
Carlos M. Correia
3 and
Margarida Arrobas
1,2
1
Centro de Investigação de Montanha (CIMO), Instituto Politécnico de Bragança, Campus de Santa Apolónia, 5300-253 Bragança, Portugal
2
Laboratório para a Sustentabilidade e Tecnologia em Regiões de Montanha, Instituto Politécnico de Bragança, Campus de Santa Apolónia, 5300-253 Bragança, Portugal
3
Centre for the Research and Technology of Agro-Environmental and Biological Sciences (CITAB), University of Trás-os-Montes and Alto Douro, 5001-801 Vila Real, Portugal
*
Author to whom correspondence should be addressed.
Horticulturae 2024, 10(6), 604; https://doi.org/10.3390/horticulturae10060604
Submission received: 4 May 2024 / Revised: 1 June 2024 / Accepted: 5 June 2024 / Published: 7 June 2024
(This article belongs to the Section Plant Nutrition)

Abstract

:
Given the importance of biological nitrogen (N) fixation in agroecosystems, using inoculants with phyllosphere N fixers effective across various crops would revolutionize agriculture. In this study, the application of an inoculant prepared from Methylobacterium symbioticum was tested on young olive trees. The pot experiment was arranged in a factorial design, with inoculant (Yes and No) and mineral N applied to the soil [0 (N0), 25 (N25), 50 (N50), and 100 (N100) kg ha−1], and four replicates. The inoculant application did not increase plant dry matter yield (DMY), whereas the application of mineral N had a significant and pronounced effect. The inoculant also did not significantly increase N concentration in tissues, unlike the strong increase observed with N applied to the soil. The inoculant significantly increased plant N recovery, a cumulative effect resulting from small increases in DMY and N concentration in tissues. This increase represented 5.2% more N in plants receiving the inoculant compared to untreated ones. However, only treatments receiving mineral N recorded positive values of fixed N, with the highest value observed in the N50 treatment (12.4%), whereas a negative value (−7.7%) was observed in the N0 treatment. Overall, these low values of fixed N question the economic rationale of using this inoculant by farmers and especially render it unsuitable for organic farming systems, where plants tend to have lower N levels in tissues.

1. Introduction

Olive tree (Olea europaea L.) is one of the most important crops in the Mediterranean basin. In addition to its importance as food, due to the quality of both the oil and the fruit [1,2], olive oil has been used ancestrally as fuel and lubricant and in several medicinal applications [3]. In 2022, the area planted in olive tree was 10,948,521 ha, with a world olive production of 21,449,868 t [4]. Although olive cultivation has spread to various parts of the world, more than 80% of world olive production is still concentrated in the Mediterranean basin, in countries in southern Europe and North Africa [4].
In recent years, there has been a progressive intensification of the cropping system, particularly through increased planting density [5,6]. High-density olive groves are invariably associated with high farming intensification, where low-sized canopy and high-yielding cultivars are used, one of the most emblematic of the Mediterranean basin being Arbequina [3,7].
The intensive cultivation of olive groves is associated with a high consumption of water, phytosanitary products, and fertilizers. The excessive use of N fertilizers, for instance, is one of the main environmental problems associated with intensive agriculture. Firstly, there is an energy problem, which makes the use of these fertilizers expensive and environmentally unsustainable, since obtaining industrial N through the Haber–Bosch process continues to require large amounts of energy [8]. Furthermore, once applied, N is very dynamic in the soil and can be lost in large amounts by nitrate leaching, contaminating water bodies, or by denitrification in volatile forms, which include some important greenhouse gases such as N oxides [9,10]. So, whenever more sustainable farming practices are advocated, reducing mineral N use is always a key component.
However, finding alternative methods to mineral N fertilizers is a challenging endeavour. Most olive growers in the Mediterranean basin specialize in this crop, which constitutes a true monoculture, where animal manure and other organic amendments are not available in relevant quantities [11]. A realistic possibility of increasing the availability of N in the soil is from the use of legume cover crops, taking advantage of these plants’ access to atmospheric dinitrogen, due to the symbiotic relationship that legumes establish with N-fixing microorganisms [12,13,14]. Several studies have shown the high potential of legume cover crops to supply N to olive trees [15]. However, these techniques are also expensive and not easy to implement, making it difficult to achieve the long-term persistence of sown species [16,17].
Currently, in agricultural systems with high agricultural intensification, an increasing number of producers use plant biostimulants, mainly those that can be applied as foliar sprays, such as seaweed extracts and amino acids [18]. Plant biostimulants can be products of a very different nature, currently also including those that contain beneficial microorganisms [19]. A high diversity of microorganisms, namely bacteria and fungi, can have beneficial interactions with plants, helping them to deal with several biotic and abiotic stresses and/or facilitating the acquisition of nutrients [20,21]. Microorganisms capable of fixing atmospheric N are diverse and have been used for a long time in agriculture, especially rhizobia (Rhizobium and related genera) applied to legume species that develop nodules in the root system [12,13,14]. The application of N-fixing microorganisms to shoots in non-legume species (Azotobacter sp., Azospirillum, sp., Bacillus sp., etc.) has also been studied [22,23,24], but commercial inoculants are much less widespread than rhizobia.
Recently, a new bacterium was isolated from Glomus iranicum var. tenuihypharum spores, capable of fixing atmospheric N, having been classified as Methylobacterium symbioticum sp. nov. (strain SB0023/3T) [25]. This bacterium can live in the phyllosphere and supply N to the host plant. Soon after, a commercial plant biostimulant named BlueN® containing this bacterium appeared on the market. The possibility of applying a microorganism in a foliar spray with the ability to thrive in the phyllosphere of a non-legume crop and fix N that can be used by the plant is very exciting because of the ease of operation. In the case of the olive tree, especially in intensive cultivation, it would be, above all, a way of reducing the rates of N applied as a fertilizer, which would be an important step towards a more sustainable agriculture. However, as far as we know, no independent studies have yet been conducted to test its efficacy. Thus, the objective of this study was to evaluate the effectiveness of the commercial product BlueN® in stimulating growth and supplying N to young potted-grown olive trees of the Arbequina cultivar. The hypotheses put forward were as follows: (i) whether, as an N-fixing microorganism, this bacterium can supply measurable amounts of N to the plants and stimulate their growth; and (ii) whether the nutritional status of the plants influences the effectiveness of the process, with the product being applied to plants subjected to different rates of mineral N-fertilizer.

2. Materials and Methods

2.1. Establishment of Pot Experiment and Experimental Design

A pot experiment was carried out for two consecutive years (2021–2022) in Bragança (41°47′49.974″ N, 6°45′43.168″ W; altitude 686 m), northeastern Portugal. The trial was initiated on 5 June 2021 and ended on 4 October 2022. The region benefits from a warm summer Mediterranean climate (Csb), according to Köppen–Geiger classification. The mean annual temperature and annual precipitation are 12.3 °C and 758.3 mm, respectively [26]. Mean monthly temperatures and accumulated monthly precipitation during the experimental period are presented in Figure 1.
The experiment was arranged as a factorial: N fertilization, with four N rates (0, 25, 50 and 100 kg ha−1 of N) applied to the soil; and application of a plant biostimulant (Yes and No), and four replicates (4 pots) of each treatment. The annual rate of N was split into two applications, half the rate at planting and the other half at mid-summer. Each pot received 0, 0.208, 0.417 or 0.833 g year−1 of N. These values were estimated considering a planting density of 120,000 plants ha−1 (considering the canopy size of the young potted olive trees similar to that of herbaceous crops), and intending to simulate an application of 0, 25, 50 or 100 kg ha−1 of N. Ammonium nitrate 27% N (50% NH4+, 50% NO3) was the fertilizer used. Thus, the pots received 0, 0.770, 1.544, and 3.085 g pot−1 of ammonium nitrate. In the first year, at planting the pots also received phosphorus (P) and potassium (K) at rates corresponding to 100 kg ha−1 as P2O5 and K2O (21.8 and 41.5 kg ha−1 of P and K). Micronutrients, magnesium (Mg), and sulphur (S) were also applied once a year, using a fertilizer containing 10% MgO, 0.3% boron (B), 18.5% SO3, 0.3% copper (Cu), 2% iron (Fe), 1% manganese (Mn), 0.02% molybdenum (Mo), and 1.6% zinc (Zn) at the rate of 0.08 g pot−1 year−1. The plant biostimulant (commercial product Blue N®, containing 3 × 10⁷ colony-forming units (CFU g−1) of M. symbioticum) was applied on 30 June 2021 and 15 June 2022. The leaf spray was prepared at the concentration recommended by the manufacturer, 333 g ha−1, diluted in 100 L of water. Once again, it was considered that 1 ha represents 120,000 young olive plants, with each plant receiving a fraction corresponding to the individual dose. The foliar spray was applied with a small household sprayer used to care for indoor plants, wetting the adaxial and abaxial sides of the leaves.
Pots with a height of 0.36 m and a mean diameter of 0.17 m were filled with 10 kg of dried (40 °C) and sieved (2 mm mesh) soil, taken at the 0–0.20 m layer in a plot that had been lying fallow for a year. The soil was a Regosol of colluvial origin [27], sandy–clay–loam textured (550 g kg−1 sand, 208 g kg−1 silt, and 242 g kg−1 clay). Some other properties of the soil used in the pot experiment were as follows: organic carbon (C) (Walkley–Black) 9.3 g kg−1; pH (H2O, 1:2.5) 6.5; extractable P (P2O5) and K (K2O) (Egnér–Riehm) 67.2 and 81.2 mg kg−1, respectively; and cation exchange capacity 14.1 cmolc kg−1.

2.2. Planting and Crop Management

Three-month-old pre-rooted olive cuttings, cv. Arbequina, ~20 cm in height, were used in this experiment. The soil was well mixed with the pre-planting fertilizers and placed in the pots at the same time as the plants.
The experiment was carried out in outdoor conditions. After planting the olive cuttings, the pots were surrounded with a wooden plank structure to prevent solar radiation from falling directly on the sides of the pots and excessively increasing the temperature in the rhizosphere.
After planting, the pots were divided into two groups: those that would receive the inoculant application and those that would not receive the microorganism, and placed 50 m apart to avoid any contamination of untreated plants. Throughout the entire experimental period, the young olive trees were watered as needed, with water requirements depending on the phenological stage of the plants and environmental variables. During each watering, a maximum of 500 mL of water was applied. Any weeds that germinated after planting were manually removed. After the inoculant application, all practices began with the pots without inoculant, and only then moved on to the treated plants.

2.3. Crop Harvest and Laboratory Analysis

On 4 October 2022, the plants were removed from the pots, and a homogeneous soil sample was recovered per pot. The roots were then separated from the aboveground biomass, placed on a 2 mm mesh sieve, and washed with water under gentle pressure to remove soil particles. The aboveground biomass was, in turn, separated into leaves and stems. In the laboratory, all plant tissues were dried in an oven at 70 °C until constant weight and ground (1 mm mesh).
Tissue N was analysed by the Kjeldahl method following sample digestion with sulfuric acid and selenium as a catalyst. B determination involved sample incineration in calcium oxide, with subsequent ash dilution using sulfuric acid. B was quantified in the extract via colorimetry utilizing the azomethine-H method. Other nutrients were digested in nitric acid using microwave. P was determined through colorimetry employing the blue ammonium molybdate method with ascorbic acid as a reducing agent. Cations (K, Ca, Mg, Cu, Fe, Zn, and Mn) were analysed via atomic absorption spectrophotometry. Further details on these analytical procedures can be found in Temminghoff and Houba [28].
Soil samples were analysed for pH (H2O and KCl) (soil: solution, 1:2.5), cation-exchange capacity (ammonium acetate, pH 7.0), organic C (wet digestion, Walkley–Black method) and extractable P and K (Egner–Riehm method, ammonium lactate extract). Soil B was extracted by hot water and determined by the method of azomethine-H. Soil separates (clay, silt, and sand) were determined by the Robinson pipette method. All of these analytical procedures are described in detail in Van Reeuwijk [29]. The availability of other micronutrients (Cu, Fe, Zn, and Mn) in the soil was determined by atomic absorption spectrometry after extraction with diethylenetriaminepentaacetic acid (DTPA) buffered at pH 7.3 [30].

2.4. Data Analysis

The data underwent testing for normality and homogeneity of variances using the Shapiro–Wilk test and Bartlett’s test, respectively. Following ANOVA examination (two-way ANOVA), the means of the N treatments with significant differences (α < 0.05) were separated by the Tukey HSD test (α = 0.05).
Apparent N recovery (ANR) served as an index of the efficiency of soil-applied N. ANR was calculated using the following equation: ANR (%) = 100 × [(N recovered in the fertilized treatments − N recovered in the control treatment)/N applied as fertilizer].
Apparent N fixation (ANF) was used as an index of the efficiency of N fixation by the microorganism. ANF was determined by calculating the difference between the N recovered by plants treated with the N-fixing microorganism and those untreated, separately for each rate of N applied to the soil: ANF (%) = 100 × [N recovered in inoculated (Yes) plants − N recovered in non-inoculated (No) plants]/N recovered in inoculated plants.

3. Results

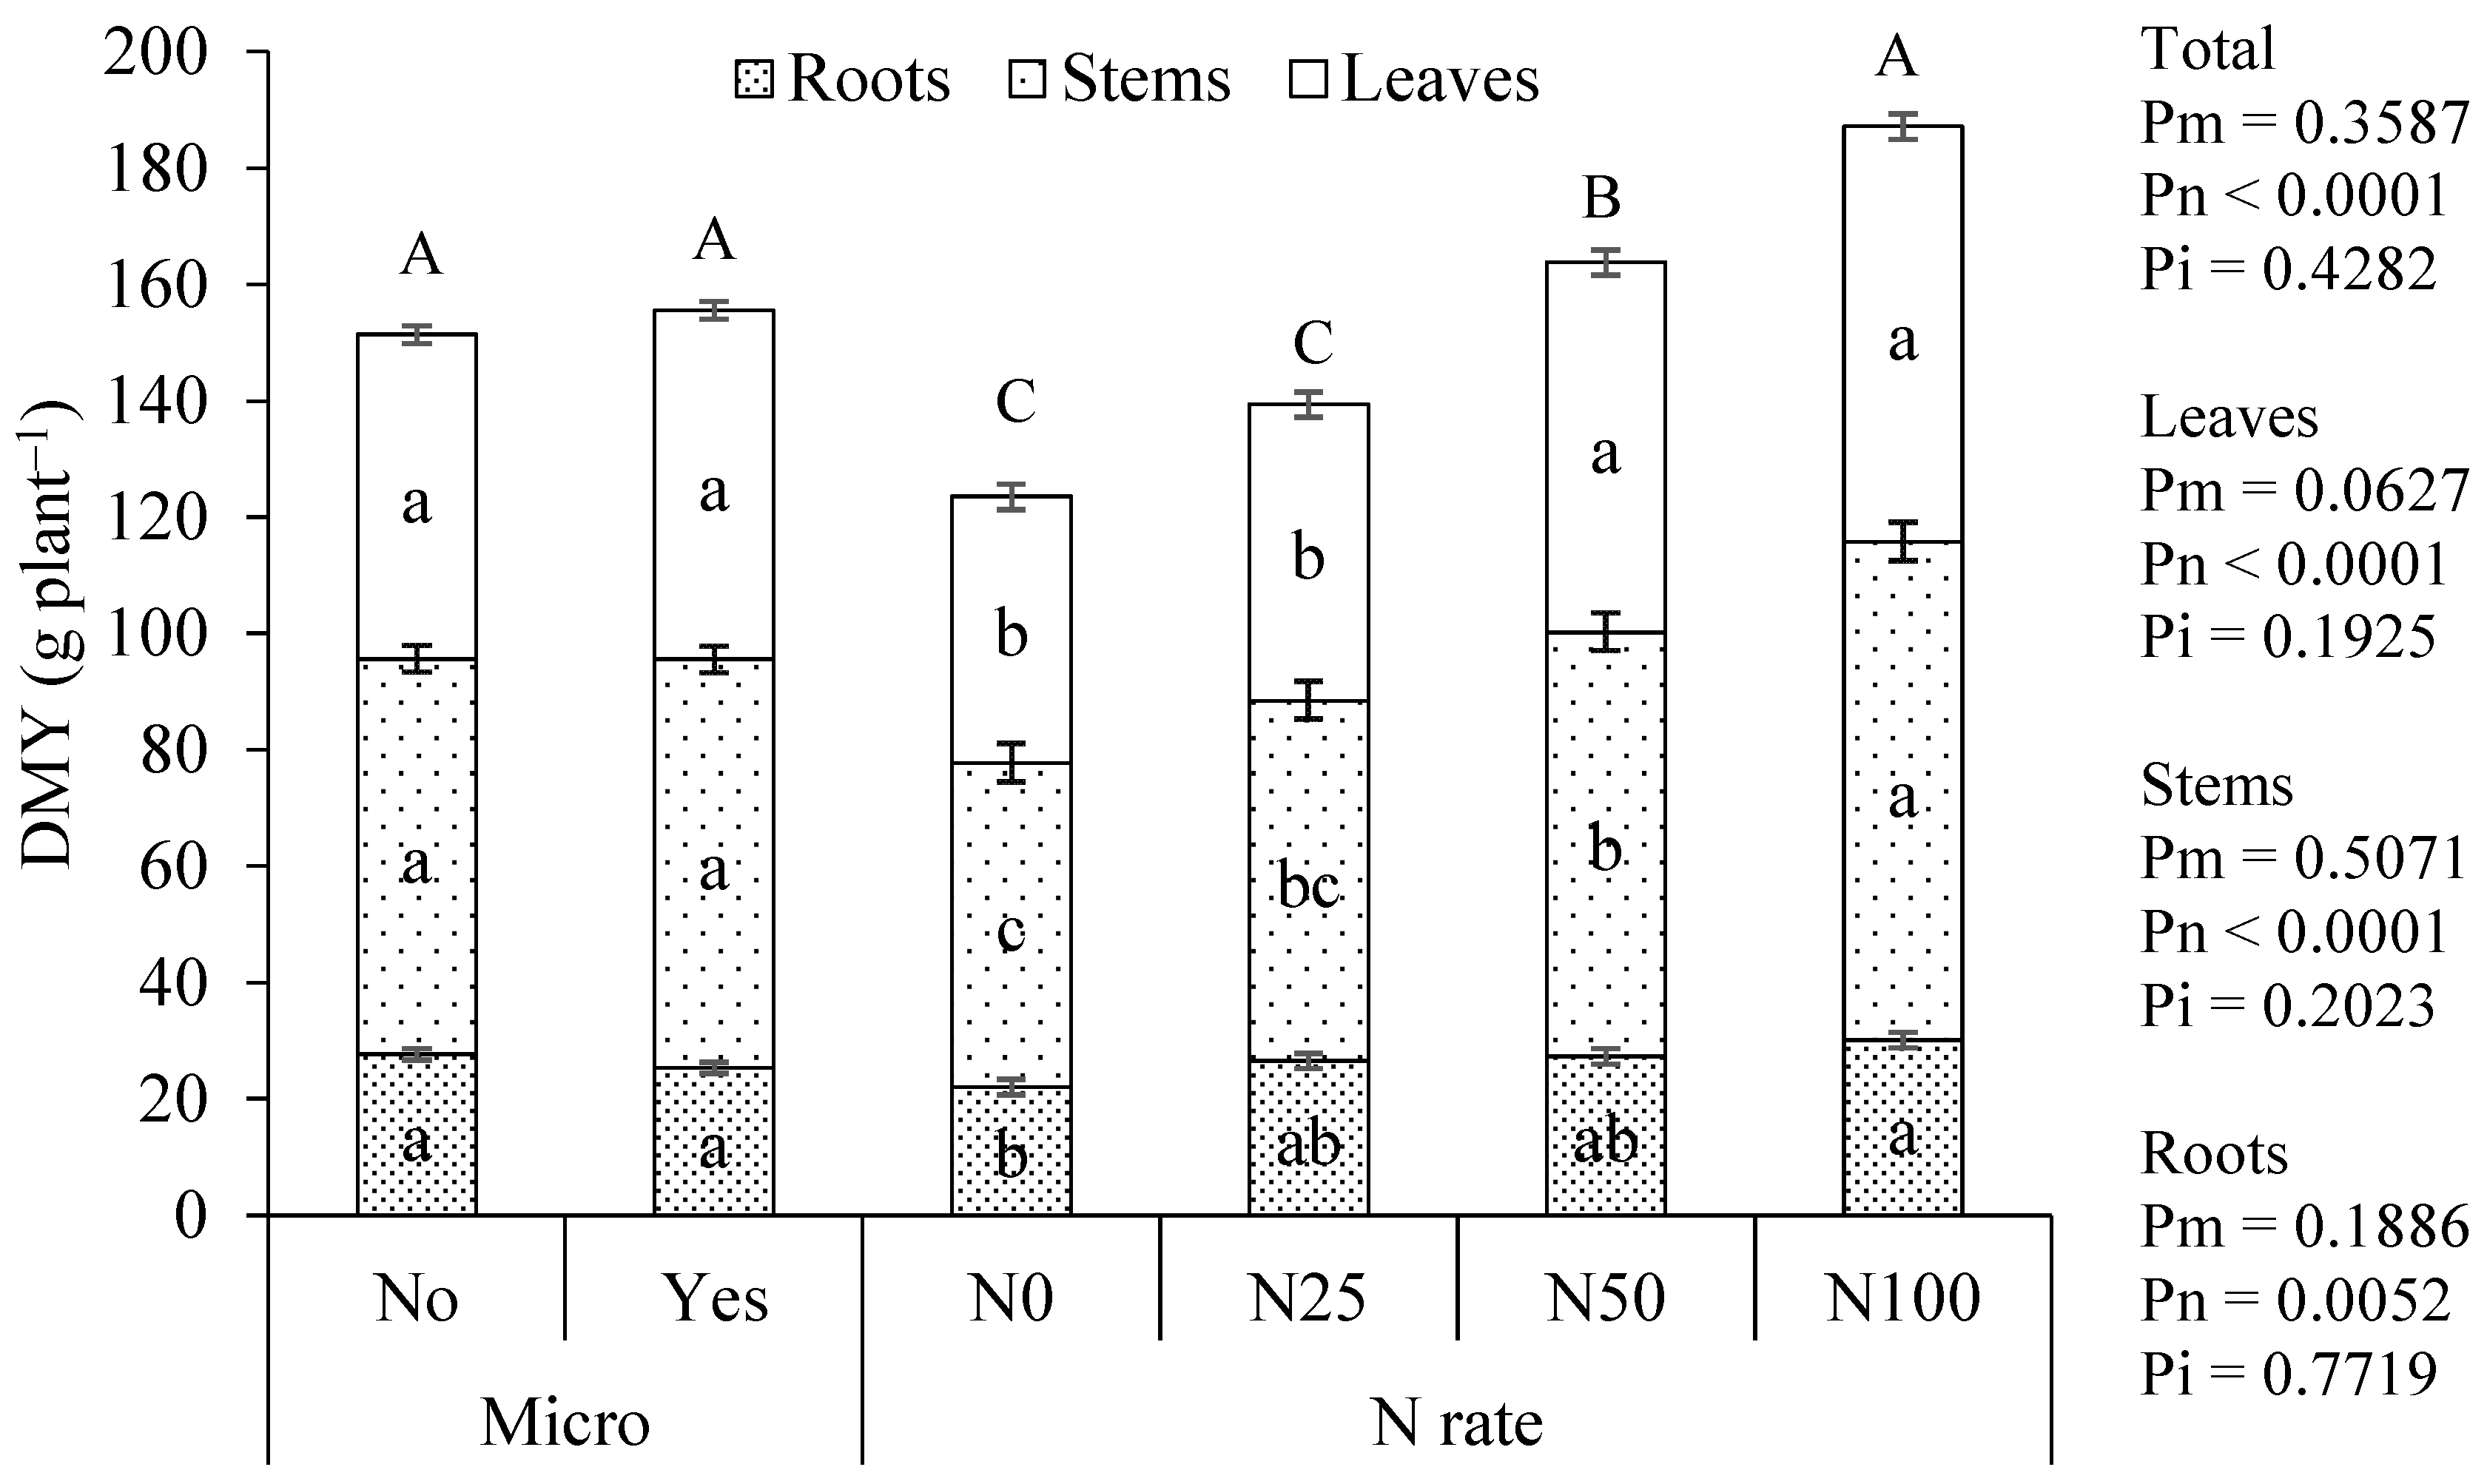
3.1. Dry Matter Yield

The application of the inoculant did not result in an increase in the total dry matter yield (DMY) of the plants or any of their parts, including roots, stems, or leaves (Figure 2). In contrast, N applied to the soil significantly influenced the total DMY of the plants. Increases in DMY were observed with N application in all plant parts: roots, stems, and leaves. The N50 and N100 treatments showed significant differences compared to the N0 treatment in the production of dry matter in stems, leaves, and total, indicating a robust response of the plant to N applied to the soil.

3.2. Nitrogen in Plant Tissues

The N concentration in plant tissues did not vary significantly with the application of the inoculant (Table 1). However, the N concentration in roots, stems, and leaves increased significantly with the application of N to the soil.
The application of the inoculant did not significantly influence the N recovery in roots and stems (Table 1). However, the leaves of the inoculated plants showed increased amounts of N compared to the non-inoculated plants. N recovery in all plant parts (total) was also significantly higher in inoculated plants than in non-inoculated ones. N recovery varied significantly with the N applied to the soil. The values increased from N0 to N100, often with significant differences between each of the different N rates applied, as observed for N recovery in leaves and total.
The plants that received soil fertilization (N25, N50, and N100) and were not inoculated with the N-fixing microorganism (No) exhibited lower N recovery in their tissues compared to the plants that also received soil fertilization (N25, N50, and N100) and were inoculated (Yes) with the microorganism (Table 2). The former showed average values ranging from 51.4% to 71.9% relative to the N applied to the soil, while the latter ranged from 81.7% to 91.2%. On the other hand, the apparent N fixation in plants that received inoculant showed a negative value (−7.7%) in plants that did not receive soil fertilization and positive values in plants that received mineral fertilizer, with the highest average value recorded in the N50 treatment (12.4%).

3.3. Nutrient Concentration in Plant Tissues

Table 3 presents the concentration of other macronutrients besides N and micronutrients in the leaves. Overall, the application of the inoculant had no significant effect on the concentration of any of the macro or micronutrients. However, the concentrations of some nutrients, such as P, K, Ca, and B, were significantly influenced by the N rate applied to the soil. Additionally, the concentrations of these four nutrients followed a similar pattern, showing a decreasing trend with the applied N rate, with values tending to be higher in the control and lower in the N100 treatment.
The nutrient concentration in the stems exhibited a response pattern similar to that of the nutrient concentration in the leaves (Table 4). No significant differences were recorded in the nutrient concentrations in the stems between plants treated and untreated with the inoculant. Similarly to the leaves, the concentrations of certain nutrients varied significantly with the N rate applied to the soil, showing lower values in the N100 treatment compared to the control. In this case, significant differences between treatments were observed for K, Ca, B, and Zn.
The inoculant treatment did not influence the concentration of macronutrients in the roots (Table 5). Regarding metallic micronutrients, the inoculant application appears to have increased the concentration of Zn in the roots. The application of mineral fertilizer tended to significantly decrease P levels in the tissues. Conversely, Cu levels also varied with mineral fertilizer treatments, but inconsistently with applied N rate.

3.4. Soil Properties

The application of the inoculant to the plants had no significant effect on any of the soil properties evaluated (Table 6). However, some relevant soil properties were influenced by the application of mineral fertilizer to the soil. Organic matter showed an increasing trend, with significantly higher values for higher rates of N applied to the soil. Conversely, some nutrients, such as Ca and Mg, and consequently the CEC, showed a decreasing trend with increasing N rate. The soil B level also decreased with higher rates of N applied to the soil.

4. Discussion

The application of the inoculant did not significantly influence the DMY of roots, stems, or leaves, nor the total DMY of the plant. Conversely, the application of mineral N to the soil had a significant effect on all plant parts, particularly on the total DMY. This experiment was conducted in pots, an environment that restricts root expansion, thereby creating a greater dependency on external N supply than agricultural soil. This justifies the strong plant response to N applied as mineral fertilizer to the soil, a result typically observed under similar growing conditions [31]. However, since N has been identified as an important limiting factor for plant growth, as evidenced by the response to mineral N applied to the soil, the DMY results represent the first poor indication about the effectiveness of this inoculant in fixing relevant quantities of N.
The application of the inoculant did not significantly influence the N concentration in roots, stems, or leaves, while the application of mineral N to the soil strongly influenced the N concentration in all tissues. The N concentration in tissues directly reflects N availability to the plant, whether in the soil solution, in the phyllosphere (solutes, N gases), or through biological N fixation [9,13,32]. Nevertheless, the N recovered in the leaves and the total N recovery were significantly higher in plants that received the inoculant compared to those that did not. N recovery results from the combined effect of DMY and its N concentration. This suggests that although the inoculant application had a minor effect on DMY and nitrogen concentration in the leaves, its impact became significant due to the combined effect of these two variables. This result suggests that there may have been a contribution from the inoculant to plant N nutrition, albeit modest, and well below the values reported by the team responsible for introducing the inoculant to the market [33,34].
The apparent N recovery is the main indicator used to assess N use efficiency by plants [31,32,35], while apparent N fixation is an indicator of biological N fixation capacity commonly used in nodulated legume fixing systems [12]. In this study, apparent N recovery showed higher values in inoculated plants. Apparent N recovery compares the N recovered in fertilized treatments with the control treatment (Table 2). This suggests that in inoculated plants, there were greater differences between plants that received N to the soil and those in the control treatment compared to non-inoculated plants. Furthermore, in plants that received the inoculant, the apparent N fixation was negative in the control and positive in plants that received mineral fertilization. Thus, the application of the inoculant seems to have been more effective in plants receiving mineral fertilizer to the soil than in unfertilized plants, which caused the observed differences in apparent N recovery.
However, in this study, the crucial aspect was to determine whether the application of the inoculant is effective in biological N fixation and to what extent the plant utilizes this N. In fixing systems supported by endophytic microorganisms, the plant provides photosynthates from the phloem, giving the fixing microorganisms a high fixation capacity, especially when the plants are in good photosynthetic conditions [12,13,14]. Also, fixers living in the rhizosphere, apoplast, or in close contact with plants may have privileged access to plant exudates and a competitive advantage over free-living fixing microorganisms, thereby increasing their fixation capacity [22,36,37]. In this study, it seems that supplying some N to the soil (N25, N50, and N100 treatments) favoured N fixation conditions by the microorganism, perhaps by facilitating metabolic interactions related to C and N exchange. Some species of the genus Methylobacterium are known to live in the phyllosphere using C1 compounds, such as methanol, as a source of C and energy [22,37,38]. Plants emit large amounts of methanol through the stomata, as a by-product of pectin metabolism during cell wall synthesis [36]. Therefore, improved plant growth conditions may have favoured the release of more exudates, thereby increasing the N fixation capacity of the microorganism.
In this study, the application of the inoculant to plants under deficient nutritional conditions seemed to further reduce the plant’s access to N, indicating competition rather than any mutual benefit. This result corroborates some commercial information, which recommends the product as more effective in plants that have received moderate N fertilizer rates, with the effect of the inoculant complementing overall N fertilization [33]. However, this approach diminishes the advantages of using the commercial product in organic farming systems, where low N levels in the soil are expected. It is difficult to recommend this product as an alternative to green manuring with nodulated legumes. Finally, the N fixed amounts, even under the best conditions of this experiment (N50), indicated a modest value of 12.4% of N in the plant, which is more consistent with values published for Klebsiella spp. or Beijerinckia spp., and many other free-living fixers in rice fields and humid tropical environments [22,39,40,41] and not for a commercial product.
The concentrations of other nutrients, apart from N, in plant tissues did not vary significantly with the application of the inoculant. However, some nutrients did vary significantly with the N applied to the soil. With the application of the inoculant, there was no significant variation in DMY, unlike what occurred with N application to the soil (Figure 2). Soil N application significantly increased DMY, resulting in a reduction in the concentration of some nutrients in the tissues, due to a dilution effect. A concentration/dilution effect occurs when plant growth conditions vary without change in the availability of a given nutrient in the soil [42,43]. In this case, the increased availability of N, through soil application, stimulated biomass production and led to lower concentrations of other nutrients in the tissues whose availability in the soil was limited. Concentration/dilution effects are even more commonly observed in pot experiments due to restrictions on root expansion and nutrient access [11].
The soil organic matter increased with mineral fertilization. This is a result that may not seem intuitive but is attributed to the effect of N application on plant growth, including root system development, leading to greater deposition of organic substrate in the soil. This outcome has been observed in other studies [44,45] and is justified by the increased input of photosynthesis products into the soil through root growth, as well as through the mycelium of mycorrhizal fungi, which is the dominant pathway for C entering soil organic matter [45,46]. Some important nutrients, such as Ca and Mg, as well as CEC, and B, decreased in the soil with mineral N application. Once again, this observation suggests a scenario in which the stimulation of plant growth by N resulted in enhanced uptake of other nutrients. Given the limited volume of the pots, the increased nutrient uptake likely depleted their levels in the soil solution. In practice, this outcome reflects the principle of nutrient mining, where nutrient removal in harvests progressively reduces soil fertility, thereby requiring the supplementation of nutrients through fertilizer application [9,47].

5. Conclusions

The application of the inoculant prepared from Methylobacterium symbioticum sp. nov. (strain SB0023/3T) to the phyllosphere as a foliar spray did not significantly increase the DMY of roots, stems, and leaves of young olive plants compared to untreated plants. The inoculant did not increase the N concentration in leaves, stems, or roots. However, it significantly increased the total N recovered in the plant, as a result of small cumulative effects on DMY and N concentration in tissues. Considering all soil N applied treatments, the apparent N fixation (measured as the difference between N recovered in inoculated and non-inoculated plants) increased by 5.2%, with a negative value in the control treatment (−7.7%) and the highest value in the N50 treatment (12.4%). Although a global increase in fixed N due to the inoculant application was detected, the values obtained are of similar magnitude to those observed in other studies for free-living N-fixing microorganisms and would hardly justify the use of this commercial product by farmers.

Author Contributions

M.A.: funding acquisition, investigation, methodology, and writing—original draft preparation; S.R.: investigation; C.M.C.: methodology; writing—review and editing; M.Â.R.: conceptualisation, funding acquisition, project administration, data curation, writing—review and editing. All authors have read and agreed to the published version of the manuscript.

Funding

The authors are grateful to the Foundation for Science and Technology (FCT, Portugal) for financial support from national funds FCT/MCTES, to CIMO (UIDB/AGR/00690/2020), SusTEC (LA/P/0007/2020) and CITAB (UIDB/04033/2020).

Data Availability Statement

The raw data supporting the conclusions of this article will be made available by the authors on request.

Conflicts of Interest

The authors declare no conflicts of interest.

References

  1. Cabrera-Bañegil, M.; Schaide, T.; Manzano, R.; Delgado-Adámez, J.; Durán-Merás, I.; Martín-Vertedor, D. Optimization and validation of a rapid liquid chromatography method for determination of the main polyphenolic compounds in table olives and in olive paste. Food Chem. 2017, 233, 164–173. [Google Scholar] [CrossRef]
  2. Rallo, L.; Díez, C.M.; Morales-Sillero, A.; Miho, H.; Priego-Capote, F.; Rallo, P. Quality of olives: A focus on agricultural preharvest factors. Sci. Hortic. 2018, 233, 491–509. [Google Scholar] [CrossRef]
  3. Therios, I. Olives: Crop Production Science in Horticulture 18; CABI International: Oxfordshire, UK, 2009. [Google Scholar]
  4. FAOSTAT. Production: Crops and Livestock Products. 2024. Available online: https://www.fao.org/faostat/en/#data/QCL (accessed on 4 April 2024).
  5. Sibbett, G.S.; Osgood, J. Site selection and preparation, tree spacing and design, planting, and initial training. In Olive Production Manual, 2nd ed.; Sibbett, G.S., Ferguson, L., Eds.; University of California, Agriculture and Natural Resources: Oakalnd, CA, USA, 2005; pp. 27–33. [Google Scholar]
  6. Navarro, C.; Hidalgo, J.; Campo, M.G. Sistemas de plantación. In El Cultivo del Olivo, 7th ed.; Barranco, D., Fernandez-Escobar, R., Rallo, L., Eds.; Mundi-Prensa: Madrid, Spain, 2017; pp. 289–334. [Google Scholar]
  7. Barranco, D. Variedades e patrones. In El Cultivo del Olivo, 7th ed.; Barranco, D., Fernandez-Escobar, R., Rallo, L., Eds.; Mundi-Prensa: Madrid, Spain, 2017; pp. 65–95. [Google Scholar]
  8. Kyriakou, V.; Garagounis, I.; Vourros, A.; Vasileiou, E.; Stoukides, M. An electrochemical haber-bosch process. Joule 2020, 4, 142–158. [Google Scholar] [CrossRef]
  9. Weil, R.R.; Brady, N.C. The Nature and Properties of Soils, 15th ed.; Pearson Education Limited: Edinburg, UK, 2017. [Google Scholar]
  10. Havlin, J.L.; Beaton, J.D.; Tisdale, S.L.; Nelson, W.L. Soil Fertility and Fertilizers: An Introduction to Nutrient Management, 8th ed.; Pearson, Inc.: Chennai, India, 2017. [Google Scholar]
  11. Arrobas, M.; de Almeida, S.F.; Raimundo, S.; da Silva Domingues, L.; Rodrigues, M.Â. Leonardites rich in humic and fulvic acids had little effect on tissue elemental composition and dry matter yield in pot-grown olive cuttings. Soil Syst. 2022, 6, 7. [Google Scholar] [CrossRef]
  12. Russelle, M.P. Biological dinitrogen fixation in agriculture. In Nitrogen in Agricultural Systems; Schepers, J.S., Raun, W.R., Eds.; Agronomy Monograph n◦ 49; American Society of Agronomy, Crop Science Society of America, and Soil Science Society of America: Madison, WI, USA, 2008; pp. 281–359. [Google Scholar]
  13. Cooper, J.; Scherer, H. Nitrogen fixation. In Marschner’s Mineral Nutrition of Higher Plants, 3rd ed.; Marschner, P., Ed.; Academic Press: London, UK, 2012; pp. 389–408. [Google Scholar]
  14. Ohyama, T. The role of legume-rhizobium symbiosis in sustainable agriculture. In Legume Nitrogen Fixation in Soils with Low Phosphorus Availability Adaptation and Regulatory Implication; Sulieman, S., Tran, L.-S.P., Eds.; Springer: Cham, Switzerland, 2017; pp. 1–20. [Google Scholar] [CrossRef]
  15. Rodrigues, M.A.; Correia, C.M.; Claro, A.M.; Ferreira, I.Q.; Barbosa, J.C.; Moutinho-Pereira, J.M.; Bacelar, E.A.; Fernandes-Silva, A.A.; Arrobas, M. Soil nitrogen availability in olive orchards after mulching legume cover crop residues. Sci. Hortic. 2013, 156, 45–51. [Google Scholar] [CrossRef]
  16. Daryanto, S.; Fu, B.; Wang, L.; Jacinthe, P.-A.; Zhao, W. Quantitative synthesis on the ecosystem services of cover crops. Earth-Sci. Rev. 2018, 185, 357–373. [Google Scholar] [CrossRef]
  17. Torres, M.A.R.-R.; Ordóñez-Fernández, R.; Giráldez, J.V.; Márquez-García, J.; Laguna, A.; Carbonell-Bojollo, R. Efficiency of four different seeded plants and native vegetation as cover crops in the control of soil and carbon losses by water erosion in olive orchards. Land Degrad. Dev. 2018, 29, 2278–2290. [Google Scholar] [CrossRef]
  18. Afonso, S.; Arrobas, M.; Sá Morais, J.; Rodrigues, M.A. Hop dry matter yield and cone quality responses to amino acid and potassium-rich foliar spray applications. J. Plant Nutr. 2021, 44, 2042–2056. [Google Scholar] [CrossRef]
  19. Rouphael, Y.; Colla, G. Biostimulants in agriculture. Front. Plant Sci. 2020, 11, 40. [Google Scholar] [CrossRef]
  20. Ouledali, S.; Ennajeh, M.; Zrig, A.; Gianinazzi, S.; Khemira, H. Estimating the contribution of arbuscular mycorrhizal fungi to drought tolerance of potted olive trees (Olea europaea). Acta Physiol. Plant. 2018, 40, 80–93. [Google Scholar] [CrossRef]
  21. Aeron, A.; Kharel, E.; Jha, C.K.; Meena, V.S.; Aziz, S.M.A.; Islam, M.T.; Kim, K.; Meena, S.K.; Pattanayak, A.; Rajashekara, H.; et al. Revisiting the plant growth-promoting rhizobacteria: Lessons from the past and objectives for the future. Arch. Microbiol. 2020, 202, 665–676. [Google Scholar] [CrossRef]
  22. Barrera, S.E.; Sarango-Flóres, S.-W.; Montenegro-Gómez, S.-P. The phyllosphere microbiome and its potential application in horticultural crops. A review. Rev. Colomb. Cienc. Hortíc. 2019, 13, 384–396. [Google Scholar] [CrossRef]
  23. Pedraza, R.O.; Filippone, M.P.; Fontana, C.; Salazar, S.M.; Ramírez-Mata, A.; Sierra-Cacho, D.; Baca, B.E. Azospirillum. In Beneficial Microbes in Agro-Ecology: Bacteria and Fungi; Amaresan, N., Kumar, M.S., Annapurna, K., Kumar, K., Sankaranarayanan, A., Eds.; Academic Press: New York, NY, USA; Elsevier: London, UK, 2020; pp. 73–105. [Google Scholar]
  24. Razmjooei, Z.; Etemadi, M.; Eshghi, S.; Ramezanian, A.; Mirazimi Abarghuei, F.; Alizargar, J. Potential role of foliar application of azotobacter on growth, nutritional value and quality of lettuce under different nitrogen levels. Plants 2022, 11, 406. [Google Scholar] [CrossRef]
  25. Pascual, J.A.; Ros, M.; Martínez, J.; Carmona, F.; Bernabé, A.; Torres, R.; Lucena, T.; Aznar, R.; Arahal, D.R.; Fernández, F. Methylobacterium symbioticum sp. nov., a new species isolated from spores of Glomus iranicum var. tenuihypharum. Curr. Microb. 2020, 77, 2031–2041. [Google Scholar] [CrossRef]
  26. IPMA (Instituto Português do Mar e da Atmosfera). Normais Climatológicas. Instituto Português do Mar e da Atmosfera. 2024. Available online: https://www.ipma.pt/pt/oclima/normais.clima/ (accessed on 15 April 2024).
  27. WRB. World Reference Base for Soil Resources 2014, Update 2015. In International Soil Classification System for Naming Soils and Creating Legends for Soil Maps; World Soil Resources Reports No. 106; FAO: Rome, Italy, 2015. [Google Scholar]
  28. Temminghoff, E.E.; Houba, V.J. Plant Analysis Procedures, 2nd ed.; Temminghoff, E.E., Houba, V.J., Eds.; Kluwer Academic Publishers: London, UK, 2004. [Google Scholar] [CrossRef]
  29. Van Reeuwijk, L.P. Procedures for Soil Analysis, 6th ed.; Technical Paper 9; ISRIC: Wageningen, The Netherlands; FAO of the United Nations: Rome, Italy, 2002. [Google Scholar]
  30. FAO. Standard Operating Procedure for Soil Available Micronutrients (Cu, Fe, Mn, Zn) and Heavy Metals (Ni, Pb, Cd), DTPA Extraction Method. Rome. 2022. Available online: https://www.fao.org/3/cc0048en/cc0048en.pdf (accessed on 15 April 2024).
  31. Ferreira, I.Q.; Arrobas, M.; Moutinho-Pereira, J.M.; Correia, C.M.; Rodrigues, M.A. The effect of nitrogen applications on the growth of young olive trees and nitrogen use efficiency. Turk. J. Agric. For. 2020, 44, 278–289. [Google Scholar] [CrossRef]
  32. Bryson, G.M.; Mills, H.A.; Sasseville, D.N.; Jones, J.J., Jr.; Barker, A.V. Plant Analysis Handbook II: A Guide to Sampling, Preparation, Analysis, Interpretation and Use of Results of Agronomic and Horticultural Crop Plant Tissue; Micro-Macro Publishing, Inc.: Athens, GA, USA, 2014. [Google Scholar]
  33. Corteva. BlueN–Bioestimulante. Corteva Biologicals, Agriscience. 2024. Available online: https://www.corteva.pt/content/dam/dpagco/corteva/eu/pt/pt/files/folletos/DOC-BlueN-Folheto-Corteva_EU_PT.pdf (accessed on 12 March 2024).
  34. Vera, R.T.; García, A.J.B.; Álvarez, F.J.C.; Ruiz, J.M.; Martín, F.F. Application and effectiveness of Methylobacterium symbioticum as a biological inoculant in maize and strawberry crops. Folia Microbiol. 2024, 69, 121–131. [Google Scholar] [CrossRef]
  35. Bouchet, A.-S.; Laperch, A.; Bissuel-Belaygue, C.; Snowdon, R.; Nesi, N.; Stahl, A. Nitrogen use efficiency in rapeseed: A review. Agron. Sustain. Dev. 2016, 36, 38. [Google Scholar] [CrossRef]
  36. Abanda-Nkpwatt, D.; Müsch, M.; Tschiersch, J.; Boettner, M.; Schwab, W. Molecular interaction between Methylobacterium extorquens and seedlings: Growth promotion, methanol consumption, and localization of the methanol emission site. J. Exp. Bot. 2006, 57, 4025–4032. [Google Scholar] [CrossRef]
  37. Jinal, H.N.; Amaresan, N.; Sankaranarayanan, A. Methylobacterium. In Beneficial Microbes in Agro-Ecology: Bacteria and Fungi; Amaresan, N., Kumar, M.S., Annapurna, K., Kumar, K., Sankaranarayanan, A., Eds.; Elsevier: London, UK, 2020; pp. 509–519. [Google Scholar]
  38. Srivastava, A.; Dixit, R.; Chand, N.; Kumar, P. Overview of methylotrophic microorganisms in agriculture. Bio Sci. Res. Bull. 2022, 38, 65–71. [Google Scholar] [CrossRef]
  39. Fürnkranz, M.; Wanek, W.; Richter, A.; Abell, G.; Rasche, F.; Sessitsch, A. Nitrogen fixation by phyllosphere bacteria associated with higher plants and their colonizing epiphytes of a tropical lowland rainforest of Costa Rica. ISME J. 2008, 2, 561–570. [Google Scholar] [CrossRef]
  40. Moreira, J.C.M.; Brum, M.; Almeida, L.C.; Barrera-Berdugo, S.; de Souza, A.A.; de Camargo, P.B.; Oliveira, R.S.; Alves, L.F.; Rosado, B.H.P.; Lambais, M.R. Asymbiotic nitrogen fixation in the phyllosphere of the Amazon Forest: Changing nitrogen cycle paradigms. Sci. Total Environ. 2021, 773, 145066. [Google Scholar] [CrossRef]
  41. Padgurschi, M.C.G.; Vieira, S.A.; Stefani, E.J.F.; Nardoto, G.B.; Joly, C.A. Nitrogen input by bamboos in neotropical forest: A new perspective. PeerJ 2018, 6, e6024. [Google Scholar] [CrossRef]
  42. Jarrell, W.M.; Beverly, R.B. The dilution effect in plant nutrition studies. Adv. Agron. 1981, 34, 197–224. [Google Scholar]
  43. Römheld, V. Diagnosis of deficiency and toxicity of nutrients. In Marschner’s Mineral Nutrition of Higher Plants; Marschner, P., Ed.; Elsevier: London, UK, 2012; pp. 299–312. [Google Scholar]
  44. Lopes, J.I.; Correia, C.M.; Gonçalves, A.; Silva, E.; Martins, S.; Arrobas, M.; Rodrigues, M.A. Arbuscular Mycorrhizal Fungi Inoculation Reduced the Growth of Pre-Rooted Olive Cuttings in a Greenhouse. Soil Syst. 2021, 5, 30. [Google Scholar] [CrossRef]
  45. Godbold, D.L.; Hoosbeek, M.R.; Lukac, M.; Cotrufo, M.F.; Janssens, I.A.; Ceulemans, R.; Polle, A.; Velthorst, E.J.; Scarascia- Mugnozza, G.; Angelis, P.; et al. Mycorrhizal hyphal turnover as a dominant process for carbon input into soil organic matter. Plant Soil 2006, 281, 15–24. [Google Scholar] [CrossRef]
  46. Leifheit, E.F.; Verbruggen, E.; Rillig, M.C. Arbuscular mycorrhizal fungi reduce decomposition of woody plant litter while increasing soil aggregation. Soil Biol. Biochem. 2015, 81, 323–328. [Google Scholar] [CrossRef]
  47. Majumdar, K.; Sanyal, S.K.; Dutta, S.K.; Satyanarayana, T.; Singh, V.K. Nutrient mining: Addressing the challenges to soil resources and food security. In Biofortification of Food Crops; Singh, U., Praharaj, C., Singh, S., Singh, N., Eds.; Springer: New Delhi, India, 2016. [Google Scholar]
Figure 1. Average monthly temperature and precipitation during the experimental period and regional normal (Bragança).
Horticulturae 10 00604 g001
Figure 2. Total dry matter yield (DMY) and DMY in roots, stems, and leaves in response to the application (Yes) or not (No) of the nitrogen (N)-fixing microorganism (Micro) and the N rate (N rate) applied to the soil [0 (N0), 25 (N25), 50 (N50), and 100 (N100) kg ha−1]. Pm, Pn, and Pi represent the probabilities associated with the factors Micro, N rate, and interaction, respectively. Different lowercase letters within columns indicate significant differences between treatments for the DMY of that plant tissue. Different capital letters at the top of the bars indicate significant differences for the total plant DMY. Error bars represent the standard error.
Horticulturae 10 00604 g002
Table 1. Nitrogen (N) concentration and N recovery in roots, stems and leaves, and total N recovery in response to the application (Yes) or not (No) of the N-fixing microorganism (Micro) and the N rate (N rate) applied to the soil [0 (N0), 25 (N25), 50 (N50), and 100 (N100) kg ha−1]. Pm, Pn, and Pi represent the probabilities associated with the factors Micro, N rate, and interaction, respectively.
N Concentration (g kg−1)N Recovery (g plant−1)
RootsStemsLeavesRootsStemsLeavesTotal
MicroNo9.7 a5.1 a13.2 a0.27 a0.35 a0.76 b1.38 b
Yes10.3 a5.3 a13.2 a0.27 a0.38 a0.82 a1.47 a
N rateN08.2 d4.3 c9.9 d0.18 c0.24 c0.45 d0.87 d
N259.4 c4.9 b11.9 c0.25 b0.30 c0.60 c1.15 c
N5010.3 b5.2 b13.3 b0.28 b0.38 b0.84 b1.50 b
N10012.2 a6.3 a17.7 a0.37 a0.54 a1.26 a2.17 a
Prob.Pm0.10400.15270.90200.68950.13730.04670.0017
Pn<0.0001<0.0001<0.0001<0.0001<0.0001<0.0001<0.0001
Pi0.00040.05350.51060.89370.03360.34650.0533
In columns, separated by experimental factor (Micro and N rate), means followed by the same letter are not significantly different by the Tukey HSD test (α = 0.05).
Table 2. Mean (±standard deviation, n = 4) apparent nitrogen recovery (ANR) of soil-applied N, and apparent N fixation (ANF) by treatment [0 (N0), 25 (N25), 50 (N50) and 100 (N100) kg N ha−1].
N Rate1 ANR (%)2 ANR (%)3 ANF (%)
N0------−7.7 ± 5.43
N2551.4 ± 7.7281.7 ± 13.575.2 ± 5.01
N5060.2 ± 5.5491.2 ± 2.2812.4 ± 2.04
N10071.9 ± 6.9183.3 ± 2.795.8 ± 3.78
1,2 Apparent N recovery (%) = 100 × [(N recovered in the fertilized treatments − N recovered in the control treatment)/N applied as a fertilizer], estimated from 1 inoculated (Yes) and 2 non-inoculated (No) plants. 3 Apparent N fixation (%) = 100 × [N recovered in inoculated (Yes) plants − N recovered in non-inoculated (No) plants]/N recovered in inoculated plants.
Table 3. Leaf nutrient concentration in response to the application (Yes) or not (No) of the nitrogen (N)-fixing microorganism (Micro) and the N rate (N rate) applied to the soil [0 (N0), 25 (N25), 50 (N50), and 100 (N100) kg ha−1]. Pm, Pn, and Pi represent the probabilities associated with Micro and N rate factors and interaction, respectively.
Macronutrients (g kg−1)Micronutrients (mg kg−1)
PKCaMgBFeMnZnCu
MicroNo2.0 a10.9 a5.1 a1.0 a23.8 a199.7 a19.2 a16.0 a5.5 a
Yes2.1 a11.0 a5.0 a1.0 a24.2 a157.9 a22.1 a16.8 a5.7 a
N rateN02.2 a11.1 ab5.4 a0.9 a26.0 a141.4 a18.8 a15.4 a4.8 a
N252.2 a11.4 a5.1 a1.0 a24.8 ab197.9 a19.2 a16.4 a5.6 a
N502.0 ab10.9 ab5.1 a1.0 a23.1 ab235.9 a24.4 a16.8 a5.9 a
N1001.9 b10.4 b4.7 b1.0 a22.1 b139.9 a20.1 a16.8 a6.1 a
Prob.Pm0.23990.96630.13190.83010.66700.27070.06160.14020.7291
Pn0.01240.04100.00030.22400.02290.21830.05070.23060.2582
Pi0.99790.17310.01850.74720.16560.12770.11260.11370.7054
In columns, separated by experimental factor (Micro and N rate), means followed by the same letter are not significantly different by the Tukey HSD test (α = 0.05).
Table 4. Stem nutrient concentration in response to the application (Yes) or not (No) of the nitrogen (N)-fixing microorganism (Micro) and the N rate (N rate) applied to the soil [0 (N0), 25 (N25), 50 (N50), and 100 (N100) kg ha−1]. Pm, Pn, and Pi represent the probabilities associated with Micro and N rate factors and interaction, respectively.
Macronutrients (g kg−1)Micronutrients (mg kg−1)
PKCaMgBFeMnZnCu
MicroNo1.3 a9.4 a5.1 a0.8 a19.6 a215.9 a24.4 a25.7 a5.6 a
Yes1.4 a9.6 a5.0 a0.8 a19.6 a276.9 a25.5 a26.9 a6.1 a
N rateN01.4 a9.9 a5.5 a0.8 a20.5 a223.8 a25.6 a28.3 a4.9 a
N251.4 a9.6 ab5.2 ab0.9 a19.7 ab297.5 a26.5 a28.3 a6.2 a
N501.3 a9.3 ab4.8 bc0.8 a18.9 b263.3 a25.1 a25.7 ab5.9 a
N1001.3 a9.1 b4.7 c0.8 a19.3 b200.9 a22.5 a23.1 b6.2 a
Prob.Pm0.29500.50840.07520.66620.97830.05140.30990.11470.1653
Pn0.16820.0075<0.00010.30320.00240.13180.0975<0.00010.0577
Pi0.00380.39700.05500.47450.44970.53720.48690.00230.6764
In columns, separated by experimental factor (Micro and N rate), means followed by the same letter are not significantly different by the Tukey HSD test (α = 0.05).
Table 5. Root nutrient concentration in response to the application (Yes) or not (No) of the nitrogen (N)-fixing microorganism (Micro) and the N rate (N rate) applied to the soil [0 (N0), 25 (N25), 50 (N50), and 100 (N100) kg ha−1]. Pm, Pn, and Pi represent the probabilities associated with Micro and N rate factors and interaction, respectively.
Macronutrients (g kg−1)Micronutrients (mg kg−1)
PKCaMgBFeMnZnCu
MicroNo2.7 a14.6 a7.3 a3.1 a26.1 a7803.7 a156.6 a41.5 a98.7 b
Yes2.8 a14.3 a7.7 a3.5 a26.8 a8465.5 a201.1 a43.7 a142.5 a
N rateN03.0 ab14.3 a7.4 a3.5 a26.2 a8367.4 a151.6 a45.0 a107.2 b
N253.2 a14.1 a8.2 a3.4 a25.8 a8881.8 a226.6 a47.0 a151.5 a
N502.6 ab14.0 a7.2 a3.1 a27.0 a7598.8 a199.0 a40.4 a121.5 ab
N1002.2 b15.3 a7.3 a3.3 a26.7 a7690.3 a138.2 a38.1 a102.1 b
Prob.Pm0.41420.55870.49530.05900.52670.08120.15680.31120.0004
Pn0.01770.30410.60630.39550.85580.07760.17980.05750.0052
Pi0.14300.09420.53250.14100.97390.76540.19830.06900.0396
In columns, separated by experimental factor (Micro and N rate), means followed by the same letter are not significantly different by the Tukey HSD test (α = 0.05).
Table 6. Soil organic carbon (C), pHH2O, extractable phosphorus (P), exchangeable potassium (K), calcium (Ca) and magnesium (Mg), cation exchange capacity (CEC), and extractable boron (B), in response to the application (Yes) or not (No) of the nitrogen (N)-fixing microorganism (Micro) and the N rate (N rate) applied to the soil [0 (N0), 25 (N25), 50 (N50), and 100 (N100) kg ha−1]. Pm, Pn, and Pi represent the probabilities associated with Micro and N rate factors and interaction, respectively.
Organic CpHP (P2O5)KCaMgCECB
g kg−1H2Omg kg−1cmol+ kg−1mg kg−1
MicroNo23.06 a7.11 a327.2 a1.31 a16.12 a5.29 a23.6 a1.69 a
Yes22.91 a7.14 a317.8 a1.30 a16.04 a5.27 a23.5 a1.74 a
N rateN022.33 b7.09 a317.2 a1.33 a16.93 a5.49 ab24.7 a1.84 a
N2522.69 b7.12 a329.6 a1.34 a16.92 a5.70 a24.9 a1.86 a
N5023.23 a7.16 a320.4 a1.31 a15.13 b4.91 b22.2 b1.60 b
N10023.68 a7.14 a322.7 a1.24 a15.33 b5.00 b22.5 b1.55 b
ProbPm0.21690.21170.20120.71090.87990.89730.87620.3822
Pn<0.00010.22010.66640.10410.02920.00680.00730.0012
Pi0.05500.01020.58040.00090.86820.57950.85710.0001
In columns, separated by experimental factor (Micro and N rate), means followed by the same letter are not significantly different by the Tukey HSD test (α = 0.05).
Disclaimer/Publisher’s Note: The statements, opinions and data contained in all publications are solely those of the individual author(s) and contributor(s) and not of MDPI and/or the editor(s). MDPI and/or the editor(s) disclaim responsibility for any injury to people or property resulting from any ideas, methods, instructions or products referred to in the content.

