Abstract
Mealy peaches are dry and flavorless, which reduces their consumer acceptance. A deeper understanding of the mechanism underlying mealiness is crucial to enhancing peach fruit quality. In this study, comparative profiling was conducted on CP13, CP14, CM, and RM peaches. Sensory evaluation indicated that CP13 and CM are non-mealy clingstone and freestone peaches, respectively, and CP14 and RM are mealy freestone peaches. Both CP13 and CP14, identified as stony hard (SH) peaches, exhibited minimal ethylene release, whereas CM and RM, identified as melting flesh (MF) peaches, released high amounts of ethylene during the ripening process. Scanning electron microscopy (SEM) microstructure observation indicated that cells in the flesh tissue of mealy peaches, CP14 (SH) and RM (MF), were intact and separated, with large intercellular spaces and irregular arrangements. The main factor that promotes mealiness is differences in pectin metabolism, which impact cell wall composition. The fluctuations in polygalacturonase (PG) and pectin methylesterase (PME) activity between mealy and non-mealy peaches were the main factor contributing to mealiness. However, the changes in cell wall metabolism that caused these fluctuations did not have a clear direction. Using transcriptome analysis and weighted gene co-expression network analysis (WGCNA), we were able to identify forty differentially expressed genes (DEGs) that are associated with mealy patterns. Among these DEGs, genes encoding PG were significantly upregulated in mealy peaches (CP14 and RM) compared to non-mealy peaches (CP13 and CM). PpPG1 was the main effector gene for mealiness, while PpPG2, PpEGase2, PpEXP1, PpEXP3, PpAGP2, PpIAA4, and PpABA2 were identified as candidate genes regulating peach mealiness. These findings provide a solid experimental basis for understanding the textual distinctions between mealy and non-mealy peaches.
1. Introduction
Peach (Prunus persica L. Batsch) is one of the most popular fruits in the world and is esteemed for its pleasant flavor and abundant nutritional benefits. The economic value of peaches mainly depends on their quality, taste, aroma, and shelf-life [1]. Peaches are usually classified as melting flesh (MF), non-melting flesh (NMF) [2], or stony hard (SH) [3,4] depending on the firmness and texture of the fruit. Both MF and NMF peaches release substantial amounts of ethylene during the ripening process. MF peaches soften quickly, rendering them vulnerable to damage and decay during transportation, whereas NMF peaches maintain firmness even when fully ripe, as they do not undergo the softening phase. SH peaches, characterized by minimal ethylene release and high post-ripening firmness, can retain their texture for extended periods on the tree and remain firm post-harvest [5]. The rapid softening and short shelf-life of MF peaches are serious problems that limit their production. By contrast, SH peaches display high firmness and a crisp texture and therefore have become popular in recent years [6,7]. Nonetheless, our observations indicate that freestone SH peaches tend to lose firmness, develop a mealy texture as they ripen, and lose their crispness.
Mealiness is a textural defect characterized by a grainy, dry, coarse, gel-like quality or texture perceived by the consumer upon chewing, and this poor sensory quality of the fruit reduces its palatability [8,9]. Mealiness has been observed in a variety of fruits, including apple [10], tomato [11], and watermelon [12]. Mealiness in peaches and other stone fruits is believed to be caused by a ripening disorder, most commonly thought to be due to an imbalance in pectin degradation [13]. Research into the biochemical causes of mealiness has primarily focused on the differences in juice content, cell wall composition, and pectin abundance between juicy and mealy fruits [5]. Mealy peaches possess a large proportion of insoluble pectic material with a higher molecular weight and a lower degree of esterification than juicy peaches [14]. It is believed that the loss of polygalacturonase (PG) activity, combined with continued pectin de-esterification, leads to the accumulation of gel-forming pectic compounds in the fruit flesh, resulting in mealiness [13].
Alterations in the composition and organization of primary cell walls play a crucial role in determining fruit texture [15]. The loss of juiciness, low level of gel-like pectin formation, and changes in cell wall structure are associated with the activity of enzymes related to cell wall modification and degradation; abnormal activity of these enzymes generally leads to alterations in pectin metabolism [16,17]. Lurie et al. (2003) [18] reported that the degree of methyl esterification of pectin may also be altered in mealy fruits. Brummell et al. (2004) [16] confirmed that the solubilization of high-molecular-weight pectins does not increase significantly in juicy fruits but remains low in mealy fruits. The development of mealiness is related to PG activity; however, ripening fruits undergo more complex changes in texture than a simple alteration in either PG or PME activity. Expansin protein (EXP) has been linked to the progression of mealiness, and pectin depolymerization is considered to be a cooperative process [19]. Related factors that affect the degradation of pectin, hemicellulose, and cell wall cellulose may ultimately result in the destruction of the cell structure [20]. Enzymes involved in cell wall modification, such as PG, β-galactosidase (GAL), endo-β-mannanase (MAN), α-l-arabinofuranase (AF), xylosidase (XY), and cellulase (CEL), play pivotal roles in altering cell wall structure by modifying and depolymerizing hemicellulose, thereby contributing to the disruption of cell wall architecture [21].
Structural genes, transcription factors (TFs), and epigenetic factors regulate the fruit texture during ripening. In peach, PpNAC1 directly activates the expression of genes encoding cell wall modification enzymes such as pectinesterase1 (PpPME1), pectate lyase1 (PpPL1), and polygalacturonase1 (PpPG1) [22]. Genetic analysis of peaches revealed that endo-PG is responsible for fruit texture [23]. Transcriptome analysis also revealed that the expression of β-galactosidase genes can alter cell wall dynamics in apples [24]. A chromosome-wide comparison of DNA methylation levels between mealy and non-mealy peaches showed significant differences in Chr1, Chr4, and Chr8 as well as differences in Chr4 co-localized with quantitative trait loci (QTLs) associated with mealiness [25]. Nuñez-Lillo et al. (2015) [26] detected one QTL associated with peach mealiness in linkage group 4 (LG4). Nine candidate genes related to cell wall synthesis and ethylene signaling were identified within these QTLs. Subsequently, in 2019, an additional QTL was mapped to LG5, where an endo-1,3-beta-glucosidase-encoding gene was found to be associated with mealiness [27]. In apple, transcriptome analysis identified MdERF-like and MdGAL as core genes associated with mealiness [15].
In peach, PpNAC1 regulates the expression of genes encoding fruit-ripening-related enzymes, and PpDML1 regulates DNA methylation levels at the PpNAC1 promoter. The low DNA methylation levels of PpNAC1 enhanced the transcription of ripening-related genes, such as PG1 and PME1 [22]. The degree of DNA methylation of NAC1 and NAC5 can affect the fruit maturity date in peach [28]. In colorless non-ripening (cnr) mutants of tomato, epigenetic modification plays a crucial role in regulating fruit texture and ripening [29]. A ripening-promoting H3K27me3 demethylase, SlJMJ6, facilitates tomato fruit ripening by activating the expression of ripening-related genes such as ACS4, ACO1, PL, and DML2 [30]. Although some studies on fruit mealiness have been conducted in peach, a systematic analysis of the mealiness mechanisms is lacking. Moreover, we have found that peach fruits exhibit different types of mealy textures during ripening, which greatly depend on the cultivar. Therefore, it is necessary to perform a comprehensive characterization of the physiological traits of mealy peach fruits and study the underlying molecular regulatory mechanisms.
In this study, we explored the differences in the physiological and textural characteristics of peach fruits during ripening among four cultivars, namely, two mealy cultivars (CP14 [SH] and RM [MF]) and two non-mealy cultivars (CP13 [SH] and CM [MF]). Our analysis encompassed the evaluation of peach flesh tissue microstructure, cell wall composition, enzyme activity, and ethylene production across all the cultivars. Furthermore, we performed transcriptome analysis and weighted gene co-expression network analysis (WGCNA) to identify the transcriptional regulatory network, comprising genes and TFs, which controls mealiness in peach.
2. Materials and Methods
2.1. Plant Material and Fruit Sampling
Mealy peach cultivars CP14 and RM and non-mealy peach cultivars CP13 and CM were used in this study. Plants were grown at Zhengzhou Fruit Research Institute (ZFRI), Chinese Academy of Agricultural Sciences (CAAS), China. Fruits were collected at different developmental stages (S4-1, S4-2, and S4-3) based on their firmness, weight, and soluble solid content. The S4-1, S4-2, and S4-3 stages coincided with 78, 83, and 90 days after flowering (DAF), respectively, for CP13 and CP14 fruits, and with 93, 98, and 103 DAF for CM and RM fruits. The S4-1 stage is the fruit commercial harvest period; S4-2 is the ripe fruit period; and S4-3 is the over-ripe fruit period. Flesh tissues were segmented, frozen rapidly in liquid nitrogen, and then stored at −80 °C.
2.2. Evaluation of Ethylene Production, Flesh Firmness, and Mealiness
To measure ethylene production, each fruit sample was stored in an airtight container at 25 °C for 2 h, and the amount of ethylene produced was measured using a GC2010 gas chromatograph (Shimadzu, Kyoto, Japan) [31]. Flesh firmness was measured using a fruit pressure tester (GY-4-J; TOP, Zhejiang, China). A sensory evaluation of peach mealiness was performed by a panel comprising ten skilled members, four of whom were experts. Each peach was quartered, observed, and tasted by a panel of ten members. Fruits of each cultivar were evaluated in triplicate, with each replicate containing 10 fruits. The sensory evaluation focused on peach fruit texture, and the fruits were rated as mealy or non-mealy [15]. For each sample, 30 fruits were collected, and a total of three biological replicates were conducted with 10 fruits each. Three intact fruits were taken from each of the 10 fruits for ethylene measurement, and each replicate was measured in triplicate before the average value was calculated. After ethylene measurement, the firmness of the fruit was measured. Then, a quarter was taken for sensory evaluation, and the remaining part was segmented, frozen rapidly in liquid nitrogen, and then stored at −80 °C for subsequent determination of cell wall polysaccharides, enzyme activity, the transcriptome, etc. The firmness, soluble sugar, juice yield, and sensory assessment indices of 30 fruits from each sample were determined one by one.
2.3. Analysis of Fruit Flesh Microstructure
The mesocarp of peach fruits was cut into cubes (4 mm × 3 mm × 2 mm) and fixed in 0.1 M phosphate buffer (pH 7.2) containing 2% (w/v) paraformaldehyde and 0.1% (w/v) glutaraldehyde. The fixed tissues were washed with phosphate buffer, dehydrated using anhydrous ethanol series (10%, 20%, 30%, 40%, 50%, 60%, 70%, 80%, 90%, 100%), and then dried in a critical-point dryer (Bal-Tec CPD030, Balzers, Liechtenstein) using liquid CO2 as the transitional fluid. Each dried piece of mesocarp tissue was mounted on an anodized aluminum stub (IB-3; Eiko Co., Tokyo, Japan) using conducting silver glue. The tissue pieces were sputter-coated with a thin gold layer, and the surface morphology of each piece was observed using a scanning electron microscope (SEM) (S-3400 N; Hitachi Co., Tokyo, Japan) at 15 kV [32,33].
2.4. Extraction and Fractionation of Cell Wall Material (CWM)
Peach mesocarp tissue samples were ground in liquid nitrogen to obtain a uniform powder. Five grams of each powdered sample was homogenized in 32 mL of 95% (v/v) ethanol and boiled for 30 min. The residue was separated and boiled twice, as described above. After filtration, the insoluble residue was washed with 80 mL of acetone and partially dried by applying a mild vacuum. After the CWM had fully dried, its yield was calculated. Then, 100 mg of CWM was sequentially extracted with ultrapure water, cyclohexane-trans-1,2-diamine tetra-acetic acid (CDTA), and sodium carbonate to obtain fractions enriched in different types of pectin, including water-soluble pectin (WSP), chelator-soluble pectin (CSP), and sodium carbonate-soluble pectin (SSP). Two hemicellulose-enriched fractions were obtained via extraction with 1 M and 4 M KOH [34,35].
2.5. Enzyme Activity Measurements
To measure enzyme activity, powdered frozen mesocarp tissue was stirred in 12% polyethylene glycol, washed, and extracted with a low- or high-salt buffer, as described by Zhou et al. (2000) [36]. PG activity was determined using soluble protein extracts, which were prepared by extracting insoluble residues with 0.75 M NaCl/50 mM sodium acetate (pH 5.0). β-Gal activity was measured against locust bean gum in 0.1 M citrate–phosphate (pH 5.0) via viscometry. PME activity was assayed using the method of Li et al. (2022) [37]. Briefly, the powdered frozen tissue was stirred in 1 M NaCl containing 30 mM PVPP, and the supernatant was collected and adjusted to pH 7.5 using 0.01 M NaOH. The 20 μL enzyme solution was mixed with 170 µL 3 mM phosphate buffer (pH 7.5) containing 0.5% (w/v) pectin and 0.01% bromothymol blue, and the absorbance of the mixture was measured at 620 nm to determine PME activity. EGase activity was measured using the DNS method [38]. The amounts of reducing sugars released were determined using 1.3% (w/v) carboxymethylcellulose (in 20 mM Tris-HCl, pH 7.0) as the assay substrate and glucose as the standard. One unit (U) of EGase activity was defined as the release of 1 μmol of glucose per minute [39].
2.6. Acid Hydrolysis of Polysaccharides and Neutral Sugars
Acid hydrolysis of polysaccharides and neutral sugars was carried out using the procedure of Duan et al. (2008) [40]. The CWM of fruit tissue was prepared for each of the 4 cvs. at 3 stages of ripeness, as described above (Section 2.4). Then, 10 mg of the polysaccharide sample was hydrolyzed for 6 h at 120 °C using 10 mL of 2 M trifluoroacetic acid (TFA). The trimethylsilylation reagent was used in derivation. Hydrolyzed polysaccharide fractions were subjected to monosaccharide analysis via high-performance liquid chromatography (HPLC) using a Thermo ICS 5000+ System (ICS 5000+; Thermo Fisher Scientific, Waltham, MA, USA) equipped with a CarboPac PA20 column (150 mm × 3 mm, 10 μm) and an Amperometric Detector (Dionex; Thermo Fisher Scientific, Waltham, MA, USA). A 5 μL volume of the sample was injected in the HPLC system. Elution was carried out at a flow rate of 0.5 mL/min using solvents A (H2O), B (0.1 M NaOH), and C (0.1 M NaOH and 0.2 M NaOAc) as the mobile phase [41]. Quantification was conducted using the corresponding sugars as external standards.
2.7. RNA-Seq and Data Analysis
Total RNA was extracted from peach flesh tissues using TRIzol Reagent (Invitrogen, Carlsbad, CA, USA) and subsequently treated with RNase-free DNase (Qiagen, Valencia, CA, USA). A total of 36 RNA-seq libraries were constructed as described previously. Biomarker Technologies (Beijing, China) sequenced the RNA-seq libraries on the Illumina HiSeq 4000 sequencing platform and performed bioinformatic analysis. Clean reads were obtained by removing reads containing adapters, poly-Ns, and low-quality reads from the raw data using in-house Perl scripts. The Q20 and Q30 values and GC content of the clean data were calculated. Reference genome sequence and gene model annotation files were downloaded from GDR (URL: https://www.rosaceae.org/species/prunus_persica/genome_v2.0.a1, accessed on 15 January 2015).
2.8. Identification and Functional Analysis of Differentially Expressed Genes (DEGs)
Relative transcript abundance was calculated for biological replicates and expressed as fragments per kilobase of transcript per million mapped reads (FPKM). HTSeq v0.6.1 was used to count the read numbers mapped to each gene [42]. To determine reproducibility among biological replicates, the Pearson’s correlation coefficient was calculated using log10(FPKM+1) values. p-values were adjusted using Benjamini and Hochberg’s method for controlling the false discovery rate (FDR). The identified DEGs were examined for the enrichment of Gene Ontology (GO) terms and Kyoto Encyclopedia of Genes and Genomes (KEGG) pathways. The GO terms and KEGG pathways with an adjusted p-value of <0.05 were determined to be significantly enriched. A hierarchical clustering heatmap was generated using the heatmap function of TBtools v2.0, based on the |log2(fold change)| value of each comparative pair.
2.9. Weighted Gene Co-Expression Network Analysis (WGCNA)
According to Li et al. (2023) [43], the gene network is assumed to follow a scale-free distribution. The WGCNA algorithm and the R package ‘WGCNA’ were used in this study to identify gene modules linked to mealiness [44]. Hierarchical clustering was employed to create an unsigned topological overlap matrix. Blockwise modules were the default function, with 30 modules, an optimal power value of 9, a depth split of 2, and a minimum height threshold of 0.25. Module eigenvalues were computed and used to determine the relationship between modules and mealiness. Gene centrality inside WGCNA modules was calculated using an eigengene-based connectivity value (KME) of >0.9 [45].
2.10. Statistical Analysis
Data were subjected to one-way analysis of variance (ANOVA) using GraphPad Prism 9.0 (Graphpad Prism 9.0, Graphpad Software, San Diego, CA, USA). Significant differences between groups were detected at p < 0.05.
3. Results
3.1. Textural and Physiological Changes in Peach Fruit Flesh during Ripening
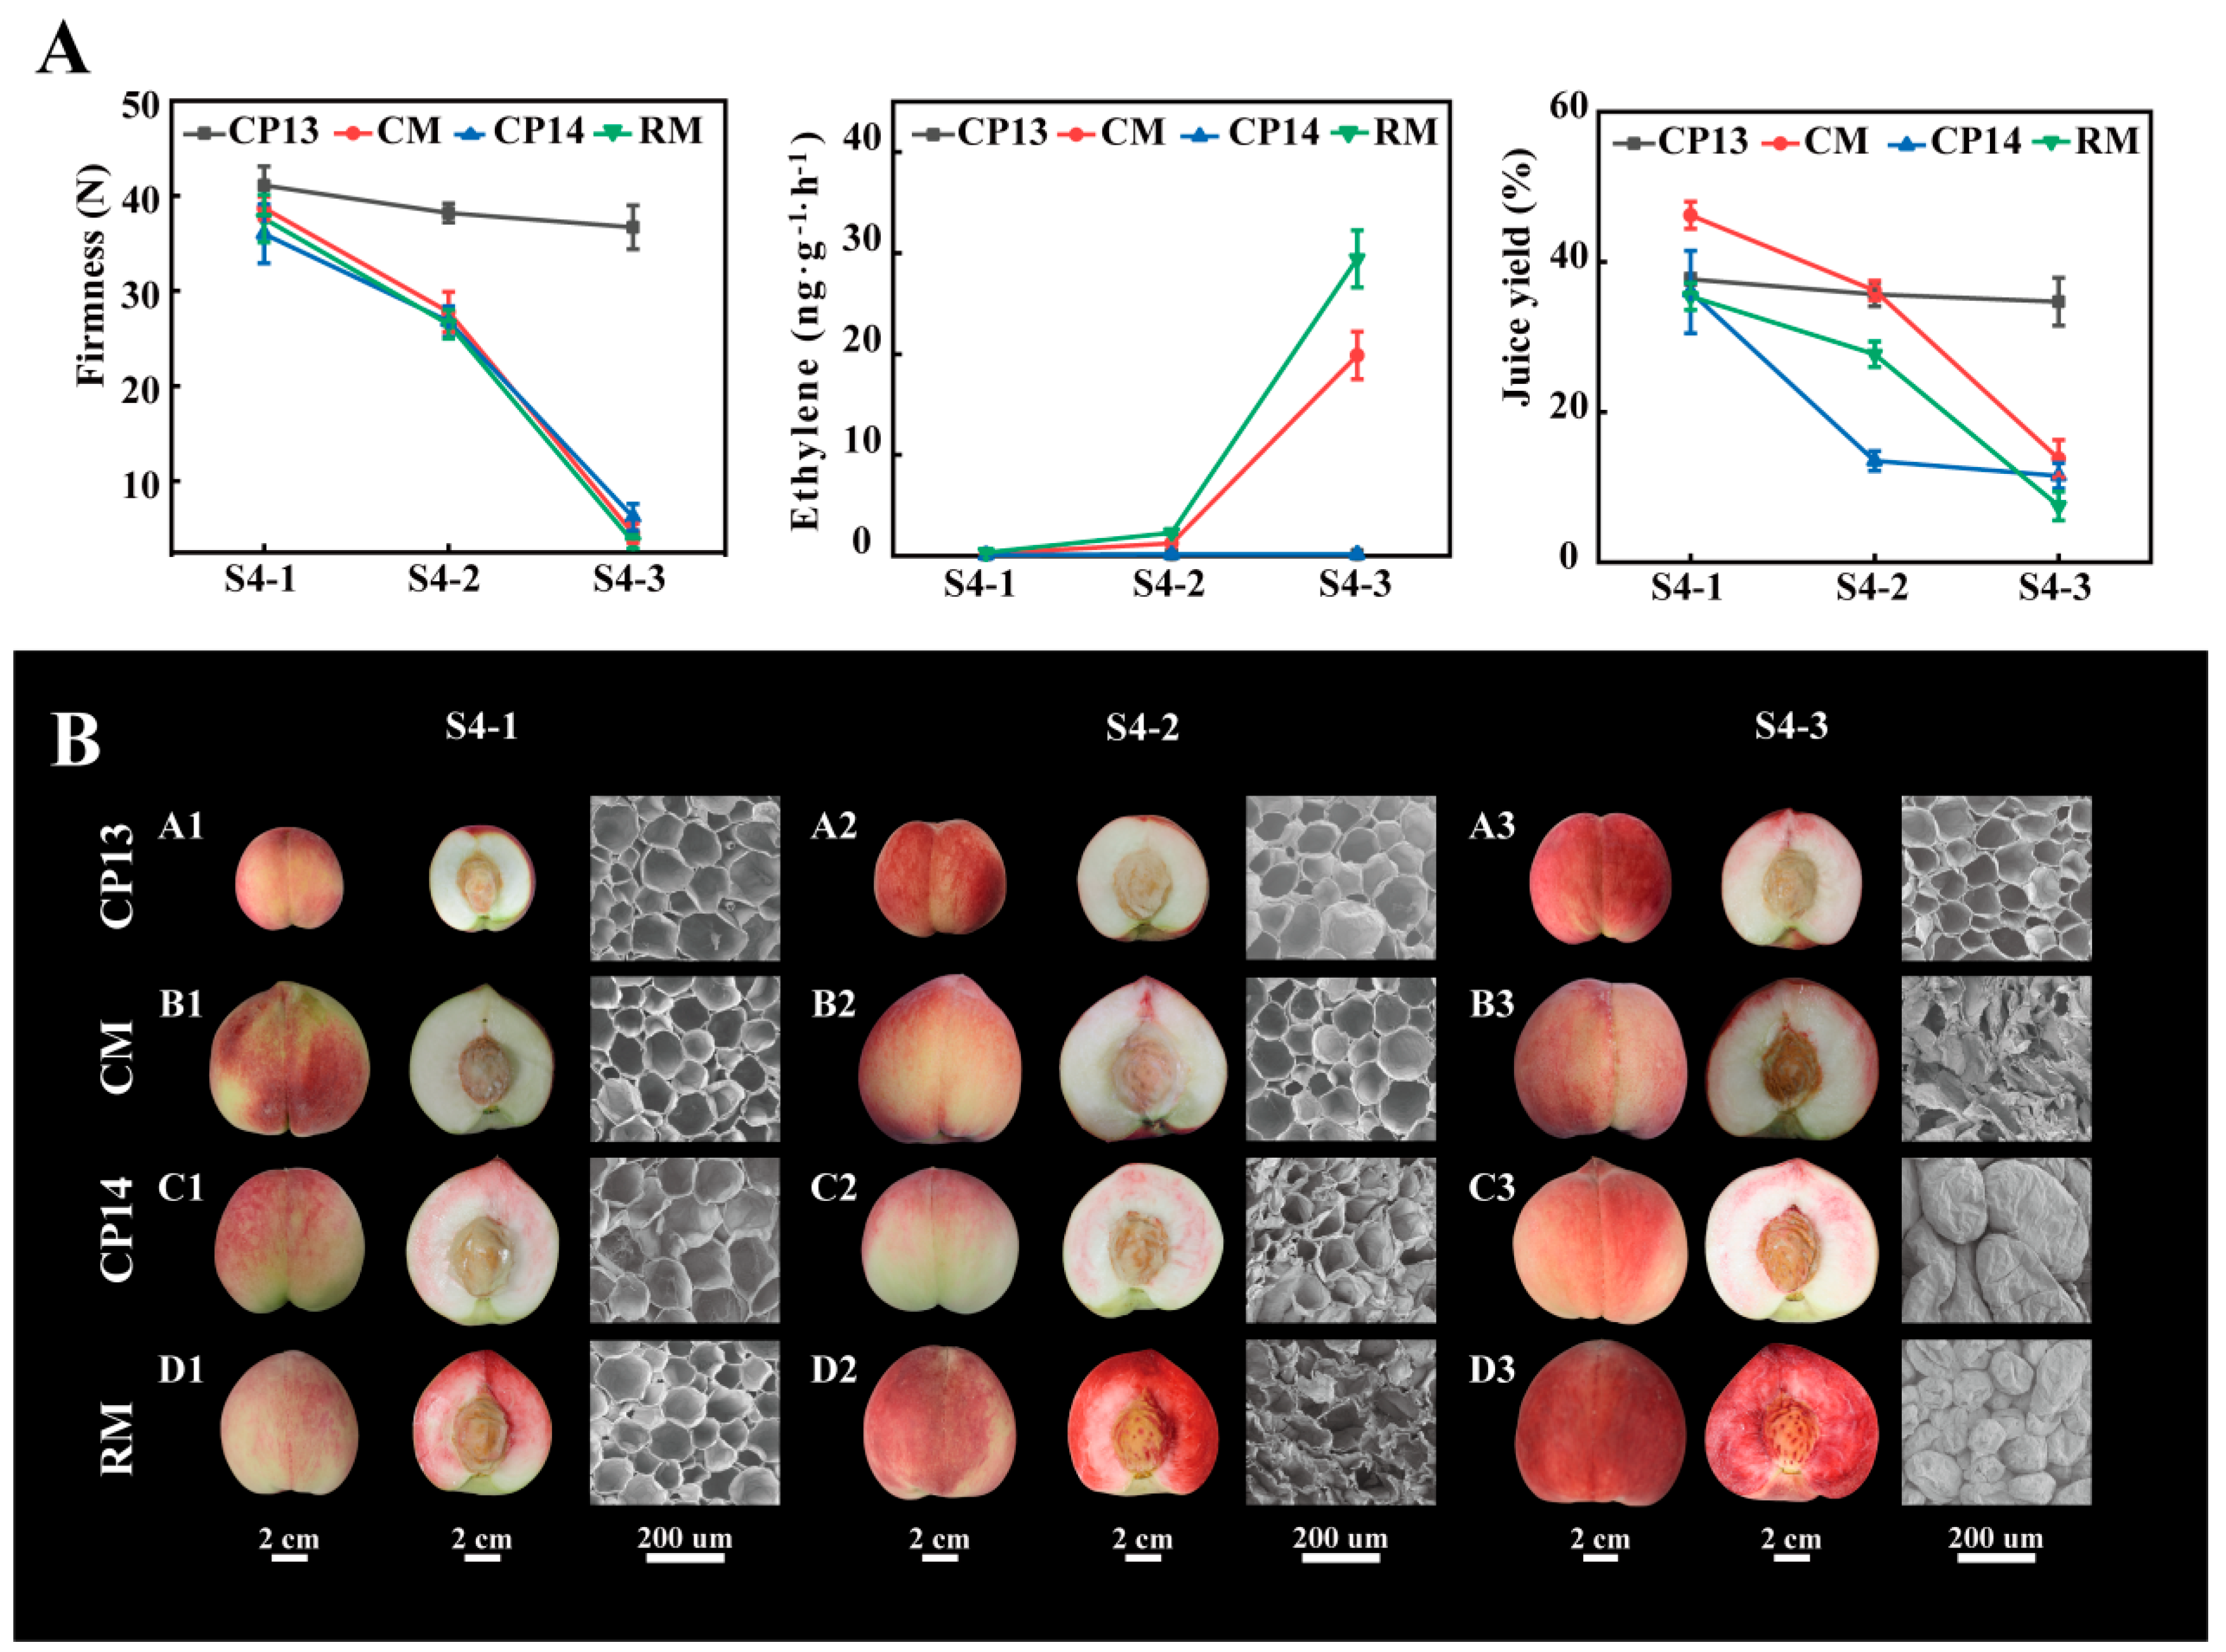
Sensory evaluation was performed to determine the textural characteristics of the four peach cultivars due to the difficulty of visually detecting mealy qualities. At S4-1 and S4-2 stages, the flesh of the four peach cultivars was all non-mealy, while at the S4-3 stage, the flesh of CP13 peaches was crisp and non-mealy; the flesh of CM peaches was juicy and melting; and the flesh of CP14 and RM peaches was grainy and mealy (Supplementary Table S1). While CP14, CM, and RM showed a decline in fruit firmness, falling below 10 N at complete ripeness, CP13 consistently maintained a fruit firmness of 30 N. CP13 and CP14 were classified as SH peaches because of limited ethylene release, whereas CM and RM were classified as MF peaches because of the high amounts of ethylene released at the S4-3 stage. The ethylene production rate of CM peaches was 19.85 ± 2.35 ng∙g−1∙h−1, and that of RM peaches was 29.44 ± 2.83 ng∙g−1∙h−1 (Figure 1A). The dry and grainy texture of mealy peaches was found to be correlated with their juice yield. In mealy peaches CP14 and RM, the juice yield showed a significant decrease from the S4-1 to S4-3 stages (from 36% to 11.5% and from 35.4% to 7.5%, respectively). In non-mealy peach CM, the juice yield was higher than that of mealy peaches CP14 and RM at the S4-1 and S4-2 stages, but there was also a significant decrease at the S4-3 stage, while in CP13, the juice yield was steadier from the S4-1 to S4-3 stages (Figure 1A). It was easy to distinguish between mealy and non-mealy textures in SH peaches based on variations in firmness and juice yield. However, in MF peaches, using the abovementioned indicators alone made this task challenging.

Figure 1.
Changes in the physiological characteristics of non-mealy (CP13 and CM) and mealy (CP14 and RM) peaches during ripening. (A) Firmness (left), ethylene production (middle), and juice yield (right). Error bars represent standard deviation (SD). (B) Fruit and flesh appearance (bar = 2 cm) and scanning electron microscope (SEM) images at 200× magnification (bar = 200 nm).
Scanning electron microscopy was used to examine the cellular structure of peach cultivars at the S4-1, S4-2, and S4-3 stages (Figure 1B). In the flesh tissue of CP13 peaches, the cells remained nearly unchanged during ripening, maintaining a regular shape and a neatly arranged structure (Figure 1B, A1–A3). In CP14 and RM peaches, the flesh tissue showed intact but distinct and disorganized cells, with a considerable collapse of spatial organization at the S4-3 stage (Figure 1B, C3, D3). In CM peaches, the flesh tissue showed ruptured cells upon softening at the S4-3 stage (Figure 1B, B3).
3.2. Analysis of Cell Wall Composition
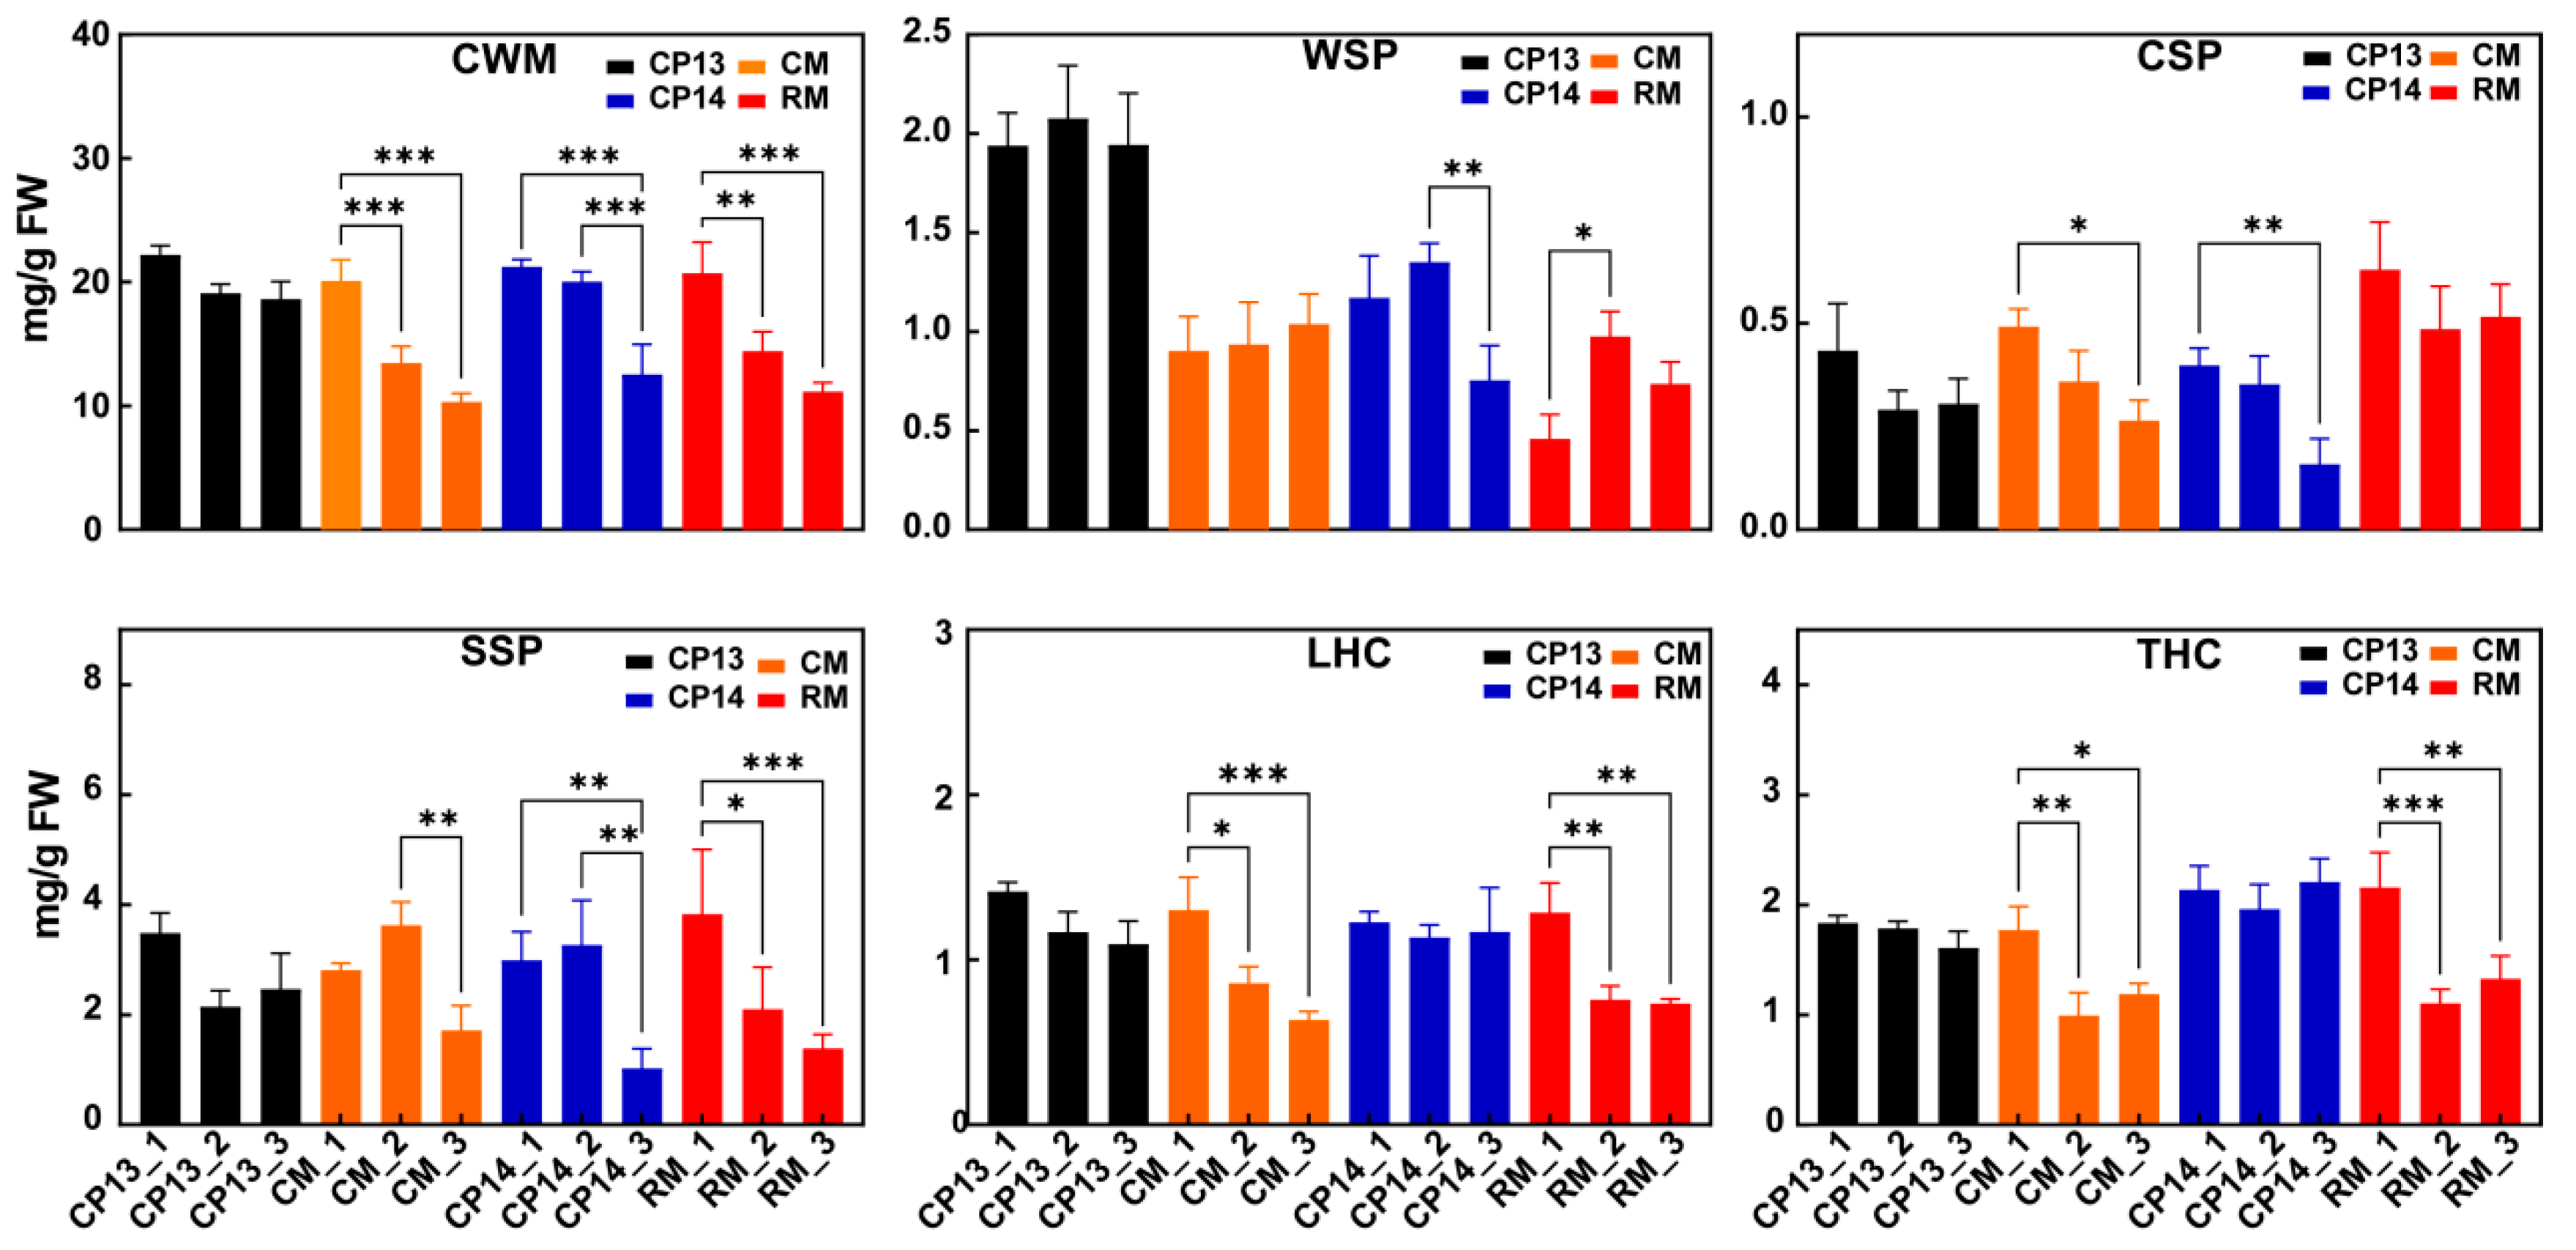
Cell wall content decreased in the fruits of all four peach cultivars during ripening, consistent with the decline in their firmness (Figure 2). The content of WSP increased and then decreased in mealy peaches CP14 and RM but remained consistent in non-mealy peaches CP13 and CM. Among the SH peaches, the content of CSP reduced significantly in the mealy peach CP14 compared with the non-mealy peach CP13. Among MF peaches, CSP decreased particularly in the non-mealy peach CM, with no significant change in the mealy peach RM. SSP content decreased in mealy peaches CP14 and RM; however, among the non-mealy peaches, SSP content remained consistent in the SH peach CP13 but initially increased and then decreased in the MF peach CM. During ripening, the levels of loosely bound hemicellulose (LHC) and tightly bound hemicellulose (THC) decreased significantly in both MF peaches, CM and RM, but showed no significant change in SH peaches CP13 or CP14.

Figure 2.
Cell wall composition of non-mealy (CP13 and CM) and mealy (CP14 and RM) peaches during ripening. CWM, cell wall material; WSP, water-soluble pectin; CSP, chelator-soluble pectin; SSP, sodium carbonate-soluble pectin; LHC, loosely bound hemicellulose; THC, tightly bound hemicellulose. Asterisks represent significant differences between non-mealy and mealy peaches (p ≤ 0.05; one-way ANOVA). Error bars represent SD.
3.3. Cell Wall Enzyme Activity
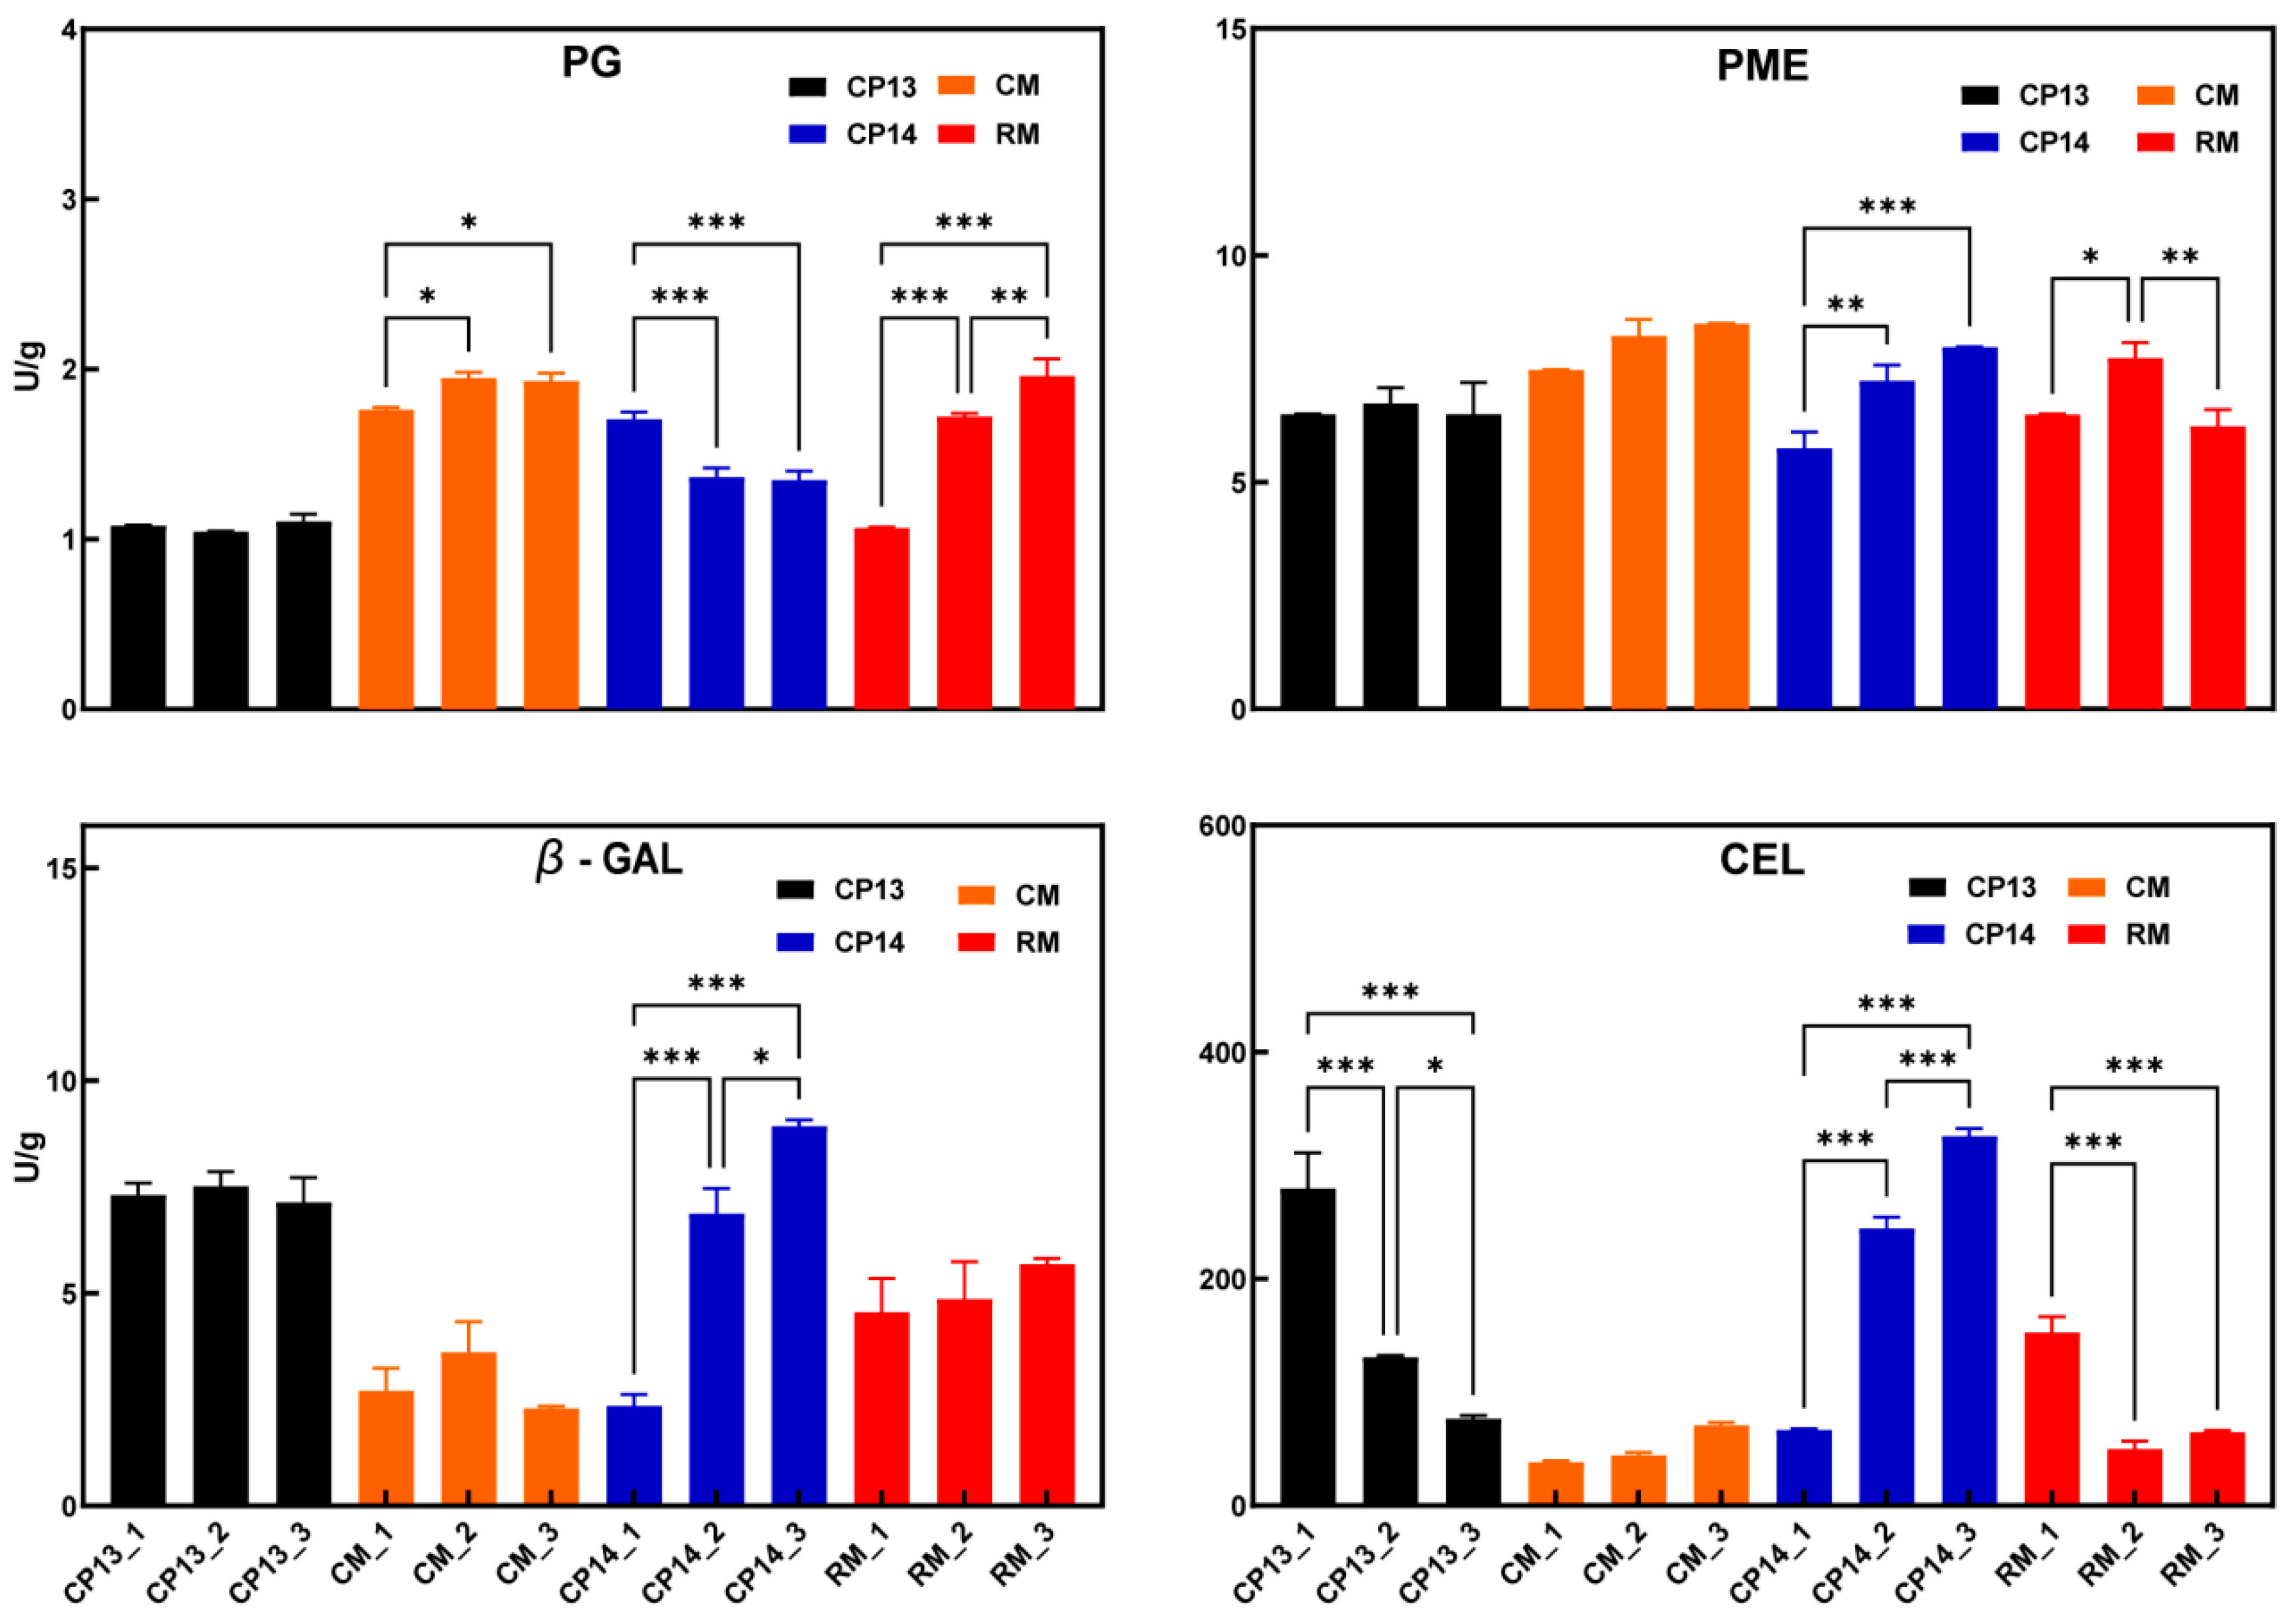
Changes in the activity of cell wall degradation enzymes have previously been associated with the development of a mealy texture in peach [16]. During the ripening process, the PG activity of CP14 declined as firmness decreased (Figure 3); however, the PG activity of CP13 did not change considerably, and the peach’s firmness remained nearly constant, demonstrating that PG activity was positively associated with firmness in SH peaches. The PG activity in MF peaches increased as firmness decreased; the change in PG activity of mealy peach RM was significantly greater than that of non-mealy peach CM. The PME activity remained constant in non-mealy peaches CP13 and CM but significantly increased in the SH mealy peach CP14 and first increased then decreased in the MF mealy peach RM. During ripening, β-Gal activity significantly increased in CP14 but showed no significant change in CP13, CM, or RM. The CEL activity significantly decreased in the non-mealy SH peach CP13 and significantly increased in the mealy SH peach CP14 but remained constant in the non-mealy MF peach CM and significantly decreased in the mealy MF peach RM. The results showed that the activity of PG and PME was related to changes in fruit firmness, but their effects on fruit mealiness were different among different flesh types. CEL activity varied significantly among cultivars, and the variation in β-Gal activity is likely associated with the mealy texture of SH peach CP14.

Figure 3.
Cell wall enzyme activity in non-mealy (CP13 and CM) and mealy (CP14 and RM) peaches during ripening. PG, polygalacturonase; PME, pectin acetyl esterase; β-Gal, β-galactosidase; CEL, cellulase. Asterisks represent significant differences (p-value ≤ 0.05) between non-mealy and mealy peaches (p ≤ 0.05; two-way ANOVA). Error bars represent SD.
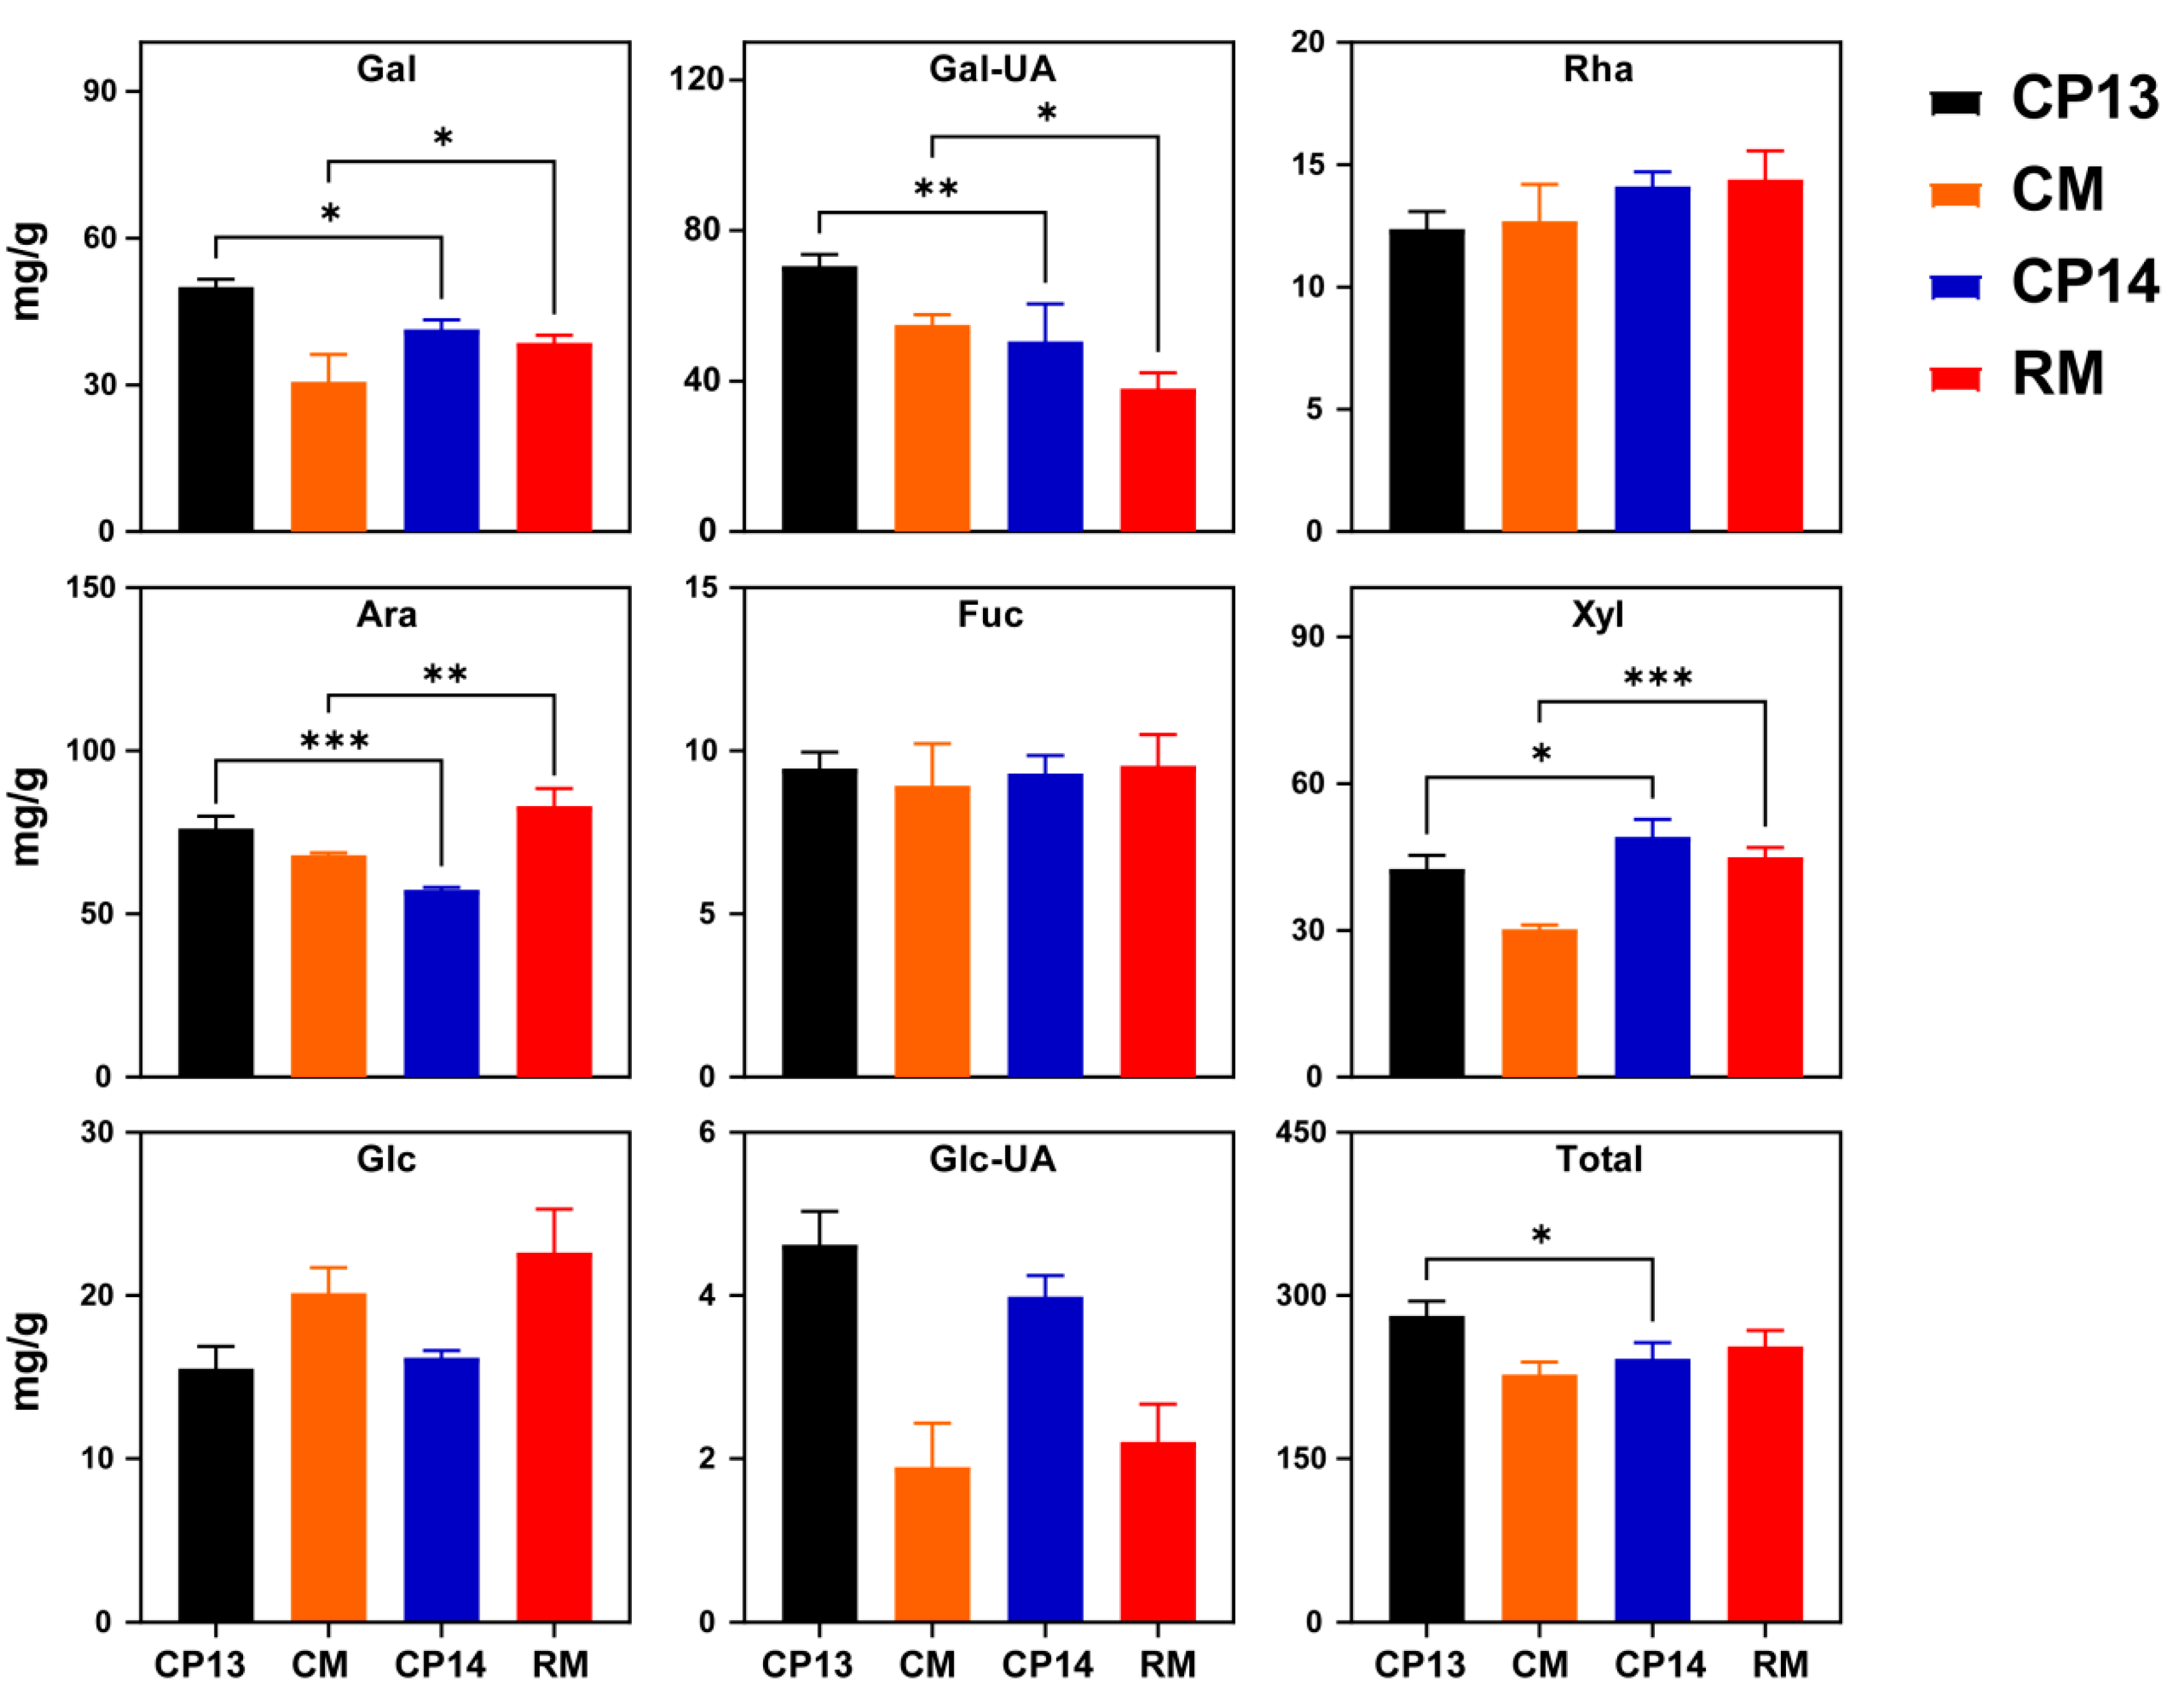
3.4. Neutral Sugar Composition of Cell Walls
Next, we compared the contents of neutral sugars in cell walls between mealy and non-mealy SH peaches (CP13 vs. CP14) and between mealy and non-mealy MF peaches (CM vs. RM) at the S4-3 stage (Figure 4). Significant differences were detected in galactose (Gal), galacturonic acid (Gal-UA), arabinose (Ara), and xylose (Xyl) contents between SH non-mealy peach CP13 and SH mealy peach CP14, and there were also significant differences between the MF non-mealy peach CM and MF mealy peach RM. Total sugar content varied only between the SH peaches CP13 and CP14 (Figure 4). Compared with the non-mealy SH peach CP13, the contents of Gal, Gal-UA, and Ara decreased significantly in the mealy SH peach CP14, implying that processes associated with galactose and arabinose metabolism influence mealiness in SH peaches. Compared with the non-mealy MF peach CM, the contents of Gal and Ara increased significantly, whereas those of Gal-UA decreased in the mealy MF peach RM. Xyl showed significantly higher levels at the mealy stage in the SH mealy peach CP14 compared with SH non-mealy peach CP13, and similar changes were observed in the MF mealy peach RM compared with the MF non-mealy peach CM. None of the other neutral sugars in the CWM showed significant differences between mealy and non-mealy peaches. During ripening, the variation observed in neutral sugar contents in cell walls was similar to that observed in firmness. The contents of all eight neutral sugars, except Glc, changed significantly during ripening. The total neutral sugar content decreased significantly in the SH mealy peach CP14 compared with the SH non-mealy peach CP13. The total neutral sugar content decreased in both MF peaches (RM and CM) upon ripening. However, it was difficult to differentiate between MF mealy peaches and MF non-mealy peaches based on neutral sugar trends alone (Figure S1). In conclusion, the mealy pattern may be related to the metabolism of cell wall neutral sugars, mainly Gal, Gal-UA, Ara, and Xyl.
Figure 4.
Neutral sugar composition of the cell wall in non-mealy (CP13 and CM) and mealy (CP14 and RM) peaches at the S4-3 stage. Gal, galactose; Gal-UA, galacturonic acid; Rha, rhamnose; Ara, arabinose; Fuc, fucose; Xyl, xylose; Glc, glucose; Glc-UA, glucuronic acid. Total, total neutral sugars at S4-3 stage. Asterisks represent significant differences (p-value ≤ 0.05) between non-mealy and mealy peaches (p ≤ 0.05; one-way ANOVA). Error bars represent SD.
3.5. Identification and Functional Enrichment Analysis of DEGs
Fruits were harvested from all four cultivars at three developmental stages in triplicate to investigate transcriptional alterations in mealy and non-mealy peaches during ripening. Flesh samples prepared from peach fruits harvested at the S4-1, S4-2, and S4-3 stages were named by adding the suffixes ‘_1’, ‘_2’, and ‘_3’, respectively, to the cultivar name; for example, CP13 fruits harvested at the S4-1, S4-2, and S4-3 stages were named CP13_1, CP13_2, and CP13_3. Thus, a total of 36 RNA-seq libraries (four cultivars CP13, CP14, CM, and RM of three developmental stages with three replicates) were constructed and sequenced, resulting in a total of 214.5 Gb of clean base, equivalent to a total of 25,058 mRNAs. The mapping rate of reads from all 36 libraries was >92.6%, and the average quality score (Q30) of the reads was >91.1%. Strong correlation was observed among the three biological replicates of each sample (R2 > 0.93, p < 0.01). Therefore, the accuracy and quality of the RNA-seq data were determined to be sufficient for subsequent analysis.
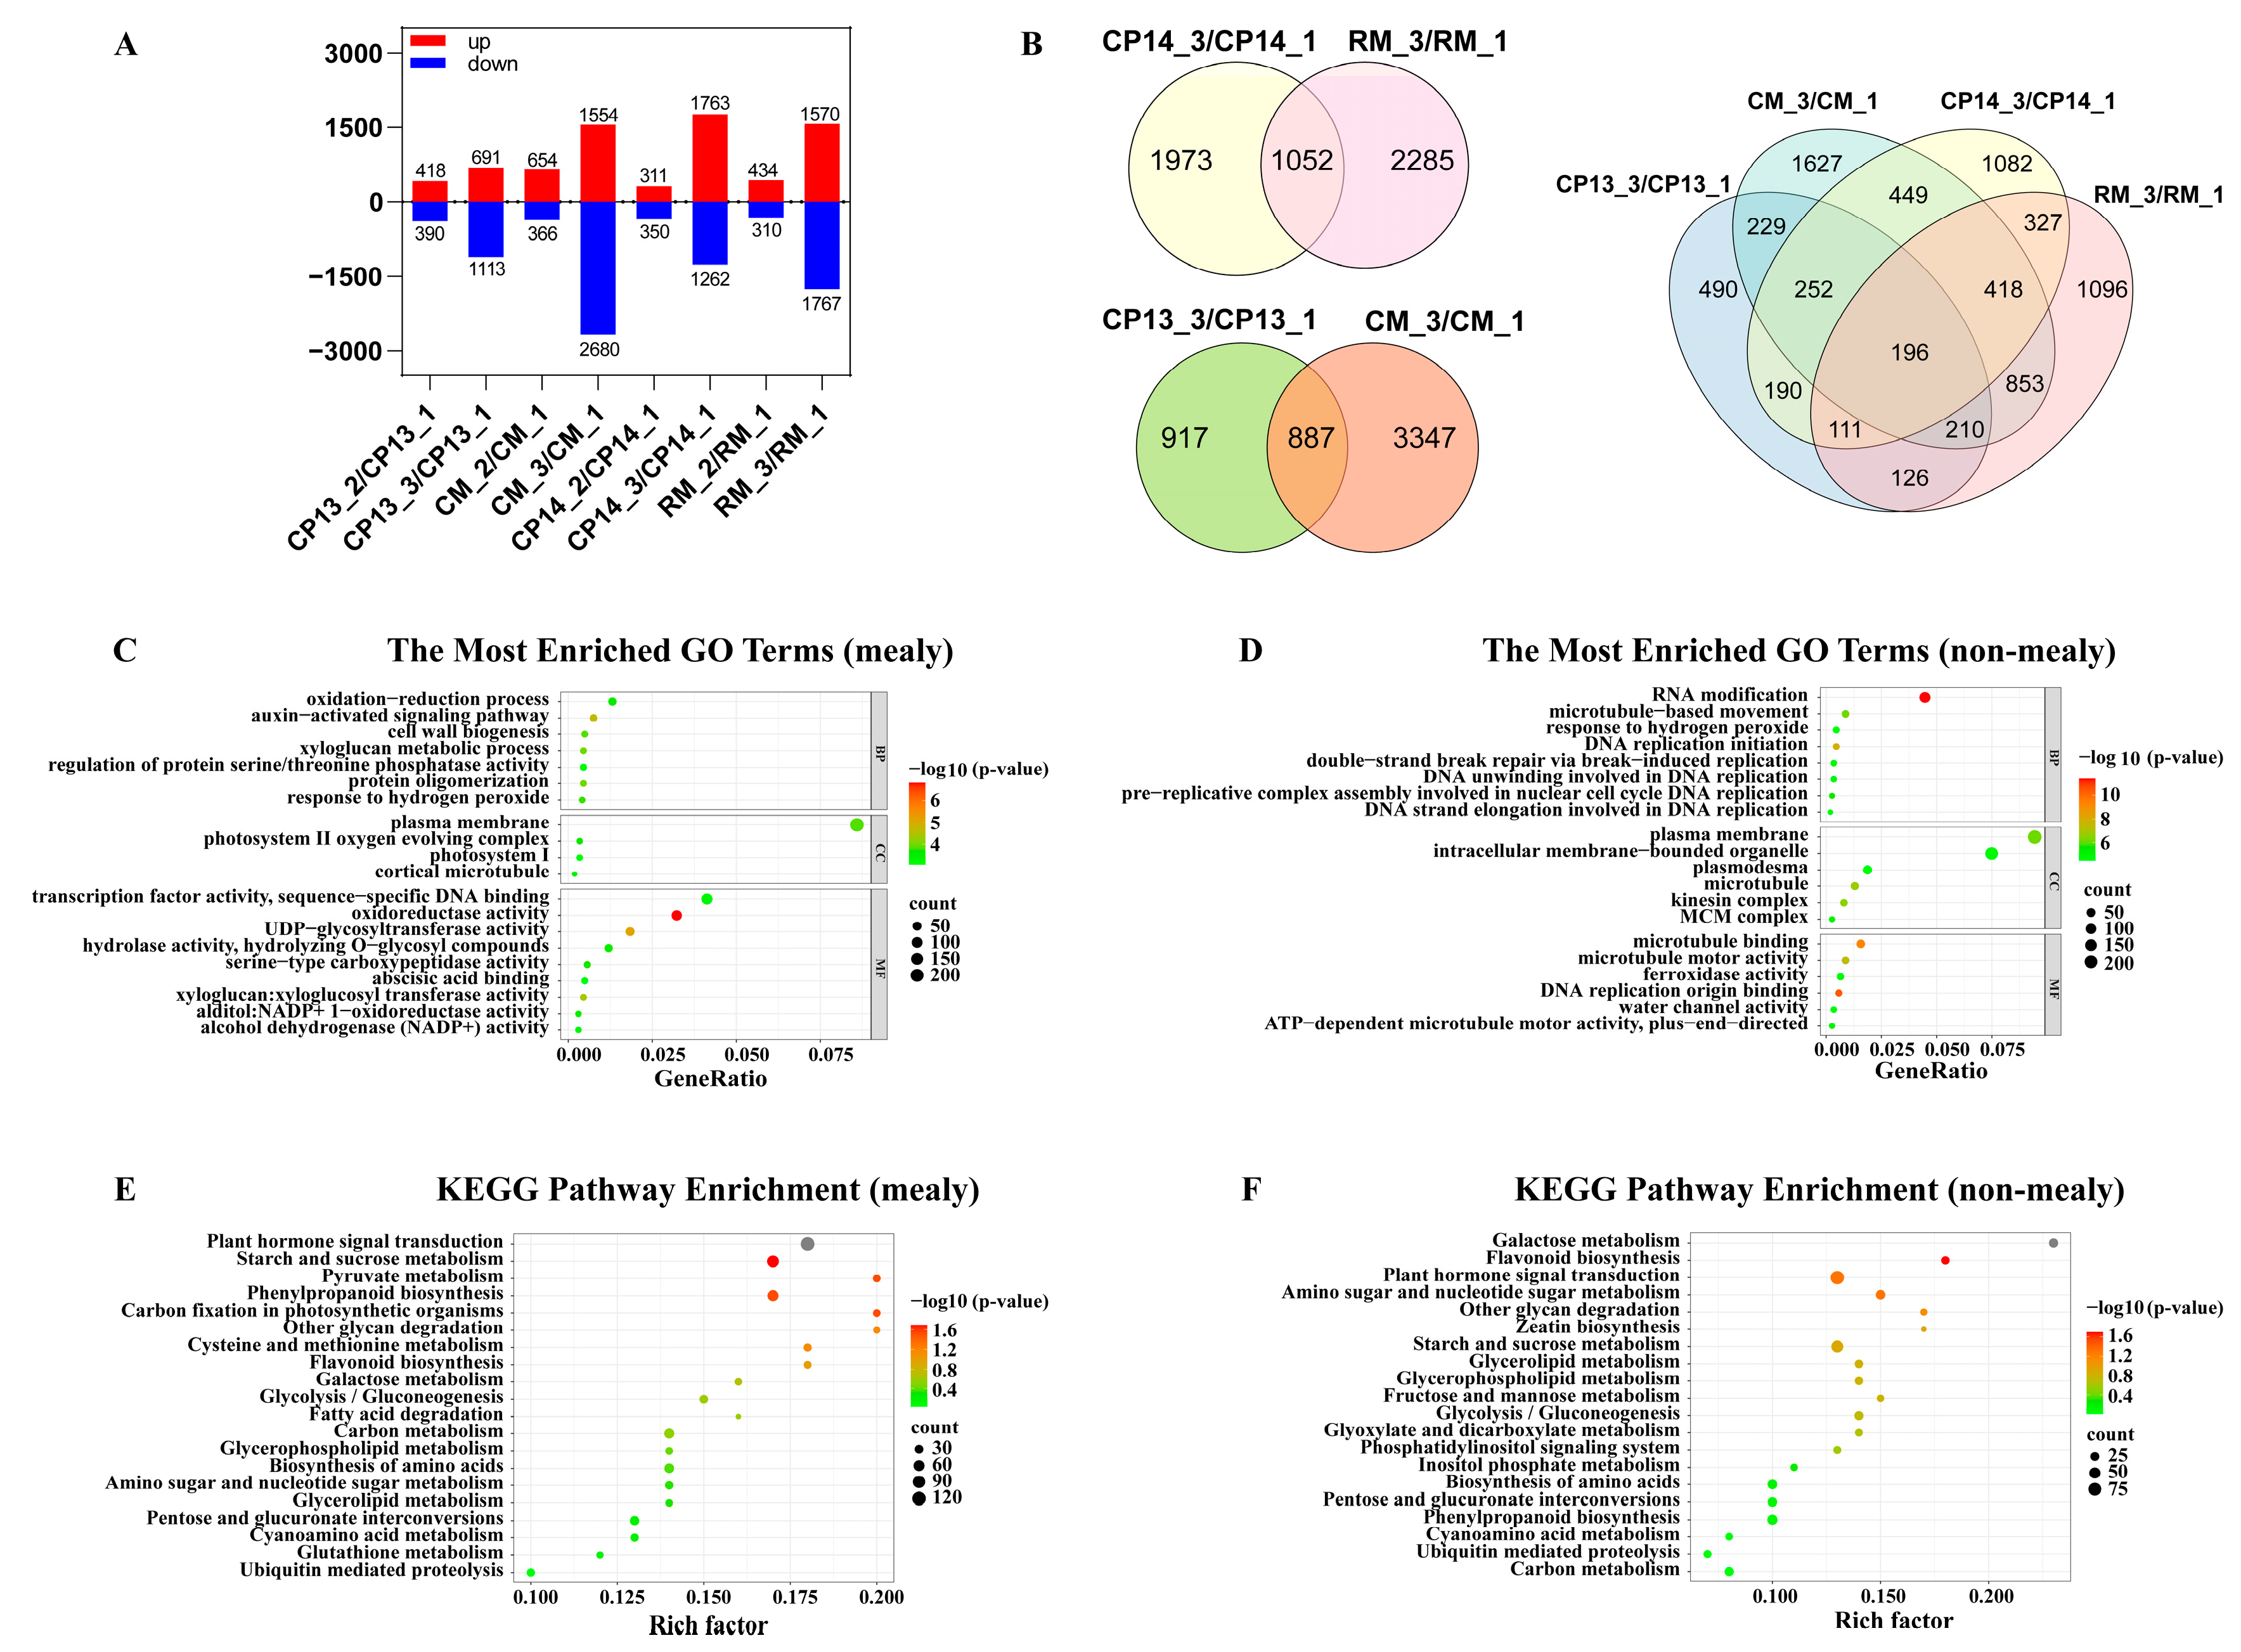
The comparison of DEGs among CP13, CP14, CM, and RM fruits at different maturation stages revealed that transcript levels were similar between the immature and mature stages (Figure 5A). Therefore, we focused on comparing the DEGs between the mealy and immature stages of each cultivar. Figure 5B shows a Venn diagram of DEGs identified in the CP13_3 vs. CP13_1, CP14_3 vs. CP14_1, CM_3 vs. CM_1, and RM_3 vs. RM_1 comparison groups. The number of genes differentially expressed between the mealy and immature stages of fruits varied among cultivars: 1055 in CP13, 2276 in CP14, 2557 in CM, and 1600 in RM. The numbers of DEGs common to both non-mealy peaches (CP13 or CM) and mealy peaches (CP14 or RM) were 3383 and 3609, respectively (Figure 5B).
Figure 5.
Identification and functional enrichment analysis of DEGs identified in CP13, CP14, CM, and RM peaches during ripening. (A) Numbers of up- and downregulated DEGs. (B) Venn diagram showing the numbers of genes differentially expressed between the S4-3 (mealy) stage and S4-1 (immature) stage in the different peach cultivars. (C,D) GO enrichment analysis of DEGs identified in mealy peaches (C) and non-mealy (D) peaches. (E,F) KEGG pathway enrichment analysis of DEGs identified in mealy peaches (E) and non-mealy (F) peaches. CP13_1, CP13_2, and CP13_3 indicate CP13 samples collected at the S4-1, S4-2, and S4-3 stages; CM_1, CM_2, and CM_3 indicate CM samples collected at the S4-1, S4-2, and S4-3 stages; CP14_1, CP14_2, and CP14_3 indicate CP14 samples at the S4-1, S4-2, and S4-3 stages; and RM_1, RM_2, and RM_3 indicate RM samples collected at the S4-1, S4-2, and S4-3 stages.
Next, we performed GO analysis to identify the functions of DEGs. Among the DEGs identified in mealy peaches, the highly represented GO terms were ‘auxin-activated signaling pathway’ and ‘cell wall biogenesis’ within the biological process category; ‘plasma membrane’ and ‘photosystem II oxygen evolving complex’ within the cell component category; and ‘oxidoreductase activity’, ‘UDP-glycosyltransferase activity’, ‘xyloglucan: xyloglucosyl transferase activity’, ‘transcription factor activity and sequence-specific DNA binding’, and ‘abscisic acid binding’ within the molecular function category (Figure 5C). These results indicate that genes related to oxidoreductase activity, UDP-glycosyltransferase activity, xyloglucosyl transferase activity, and transcription factor activity exhibit significant expression-level changes in the flesh tissue of CP14 and RM (mealy) peaches during ripening. By contrast, among the DEGs identified in non-mealy peaches, GO terms were mainly overrepresented in the biological process and molecular function categories and included ‘RNA modification’, ‘DNA replication initiation’, ‘plasma membrane’, ‘microtubule’, ‘microtubule binding’, ‘DNA replication origin binding’, and ‘water channel activity’. These results indicate that the expression of genes involved in nucleic acid metabolism, membrane metabolism, and the cytoskeleton is significantly altered in non-mealy peaches CP13 and CM (Figure 5D). Further insights into the metabolic pathways associated with peach mealiness were obtained via KEGG analysis. Pathways most significantly enriched among the DEGs identified in mealy peaches were ‘plant hormone signal transduction’, ‘galactose metabolism’, ‘carbon metabolism’, ‘pentose and glucuronate interconversions’, and ‘other glycan degradation’ (Figure 5E), and those most significantly enriched among the DEGs identified in non-mealy peaches included ‘galactose metabolism’, ‘flavonoid biosynthesis’, and ‘plant hormone signal transduction’ (Figure 5F).
3.6. Comparative Transcriptome Profiling of DEGs Associated with Cell Wall Polysaccharide Decomposition in Mealy and Non-Mealy Peaches
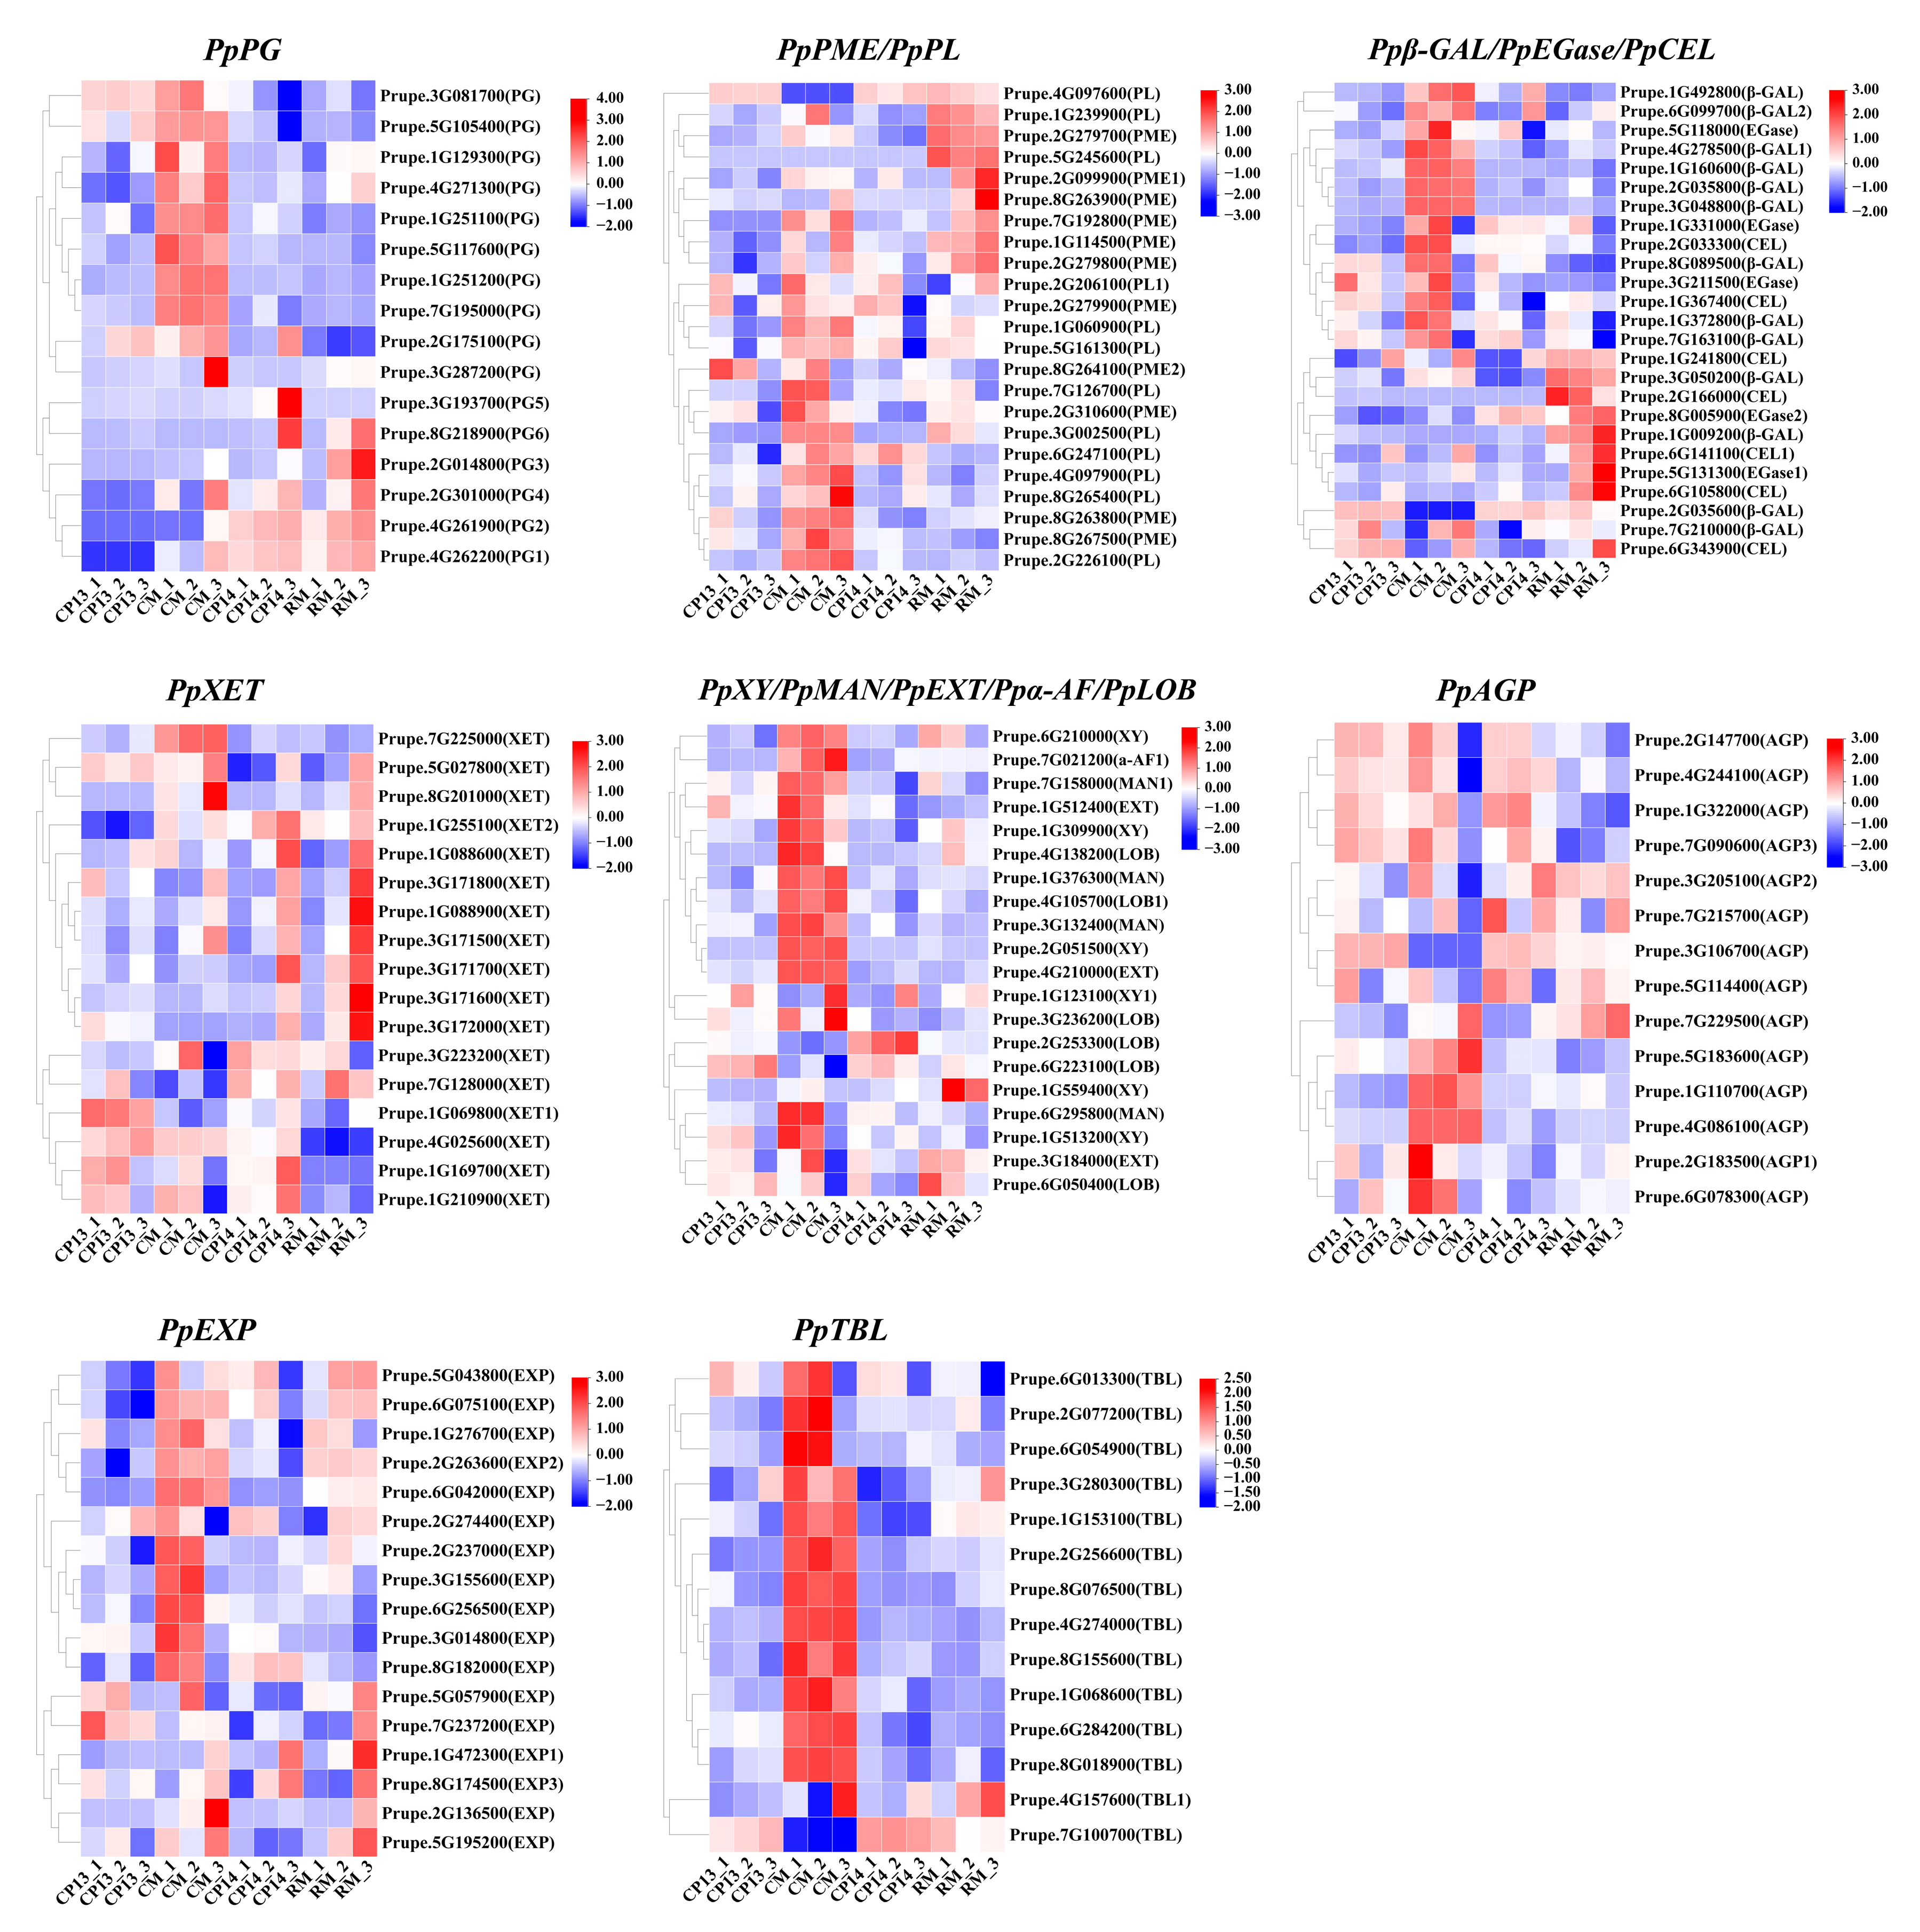
A group of enzymes called lyases is responsible for the regulated breakdown of cell wall polysaccharides, including cellulose, hemicellulose, and pectin [46]. Utilizing the descending dimension approach, we compared the transcriptome profiles of cell-wall-degradation-related DEGs between mealy and non-mealy SH peaches (CP14 vs. CP13) and between mealy and non-mealy MF peaches (RM vs. CM) (Figure 6). A total of 27 DEGs associated with the mealy characteristic and showing consistent expression profiles were identified using this approach. Among these DEGs, PpPG1 and PpPG2 showed significantly higher expression in mealy peaches (CP14 and RM) than in non-mealy peaches (CP13 and CM); PpPME2 was significantly downregulated in CP13 and CM and showed only minor changes in expression in CP14 and RM; and Ppβ-GAL2 showed variable expression patterns in the different cultivars, with higher levels of upregulation in CP14 than in CP13, which is consistent with the degree of mealiness of these cultivars.
Figure 6.
Heatmaps showing the expression profiles of cell-wall-metabolism-related DEGs in CP13, CM, CP14, and RM peaches during ripening. The color scale represents the fold change in gene expression, ranging from 2-fold upregulation (red) to 2-fold downregulation (blue). Each horizontal row represents a single DEG, with its gene ID on the right. Vertical columns represent the different samples (the same as those described in Figure 5). PG, polygalacturonase; PME, pectin acetyl esterase; PL, pectate lyase; β-Gal, β-galactosidase; EGase, β-1,4 endoglucanase; CEL, endoglucanase; XET, xyloglucan endotransglycosylase/hydrolase; XY, xylosidase; MAN, endo-β-mannanase; EXT, extensin; α-AF, α-L-arabinofuranosidase; LOB, lateral organ boundaries; AGP, arabinogalactan protein; EXP, expansin; TBL, trichome birefringence-like.
In addition to pectin, the degradation of cell wall hemicellulose and cellulose affects fruit texture. The expression level of PpXY1 was negatively correlated with fruit firmness (downregulated in RM and upregulated in CP14), whereas PpEGase2 and PpCEL1 were significantly upregulated in RM. Differential expression of genes encoding the cell-wall-loosening enzyme XET was observed in different cultivars, indicating that XET plays a role in the breakdown of hemicellulosic polysaccharides associated with peach mealiness. PpEXP1 and PpEXP3 were upregulated in CP14 and RM peaches, particularly at the mealy stage, suggesting that EXPs are involved in the elongation of cell walls. Cultivar-specific expression patterns of genes encoding AGPs, TBL proteins, and LOB domain proteins were observed, which may have implications for fruit softening.
Next, we investigated how the ethylene and auxin signaling pathways interact to regulate fruit ripening and texture. RM peaches demonstrated significant upregulation of PpACO1 and ERF gene family members, specifically PpERF1 and PpERF3, at the mealy stage. Moreover, we investigated the gene expression of auxin/indole-3-acetic acid (Aux/IAA) family members and abscisic acid (ABA) biosynthesis genes in CP13, CP14, CM, and RM. The findings demonstrated that 14 of the 17 Aux/IAA family members were substantially inhibited in SH peaches CP13 and CP14, dramatically downregulated in the MF mealy peach RM, and robustly expressed in the MF non-mealy peach CM. The expression of PpABA2 was downregulated in RM, implying a potential link between mealiness and abscisic acid (ABA) synthesis (Supplementary Figures S2 and S3). These results shed light on the complex regulatory network that controls cell wall dynamics and fruit texture in different peach cultivars.
3.7. Expression of Key Genes Related to Cell Wall Metabolism and Ethylene Biosynthesis
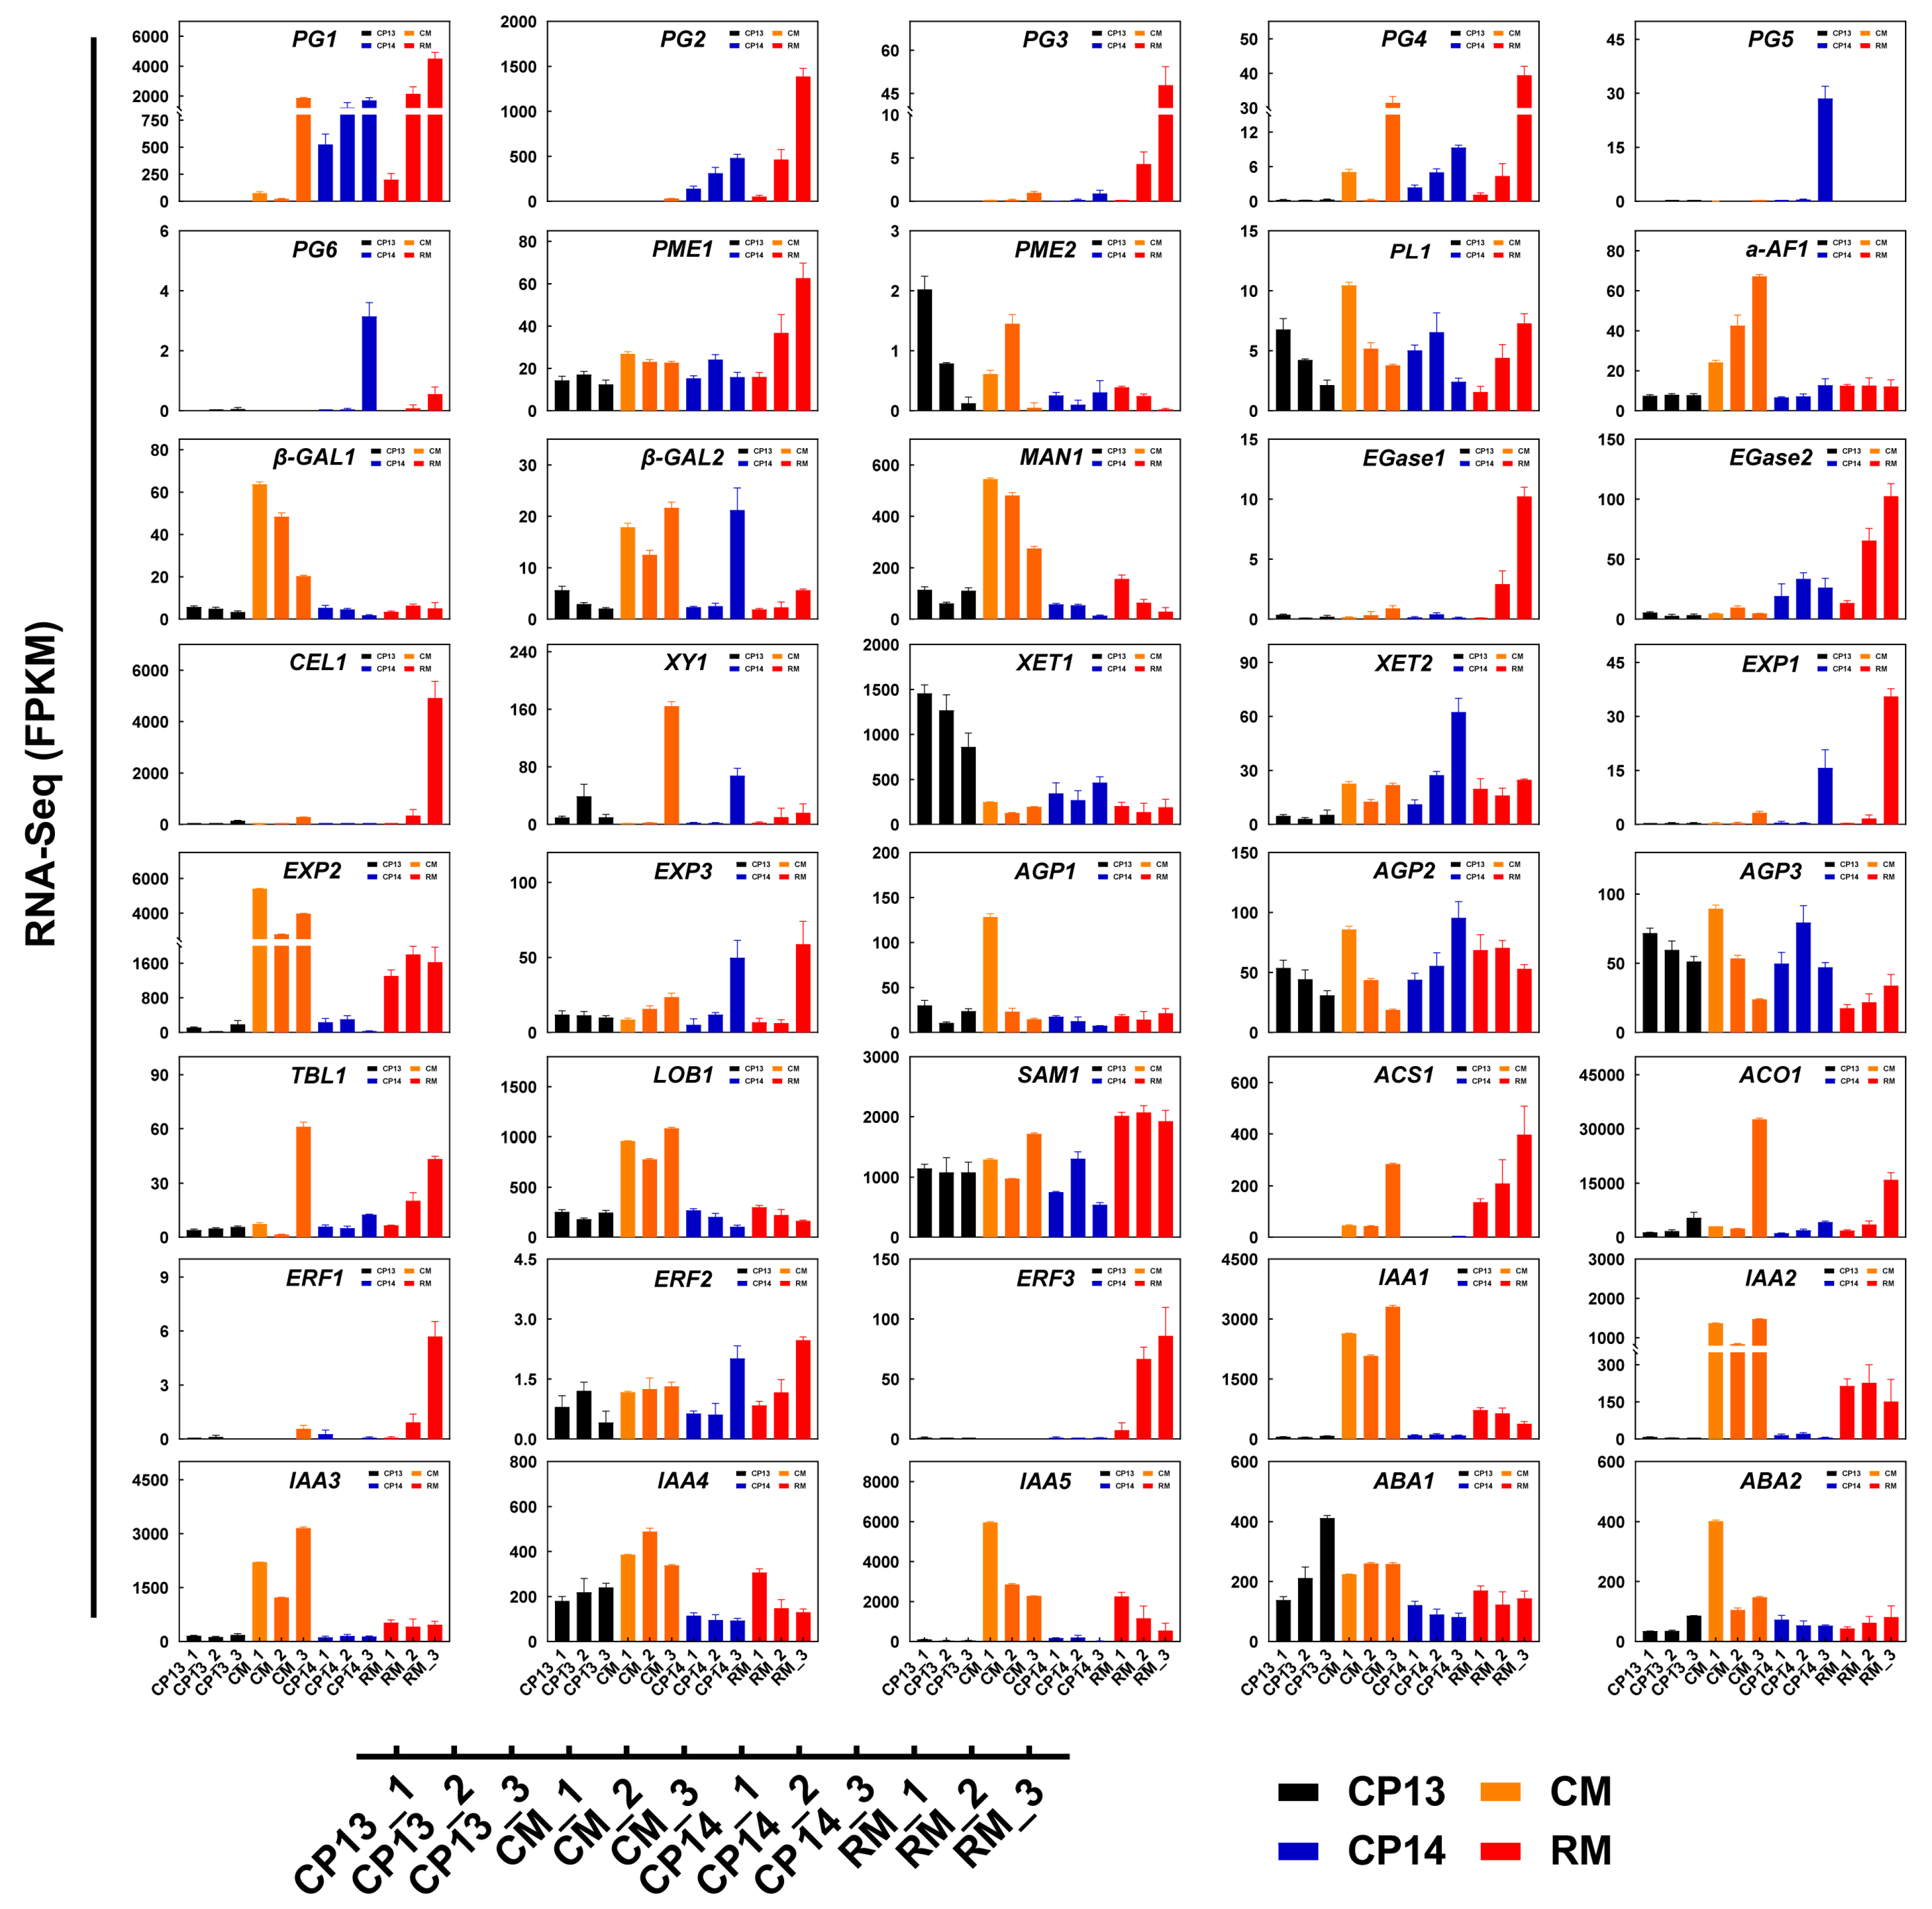
We selected 40 DEGs related to cell wall metabolism and ethylene biosynthesis and examined their expression levels in peach fruits at the S4-1, S4-2, and S4-3 stages using |log2foldchange| > 1 and an adjusted p-value of <0.05 as the threshold criteria (Figure 7, Supplementary Table S2). PpPG1 was significantly upregulated in mealy peaches CP14 and RM at the S4-2 and S4-3 stages, although its expression was significantly downregulated in the non-mealy SH peach CP13 and delayed in the non-mealy MF peach CM at the S4-3 stage. Mealy peaches CP14 and RM showed increased expression of PpPG2, but the non-mealy peach CM showed delayed expression of PpPG2. In the mealy peaches CP14 and RM, PpPG3, PpPG4, PpPG5, and PpPG6 showed unique expression patterns, with significant inter-cultivar variability.
Figure 7.
Changes in the expression levels of genes related to cell wall metabolism and ethylene biosynthesis as determined via RNA-seq. Data represent mean ± SD (n = 3). Sample names are the same as described in Figure 5.
PpPME1 was expressed at a significantly higher level in the mealy MF peach RM at the S4-2 and S4-3 stages compared with CP13, CP14, and CM. PpPME2 was expressed at lower levels in the mealy peaches RM and CP14 at the S4-1 and S4-2 stages compared with non-mealy peaches CP13 and CM. Compared with the non-mealy peaches CP13 and CM, the mealy peaches CP14 and RM showed significantly higher expression of PpEGase2, PpEXP1, PpEXP3, and PpAGP2 and significantly lower expression of PpIAA4, PpABA1, and PpABA2. The expression of Ppβ-GAL2, PpXY1, and PpXET2 was significantly upregulated in the mealy SH peach CP14 compared with the non-mealy SH peach CP13 at the mealy stage. By contrast, the expression of PpXET1 was significantly downregulated in CP14 compared with CP13. Compared with the non-mealy MF peach CM, the mealy MF peach RM showed significantly higher expression of PpEGase1, PpCEL1, PpERF1, and PpERF3 and significantly lower expression of Ppα-AF1, Ppβ-GAL1, Ppβ-GAL2, PpMAN1, PpXY1, PpEXP2, PpLOB1, PpIAA1, PpIAA2, and PpIAA3 (Figure 7). These results suggest that PpPG1, PpPG2, PpEGase2, PpEXP1, PpEXP3, PpAGP2, PpIAA4, and PpABA2 are important candidate genes involved in controlling mealiness in the SH peach CP14 and MF peach RM. On the other hand, identifiable variety-specific genes linked to mealiness highlight the inherent differences in ripening among the different peach varieties.
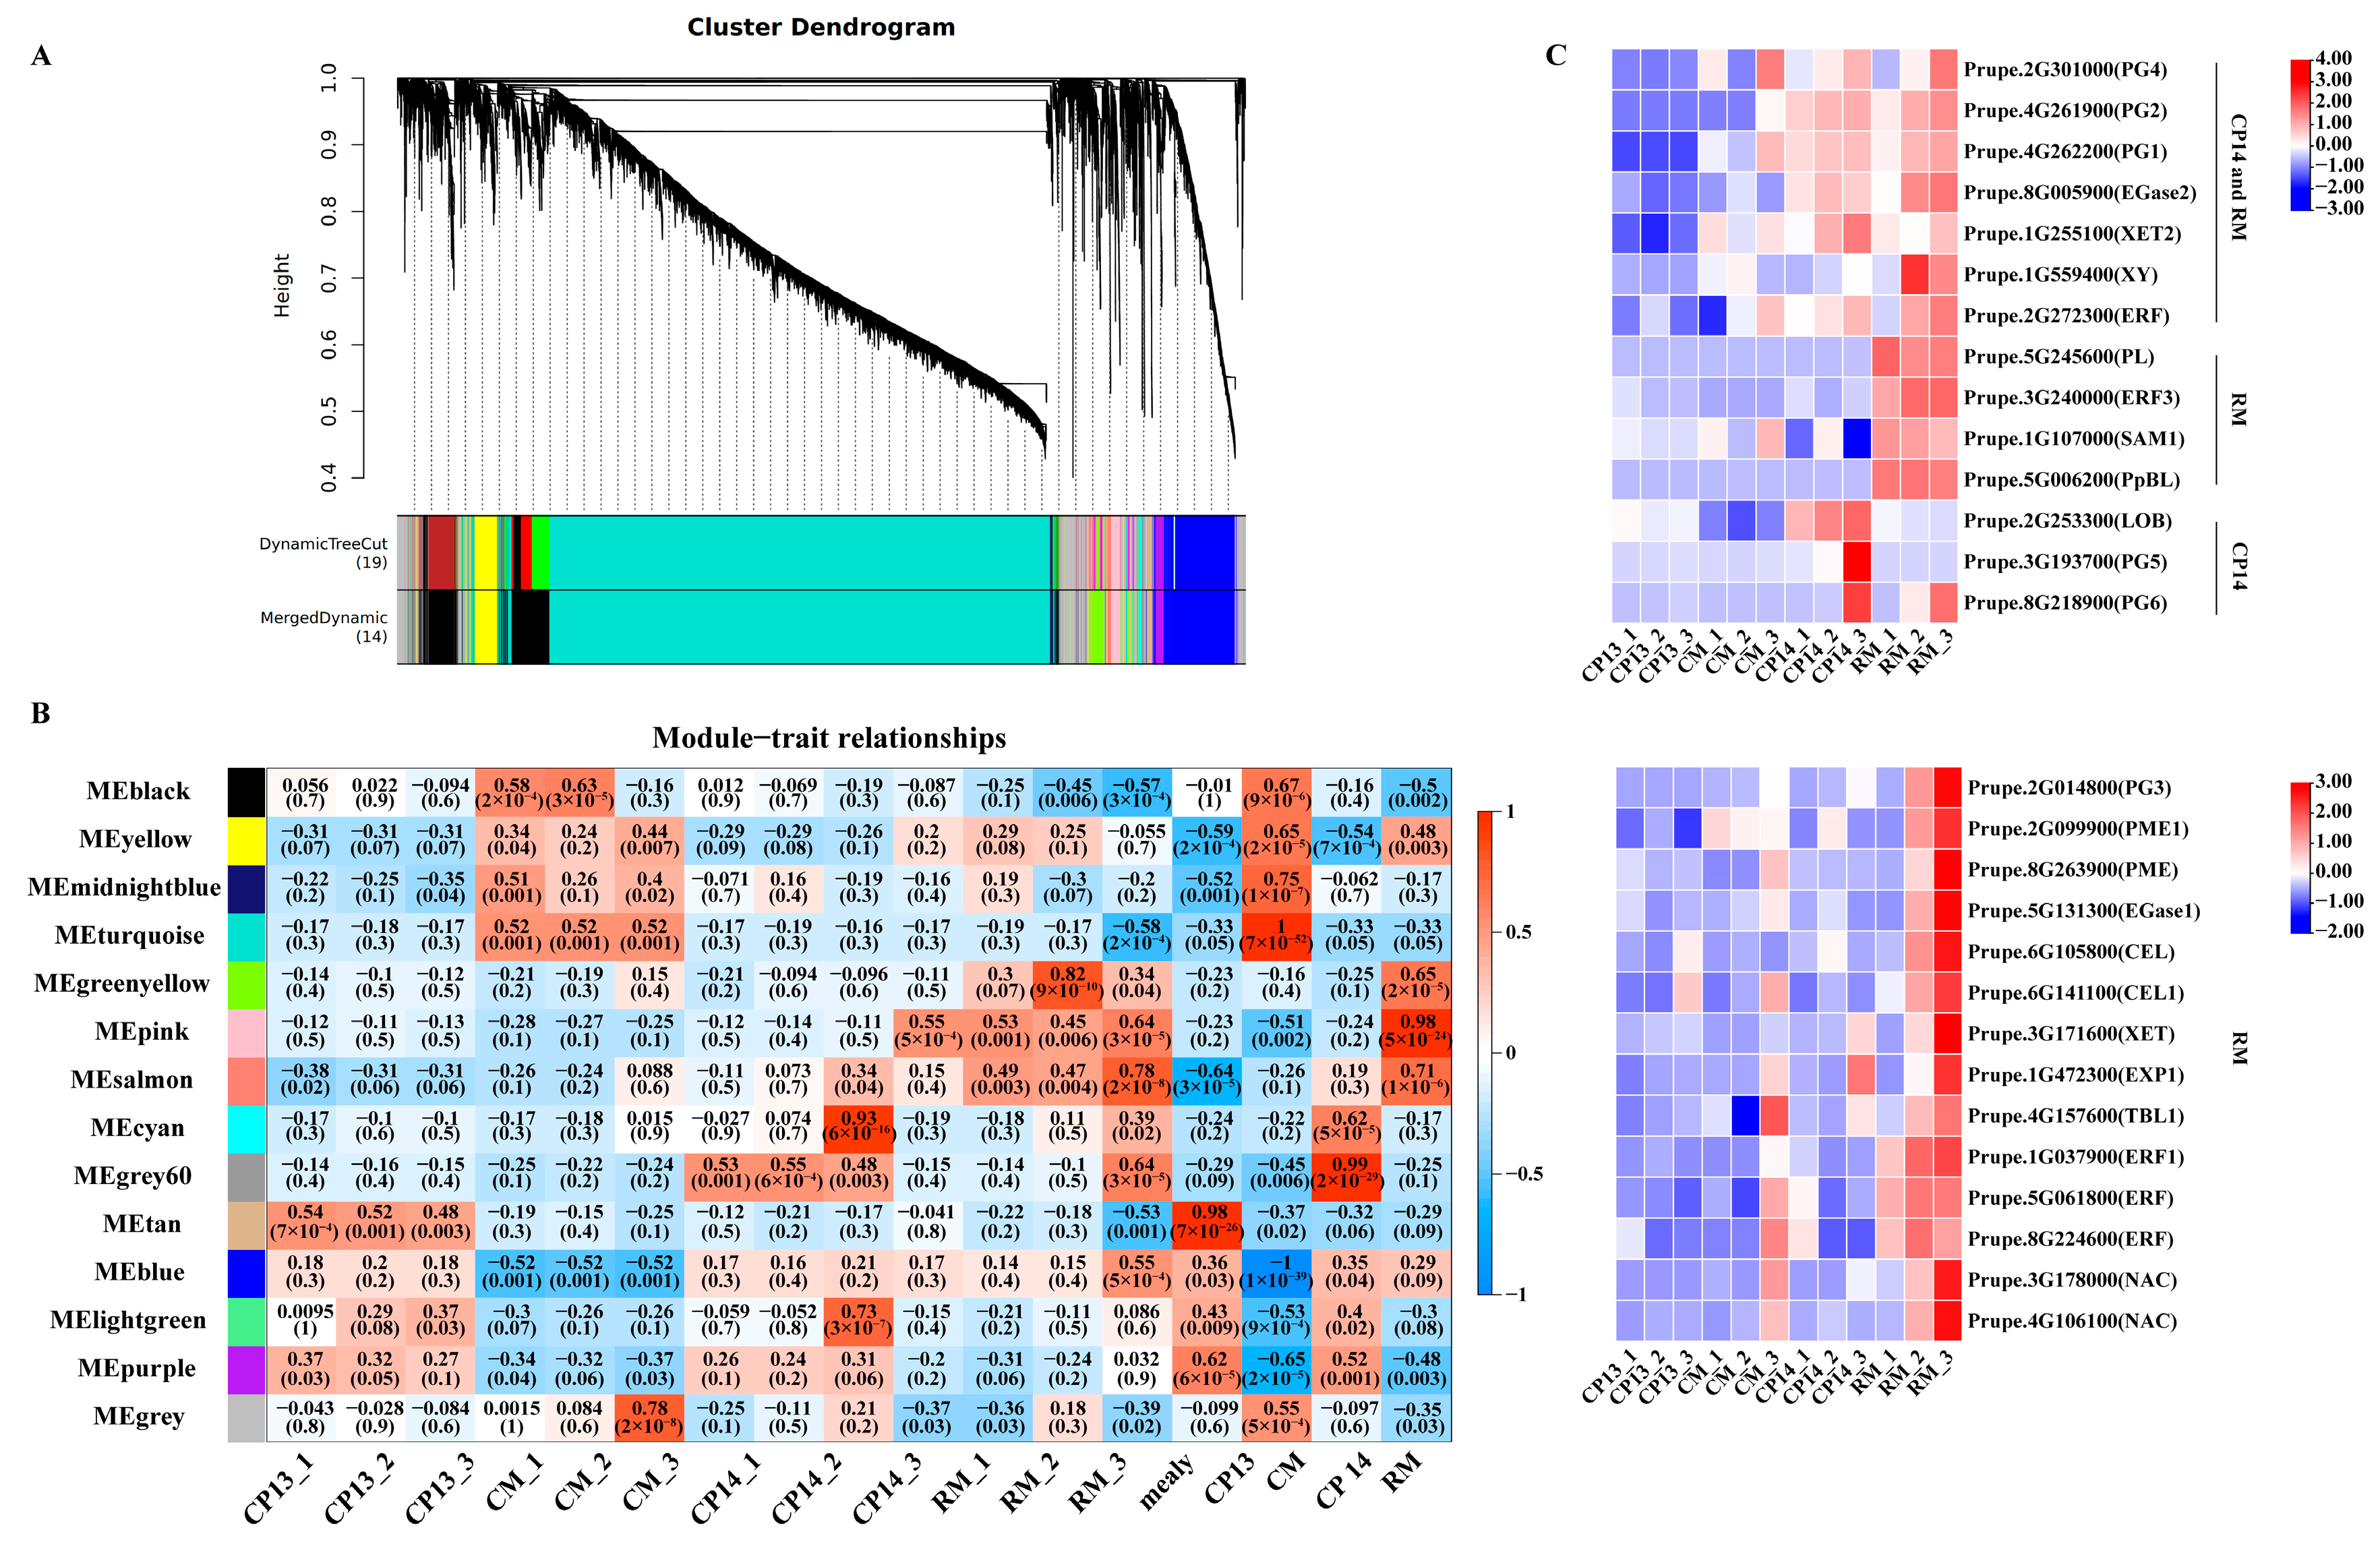
3.8. WGCNA-Based Identification of Co-Expression Network Modules Regulating Mealiness
We performed WGCNA on the DEGs to identify potential key genes as well as the regulatory networks controlling mealiness in peach. Co-expression modules were constructed for all 36 samples based on FPKM values, and a total of 14 co-expression modules were identified (Figure 8A). Correlation analysis between gene expression modules and mealiness traits revealed that the MEsalmon, MEpink, and MEgrey60 modules were significantly positively correlated with mealy traits (p < 0.05) (Figure 8B).
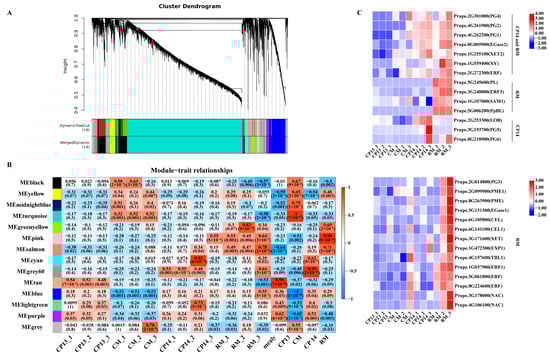
Figure 8.
WGCNA-based identification of key modules related to mealiness and firmness in peach. (A) Hierarchical cluster dendrogram of co-expression modules identified using WGCNA. (B) Relationships between modules and traits. The correlation coefficient and p-value are displayed in each cell. (C) Heatmap showing the expression of candidate genes in CP14 and RM with mealiness. ‘CP14 and RM’ marked in ‘C’-related genes are significantly related to both CP14 and RM. ‘RM’ marked in ‘C’ represents genes significantly related to either RM or RM_3. ‘CP14’ marked in ‘C’ represents genes significantly related to either CP14 or CP14_3. Sample names are the same as those described in Figure 5.
Among these modules, MEsalmon exhibited significant positive correlations with mealiness in CP14 and RM; MEpink was significantly positively correlated with mealiness in RM; and MEgrey60 was significantly positively correlated with mealiness in CP14. Notably, the MEgreen-yellow module was significantly positively correlated with mealiness in RM at the S4-3 stage, while the MEcyan module was significantly positively correlated with mealiness in CM at the S4-3 stage. Among the five modules significantly associated with mealiness, the MEsalmon module contained 96 genes; the MEpink module contained 181 genes; the MEgrey60 module contained 51 genes; the MEgreen-yellow module contained 316 genes; and the MEcyan module contained 68 genes (Supplementary Table S1). Furthermore, 28 genes related to cell wall degradation showed higher expression in CP14 or RM than in CP13 and CM at the S4-3 stage, indicating that these genes play a major role in the mealiness process and can be used as candidate genes in future research on mealiness in peach (Figure 8C).
4. Discussion
The investigation of the mealy texture in peach fruits has been a longstanding focus in research. However, previous studies predominantly concentrated on unraveling the biochemical and molecular mechanisms underlying the development of mealiness post-harvest, with less emphasis on the mealiness occurring naturally during ripening. The observation of various peach cultivars revealed two mealy types: the SH mealy type, which hardly releases any ethylene during ripening, and the MF mealy type, which releases a large amount of ethylene during ripening. Microscopy analysis of the flesh tissue of mealy peaches CP14 and RM showed that intercellular adhesions were altered, but the cells remained intact and did not release their contents, similar to the peaches in cold storage [16]. The metabolism of cell wall polysaccharides was substantially altered during peach fruit ripening. CWM declined with the decrease in fruit firmness during ripening. In SH peaches, mealiness was directly associated with firmness and CWM; however, this association was more complicated in MF peaches, since firmness and CWM also declined significantly in MF non-mealy peaches, making it impossible to distinguish mealy peaches from non-mealy peaches based on these two factors alone.
Textural changes are accompanied by the loss of neutral sugars, which causes the fruits to soften, and are associated with the function of enzymes that modify cell walls by degrading hemicellulose and pectin [47]. In apples, neutral sugars without polyglycosidic bonds are preferentially released from the cell wall during softening [48]. According to previous reports, mealy characteristics in peaches are attributed to the depolymerization of pectin structures [11]. Mealiness is associated with a reduction in the content of Ara and CDTA-soluble Gal in the cell wall [36]. The decreased content of Gal-UA in the CWM of mealy peaches indicates the degradation of GAL, which, together with the loss of neutral sugars from pectin, decreases the strength of the cell wall [49]. Gal-UA activates pectinase and promotes pectin degradation. In the current study, the content of Gal-UA decreased in RM, indicating that the impairment of pectin degradation was likely the cause of mealiness in RM. In mealy peaches, the amount of polymeric Ara decreased significantly, and the polysaccharide rich in arabinan that was tightly bound to cellulose was also reduced [5]. This was similar to the variation in Ara content in the SH mealy peach CP14.
It was reported that PG activity increased during the ripening of peaches [50,51]. PG potentially plays a crucial role in apple fruit mealiness by reducing cellular adhesion [52]. In this study, ethylene did not affect PME activity, which was high both in SH peaches (CP13 and CP14) and MF peaches (CM and RM). The enzyme activity of PG and PME and the expression levels of the corresponding genes showed an opposite trend in mealy peaches but similar trends in non-mealy peaches of the same type (SH or MF). This was consistent with previous reports, which showed that unbalanced activity of PG and PME led to the breakdown of pectins and disorganization of the cell wall in peaches during cold storage [16,36,53,54]. However, a change in the pattern of mealiness during ripening is more complex than an imbalance between PG and PME activity. Obenland et al. (2003) [19] suggested that enlarged air spaces in the middle lamella and binding free water via insoluble pectic in the flesh tissue cause the characteristic dry texture of mealy peach fruits.
Metabolomics studies have revealed that change in fruit texture involves alterations in plasma membrane metabolism, starch degradation, the symplast/apoplast pathway, and cell wall structure and dynamics [47]. In apples, transferase activity in the flesh tissue changed during the development of mealiness [15]; however, in peaches, in addition to UDP-glycosyltransferase and xyloglucosyl transferase activity, TF activity changed during the development of mealiness. In this study, the most significantly enriched KEGG pathways associated with peach mealiness were ‘carbon metabolism’ and ‘plant hormone signal transduction’, which were also significantly enriched in mealy apples [15]. In addition to the abovementioned KEGG pathways, ‘galactose metabolism’ and ‘pentose and glucuronate interconversion’ were significantly enriched in mealy peaches. It has been reported that S-adenosylmethionine synthase (SAM), 1-aminocyclopropane-1-carboxylic acid (ACC), ACS, and ACO involved in the ethylene biosynthesis pathway play important roles in apple mealiness. In apple, MdACS1 and MdACS3 play an important role in the regulation of fruit ripening [55]. Ethylene activates cell wall modification enzymes to promote fruit softening. In this study, ethylene production was significantly higher in the MF mealy peach RM than in the MF non-mealy peach CM, which suggests that ethylene plays an important role in the mealiness of MF peaches.
Transcriptome analysis can provide new insights into the transcriptional regulation of fruit texture [56]. In this study, we compared the fruit characteristics and transcriptome of four peach cultivars: CP13, CP14, CM, and RM. When fully ripened, CP14 and RM peaches exhibited mealiness, whereas CP13 and CM peaches did not. The flesh tissue of CP14 and RM peaches showed intact and separated cells at the mealy stage. The results of transcriptome analysis suggested PpPG1, PpPG2, PpEGase2, PpEXP1, PpEXP3, PpAGP2, PpIAA4, and PpABA2 as potential candidate genes that regulate mealiness in peach. However, the regulatory mechanism of peach mealiness needs to be further explored at the molecular level and validated using gene overexpression and/or silencing techniques. In the MF mealy peach RM, we also found that the NAC TF gene PpBL was significantly upregulated. A previous study showed that PpBL can form a complex with NAC1 to regulate the expression of MYB10.1, thus affecting peach fruit flesh blood color [57]. Additionally, PpBL regulates the maturity date and ethylene synthesis in peach [58]. We found that most of the early maturing peaches that showed both the freestone characteristic and blood-colored flesh had a mealy texture. Whether PpBL is involved in the regulation of PpPG1 activity and causes mealy traits in RM peaches needs to be investigated further.
5. Conclusions
In mealy fruits, such as SH and MF peaches, cells exhibit significantly enlarged intercellular air spaces, collapsed spatial structure, and disordered arrangement and form small clumps rather than rupturing during ripening. The abnormal metabolism of cell wall neutral sugars, such as Gal, Gal-UA, Ara, and Xyl, may play a critical role in the metabolic disturbance associated with peach mealiness. High expression of the PpPG1 gene is a typical characteristic of mealy peaches, all of which are freestone. In the SH peach cultivar CP14, which does not rely on ethylene for ripening regulation, the PpPG1 gene alone governs multiple textural attributes related to mealiness. Furthermore, the expression levels of Ppβ-GAL2 and PpXY1 were significantly upregulated in CP14 peaches at the mealy stage, while the expression of PpLOB1 was significantly downregulated, suggesting that these genes may be candidate genes associated with mealiness in SH peaches. Because of the influence of ethylene signaling on MF peaches, the factors affecting mealiness in MF peaches are more complex. In addition to PpPG1, the cell-wall-degradation-related gene PpCEL1 and TF genes PpBL and PpERF3 may be candidate genes for mealiness in the MF peach cultivar RM.
Supplementary Materials
The following supporting information can be downloaded at https://www.mdpi.com/article/10.3390/horticulturae10060615/s1, Figure S1: Neutral sugar composition of the cell wall in non-mealy (CP13 and CM) and mealy (CP14 and RM) peaches during ripening. Gal, galactose; Gal-UA, galacturonic acid; Rha, rhamnose; Ara, arabinose; Fuc, fucose; Xyl, xylose; Glc, glucose; Glc-UA, glucuronic acid. Total, total neutral sugars at S4-3 stage. Asterisks represent significant differences (p-value ≤ 0.05) between non-mealy and mealy peaches (p ≤ 0.05; one-way ANOVA). Error bars represent SD; Figure S2: Heatmaps showing the expression profiles of cell wall metabolism-related DEGs in CP13, CM, CP14, and RM peaches during ripening. The color scale represents the fold change in gene expression, ranging from 2-fold up-regulation (red) to 2-fold downregulation (blue). Each horizontal row represents a single DEG, with its gene ID on the right. Vertical columns represent the different samples (same as those described in Figure 5). ERF, ethylene-responsive transcription factor; SAM, S-adenosylmethionine synthase/transferase; ACS, 1-aminocyclopropane-1-carboxylate synthase; ACO, 1-aminocyclopropane-1-carboxylate oxidase; Figure S3: Heatmaps showing the expression profiles of cell wall metabolism-related DEGs in CP13, CM, CP14, and RM peaches during ripening. The color scale represents the fold change in gene expression, ranging from 2-fold up-regulation (red) to 2-fold downregulation (blue). Each horizontal row represents a single DEG, with its gene ID on the right. Vertical columns represent the different samples (same as those described in Figure 5). IAA, Aux/IAA family member; ARF, auxin response factor; ABA, abscisic acid biosynthesis gene; Table S1: Details of sensory evaluation; Table S2: Details of gene ID used in this study.
Author Contributions
Conceptualization, H.W., Z.W., and W.Z.; Methodology, H.W., A.L., Z.Y., A.B., J.M., Y.M., W.D., and S.S.; Resources, L.N., L.P., and G.C.; Writing—Original Draft, H.W., A.L., and A.B.; Writing—Review and Editing, G.L., Z.W., and W.Z. All authors have read and agreed to the published version of the manuscript.
Funding
This work was supported by the Excellent Youth Foundation of Henan Scientific Committee of China (212300410094), the Agricultural Science and Technology Innovation Program (ASTIP) (CAAS-ASTIP-2024-ZFRI), the National Natural Science Foundation of China (32271930), and the Central Public-Interest Scientific Institution Basal Research Fund (no. ZGS202209).
Data Availability Statement
Data is contained within the article.
Acknowledgments
The authors would like to express their gratitude to Umar Hayat, a student at the Zhengzhou Fruit Research Institute, Chinese Academy of Agricultural Sciences, for his valuable assistance in editing this manuscript.
Conflicts of Interest
The authors declare no conflicts of interest.
References
- Monti, L.L.; Bustamante, C.A.; Osorio, S.; Gabilondo, J.; Borsani, J.; Lauxmann, M.A.; Maulión, E.; Valentini, G.; Budde, C.O.; Fernie, A.R.; et al. Metabolic profiling of a range of peach fruit varieties reveals high metabolic diversity and commonalities and differences during ripening. Food Chem. 2016, 190, 879–888. [Google Scholar] [CrossRef] [PubMed]
- Lester, D.R.; Sherman, W.B.; Atwell, B.J. Endopolygalacturonase and the Melting Flesh (M) Locus in Peach. J. Am. Soc. Hortic. Sci. 1996, 121, 231–235. [Google Scholar] [CrossRef]
- Haji, T.; Yaegaki, H.; Yamaguchi, M. Inheritance and expression of fruit texture melting, non-melting and stony hard in peach. Sci. Hortic. 2005, 105, 241–248. [Google Scholar] [CrossRef]
- Yoshioka, H.; Hayama, H.; Tatsuki, M.; Nakamura, Y. Cell wall modification during development of mealy texture in the stony-hard peach “Odoroki” treated with propylene. Postharvest Biol. Technol. 2010, 55, 1–7. [Google Scholar] [CrossRef]
- Brummell, D.A.; Cin, V.D.; Crisosto, C.H.; Labavitch, J.M. Cell wall metabolism during maturation, ripening and senescence of peach fruit. J. Exp. Bot. 2004, 55, 2029–2039. [Google Scholar] [CrossRef] [PubMed]
- Haji, T.; Yaegaki, H.; Yamaguchi, M. Changes in ethylene production and flesh firmness of melting, non-melting and stony hard peaches after harvest. J. Jpn. Soc. 2001, 70, 458–459. [Google Scholar]
- Haji, T.; Yaegaki, H.; Yamaguchi, M. Softening of Stony Hard Peach by Ethylene and the Induction of Endogenous Ethylene by 1-Aminocyclopropane-1-Carboxylic Acid (ACC). J. Jpn. Soc. Hortic. Sci. 2003, 72, 212–217. [Google Scholar] [CrossRef]
- Moriya, S.; Kunihisa, M.; Okada, K.; Iwanami, H.; Iwata, H.; Minamikawa, M.; Katayose, Y.; Matsumoto, T.; Mori, S.; Sasaki, H.; et al. Identification of QTLs for Flesh Mealiness in Apple (Malus × domestica Borkh.). Hortic. J. 2017, 86, 159–170. [Google Scholar] [CrossRef]
- Kim, M.S.; Duizer, L.M.; Grygorczyk, A. Application of a Texture Analyzer friction rig to evaluate complex texture attributes in apples. Postharvest Biol. Technol. 2022, 186, 111820. [Google Scholar] [CrossRef]
- Segonne, S.M.; Bruneau, M.; Celton, J.-M.; Le Gall, S.; Francin-Allami, M.; Juchaux, M.; Laurens, F.; Orsel, M.; Renou, J.-P. Multiscale investigation of mealiness in apple: An atypical role for a pectin methylesterase during fruit maturation. BMC Plant Biol. 2014, 14, 375. [Google Scholar] [CrossRef]
- Devaux, M.F.; Barakat, A.; Robert, P.; Bouchet, B.; Guillon, F.; Navez, B.; Lahaye, M. Mechanical breakdown and cell wall structure of mealy tomato pericarp tissue. Postharvest Biol. Technol. 2005, 37, 209–221. [Google Scholar] [CrossRef]
- Soteriou, G.A.; Siomos, A.S.; Gerasopoulos, D.; Rouphael, Y.; Georgiadou, S.; Kyriacou, M.C. Biochemical and histological contributions to textural changes in watermelon fruit modulated by grafting. Food Chem. 2017, 237, 133–140. [Google Scholar] [CrossRef] [PubMed]
- Ben-Arie, R.; Sonego, L. Pectolytic enzyme activity involved in woolly breakdown of stored peaches. Phytochemistry 1980, 19, 2553–2555. [Google Scholar] [CrossRef]
- Ben-Arie, R.; Lavee, S. Pectic changes occurring in elberta peaches suffering from woolly breakdown. Phytochemistry 1971, 10, 531–538. [Google Scholar] [CrossRef]
- Li, S.; Li, Q.; Cao, J.; Qu, G.; Jiang, W. Comparative transcriptomic analysis provides novel insights into the difference in textural alteration between mealy and crisp apple patterns. Food Res. Int. 2023, 169, 112941. [Google Scholar] [CrossRef] [PubMed]
- Brummell, D.A.; Dal Cin, V.; Lurie, S.; Crisosto, C.H.; Labavitch, J.M. Cell wall metabolism during the development of chilling injury in cold-stored peach fruit: Association of mealiness with arrested disassembly of cell wall pectins. J. Exp. Bot. 2004, 55, 2041–2052. [Google Scholar] [CrossRef] [PubMed]
- Lurie, S.; Crisosto, C.H. Chilling injury in peach and nectarine. Postharvest Biol. Technol. 2005, 37, 195–208. [Google Scholar] [CrossRef]
- Lurie, S.; Zhou, H.W.; Lers, A.; Sonego, L.; Alexandrov, S.; Shomer, I. Study of pectin esterase and changes in pectin methylation during normal and abnormal pleach ripening. Physiol. Planta. 2003, 119, 287–294. [Google Scholar] [CrossRef]
- Obenland, D.M.; Crisosto, C.H.; Rose, J.K. Expansin protein levels decline with the development of mealiness in peaches. Postharvest Biol. Technol. 2003, 29, 11–18. [Google Scholar] [CrossRef]
- Zheng, Y.L.; Duan, L.H.; Ran, Y.L.; Zhang, P.; Jiang, Y.B.; Zhao, Z.Y.; Jia, X.Y. Transcriptomics analysis reveals molecular mechanism of softening and cell wall polysaccharides-disassembling in peaches treated by flow microcirculation of sodium nitroprusside medium. Postharvest Biol. Technol. 2023, 196, 112190. [Google Scholar] [CrossRef]
- Gwanpua, S.G.; Verlinden, B.E.; Hertog, M.L.A.T.M.; Nicolai, B.M.; Hendrickx, M.; Geeraerd, A. A transcriptomics-based kinetic model for enzyme-induced pectin degradation in apple (Malus × domestica) fruit. Postharvest Biol. Technol. 2017, 130, 64–74. [Google Scholar] [CrossRef]
- Cao, X.; Li, X.; Su, Y.; Zhang, C.; Wei, C.; Chen, K.; Grierson, D.; Zhang, B. Transcription factor PpNAC1 and DNA demethylase PpDML1 synergistically regulate peach fruit ripening. Plant Physiol. 2023, 194, 2049–2068. [Google Scholar] [CrossRef]
- Morgutti, S.; Negrini, N.; Nocito, F.F.; Ghiani, A.; Bassi, D.; Cocucci, M. Changes in endopolygalacturonase levels and character-ization of a putative endo-PG gene during fruit softening in peach genotypes with nonmelting and melting flesh fruit phenotypes. New Phytol. 2006, 171, 315–328. [Google Scholar] [CrossRef]
- Dheilly, E.; Le Gall, S.; Guillou, M.-C.; Renou, J.-P.; Bonnin, E.; Orsel, M.; Lahaye, M. Cell wall dynamics during apple development and storage involves hemicellulose modifications and related expressed genes. BMC Plant Biol. 2016, 16, 201. [Google Scholar] [CrossRef] [PubMed]
- Rothkegel, K.; Espinoza, A.; Sanhueza, D.; Lillo-Carmona, V.; Riveros, A.; Campos-Vargas, R.; Meneses, C. Identification of DNA Methylation and Transcriptomic Profiles Associated with Fruit Mealiness in Prunus persica (L.) Batsch. Front. Plant Sci. 2021, 12, 684130. [Google Scholar] [CrossRef] [PubMed]
- Nuñez-Lillo, G.; Cifuentes-Esquivel, A.; Troggio, M.; Micheletti, D.; Infante, R.; Campos-Vargas, R.; Orellana, A.; Blanco-Herrera, F.; Meneses, C. Identification of candidate genes associated with mealiness and maturity date in peach [Prunus persica (L.) Batsch] using QTL analysis and deep sequencing. Tree Genet. Genomes 2015, 11, 86. [Google Scholar] [CrossRef]
- Nuñez-Lillo, G.; Balladares, C.; Pavez, C.; Urra, C.; Sanhueza, D.; Vendramin, E.; Dettori, M.T.; Arús, P.; Verde, I.; Blanco-Herrera, F.; et al. High-density genetic map and QTL analysis of soluble solid content, maturity date, and mealiness in peach using genotyping by sequencing. Sci. Hortic. 2019, 257, 108734. [Google Scholar] [CrossRef]
- Zhang, R.; Liu, Y.; Zhang, X.; Chen, X.; Sun, J.; Zhao, Y.; Zhang, J.; Yao, J.; Liao, L.; Zhou, H.; et al. Two adjacent NAC transcription factors regulate fruit maturity date and flavor in peach. New Phytol. 2024, 241, 632–649. [Google Scholar] [CrossRef]
- Li, S.; Chen, K.; Grierson, D. Molecular and Hormonal Mechanisms Regulating Fleshy Fruit Ripening. Cells 2021, 10, 1136. [Google Scholar] [CrossRef]
- Li, Z.; Jiang, G.; Liu, X.; Ding, X.; Zhang, D.; Wang, X.; Zhou, Y.; Yan, H.; Li, T.; Wu, K.; et al. Histone demethylase SlJMJ6 promotes fruit ripening by removing H3K27 methylation of ripening-related genes in tomato. New Phytol. 2020, 227, 1138–1156. [Google Scholar] [CrossRef]
- Zeng, W.; Pan, L.; Liu, H.; Niu, L.; Lu, Z.; Cui, G.; Wang, Z. Characterization of 1-aminocyclopropane-1-carboxylic acid synthase (ACS) genes during nectarine fruit development and ripening. Tree Genet. Genomes 2015, 11, 1–10. [Google Scholar] [CrossRef]
- Ng, J.K.; Schröder, R.; Sutherland, P.W.; Hallett, I.C.; Hall, M.I.; Prakash, R.; Smith, B.G.; Melton, L.D.; Johnston, J.W. Cell wall structures leading to cultivar differences in softening rates develop early during apple (Malus × domestica) fruit growth. BMC Plant Biol. 2013, 19, 183. [Google Scholar] [CrossRef] [PubMed]
- Li, Q.; Xu, R.; Fang, Q.; Yuan, Y.; Cao, J.; Jiang, W. Analyses of microstructure and cell wall polysaccharides of flesh tissues provide insights into cultivar difference in mealy patterns developed in apple fruit. Food Chem. 2020, 321, 126707. [Google Scholar] [CrossRef] [PubMed]
- Santiago-Doménech, N.; Jiménez-Bermúdez, S.; Matas, A.J.; Rose, J.K.C.; Muñoz-Blanco, J.; Mercado, J.A.; Quesada, M.A. Anti-sense inhibition of a pectate lyase gene supports a role for pectin depolymerization in strawberry fruit softening. J. Exp. Bot. 2008, 59, 2769–2779. [Google Scholar] [CrossRef] [PubMed]
- Li, Q.; Li, J.; Li, H.; Xu, R.; Yuan, Y.; Cao, J. Physicochemical properties and functional bioactivities of different bonding state polysaccharides extracted from tomato fruit. Carbohydr. Polym. 2019, 219, 181–190. [Google Scholar] [CrossRef] [PubMed]
- Zhou, H.W.; Sonego, L.; Khalchitski, A.; Ben-Arie, R.; Lers, A.; Lurie, S. Cell wall enzymes and cell wall changes in ‘Flavortop’ nectarines-mRNA abundance, enzyme activity, and changes in pectic and neutral polymers during ripening and in wooly fruit. J. Am. Soc. Hortic. Sci. 2000, 125, 630–637. [Google Scholar] [CrossRef]
- Li, Q.; Yao, S.; Deng, L.; Zeng, K. Changes in biochemical properties and pectin nanostructures of juice sacs during the granulation process of pomelo fruit (Citrus grandis). Food Chem. 2022, 376, 131876. [Google Scholar] [CrossRef]
- Miller, G.L. Use of Dinitrosalicylic Acid Reagent for Determination of Reducing Sugar. Anal. Chem. 1959, 31, 426–428. [Google Scholar] [CrossRef]
- Ortiz, A.; Graell, J.; Lara, I. Cell wall-modifying enzymes and firmness loss in ripening ‘Golden Reinders’ apples: A comparison between calcium dips and ULO storage. Food Chem. 2011, 128, 1072–1079. [Google Scholar] [CrossRef]
- Duan, X.; Cheng, G.; Yang, E.; Yi, C.; Ruenroengklin, N.; Lu, W.; Luo, Y.; Jiang, Y. Modification of pectin polysaccharides during ripening of postharvest banana fruit. Food Chem. 2008, 111, 144–149. [Google Scholar] [CrossRef]
- Manrique, G.D.; Lajolo, F.M. Cell-wall polysaccharide modifications during postharvest ripening of papaya fruit (Carica papaya). Postharvest Biol. Technol. 2004, 33, 11–26. [Google Scholar] [CrossRef]
- Niu, L.; Pan, L.; Zeng, W.; Lu, Z.; Cui, G.; Fan, M.; Xu, Q.; Wang, Z.; Li, G. Dynamic transcriptomes of resistant and susceptible peach lines after infestation by green peach aphids (Myzus persicae Sülzer) reveal defence responses controlled by the Rm3 locus. BMC Genom. 2018, 19, 846. [Google Scholar] [CrossRef] [PubMed]
- Li, L.; Yi, P.; Sun, J.; Tang, J.; Liu, G.M.; Bi, J.F.; Ling, D.N. Genome-wide transcriptome analysis uncovers gene networks regulating fruit quality and volatile compounds in mango cultivar ‘Tainong’ during postharvest. Food Research International. 2023, 165, 112531. [Google Scholar] [CrossRef] [PubMed]
- Langfelder, P.; Horvath, S. WGCNA: An R package for weighted correlation network analysis. BMC Bioinform. 2008, 9, 559. [Google Scholar] [CrossRef] [PubMed]
- Ma, L.; Zhang, M.; Chen, J.; Qing, C.; He, S.; Zou, C.; Yuan, G.; Yang, C.; Peng, H.; Pan, G.; et al. GWAS and WGCNA uncover hub genes controlling salt tolerance in maize (Zea mays L.) seedlings. Theor. Appl. Genet. 2021, 134, 3305–3318. [Google Scholar] [CrossRef] [PubMed]
- Win, N.M.; Yoo, J.; Naing, A.H.; Kwon, J.G.; Kang, I.K. 1-Methylcyclopropene (1-MCP) treatment delays modification of cell wall pectin and fruit softening in “Hwangok” and “Picnic” apples during cold storage. Postharvest Biology and Technology. 2021, 180, 111599. [Google Scholar] [CrossRef]
- Goulao, L.F.; Oliveira, C.M. Cell wall modifications during fruit ripening: When a fruit is not the fruit. Trends Food Sci. Technol. 2008, 19, 4–25. [Google Scholar] [CrossRef]
- Yoshioka, H.; Aoba, K.; Kashimura, Y. Molecular Weight and Degree of Methoxylation in Cell Wall Polyuronide during Softening in Pear and Apple Fruit. J. Am. Soc. Hortic. Sci. 1992, 117, 600–606. [Google Scholar] [CrossRef]
- Scalzo, R.; Forni, L.E.; Lupi, D.; Giudetti, G.; Testoni, A. Changes of pectic composition of ‘Annurca’ apple fruit after storage. Food Chem. 2005, 93, 521–530. [Google Scholar] [CrossRef]
- Orr, G.; Brady, C. Relationship of endopolygalacturonase activity to fruit softening in a freestone peach. Postharvest Biol. Technol. 1993, 3, 121–130. [Google Scholar] [CrossRef]
- Hayama, H.; Tatsuki, M.; Ito, A.; Kashimura, Y. Ethylene and fruit softening in the stony hard mutation in peach. Postharvest Biol. Technol. 2006, 41, 16–21. [Google Scholar] [CrossRef]
- Atkinson, R.G.; Sutherland, P.W.; Johnston, S.L.; Gunaseelan, K.; Hallett, I.C.; Mitra, D.; Schaffer, R.J. Down-regulation of POLY-GALACT URONASE1 alters firmness, tensile strength and water loss in apple (Malus × domestica) fruit. BMC Plant Biology. 2012, 12, 129. [Google Scholar] [CrossRef] [PubMed]
- Obenland, D.M.; Carroll, T.R. Mealiness and Pectolytic Activity in Peaches and Nectarines in Response to Heat Treatment and Cold Storage. J. Am. Soc. Hortic. Sci. 2000, 125, 723–728. [Google Scholar] [CrossRef]
- Dong, L.; Zhou, H.W.; Sonego, L.; Lers, A.; Lurie, S. Ethylene involvement in the cold storage disorder of ‘Flavortop’ nectarine. Postharvest Biol. Technol. 2001, 23, 105–115. [Google Scholar] [CrossRef]
- Yue, P.T.; Lu, Q.; Liu, Z.; Lv, T.X.; Li, X.Y.; Bu, H.D.; Liu, W.T.; Xu, Y.X.; Yuan, H.; Wang, A.D. Auxin-activated MdARF5 induces the expression of ethylene biosynthetic genes to initiate apple fruit ripening. New Phytol. 2020, 226, 1781–1795. [Google Scholar] [CrossRef] [PubMed]
- Kou, J.; Zhao, Z.; Zhang, Q.; Wei, C.; Ference, C.M.; Guan, J.; Wang, W. Comparative transcriptome analysis reveals the mechanism involving ethylene and cell wall modification related genes in Diospyros kaki fruit firmness during ripening. Genomics 2021, 113, 552–563. [Google Scholar] [CrossRef]
- Zhou, H.; Lin-Wang, K.; Wang, H.; Gu, C.; Dare, A.P.; Espley, R.V.; He, H.; Allan, A.C.; Han, Y. Molecular genetics of blood-fleshed peach reveals activation of anthocyanin biosynthesis by NAC transcription factors. Plant J. 2015, 82, 105–121. [Google Scholar] [CrossRef]
- Wang, J.; Cao, K.; Li, Y.; Wu, J.; Li, W.; Wang, Q.; Zhu, G.; Fang, W.; Chen, C.; Wang, X.; et al. Genome variation and LTR-RT analyses of an ancient peach landrace reveal mechanism of blood flesh fruit color formation and fruit maturity date advancement. Hortic. Res. 2023, 11, uhad265. [Google Scholar] [CrossRef]
Disclaimer/Publisher’s Note: The statements, opinions and data contained in all publications are solely those of the individual author(s) and contributor(s) and not of MDPI and/or the editor(s). MDPI and/or the editor(s) disclaim responsibility for any injury to people or property resulting from any ideas, methods, instructions or products referred to in the content. |
© 2024 by the authors. Licensee MDPI, Basel, Switzerland. This article is an open access article distributed under the terms and conditions of the Creative Commons Attribution (CC BY) license (https://creativecommons.org/licenses/by/4.0/).