Abstract
Fruit storage is optimized at the lowest safe temperature to maximize storage life whilst avoiding chilling or freezing injury. The few published studies of freezing in kiwifruit (Actinidia spp.) have been conducted with A. chinensis var. deliciosa ‘Hayward’ fruit, with freezing temperatures reported in the range of −1.5 °C to −2.5 °C. In China, a large number of kiwifruit cultivars have been commercialized recently, with at least ten being commonly planted. In this research, freshly harvested fruits from 45 kiwifruit germplasm accessions were measured for freezing point, soluble solids content (SSC) and water content (WC). The difference in freezing point of different tissue zones within a fruit and after different periods of cold storage were determined for the fruit of three representative main cultivars: the green-fleshed ‘Hayward’, the red-fleshed A. chinensis var. chinensis ‘Donghong’, and the yellow-fleshed interspecific hybrid A. eriantha × A. chinensis ‘Jinyan’. The the freezing point of kiwifruit was found to be highly correlated with the SSC. This relationship was found irrespective of whether the measurement was made at harvest, at different places in the fruit, or after ripening during storage. These findings agree with previous reports for kiwifruit and other fruits, although it appears that the relationship may differ among kiwifruit cultivars, something not previously reported and which requires further confirmation.
1. Introduction
Kiwifruit (Actinidia spp.) is a small component (<1%) of global fruit trade, but it is widely planted throughout the world and is commercially important in countries including China, Italy, and New Zealand [1]. Kiwifruit is well known for its unique flavor [2] and as a rich source of nutrients [3]. Kiwifruit is commercially harvested when fruit are mature but firm and unripe so that they can be stored at low temperature for several months to extend the marketing period [4]. The storage temperature affects kiwifruit storage performance. Fruit stored at excessively low temperature may develop symptoms of chilling injury, or even freezing damage. Fruit of all kiwifruit genotypes appear sensitive to chilling injury at temperatures ~0 °C, dependent on fruit maturity [4]. Thus, the postharvest temperature management, combined with the fruit maturity at harvest, is critical for maintaining kiwifruit quality during storage.
Fruit storage is optimized at the lowest safe temperature to avoid chilling injury, which depends on the fruit species and the tissue zones affected: from <13 °C for banana [5] to ~0 °C for kiwifruit [6]. At temperatures <0 °C, the fruit may freeze. Freezing has been investigated in a range of fruits, including apple, pear, grape and jujube [7], peach, nectarine and plum [8], apple, mango, cantaloupe and pineapple [9], blueberry [10], litchi [11], as well as kiwifruit [12,13,14]. In general, the freezing point of fruit tends to be lower at higher soluble solids content (SSC) [7,8,11], although this was also reported as not occurring in kiwifruit [12]. It has also been suggested that freezing point may be associated with water content [15,16]. However, when investigating water content, the state of that water is not always considered. It is likely that the SSC and other molecular interactions within the water, and not simply the amount of water, is relevant to the freezing point. While the concept of the lowest safe temperature has been the basis for setting storage temperatures for a long time, there is currently a trend for some researchers to push storage temperatures for a range of fruit crops, such as prune [17], apricot [18,19], sweet cherry [20,21], and nectarine [22] closer to the freezing point, what is termed near freezing point storage. Whilst this approach disregards aspects of chilling damage and increases the risk of freezing in a commercial environment, it also requires an understanding of the dynamics and measurement of freezing points.
Measurement of the freezing point is dependent on understanding the temperature profile created when cooling the fruit to cause freezing. First, there is a period of supercooling where the temperature decreases below the freezing point, before an abrupt increase in temperature to the freezing point related to the liberation of heat associated with the ice crystallization phase change. The few published studies of freezing in kiwifruit have concentrated on ‘Hayward’ (or presumably ‘Hayward’ when not specified) with freezing temperatures reported in the range of −1.5 °C to −2.5 °C [12,13], although the supercooled temperatures immediately before freezing have also been reported incorrectly as freezing points, between −2.5 and −3.8 °C for ‘Hayward’ fruit of 6–7% SSC [14]. Lower freezing point values in the −1.5 °C to −2.5 °C range tended to be for stored fruit which would have both ripened (increased in SSC) and lost water, although Nanos et al. [12] stated that there is no clear relationship between the fruit SSC and freezing temperature for kiwifruit.
A large number of kiwifruit cultivars have been commercialized recently, with at least ten commonly planted cultivars in China [23]. If it is hypothesized that freezing point correlates with SSC in kiwifruit, does the freezing point differ among the fruit of different cultivars with a similar SSC? This knowledge is particularly relevant at harvest, as it is fruits shortly after harvest that are cooled to storage temperatures, and these fruits with relatively low SSC are possibly most at risk from low-temperature quality issues [4]. The physiology of kiwifruit when harvested and ripened differs among different tissue zones within a fruit [24,25]. The stylar end of kiwifruit commonly starts to soften and ripen first, leading to a higher SSC, ahead of the stem end. There is also a difference in physiology between the kiwifruit flesh (outer pericarp) and core. These differences suggest that freezing points may differ among different tissue zones within a fruit. The storage temperature of ‘Hayward’ can be decreased from 0.5 °C to 0.0 °C early in storage to 0.0 °C to −0.5 °C later, when SSC increases to >10% [4]. This is associated with the decreased risk of both chilling and freezing damage as the fruit ripens. The difference in freezing point among fruit of different cultivars, different positions within a fruit, and after different period of cold storage are still largely unknown.
In this study, freshly harvested fruits from 45 kiwifruit germplasm accessions were measured for freezing point, SSC, and water content (WC). The difference in freezing points of different tissue zones within a fruit and after different periods of cold storage were determined for the fruit of three representative main cultivars: the green-fleshed A. chinensis var. deliciosa ‘Hayward’, the red-fleshed A. chinensis var. chinensis ‘Donghong’ [26], and the yellow-fleshed interspecific hybrid A. eriantha × A. chinensis ‘Jinyan’ [27]. The relationships between freezing point and SSC or WC were described.
2. Materials and Methods
2.1. Fruit Materials
A total of 45 germplasm accessions of kiwifruit (Actinidia spp., including A. chinensis and hybrids with A. rufa and A. eriantha) were investigated. These included the main commercial cultivars planted in China and new cultivars or selections from the wild or from hybridization (Table 1). All vines were grown in an orchard located in Danjiangkou City, Hubei Province, China (32°48′ N, 111°12′ E). The vines were established in 2016 and managed as for a commercial kiwifruit orchard. Once the fruit SSC was >7.0%, the fruits were harvested and transported to the laboratory of Wuhan Botanical Garden, Chinese Academy of Sciences, arriving within 24 h of harvest. The harvest window for all accessions commenced on 3 September 2022 (‘Donghong’) and ended on 7 November 2022 (‘Hayward’).

Table 1.
Freezing point, soluble solids content (SSC), water content (WC), and the correlation coefficient (r) between freezing point and SSC for fruit from different Actinidia accessions measured at harvest. Samples ordered by freezing point. Values are means of 15–20 fruit per accession ± s.e.m.
2.2. Trial Designs
This study of kiwifruit freezing points consisted of three trials. Trial 1: an investigation of different genotypes using fruit at harvest from 45 germplasm accessions. Trial 2: an investigation of variation within fruit by measuring freezing points at different positions within the fruit of three main cultivars. Trial 3: an investigation of the change in freezing point with ripening that occurs during storage using fruit at different times during cold storage for the three main cultivars.
Trial 1: A total of 15 or 20 fruit for each accession were selected on arrival, and the temperature probe (Platinum Resistance Sensors PT100, 3 × 30 × 2000 mm, class A for temperature accuracy: ±(0.15 + 0.002 × |T|) °C; Hangzhou Asmik Sensors Technology, Hangzhou, China) was inserted into the flesh at the equator of the fruit (Figure 1A,B).
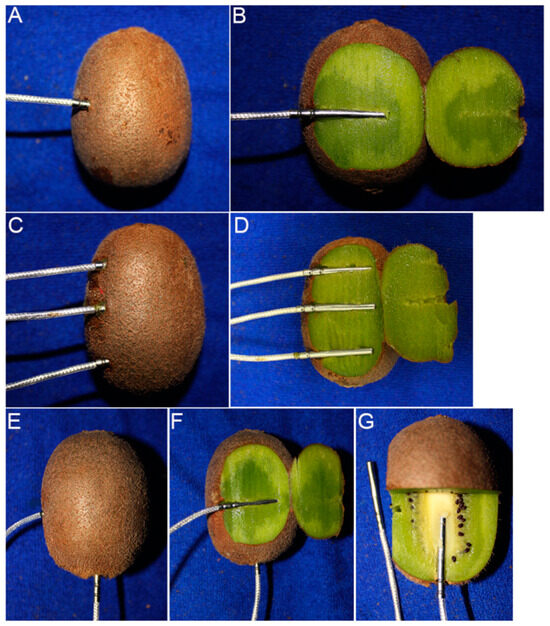
Figure 1.
Fruit with temperature probes inserted at different positions for freezing point measurement. Flesh position for fruit at harvest and during cold storage (A,B). Stem-end, middle and stylar-end positions (C,D). Flesh and fruit core positions (E–G).
The fruits were then placed in a temperature-controlled chamber with a fan inside (LHS-500HC-II, temperature range: −10 °C to 70 °C, accuracy: 0.1 °C, Shanghai Yiheng Technology, Shanghai, China) at −5 °C for up to 24 h. The fruit temperature was recorded every 6 s using a 20-channel temperature logger (MIK-R6000C-BDQ, Hangzhou Asmik Sensors Technology, Hangzhou, China). The next day, the fruits were removed and warmed at 20–25 °C for at least 8 h before measuring SSC and WC.
Trial 2: ‘Hayward’, ‘Donghong’, and ‘Jinyan’ fruit were used for freezing point measurement at different positions within 12–17 fruits per cultivar. Three temperature probes were inserted into the fruit flesh at the stem end, middle, and stylar end of each fruit (Figure 1C,D). The freezing points of the fruit flesh (as described for Trial 1) and core were also measured for comparison, a temperature probe was inserted into the center point of the stylar end to obtain the freezing point of the core (Figure 1E–G). The fruit, 15–18 per cultivar, were removed and warmed at 20–25 °C for at least 8 h before measuring SSC and WC.
Trial 3: ‘Hayward’, ‘Donghong’ and ‘Jinyan’ fruits were placed in single-layer trays with polyliners on arrival and stored at 1 °C for up to 18 weeks. The polyliner created a high relative humidity, >95%, around the fruit. Sub-samples of 15 fruits were taken out of the cold room after different storage periods, a temperature probe inserted into the flesh at the equator of each fruit, and the fruits placed into the freezing chamber and cooled at −5 °C for up to 24 h. The fruits were removed and warmed at 20–25 °C for at least 8 h before measuring SSC and WC.
2.3. Freezing Point, Soluble Solids Content, and Water Content Measurements
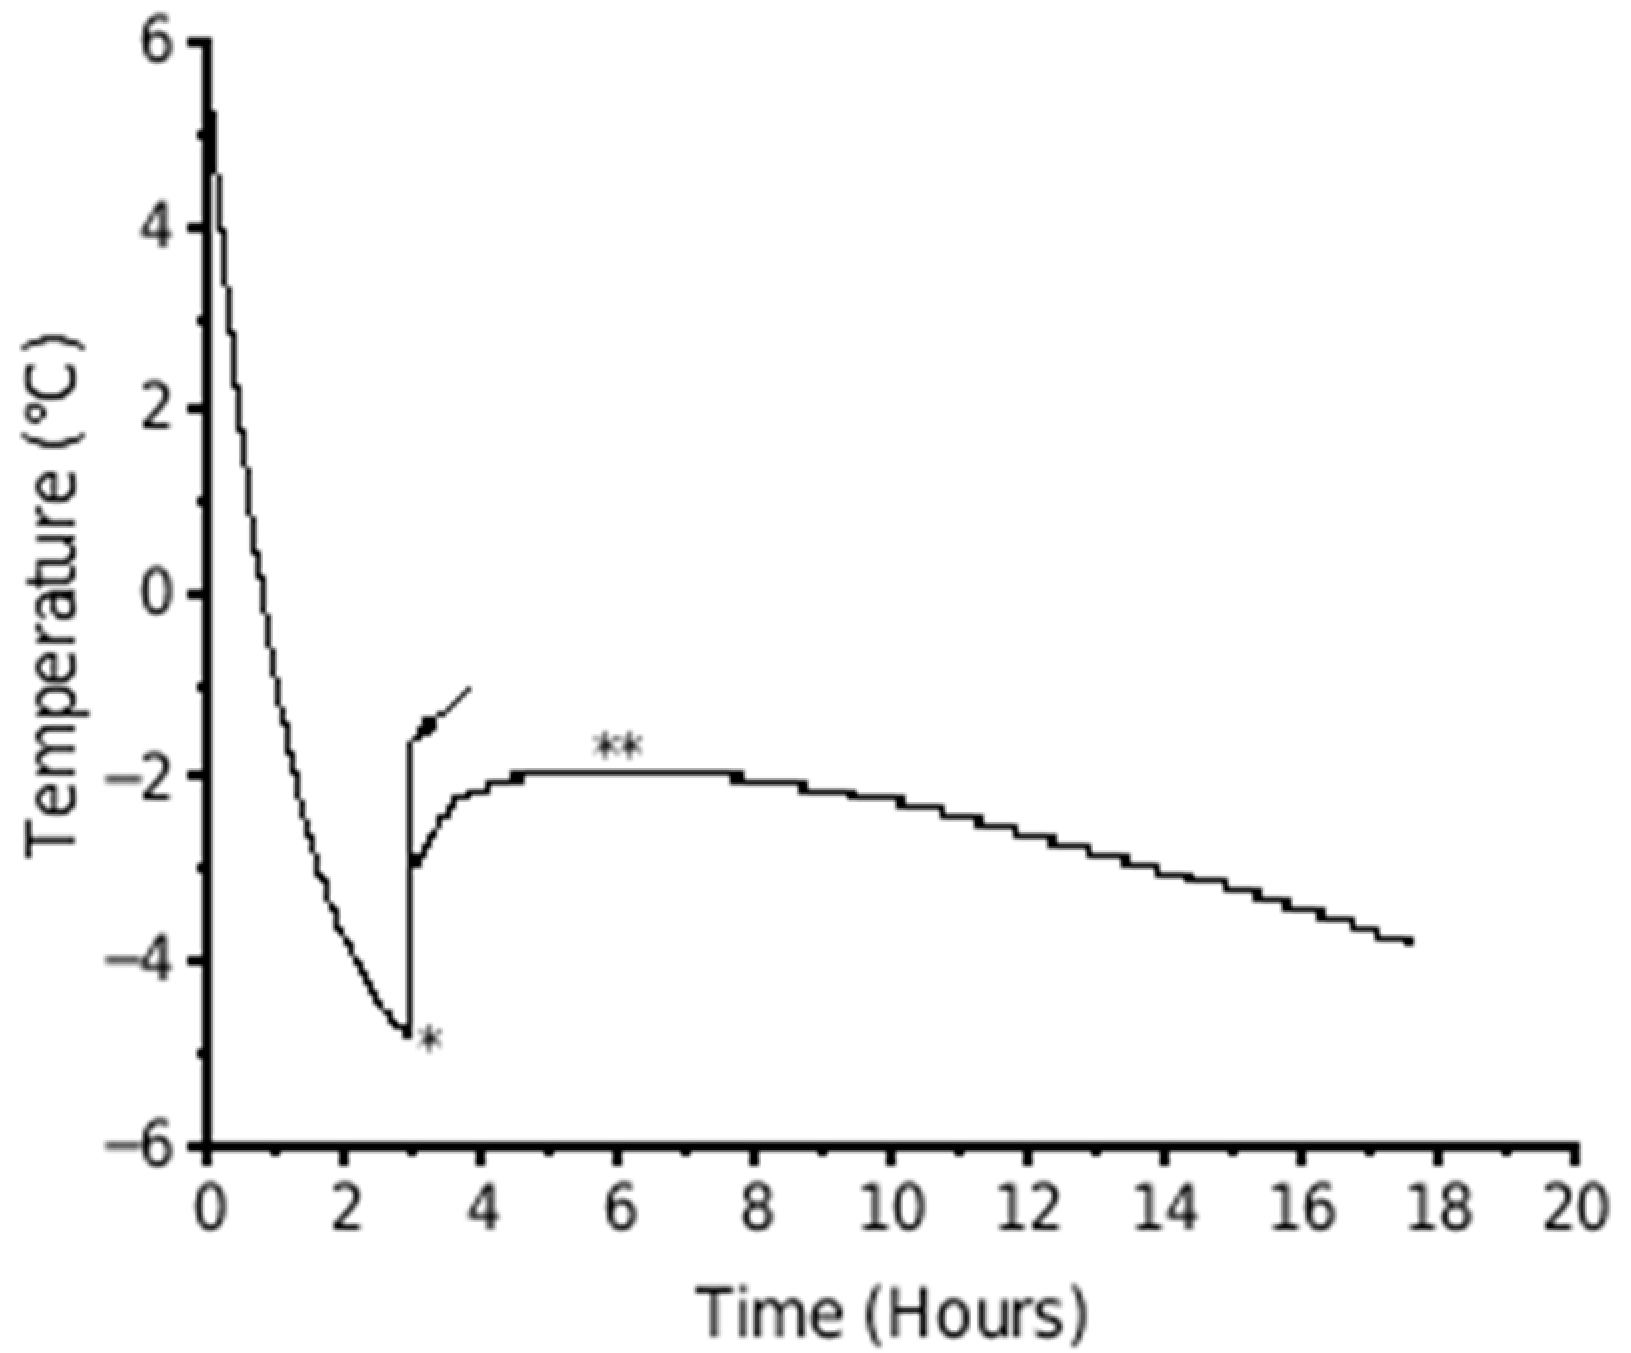
The highest freezing point of each fruit was manually determined from the fruit temperature curve retrieved from the temperature logger and considered as the freezing point for further analysis (Figure 2).

Figure 2.
Example of the temperature of a kiwifruit during freezing when held at −5 °C for 18 h. The arrow indicates the initial freezing point where there was a sudden increase in temperature as the first ice crystals form following a period of supercooling (∗). The plateau (∗∗) represents the complete freezing of the fruit.
For Trials 1 and 3, WC was measured for a transverse 2 mm slice from the equator of the fruits dried at 65 °C for approximately 24 h. WC was calculated from the mass lost as a percentage of the initial fresh weight of the slice. Fruit juice from the remainder of the fruits was measured for SSC using a refractometer (PAL-1, Atago, Tokyo, Japan). For Trial 2, the fruit was cut transversely into three parts, the stem end, middle, and stylar end, and each part was then cut longitudinally into two halves which were used for SSC and WC measurements.
2.4. Data Analysis
Data are presented graphically as scatter plots or sample means and standard error of means (s.e.m.) using Origin 2021 (OriginLab Corporation, Northampton, MA, USA). The correlations between freezing point and SSC or WC, and between SSC and WC, were quantified by Pearson correlations in Origin. Differences among tissue zones were investigated by analysis of variance, with blocking on the fruit, with separation of the means by Tukey test at p = 0.05. Differences among cultivars in the association between freezing point and SSC were determined by multiple regression analysis with groups. Statistical analyses were conducted using Genstat Ver. 22.1.0.532 (VSN International, Hemel Hempstead, UK).
3. Results
3.1. Trial 1: Freezing Point of Fruit of Different Kiwifruit Accessions at Harvest
The freezing point of the 45 samples of fruit ranged from −1.23 °C to −2.61 °C with an overall average across all accessions of −1.84 °C. The SSC was between 7.9% and 16.6% for individual accessions, with an overall average of 11.2%. The WC was between 76.0% and 84.8% for individual accessions, with an overall average of 80.1% (Table 1).
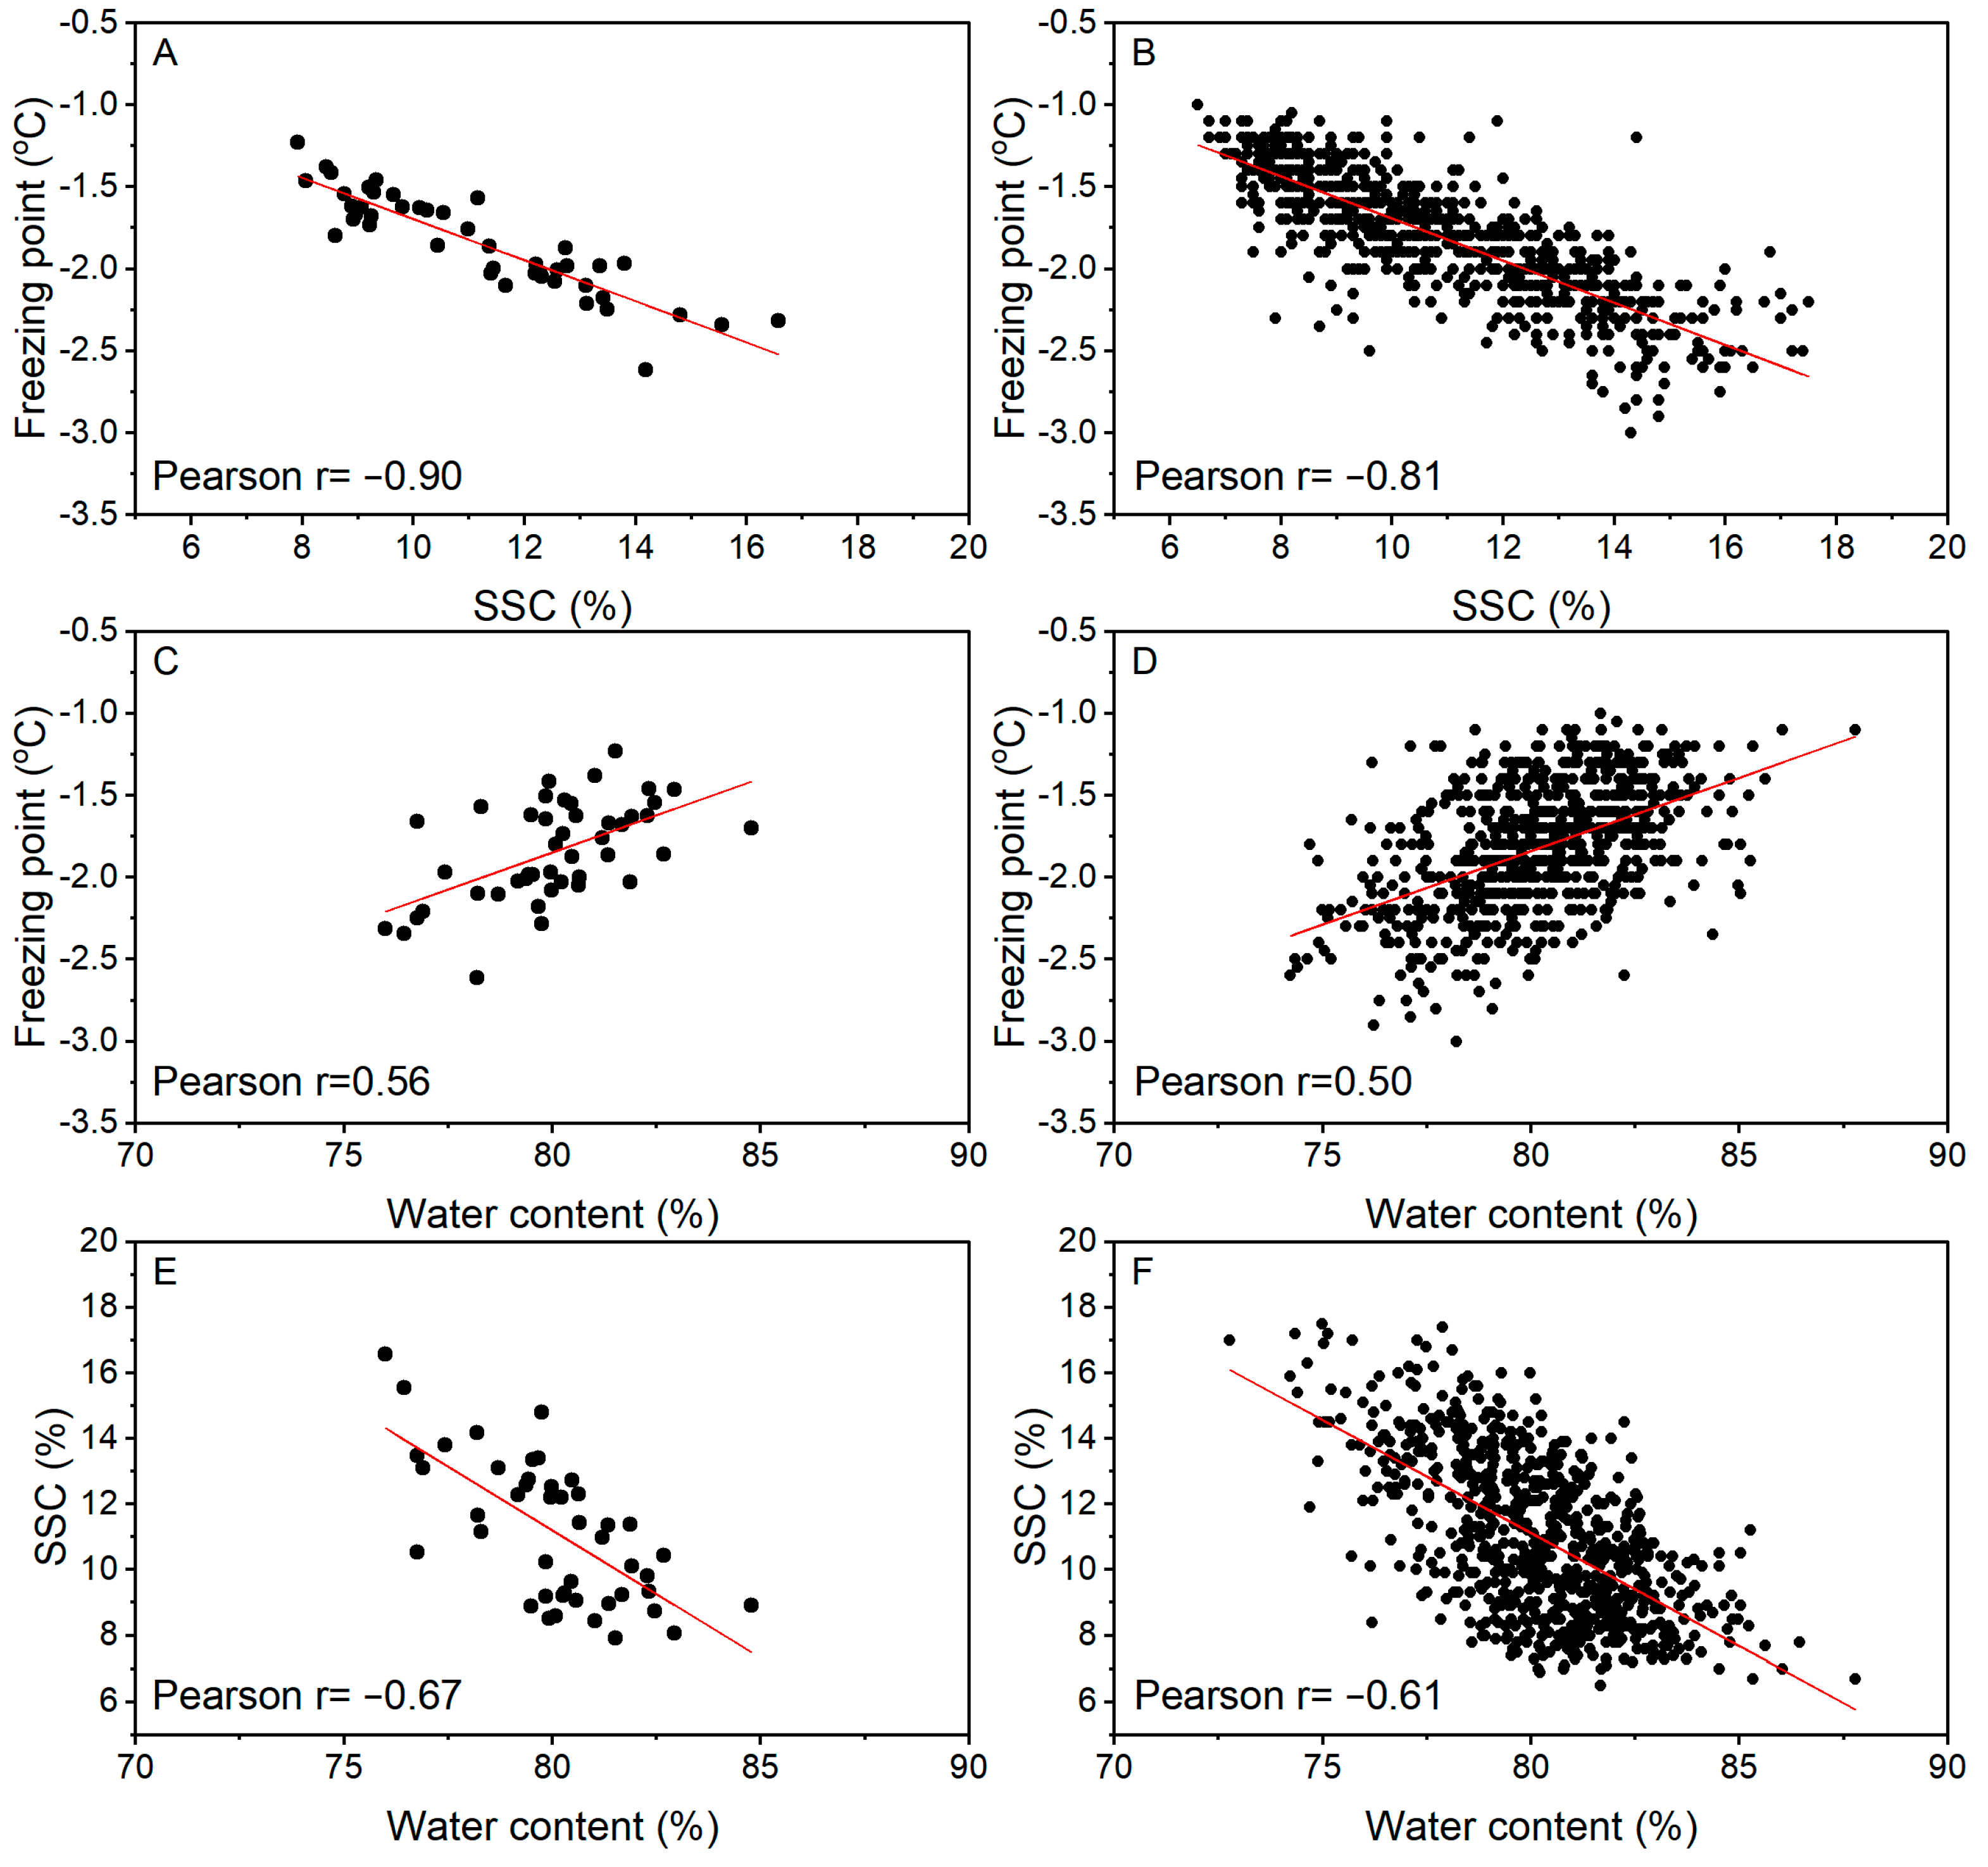
Based on average values for the 45 accessions from Table 1, there was a strong correlation between the freezing point and SSC (r = −0.90; Figure 3A), a weak correlation between SSC and WC (r = −0.67, Figure 3E), and an even weaker correlation between freezing point and WC (r = 0.56; Figure 3C). These correlations were reduced to −0.81, −0.61, and 0.50, respectively, when the individual fruit data were plotted (Figure 3B,D,F). Among the accessions, the correlation between freezing point and SSC was variable, consistently negative, but of different strengths, between −0.08 and −0.94 (Table 1).
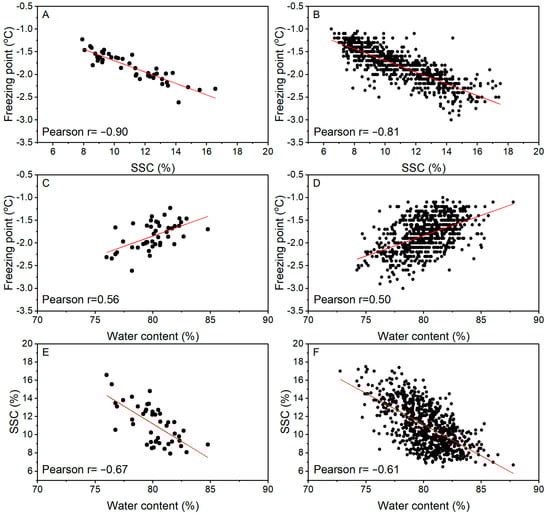
Figure 3.
Correlation analysis of freezing point with soluble solids content (SSC; A,B) or water content (C,D), or SSC with water content (E,F) of fruit from 45 Actinidia accessions at harvest. Values based on the average of each accession (A,C,E; 15–20 fruit per accession) or individual fruit (B,D,F).
3.2. Trial 2: Freezing Point of Different Positions within Fruits
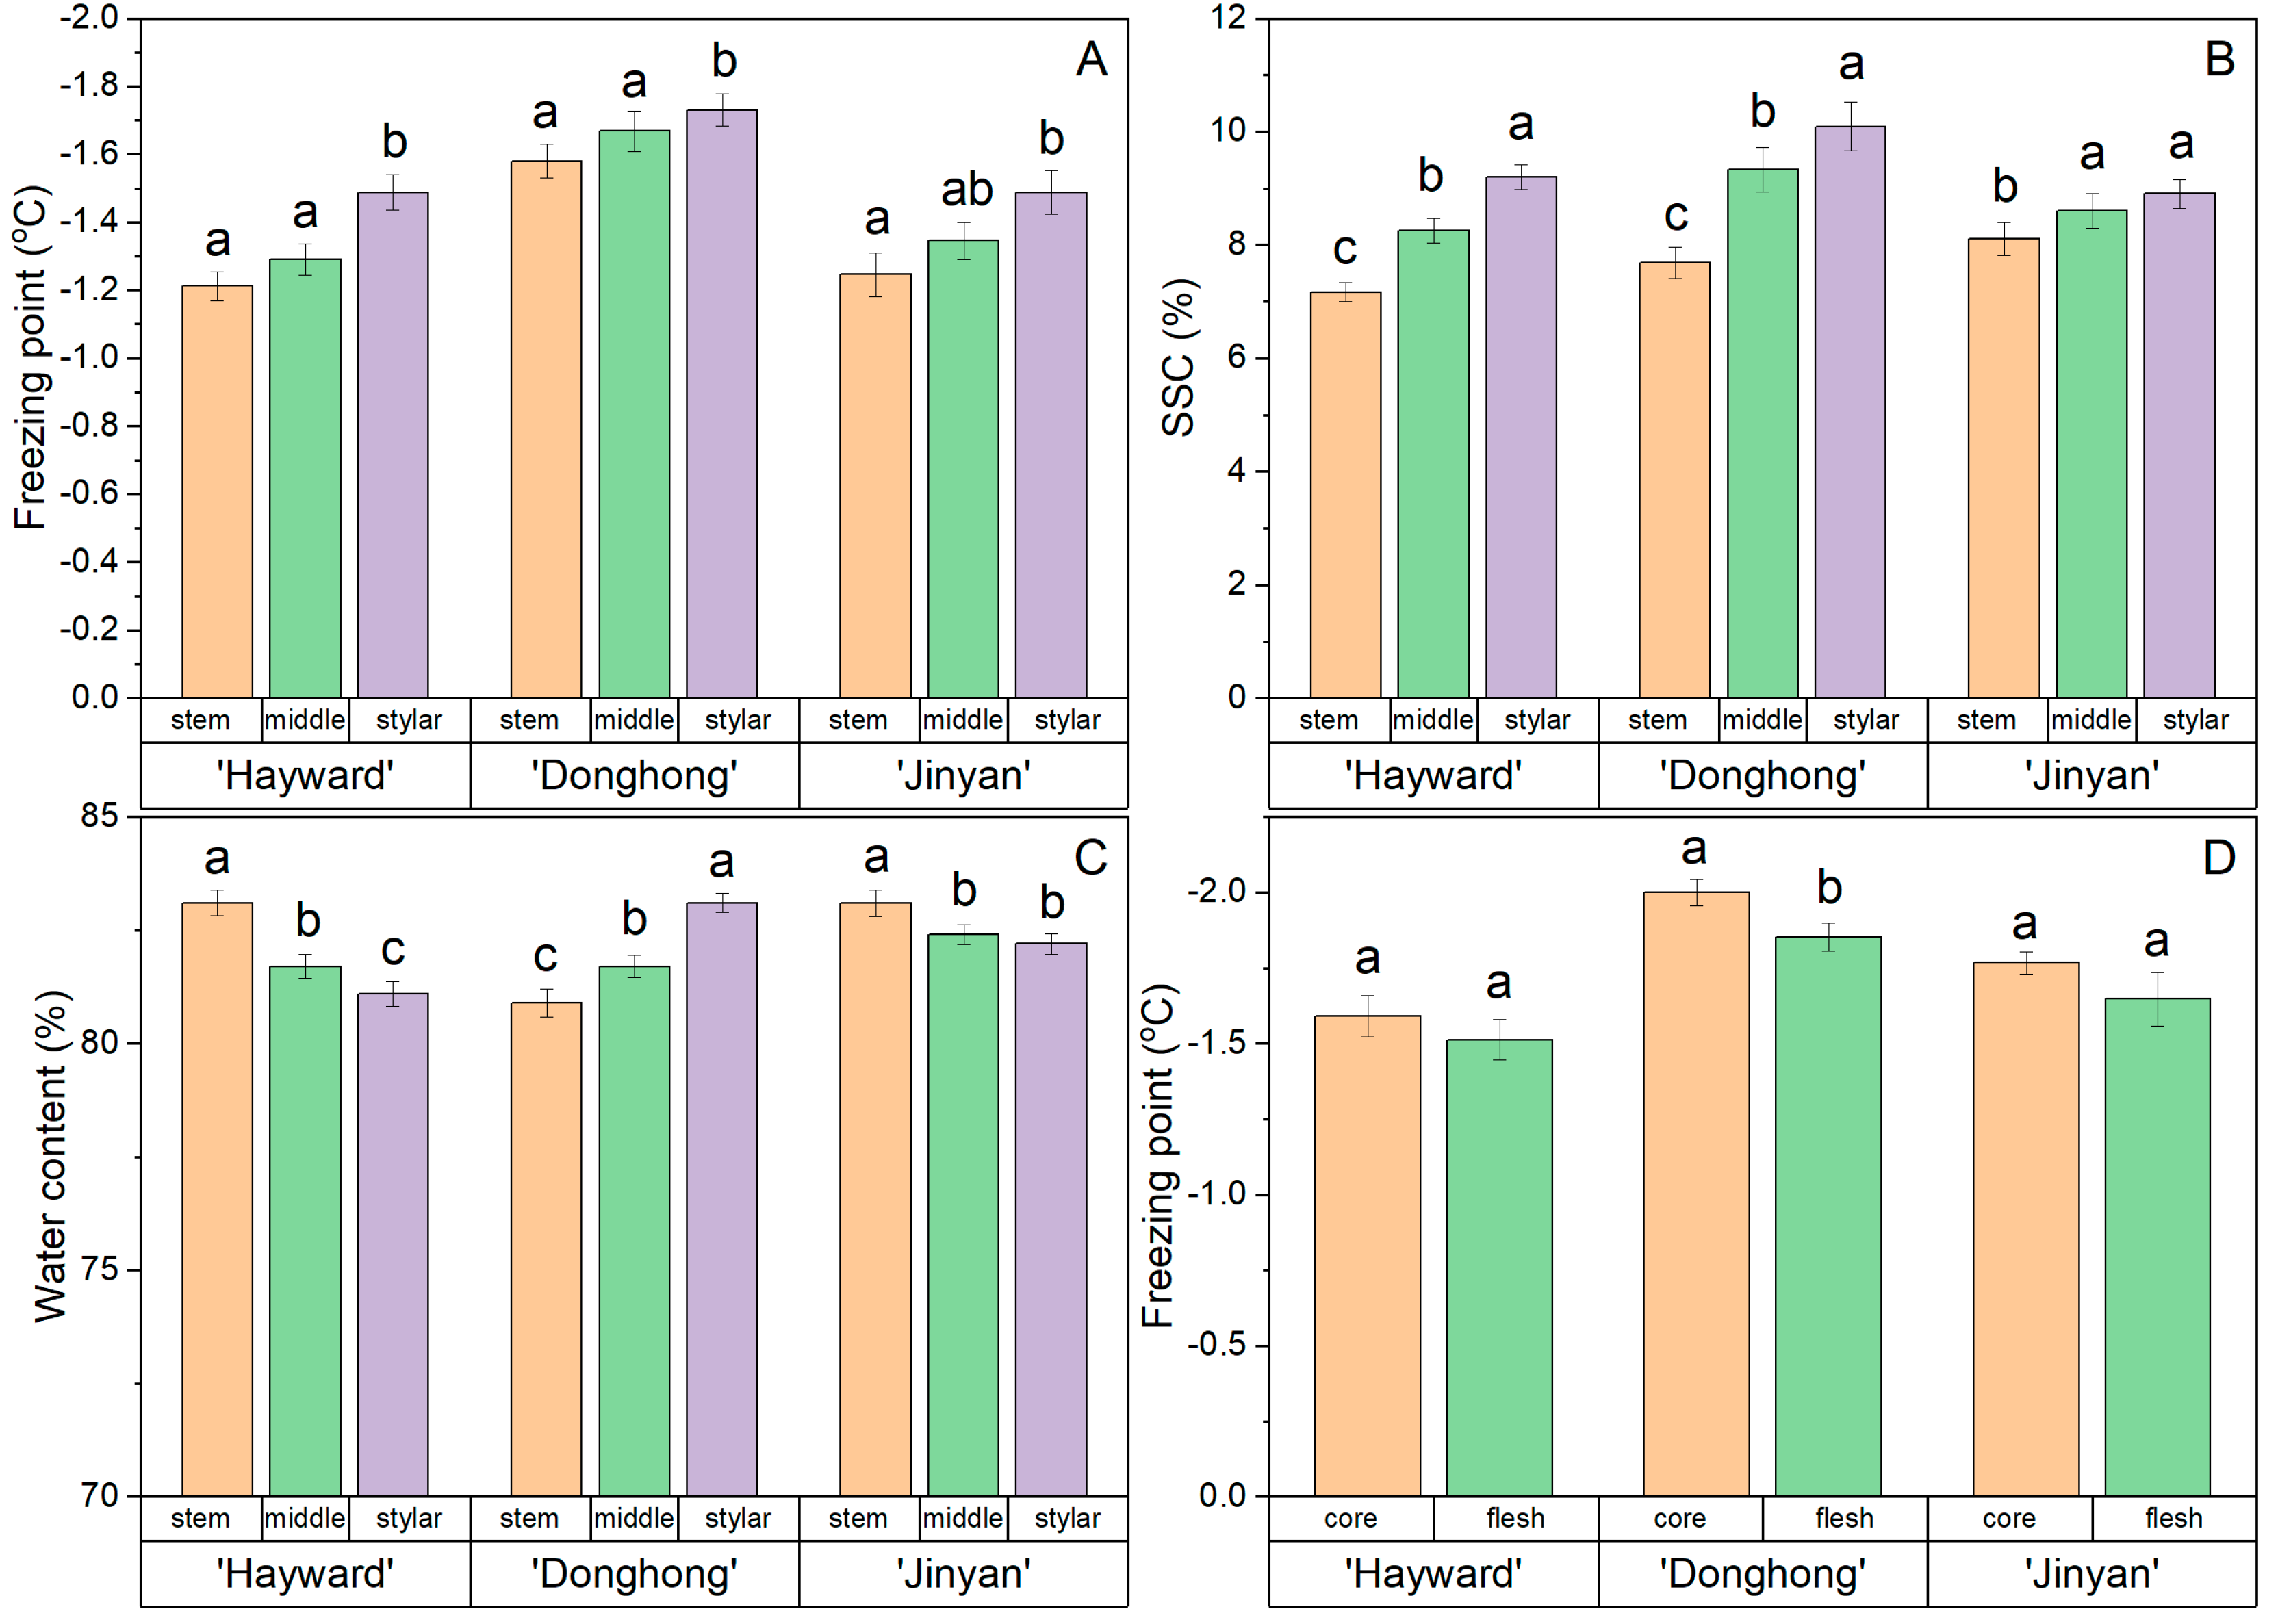
The freezing point, SSC, and WC at the stem end, middle, and stylar end of the fruits of ‘Hayward’, ‘Donghong’, and ‘Jinyan’ are shown in Figure 4. The freezing point showed a consistent trend for highest freezing point at the stem end and lowest at the stylar end (Figure 4A). For all three cultivars, the freezing points at the stylar ends of the fruit differed statistically, but not between the stem end and the middle. Overall, the freezing points of ‘Donghong’ fruit at all positions were lower than for fruits of the other two cultivars.
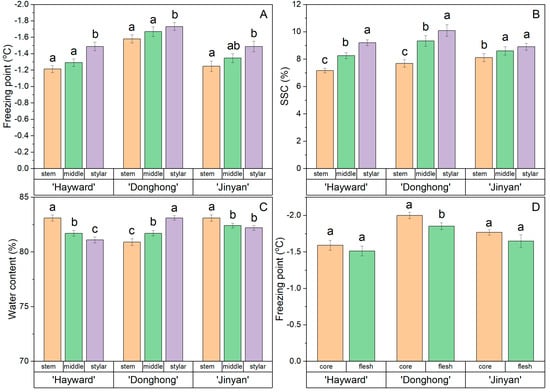
Figure 4.
Comparison of freezing point (A), soluble solids content (SSC) (B) and water content (C) within fruits at the stem end, middle, and stylar end of the flesh, or comparison of the freezing point of flesh and core tissue zones (D). Fruit from Actinidia chinensis var. deliciosa ‘Hayward’, A. chinensis var. chinensis ‘Donghong’, and A. eriantha × A. chinensis ‘Jinyan’. Values are the means of 12–17 fruits per cultivar ± s.e.m., and values not sharing a common letter differ at p = 0.05.
There was a consistent trend in all cultivars for the fruit SSC to be lowest at the stem end and highest at the stylar end, with these differences being statistically significant (Figure 4B).
The WC data were inconsistent, with fruit from ‘Hayward’ and ‘Jinyan’ having most water at the stem end and least at the stylar end, with statistically identifiable differences between the ends, whereas for ‘Donghong’, the trend was reversed, with most water at the stylar end and least at the stem end (Figure 4C). Only in the ‘Donghong’ fruit was the freezing point of flesh statistically higher than the core, although there was a similar trend for the other cultivars (Figure 4D).
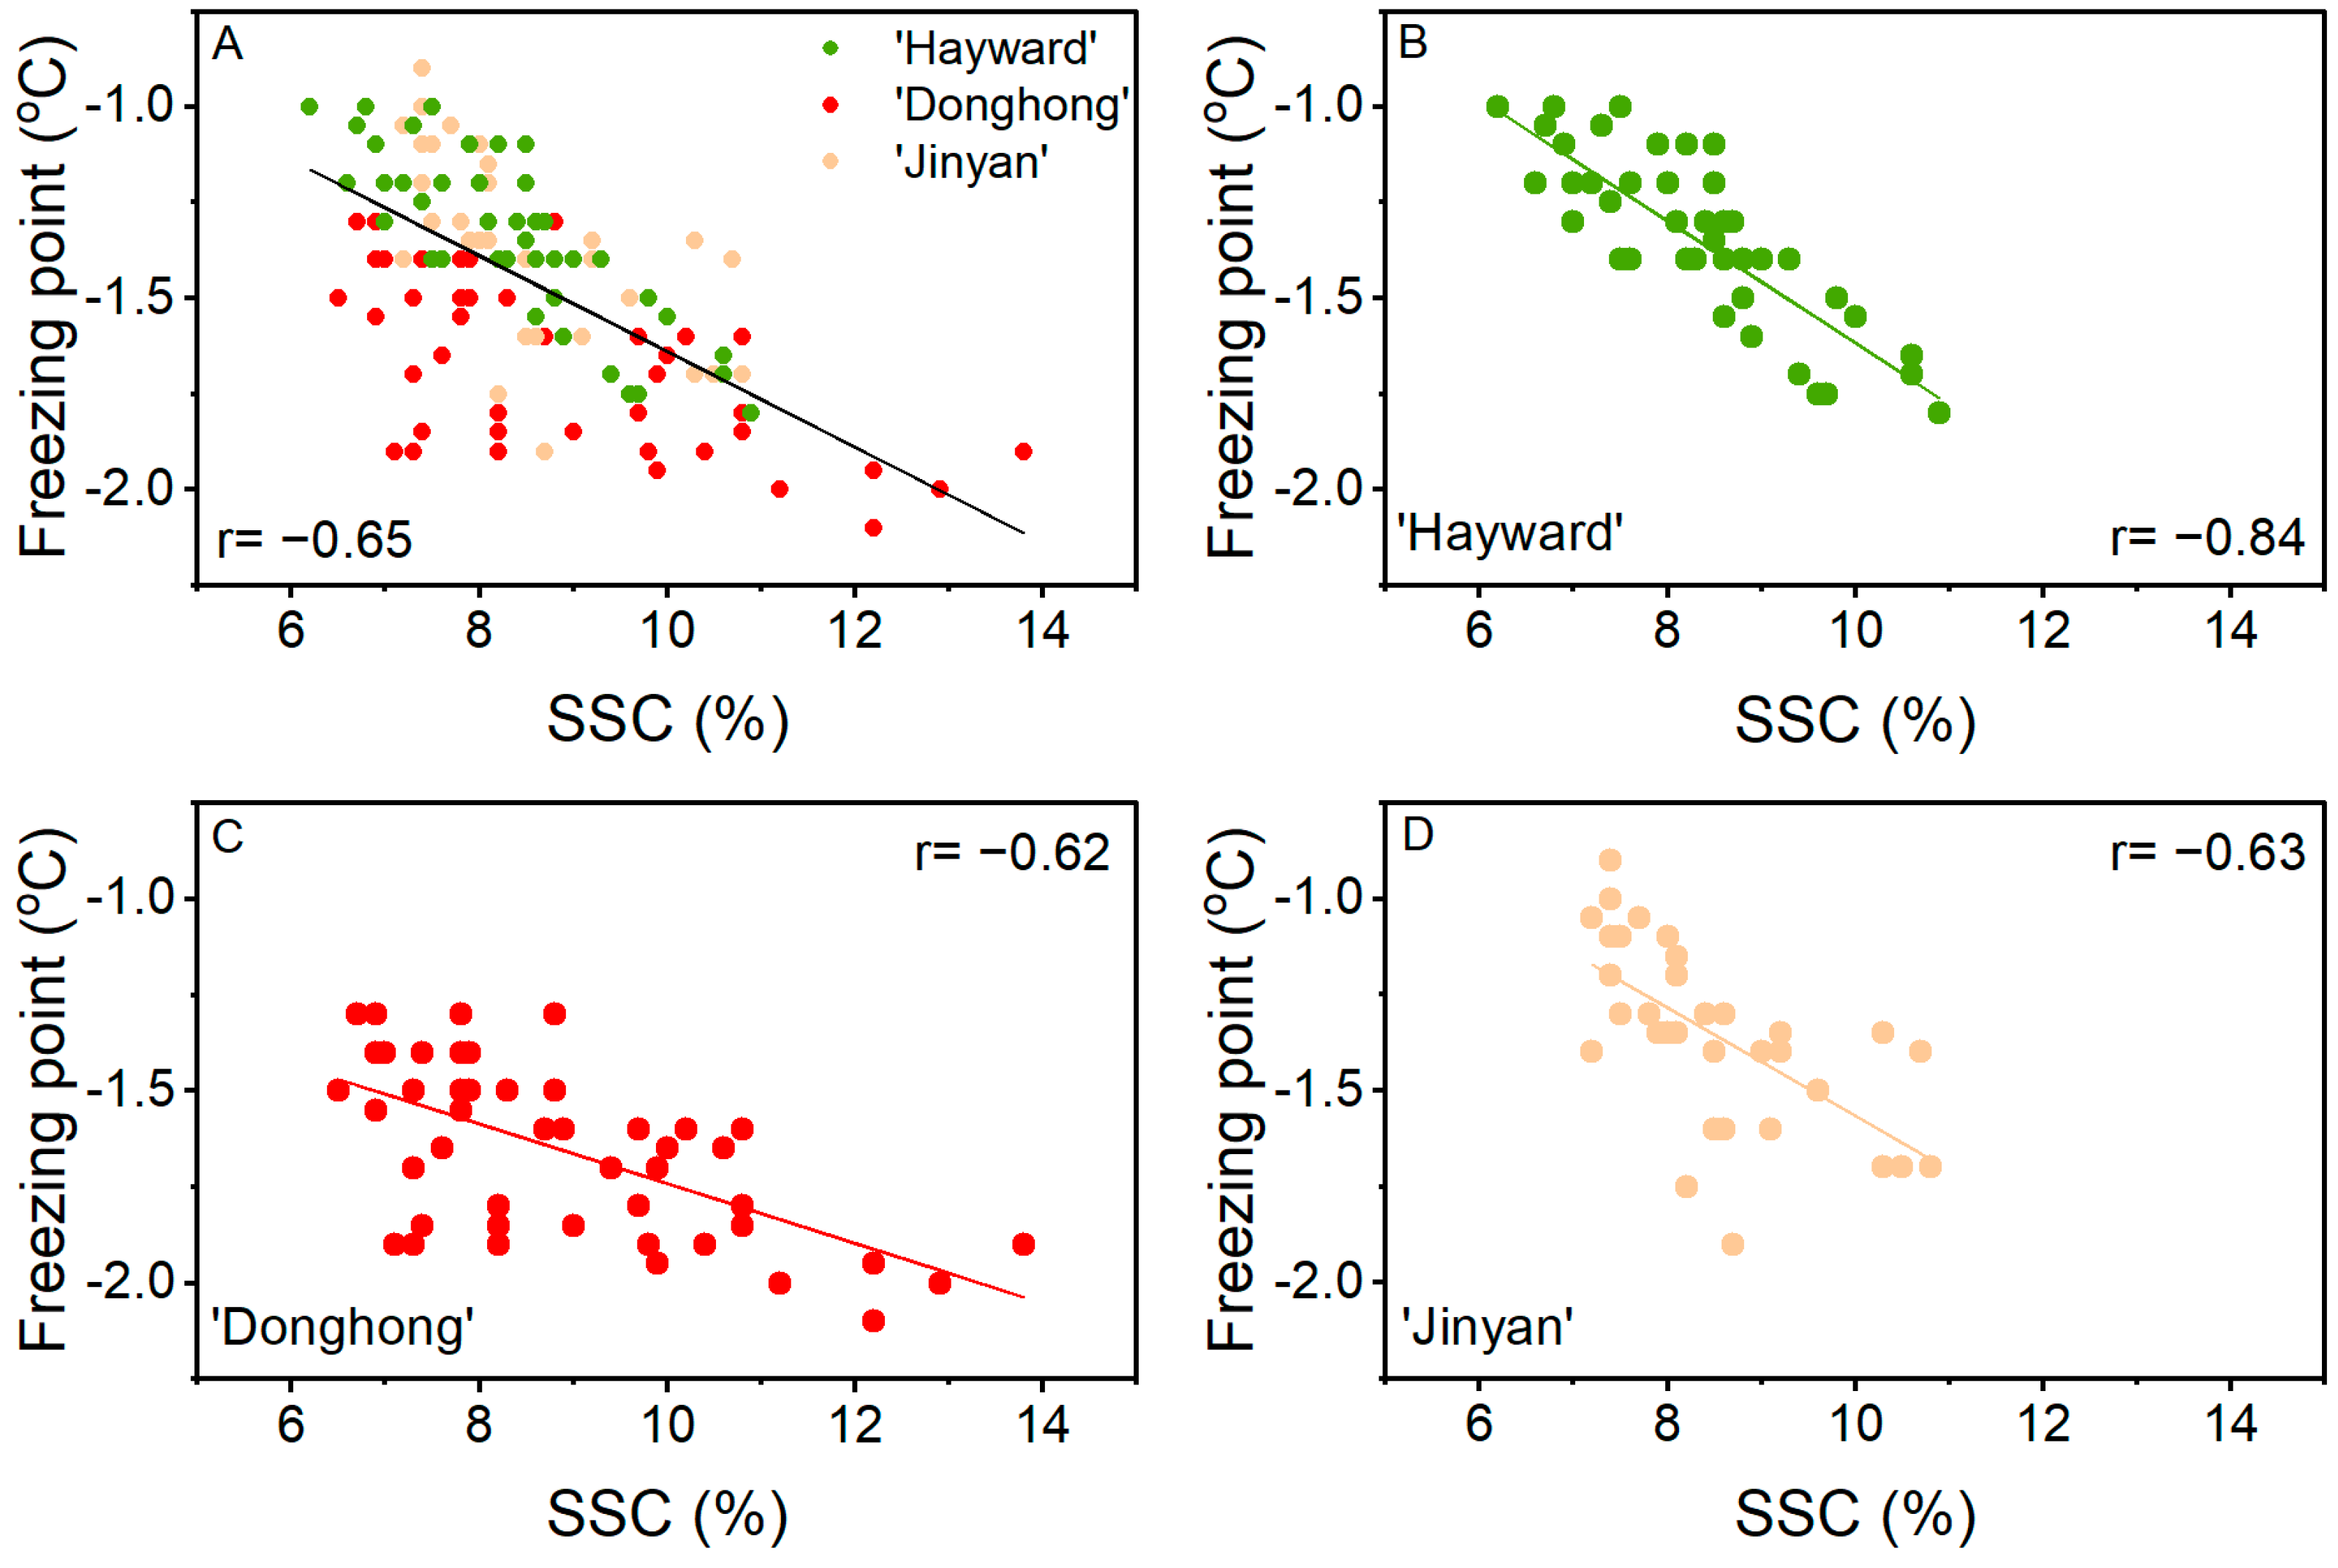
Based on the overall data from three cultivars and three positions within a fruit, freezing point showed a correlation with SSC (r = −0.65; Figure 5). From the plot in Figure 5A, the individual cultivar data were not evenly spread about the correlation line. This was confirmed by the individual plots for each cultivar (Figure 5B–D) with the correlation of freezing point with SSC being better for ‘Hayward’ (r = −0.84) than ‘Donghong’ (r = −0.62) or ‘Jinyan’ (r = −0.63). The associations between freezing point and SSC also differed among the cultivars, with slopes of −0.16, −0.08, and −0.14 for ‘Hayward’, ‘Donghong’, and ‘Jinyan’, respectively. ‘Donghong’ and ‘Hayward’ could be separated statistically (p = 0.010), whereas ‘Donghong’ and ‘Jinyan’ could not (p = 0.135). The difference among cultivars was most apparent at 7% SSC, where the average freezing points for ‘Hayward’ and ‘Jinyan’ were ~−1.1 °C, whereas at the same SSC, the freezing point for ‘Donghong’ was ~-1.5 °C. The correlations of the freezing point with WC were low: overall, r = −0.27; for ‘Hayward’, r = −0.57; for ‘Donghong’, r = −0.21; and for ‘Jinyan’, r = −0.58.
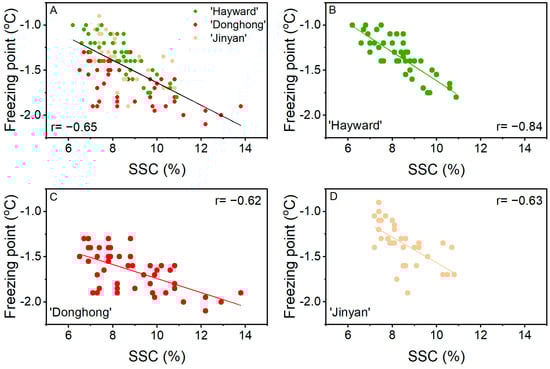
Figure 5.
Correlation of freezing point with soluble solids content (SSC) from the stem-end, middle, and stylar-end positions of fruit at harvest for three cultivars combined (A), Actinidia chinensis var. deliciosa ‘Hayward’ (●, B), A. chinensis var. chinensis ‘Donghong’ (●, C), and A. eriantha × A. chinensis ‘Jinyan’ (●, D).
3.3. Trial 3: Freezing Point of Fruits during Cold Storage
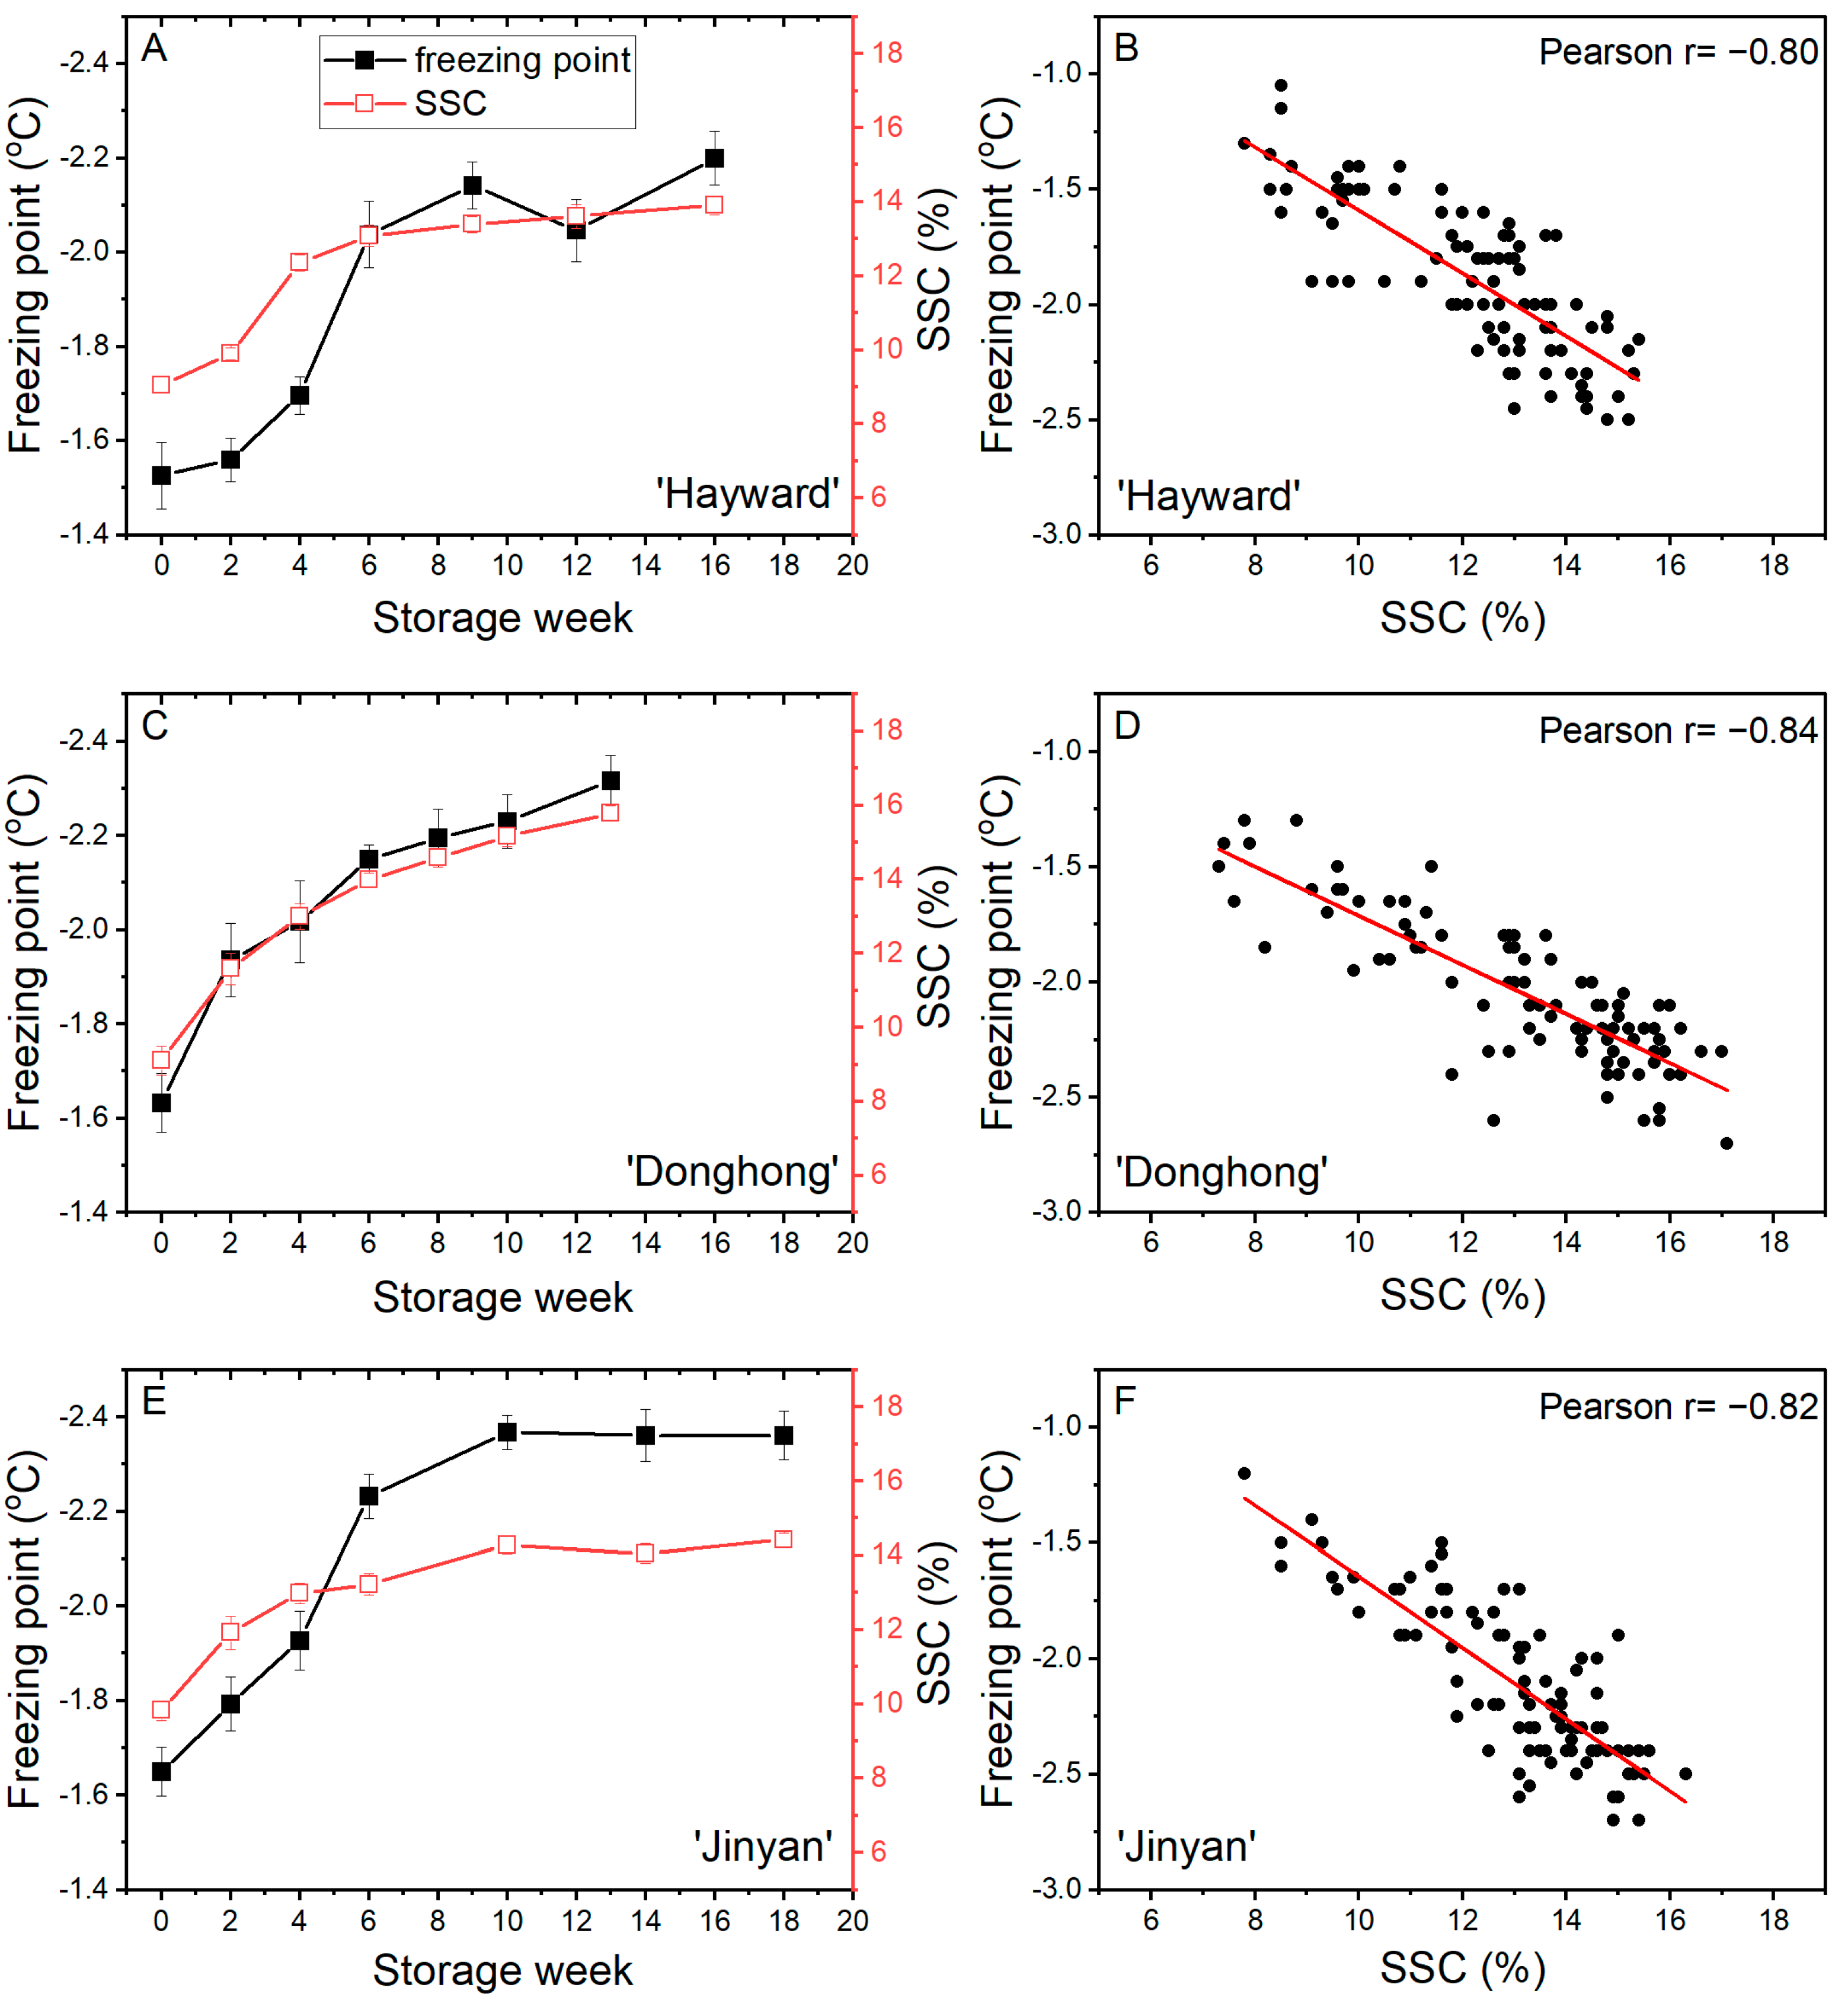
During cold storage, the freezing point of fruits of all three cultivars showed a similar pattern, a rapid decline from between −1.5 °C and −1.7 °C to less than −2.0 °C in the first 6 weeks of storage. Later in storage, whilst the freezing point of ‘Hayward’ and ‘Jinyan’ fruits tended to stabilize, the freezing points for ‘Donghong’ fruits continued to decrease gradually. At the end of storage, the freezing points of all cultivars were in the range of −2.2 °C to −2.4 °C. SSC increased quickly from between 9% and 10% to >13% after 8–10 weeks of storage. While ‘Donghong’ fruits continued to increase slowly thereafter, ‘Jinyan’ and ‘Hayward’ fruits tended to plateau with little or no further increase (Figure 6A,C,E). There were strong correlations between freezing point and SSC; r = −0.80 for ‘Hayward’, r = −0.84 for ‘Donghong’, and r = −0.82 for ‘Jinyan’ (Figure 6B,D,F). While the correlations were of a similar strength for all cultivars, the relationships differed, with slopes of the linear fits of −0.14 for ‘Hayward’, −0.11 for ‘Donghong’ and −0.15 for ‘Jinyan’, albeit with considerable variation around the trend line. For Trial 3 fruits, the association between freezing point and SSC for ‘Donghong’ could be separated statistically from that for both ‘Hayward’ (p = 0.022) and ‘Jinyan’ (p = 0.008).
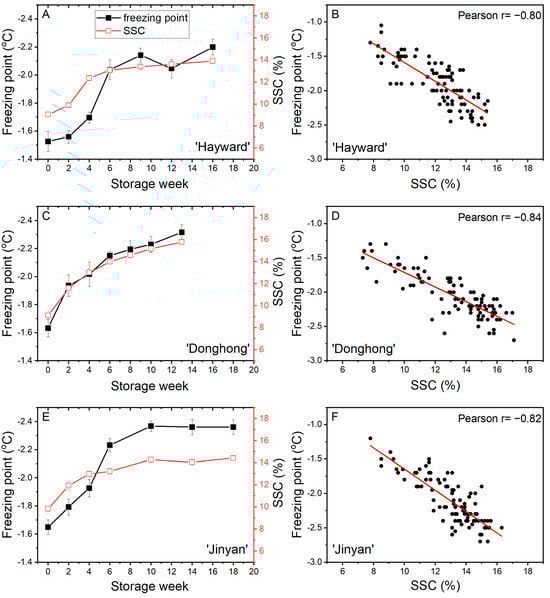
Figure 6.
Freezing point (■) and soluble solids content (SSC, □) of fruit during cold storage at 1 °C (A,C,E) and the correlations between freezing point and SSC (B,D,F) for Actinidia chinensis var. deliciosa ‘Hayward’ (A,B), A. chinensis var. chinensis ‘Donghong’ (C,D), and A. eriantha × A. chinensis ‘Jinyan’ (E,F) fruit. A, C, E values are means of 15 fruits ± sem.
4. Discussion
The findings from this research include the differences in freezing points, SSC, and WC of the fruit from different kiwifruit accessions at harvest. The freezing points obtained were similar to those reported previously for ‘Hayward’ [12,13,14]. Freezing point showed a high correlation with SSC. The freezing point of tissue zones of ‘Hayward’, ‘Donghong’, and ‘Jinyan’ fruits all decreased from the stem end to the stylar end of the fruits. In addition, the core tended to have a lower freezing point than the fruit flesh. As fruits ripened during storage, the SSC increased and the freezing point decreased, as would have been predicted from the general relationship between SSC and freezing point.
The individual accessions were harvested in a range of SSC. This range helped to create the high correlation for freezing point with SSC, particularly when the averaged data from each accession were used. Adding the variability of individual fruits reduced the correlation coefficients slightly. The correlation coefficients for freezing point with SSC were variable and weaker for the individual accessions, possibly because of the reduced number and range of SSC values. A limited range of SSC may also account for the lack of association reported by Nanos et al. [12]. The weaker correlation of WC with freezing point, compared to SSC, was perhaps not surprising, especially when considering that there was a correlation between WC and SSC that would have confounded the WC–freezing point relationship. This confounding factor is not always considered, nor commented on, even when determined.
The difference in freezing point among different positions within fruits directly reflected the difference in physiology linked to SSC [24]. In all three cultivars, the order of freezing point of the different positions corresponded to the SSC: highest SSC and lowest freezing point at the stylar end and lowest SSC and highest freezing point at the stem end, as indicative of the progress of ripening. However, among the three cultivars, there appeared to be differences in the relationships between SSC and freezing point and differences for freezing points at specific SSCs, possibly indicative of the complexity of factors within the fruit, beyond SSC, that may affect the freezing point. In addition, the slope of the linear regression through the SSC and freezing point data differed, again suggesting a different relationship, possibly associated with both fruit composition and the amount and range of data available. Confirmation requires a larger dataset. The situation differed for WC, with no consistent trend of WC distribution within the fruits of the three cultivars.
The findings from the three cultivars during storage were consistent with those from the accession fruits and positional data, with lower freezing points as the fruits ripened and SSC increased. The increased SSC is derived largely from starch breakdown, but also possibly from small carbohydrates from ripening-associated cell wall changes as well as from water loss. Potential differences in the SSC–freezing point relationships among the three cultivars were again suggested by the linear regression slopes.
The temperature traces presented here show the typical phases of supercooling below the freezing point until ice nucleation occurs and there is a release of latent heat associated with ice crystal formation [28]. However, the current traces also show a tight spike in temperature at the end of the supercooling phase, not always seen in other published data [8,12,14]. This is likely a combined effect of the frequency of readings, the composition of the fruit tissue being measured, and the type of temperature probe used. The spike seen In the data only took ~30 s to peak and could therefore be missed if longer intervals between readings were used, such as 6 min [12] or 30 min [14]. This peak can be envisaged as being the highest (initial) freezing point for the first phase change in the juice around the temperature probe. The temperature at the peak of the spike was marginally higher (by ~0.3 °C in Figure 2) than the plateau seen 2–4 h later, which is commonly recorded as the freezing point. The difference between the higher peak and slightly lower plateau temperatures, and the time and change between the two, reflects the heterogenous composition of the juice and tissues around the temperature probe. During the period between the minimum temperature of supercooling and the plateau, there is a sequential ice formation based on ease of ice nucleation from both the initial heterogenous state of the solution and the sequential change that occurs as water is removed from solution. Pure water would cause a single immediate increase in temperature directly to the plateau [28].
It is concluded that the freezing point of kiwifruit is highly correlated with the fruit SSC, irrespective of whether the measurement is made at harvest or after ripening during storage. These findings agree with previous reports for kiwifruit and other fruits [7,8], although not for kiwifruit according to Nanos et al. [12]. However, it appears that the relationship may differ among kiwifruit cultivars, something not previously reported. As for the relationship difference among cultivars, it needs further confirmation because it is not previously reported. And moreover, we need to confirm whether this difference is consistent for fruit collected from different environments and at different ripeness condition. The reports of correlations between WC and freezing point should be treated with caution, particularly where SSC has not been reported or not considered as a covariate.
Author Contributions
Conceptualization, W.H., J.B. and C.Z.; methodology, W.H. and S.S.; investigation, S.S., Z.W. and J.Y.; resources, H.L. and H.T.; writing—original draft preparation, W.H.; writing—review and editing, J.B.; funding acquisition, C.Z. All authors have read and agreed to the published version of the manuscript.
Funding
This research was funded by the Science and Technology Poverty Alleviation Project of Chinese Academy of Sciences (KFJ-FP-202101), the Key R&D Program of Hubei Province (2021BBA100) and the Foundation of Hubei Hongshan Laboratory (2021HSZD017).
Data Availability Statement
Data are contained within the article.
Acknowledgments
The authors thank David Billing of The New Zealand Institute for Plant and Food Research Limited for technical guidance on freezing point measurement.
Conflicts of Interest
The authors declare no conflicts of interest.
References
- Chamberlain, J.E. Global industry and markets. In Kiwifruit: Botany, Production and Uses; Richardson, A.C., Burdon, J.N., Ferguson, A.R., Eds.; CABI: Wallingford, UK, 2024; pp. 16–28. [Google Scholar]
- Garcia, C.V.; Quek, S.-Y.; Stevenson, R.J.; Winz, R.A. Kiwifruit flavour: A review. Trends Food Sci. Technol. 2012, 24, 82–91. [Google Scholar] [CrossRef]
- Richardson, D.P.; Ansell, J.; Drummond, L.N. The nutritional and health attributes of kiwifruit: A review. Eur. J. Nutr. 2018, 57, 2659–2676. [Google Scholar] [CrossRef] [PubMed]
- Burdon, J.N.; Wang, R. Postharvest: Fresh fruit harvest, storage and supply. In Kiwifruit: Botany, Production and Uses; Richardson, A.C., Burdon, J.N., Ferguson, A.R., Eds.; CABI: Wallingford, UK, 2024; pp. 353–374. [Google Scholar]
- Paull, R.E. Chilling injury of crops of tropical and subtropical origin. In Chilling Injury of Horticultural Crops; Wang, C., Ed.; CRC Press: Boca Raton, FL, USA, 1990. [Google Scholar]
- Lallu, N. Low temperature breakdown in kiwifruit. Acta Hortic. 1997, 444, 579–585. [Google Scholar] [CrossRef]
- Jie, W.; Lite, L.; Yang, D. The correlation between freezing point and soluble solids of fruits. J. Food Eng. 2003, 60, 481–484. [Google Scholar] [CrossRef]
- Mitchell, F.; Mayer, G.; Maxie, E.; Coates, W. Cold storage effects on fresh market peaches, nectarines & plums estimating freezing points using low temperatures to delay internal breakdown. Calif. Agric. 1974, 28, 12–14. [Google Scholar]
- Sirijariyawat, A.; Charoenrein, S. Freezing characteristics and texture variation after freezing and thawing of four fruit types. Songklanakarin J. Sci. Technol. 2012, 34, 517–523. [Google Scholar]
- Dan, W.; Lei, S.; Jiazheng, S.; Qian, Z.; Mosen, L. A study of freezing properties of blueberry fruits and influencing factors. Acta Agric. Univ. Jiangxiensis 2013, 35, 940–944. [Google Scholar] [CrossRef]
- Weirong, H.; Zhaoqi, Z.; Yueming, J.; Zuoliang, J. Study on the parameter of ice-temperature storage in litchi (Litchi chinensis Sonn.). Sci. Agric. Sincia 2005, 38, 797–802. [Google Scholar]
- Nanos, G.D.; Fourtouni, A.; Kaltsoula, E.; Sfakiotakis, E.M. Freezing point estimation of kiwifruit. Acta Hortic. 1997, 444, 229–232. [Google Scholar] [CrossRef]
- Harris, S.; McDonald, B. Physical data for kiwifruit (Actinidia chinensis). N. Z. J. Sci. 1975, 18, 307–312. [Google Scholar]
- Gerasopoulos, D.; Chlioumis, G.; Sfakiotakis, E. Non-freezing points below zero induce low-temperature breakdown of kiwifruit at harvest. J. Sci. Food Agric. 2006, 86, 886–890. [Google Scholar] [CrossRef]
- Zhong, Z.; Zhang, M.; Yang, L.; Chen, J.; Che, Z. Study on relation between freezing and physiological and biochemical indexes of fruits and vegetables. Sci. Technol. Food Ind. 2011, 32, 76–78. [Google Scholar]
- Yan, R.; Jia, N.; Song, M.; Zhao, Y.; Zhang, P. Study on correlationship among freezing point and contents of both soluble solids and water. Food Sci. 2007, 28, 554–557. [Google Scholar]
- Ma, Y.; Zhang, X.; Li, L.; Yang, W.; Zhang, W.; Cheng, S.; Guo, M.; Chen, G. Delaying fruit softening of ‘France’ prune (Prunus domestica L.) using near-freezing temperature storage. LWT 2022, 172, 114165. [Google Scholar] [CrossRef]
- Fan, X.; Xi, Y.; Zhao, H.; Liu, B.; Cao, J.; Jiang, W. Improving fresh apricot (Prunus armeniaca L.) quality and antioxidant capacity by storage at near freezing temperature. Sci. Hortic. 2018, 231, 1–10. [Google Scholar] [CrossRef]
- Liu, B.; Jiao, W.; Wang, B.; Shen, J.; Zhao, H.; Jiang, W. Near freezing point storage compared with conventional low temperature storage on apricot fruit flavor quality (volatile, sugar, organic acid) promotion during storage and related shelf life. Sci. Hortic. 2019, 249, 100–109. [Google Scholar] [CrossRef]
- Zhao, H.; Liu, B.; Zhang, W.; Cao, J.; Jiang, W. Enhancement of quality and antioxidant metabolism of sweet cherry fruit by near-freezing temperature storage. Postharvest Biol. Technol. 2019, 147, 113–122. [Google Scholar] [CrossRef]
- Zhao, H.; Wang, B.; Cui, K.; Cao, J.; Jiang, W. Improving postharvest quality and antioxidant capacity of sweet cherry fruit by storage at near-freezing temperature. Sci. Hortic. 2019, 246, 68–78. [Google Scholar] [CrossRef]
- Zhao, H.; Jiao, W.; Cui, K.; Fan, X.; Shu, C.; Zhang, W.; Cao, J.; Jiang, W. Near-freezing temperature storage enhances chilling tolerance in nectarine fruit through its regulation of soluble sugars and energy metabolism. Food Chem. 2019, 289, 426–435. [Google Scholar] [CrossRef]
- Zhong, C.; Huang, W.; Wang, Z.; Li, L.; Li, D.; Zhang, Q.; Zhao, T.; Zhang, P. The breeding progress and development status of the kiwifruit industry in China. Acta Hortic. 2022, 1332, 445–454. [Google Scholar] [CrossRef]
- Liao, G.; Li, X.; Chen, L.; Huang, C.; Zhong, M.; Xu, X. Difference analysis on fruit quality among different parts of kiwifruit. North. Hortic. 2019, 06, 34–42. [Google Scholar] [CrossRef]
- MacRae, E.A.; Bowen, J.H.; Stec, M.G. Maturation of kiwifruit (Actinidia deliciosa cv Hayward) from two orchards: Differences in composition of the tissue zones. J. Sci. Food Agric. 1989, 47, 401–416. [Google Scholar] [CrossRef]
- Zhong, C.; Han, F.; Li, D.; Liu, X.; Zhang, Q.; Jiang, Z.; Huang, H. Breeding of red-fleshed kiwifruit cultivar ‘Donghong’. J. Fruit Sci. 2016, 33, 1596–1599. [Google Scholar]
- Zhong, C.; Wang, S.; Jiang, Z.; Huang, H. ‘Jinyan’, an interspecific hybrid kiwifruit with brilliant yellow flesh and good storage quality. HortScience 2012, 47, 1187–1190. [Google Scholar] [CrossRef]
- Rahman, M.S.; Guizani, N.; Al-Khaseibi, M.; Ali Al-Hinai, S.; Al-Maskri, S.S.; Al-Hamhami, K. Analysis of cooling curve to determine the end point of freezing. Food Hydrocoll. 2002, 16, 653–659. [Google Scholar] [CrossRef]

Disclaimer/Publisher’s Note: The statements, opinions and data contained in all publications are solely those of the individual author(s) and contributor(s) and not of MDPI and/or the editor(s). MDPI and/or the editor(s) disclaim responsibility for any injury to people or property resulting from any ideas, methods, instructions or products referred to in the content. |
© 2024 by the authors. Licensee MDPI, Basel, Switzerland. This article is an open access article distributed under the terms and conditions of the Creative Commons Attribution (CC BY) license (https://creativecommons.org/licenses/by/4.0/).