Article

Establishment of a Comprehensive Evaluation System for Low Nitrogen and Screening of Nitrogen-Efficient Germplasm in Peanut

1
College of Agriculture, Shenyang Agricultural University, Shenyang 110161, China
2
School of Agriculture and Horticulture, Liaoning Agriculture Vocational and Technical College, Yingkou 115009, China
*
Authors to whom correspondence should be addressed.
Horticulturae 2024, 10(7), 669; https://doi.org/10.3390/horticulturae10070669
Submission received: 14 May 2024 / Revised: 18 June 2024 / Accepted: 19 June 2024 / Published: 24 June 2024
(This article belongs to the Section Plant Nutrition)

Abstract

:
Screening for nitrogen (N)-efficient germplasm to achieve high yield and high N efficiency is an important strategy to enhance the sustainability of modern agriculture. In this study, 127 peanut (Arachis hypogaea L.) germplasm resources were comprehensively evaluated by seedling hydroponics and field. At the seedling stage, with the range of low-nitrogen screening concentrations gradually narrowed through a comprehensive membership function analysis, standard normal distribution test, and variance analysis, we found that 0.15 mM N for 24 days could be the optimal condition for evaluating the N efficiency of peanuts. Through principal component analysis and correlation analysis, dry matter weight, root/shoot ratio, N content, N accumulation, N-use efficiency, and N use index were considered to be the N efficiency parameters, and a regression mathematical model was established accordingly. In the field, peanut genotypes that differ in resistance to low-nitrogen stress were evaluated by a yield nitrogen efficiency index under normal nitrogen and no nitrogen applications to verify the results at the seedling stage. Based on the multiple phenotypic analysis, N-efficient and N-inefficient peanut genotypes among germplasm were screened, and a comprehensive evaluation system was established to provide the theoretical basis for peanut breeding and cultivation techniques.

1. Introduction

Nitrogen (N) is essential for plant growth and development, as it is an important component of chloroplasts, nucleic acids, proteins, and many secondary metabolites in plants [1]. Increasing nitrogen input can improve crop yield to a certain extent [2]. China is the largest consumer of nitrogen fertilizer in the world, but the N utilization rate in the country is approximately only 30% [3], which is much lower than the world average. The phenomenon of higher fertilizer application and lower efficiency has become increasingly prominent, not only raising agricultural costs but affecting the sustainable development of agriculture as well [4]. A key initiative for resolving the conflict between resource utilization in agriculture and the environment is to screen and breed high yielding and highly N-efficient germplasm to improve crop N uptake and use efficiency.
The overall N efficiency is a complex trait that is regulated by many genes [5]. Currently, there is no unified standard for evaluating N efficiency, which can be divided into nitrogen uptake and nitrogen-use efficiency [6]. N-uptake efficiency represents the plants’ ability to absorb and accumulate nitrogen, and it is expressed as the ratio of total N absorbed by plants throughout the whole growth period to the amount of N application. N-use efficiency refers to the amount of dry matter or yield produced per unit of N absorbed by the plant. Furthermore, N uptake and use efficiency are affected by the environment. Thus, under low N conditions, changes in N efficiency are mainly influenced by the difference in uptake efficiency, whereas under high N conditions, they are mainly caused by N-use efficiency [7]. The criteria to evaluate N efficiency also differ, owing to the different screening methods used and their specific purposes. Some researchers have paid more attention to N-uptake efficiency. Promoting root elongation [8] and maintaining high root N-uptake activity during the late stages of growth and development [9] can effectively enhance N-uptake efficiency [10]. Additionally, according to the general consensus, maintaining the source–sink balance [11] under low N supply can achieve a more stable assimilation capacity and improve N-use efficiency [12]. Overall, N efficiency involves N absorption, followed by transport, assimilation, utilization, and recycling [13]. Different screening indexes are suitable for different aspects of N efficiency, which are integrated through multiple representative indicators combined with corresponding methods to comprehensively evaluate the various components of N efficiency; thus, establishing a comprehensive evaluation system for N efficiency in peanut is very important.
Peanut N originates from soil N, fertilizer N, and nodule biological N-fixation [14]. Peanut genotypes are known to differ in N efficiency. Determining the appropriate N application rate together with efficient water and fertilizer management can improve peanut N efficiency [15]. Screening N-efficient core germplasms and establishing a comprehensive evaluation system for efficient N utilization in peanuts can bring the nitrogen fixation effect of peanuts into full play, which can be inherited to a certain degree, improve N efficiency and the soil environment, and play an important role in N absorption and utilization. However, most studies on peanuts have focused on their cultivation, physical properties, and chemical properties, but few studies have been conducted on the responses of peanut germplasm to stress. The screening methods and indicators are relatively simple, and a comprehensive nitrogen-efficient evaluation system remains rare.
Therefore, in this experiment, seedlings of 127 peanut germplasm were used as materials in hydroponics and fields. Multivariate statistical analyses such as membership function analysis, correlation analysis, principal component analysis, cluster analysis, and variance analysis were used to comprehensively evaluate and classify the N efficiency of peanut genotypes. The objectives of this study were to (1) determine the optimal concentration for evaluating peanut N efficiency; (2) select effective screening indices; and (3) evaluate peanut N efficiency at seedling stage and field identification, identify N-efficient core germplasm, and establish a comprehensive evaluation system that provides a theoretical basis for peanut breeding and cultivation technology.

2. Materials and Methods

2.1. Plant Materials

A total of 127 peanut core collections (Table S1), including landraces and cultivars, were used. Two of the genotypes were from Japan, one from Canada, and the rest from China. At seedling and field identification stages, 20 peanut core germplasms screened from preliminary seedling work were used as materials, including 10 N-efficient genotypes: Naihan 1, Nonghua 14, Tiehua 1, Caihua 7, Jinhua 21, Nonghua 19, Tiehua 20, Jinhua 6, Jinhua 15, and Jinhua 10; and 10 N-inefficient genotypes: Meilianhua 5, Huayu 33, Tiehua 3, Huayu 22, Huayu 51, Huayu 32, Huayu 9808, Huayu 20, Luhua 12, and Huayu 6808. All materials were provided by Shenyang Agricultural University.

2.2. Experimental Design

2.2.1. Seedling Experiment

The seedling experiment took place in a greenhouse with a 16/8 h photoperiod, a 28/25 °C temperature cycle, a 600 μmol m−2 s−1 illumination intensity, and 60% relative humidity. Uniformly sized peanut seeds were disinfected with 2.5% sodium hypochlorite (NaClO) for 10 min and rinsed three times with sterile water. The sterilized seeds were immersed in water for 12 h and placed in Petri dishes to accelerate germination for 36 h. After germination, seeds were planted in vermiculite, watered regularly, and cultured for 10 days. When peanut seedlings grew into three leaves, those with similar growth were selected and transplanted to a hydroponic container covered with a perforated foam board. One peanut seedling was placed in one well, fixed with cotton, and the cotyledons were removed.
Seedlings were incubated with 1/2 Hoagland nutrient solution for two days and then treated with a normal or low N supply. Ca(NO3)2 was used as the N source, and Hoagland nutrient solution (7.5 mmol N) was used for the normal N treatment (CK). In the preliminary seedling screening experiment, three low-N concentration treatments were set up: N1 (0.75 mM N), N2 (0.15 mM N), and N3 (0.075 mM N) incubated for 28 days, and in the seedling identification experiment, three low-N concentration treatments were set up: 0.25 mM N, 0.15 mM N, and 0.1 mM N cultivated for 24 days. The rest of the components of the nutrient solution remained unchanged, and the lack of Ca2+ in the low-N treatments was compensated with the addition of CaCl2. The components of the normal N nutrient solution are listed in Table S2. Each treatment was repeated thrice. The nutrient solution was replaced at 4-day intervals and was aerated and oxygenated every day for 15 min every hour for 28 days.

2.2.2. Field Experiment

This study was conducted at the Laboratory Station (41°82′ N, 123°56′ E) Peanut Research Institute, Shenyang Agricultural University, China, from 2021 to 2022, which has a temperate semi-humid continental monsoon climate, with an annual average temperature of 8.4 °C, an annual frost-free period of 183 days, and precipitation of 700–1000 mm in 2021–2022 (Figure S1). Experimental soil is brown loam, with 15.4 g kg−1 organic matter, 0.95 g kg−1 total N, 20.4 mg kg−1 available phosphorus, and 325.41 mg kg−1 available potassium, and the pH of the 0–40 cm soil layer is 6.5. Seeds were sown on 18 May and harvested on 30 September in 2021, and sown on 9 May and harvested on 25 September in 2022, with monoseeding: 30 seeds per row, 3 m row length, 0.45 m row spacing, 0.1 m plant spacing, and 3 replications for each treatment, under a randomized block design. There were two N fertilizer treatments: nitrogen fertilizer (N 46%), normal-N (N90 90 kg ha−1), and without N (N0 0 kg ha−1), with calcium superphosphate (P2O5 12%, 72 kg P ha−1) and potassium sulphate (K2SO4 50%, 120 kg K ha−1) [16], which were all applied as basal fertilizers, and the other management measures remained as usual.

2.3. Measurements and Data Analysis

2.3.1. Indicators for Peanut Seedling Evaluation

The height of the main stem and root length were measured with a ruler. The roots were washed with distilled water until the nutrient solution was completely removed.
Each plant was dissected to shoot and root three times per treatment and dried to a constant weight, then the N content was determined with the Kjeldahl apparatus.
Leaf etiolation: during the period of hydroponic culture, the N-deficient morphology and leaf etiolation of peanuts were observed, and the SPAD value of the inverted trefoil was measured. The criteria used are listed in Table S3.
The N efficiency for seedlings was calculated as follows:
NUE = total   dry   weight N   accumulation
NUI = total   dry   weight N   content

2.3.2. Indicators of Peanut Field Evaluation

At harvest 3, similar and representative plants of each genotype out of the one-row plot were used to investigate the pod number per plant, the full-pod number per plant, 100 pod weight, and 100 kernel weight, and 10 plants were taken consecutively to measure the yield.
The N efficiency in the field was calculated as follows:
N   agronomic   efficiency   ( NAE ,   kg   kg - 1 ) = N 90   yield   -   N 0   yield 90
N   physiological   efficiency   ( NPE ,   kg   kg - 1 ) = N 90   yield   -   N 0   yield N 90   N   accumulation   -   N 0   N   accumulation
N   recovery   efficiency   ( NRE ,   % ) = N 90   N   accumulation   -   N 0   N   accumulation 90 × 100
N   dry   matter   production   efficiency   ( DME ,   kg   kg - 1 ) = N 90   plant   dry   weight N   accumulation
N   grain   yield   production   efficiency   ( GYE ,   kg   kg - 1 ) = N 90   yield N   accumulation
The membership function value was used as the comprehensive nitrogen efficiency index (NEI) for N efficiency,
Yield   N   efficiency   index   ( YNEI ) = yield group   yield × comprehensive   NEI group   comprehensive   NEI

2.4. Data Analysis and D Value Calculation

Data were summarized with Excel 2010 and analyzed with SPSS 26.0 and Origin 2021 software.
Considering the basic trait differences among the different peanut genotypes, the low-N resistance coefficient of peanuts may be more reasonable, which was calculated as
N C = low   N   trait normal   N   trait
Principle component analysis (PCA) and cluster analysis were used to assess the differences among 20 peanut genotypes with the relative values of physiology, and then the final total score was calculated using the comprehensive membership function analysis. At present, the membership function value is calculated with the following formulas:
U   N C i = N C i m i n   N C m a x   N C m i n   N C   i = 1 , 2 , 3 , , n
where U(NCi) is the membership function value of low-N based on the trait of genotypes, NCi is the i-th indicator, and max(NC) and min(NC) are the maximum and minimum values of the i-th indicator, respectively.
W i = P i i = 1 n P i   i = 1 , 2 , 3 , , n
where Wi is the weight of the i-th comprehensive indicator, and Pi is the variance contribution rate of the i-th comprehensive indicator.
D = i = 1 n U   N C i W i i = 1 , 2 , 3 , , n
where D is the comprehensive membership function value of each genotype for N efficiency.

3. Results

3.1. Evaluation of N Efficiency in Peanut Seedlings

3.1.1. Leaf Etiolation Degree and SPAD Changes among Peanut Genotypes

Under low-N concentrations, all plants showed different degrees of N deficiency symptoms, such as slow growth, a decrease in the number of leaves, light-green upper leaves, and chlorotic lower leaves. Specifically, Tiehua 20 (46), Tiehua 1 (37), and Jinhua 15 (52) exhibited little etiolation and relatively high SPAD values. Compared with seedlings grown under normal N supply, they showed little difference in leaf color and maintained good growth potential. In contrast, Yuhua 9 (81), Meilianhua 5 (104), and Huayu 20 (15) showed the most severe leaf etiolation and the lowest SPAD values. The upper leaves of these materials were wilted, and the lower leaves were severely wilted, indicating obvious low-N stress (Table S4). There were obvious differences among peanut genotypes in response to low-N stress, but the adaptive response showed different N efficiency in peanut genotypes at different low-N concentrations. Therefore, narrowing down the range of low-N tolerance and determining the optimum low-N concentration suitable for large scale screening germplasm are very important.

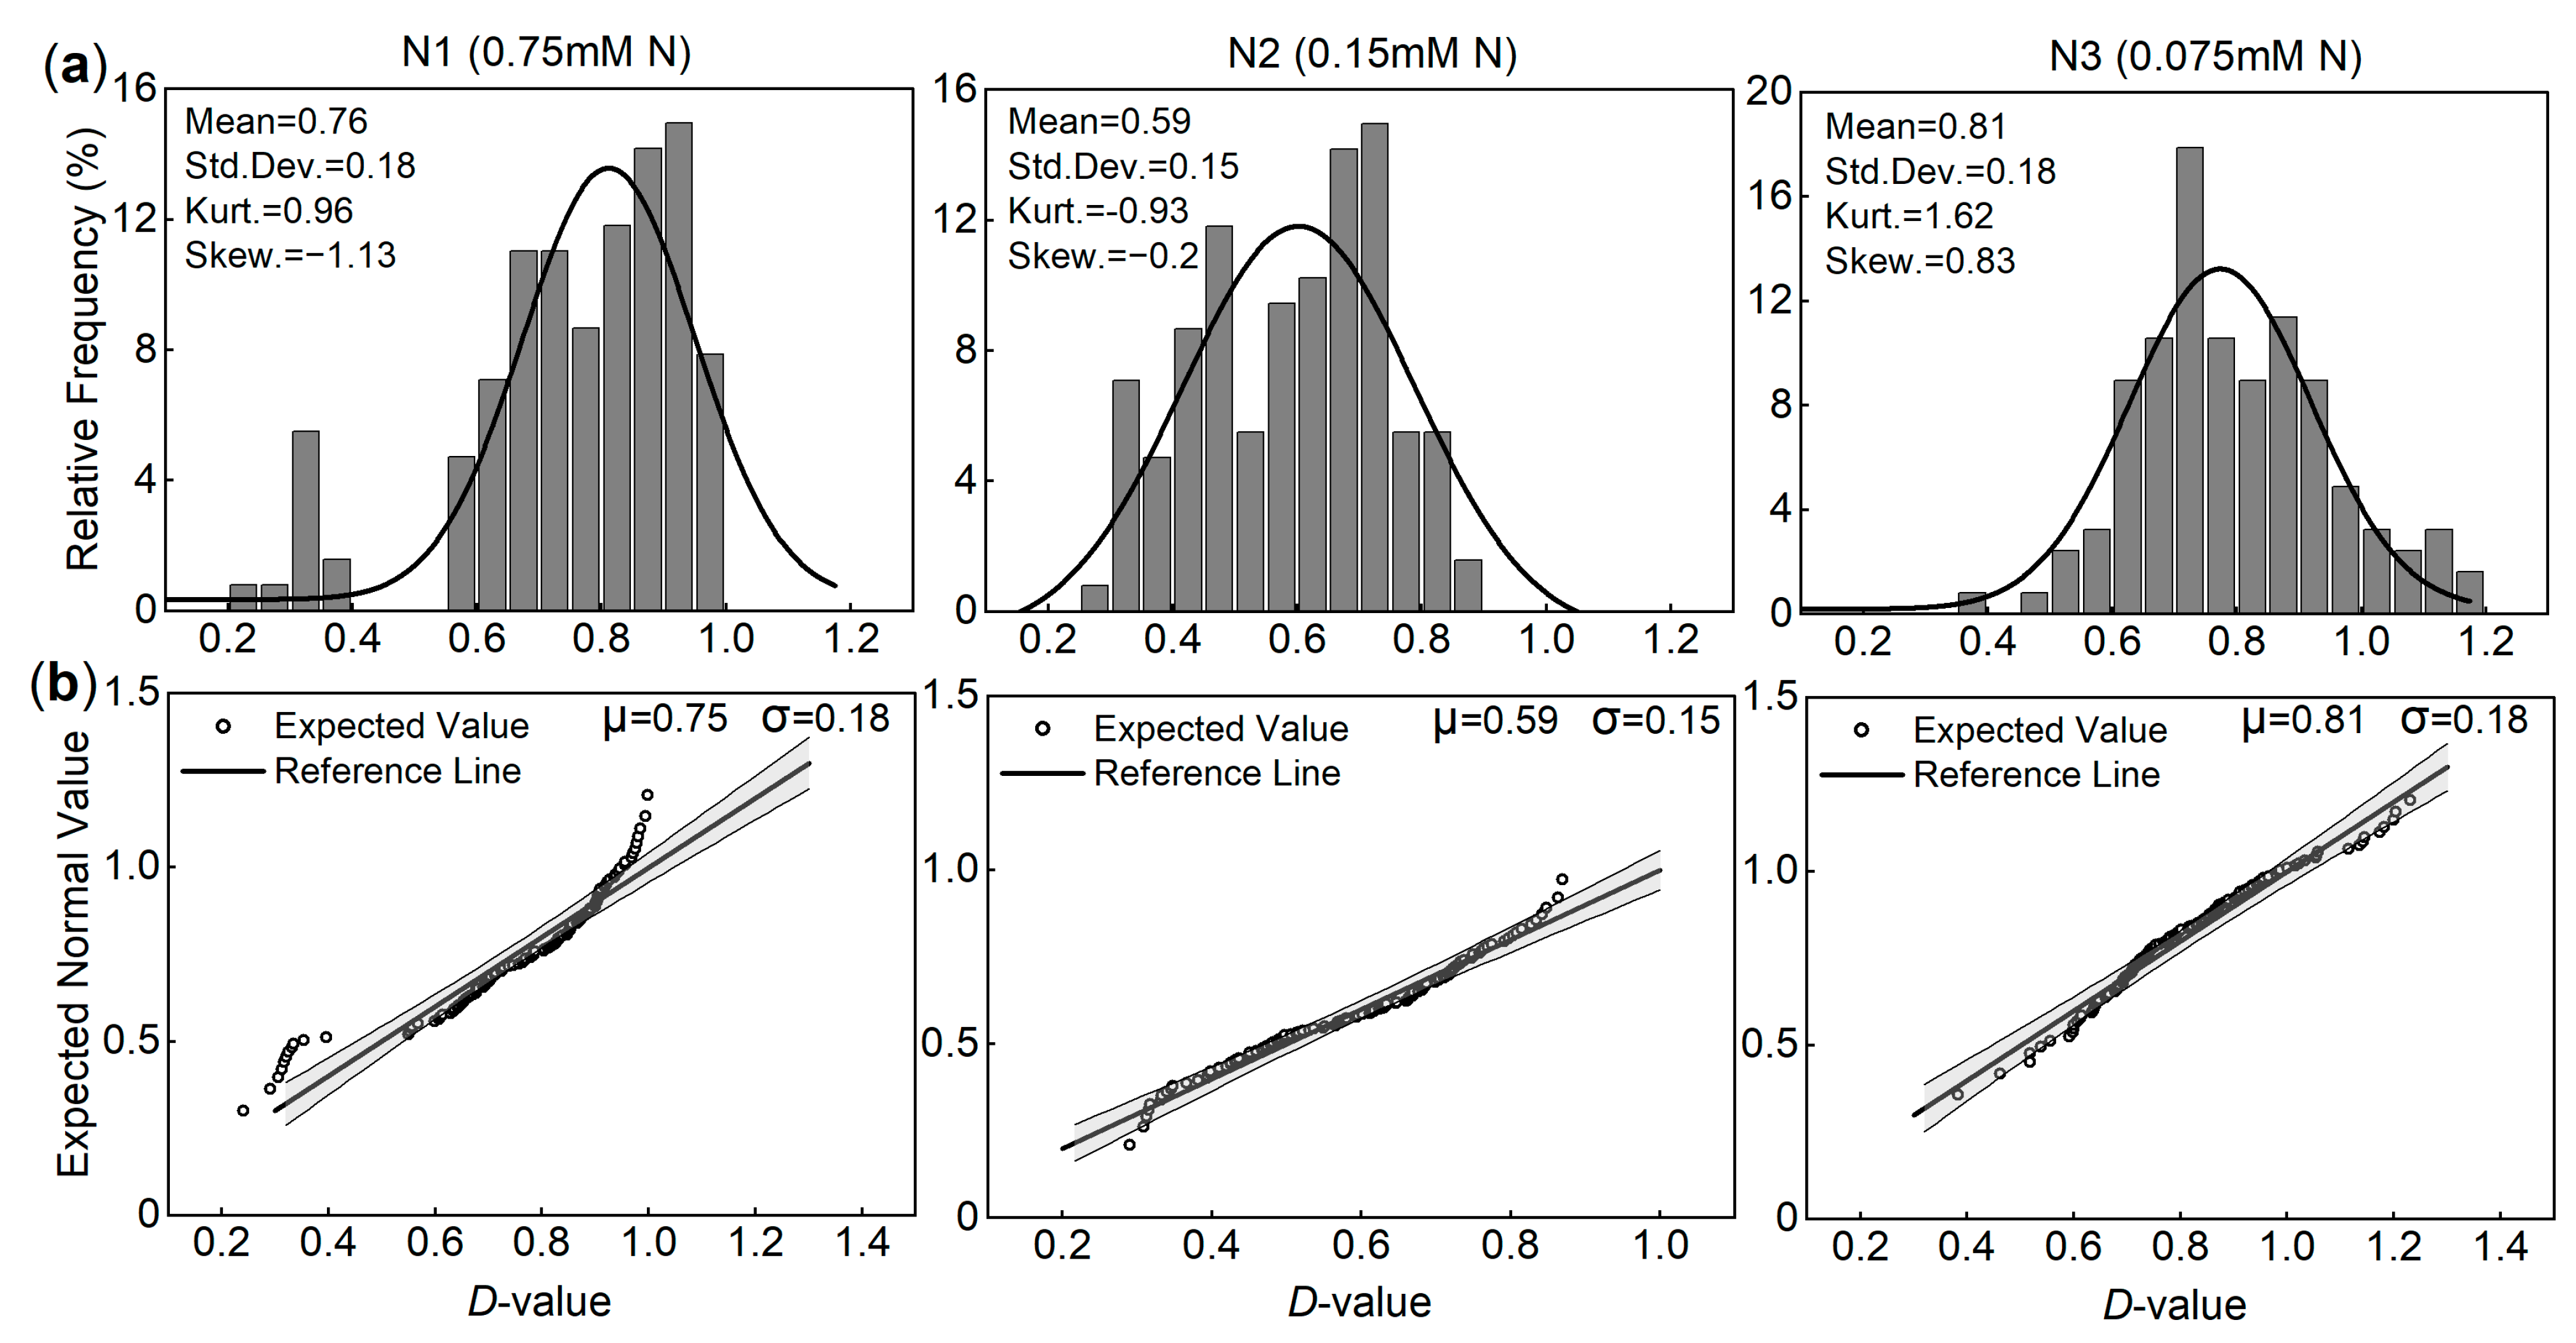
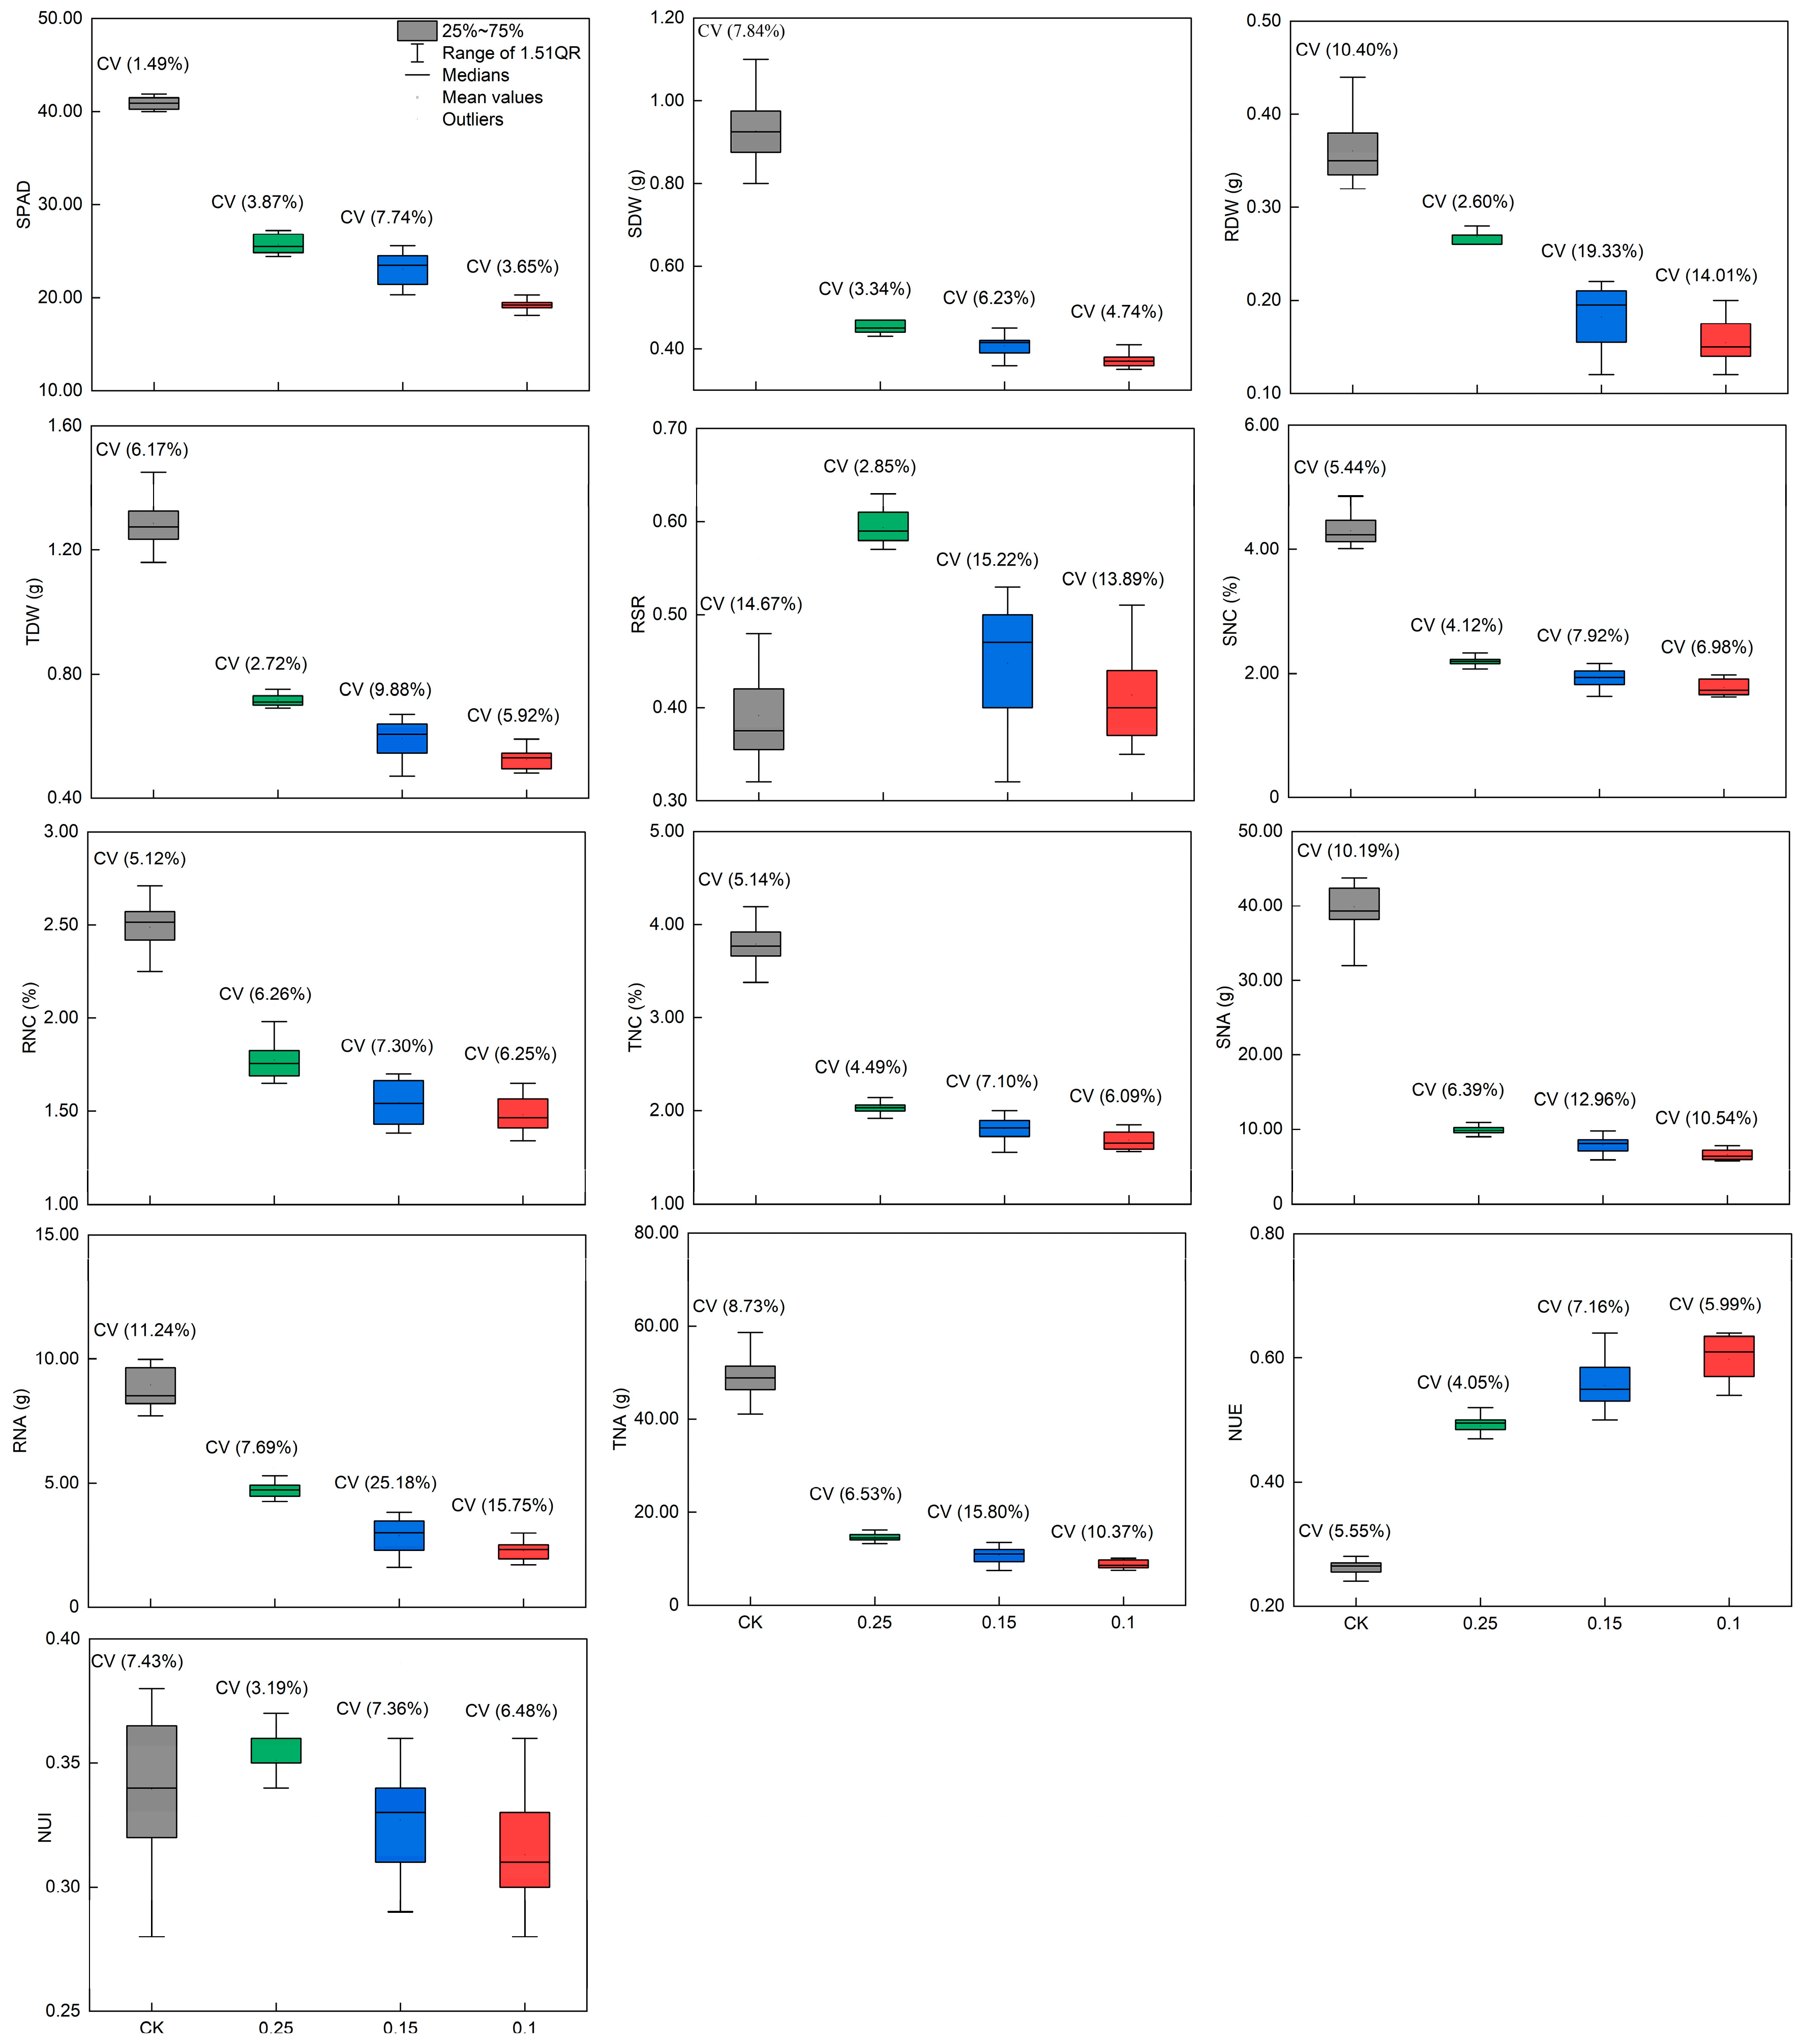
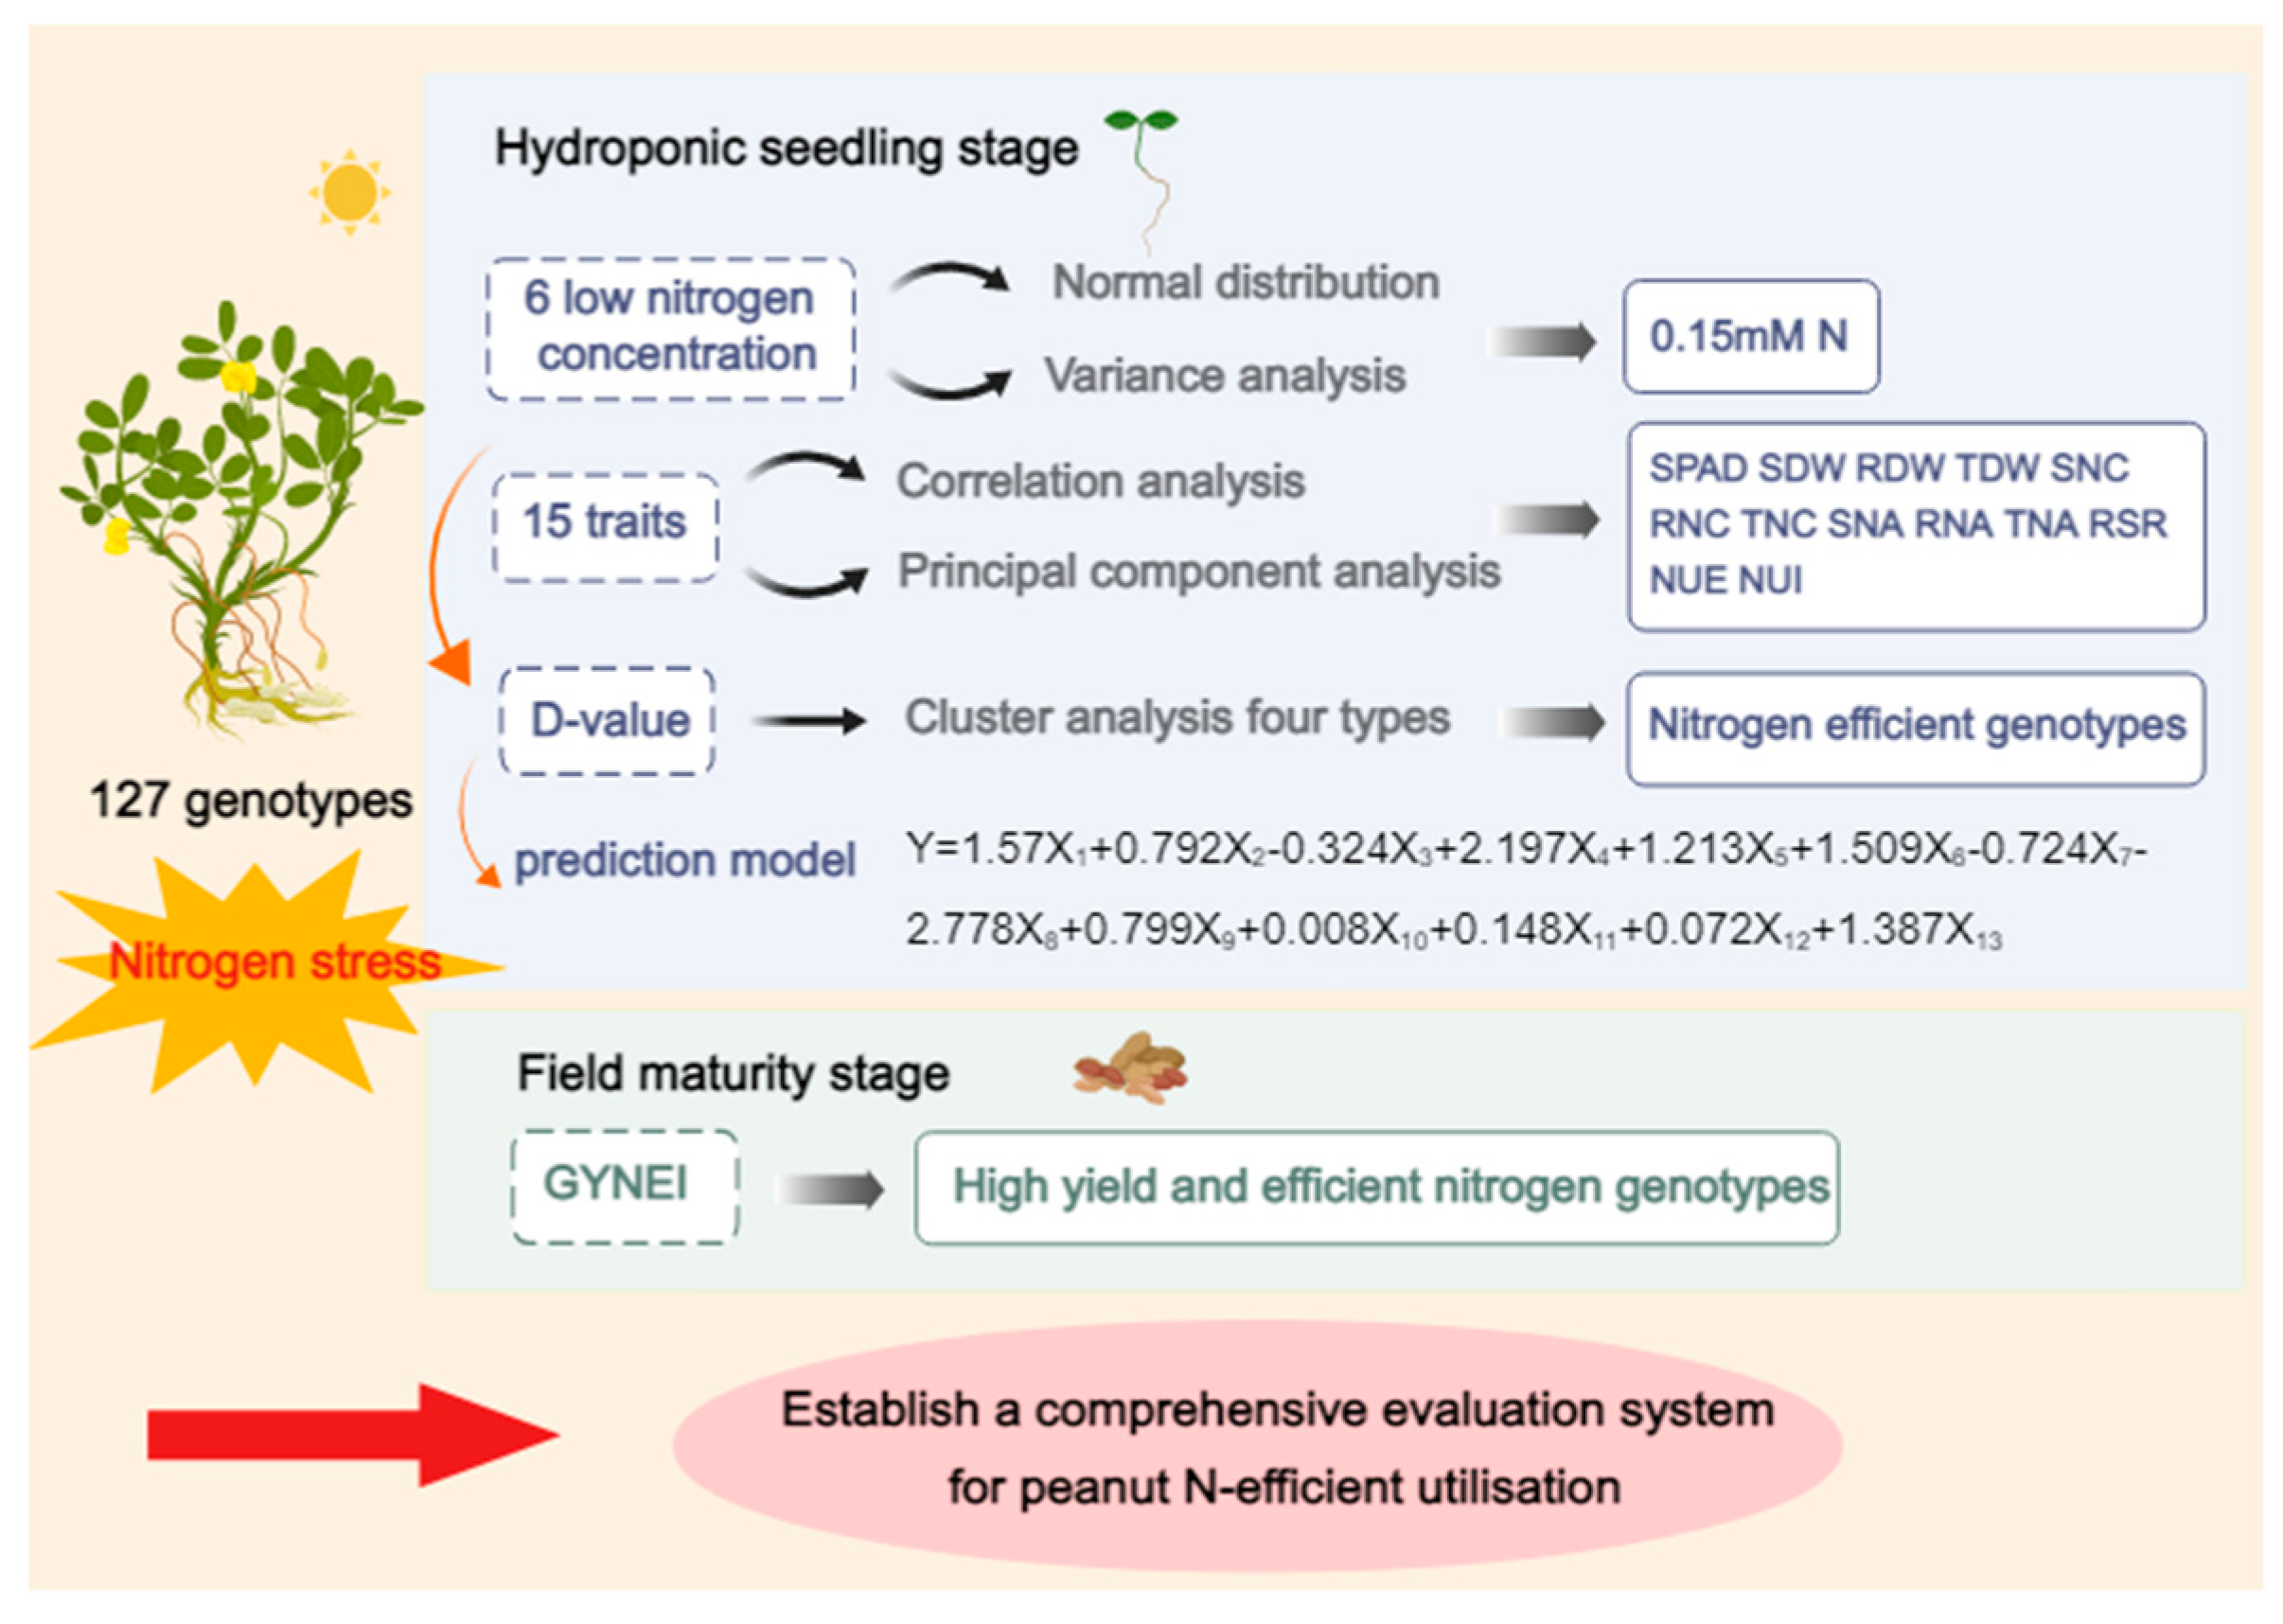
3.1.2. Determination of the N Concentration Indicative of Low-N Tolerance in Peanut Plants

Excessively high or excessively low N concentrations would affect the screening results. SPSS software (version 26.0) was used to statistically analyze the comprehensive membership function values of 127 peanut genotypes under different low-N treatments. The skewness of the normal test of the membership function under N1 and N2 was less than 0, and the overall deviation was to the right, whereas under N3, it was to the left. Further, in N1 and N3, the kurtosis of the membership function normal distribution test of all accessions was greater than 0 and showed a sharp peak, whereas under N2, the kurtosis was less than 0 and showed a flat peak. In both skewness and kurtosis, the value of N2 was the closest to 0. QQ-Plot indicated that μ was 0.59, closest to 0, and the average was distributed more centrally, and σ was 0.15, with a more concentrated distribution, which was the most consistent with a normal distribution (Figure 1). Therefore, N2 (0.15 mmol N) was identified as the low-N concentration for preliminary screening in peanut seedlings.

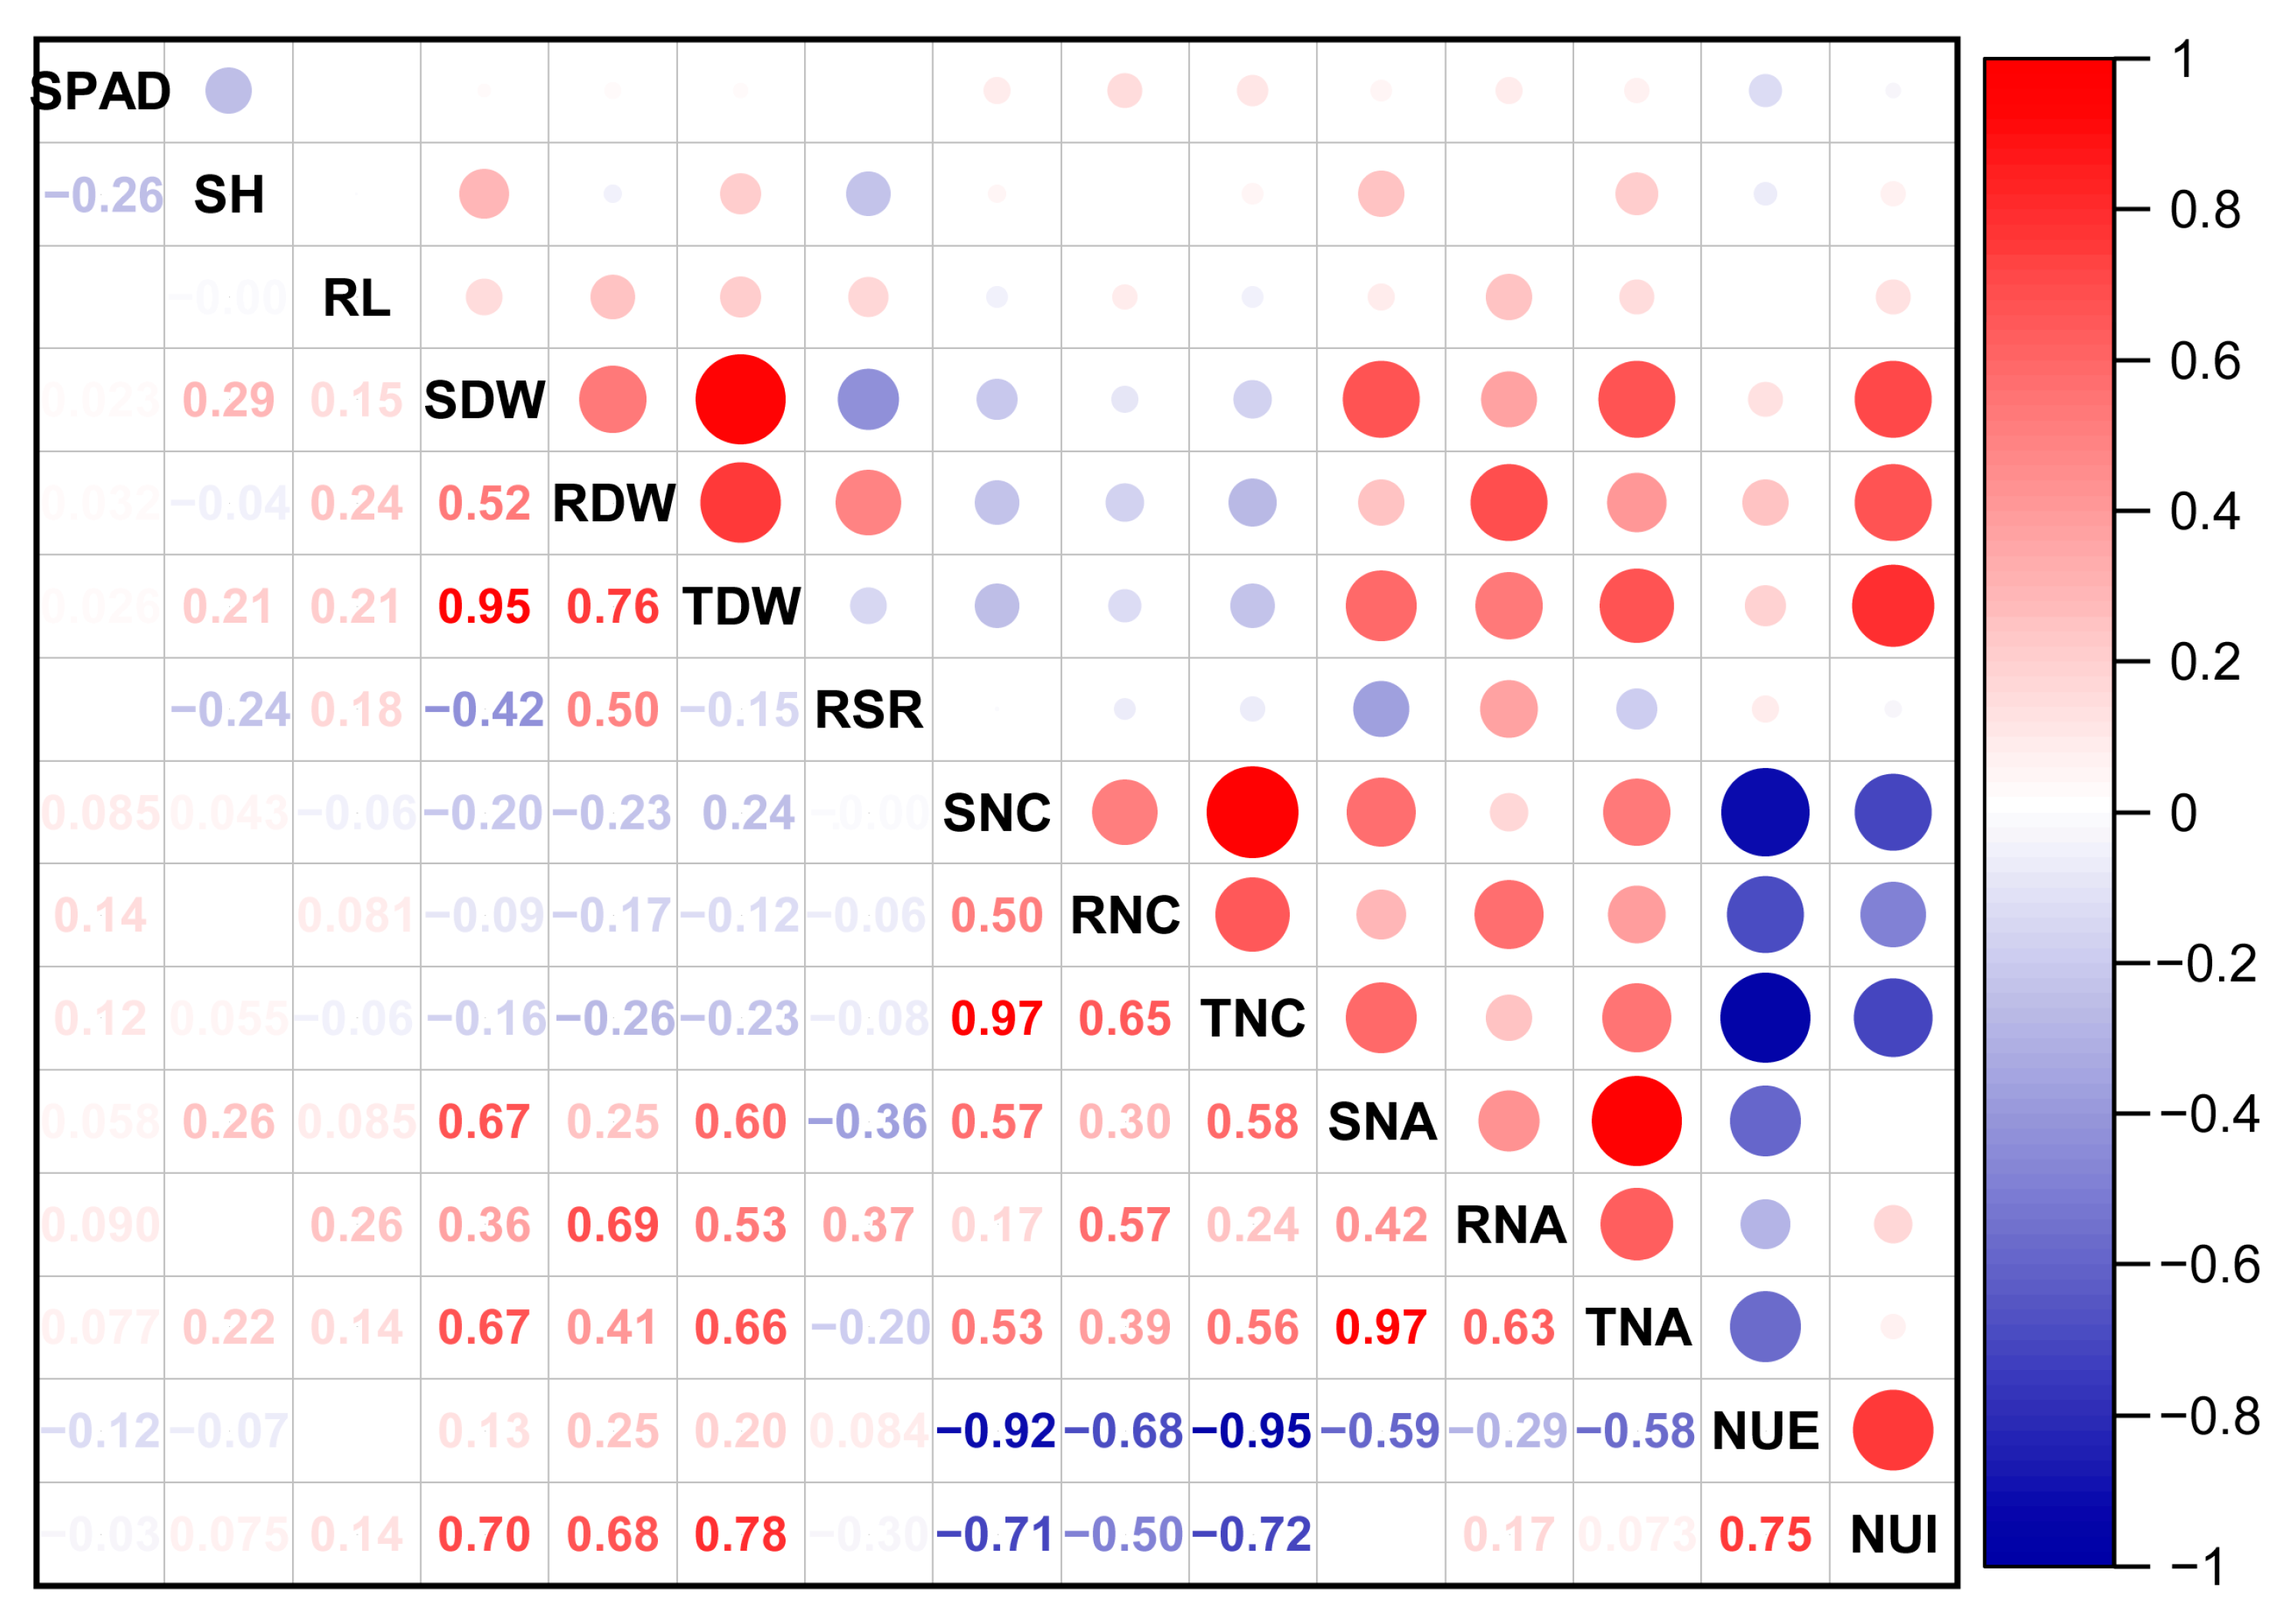
3.1.3. Pearson’s Correlation Analysis and PCA Analysis among Traits of the Peanut Germplasm

To identify the indices and correlations among them, a correlation analysis of the measured 15 seedling indicators was conducted (Figure 2). At the N2 level, there were clear correlations among all traits at the seedling stage. Specifically, there was a significant positive correlation between SNC and TNC (r = 0.97), SNA and TNA (r = 0.97), or SDW and TDW (r = 0.95), indicating that the shoot growth had a greater influence on the whole plant. In addition, NUE was highly and negatively correlated with TNC (r = −0.95) and SNC (r = −0.92), indicating that an increased N content may reduce N efficiency to some extent. Additionally, there was a significant positive correlation between NUI and TDW (r = 0.78), while NUE was positively correlated with NUI (r = 0.75). Therefore, there may be information overlap among the different indicators, and comprehensive variable indicators are more effective for evaluating and screening N efficiency of germplasm resources. However, the correlations between SPAD, SH, RL, and other indicators revealed that they might play little part in the evaluation of N efficiency, which needed to be further analyzed by calculating the contribution.
In order to eliminate redundant indices, principal component analysis (PCA) and eigenvalue decomposition (EVD) were carried out on the above indicators (Table 1). The overall contribution rate of the first four principal components was 83.529%, which fully represents most of the information on the original factor. The first principal component contributed the most (32.202%), and the most important traits were TNC (0.978), SNC (0.938), and RNC (0.745), which mainly expressed information on N content traits. The contribution rate of the second principal component was 27.379%, and the most important character indices were SDW (0.971), TDW (0.918), SNA (0.795), and TNA (0.794). The contribution rate of the third principal component was 15.342%, and the most important traits were RSR (0.812), RDW (0.774), and RNA (0.764). These two components mainly provided information on dry weight and N accumulation. The last principal component was 8.606%, mainly reflecting the information of SPAD (0.846), which provided relevant information on seedling etiolation. The results of the correlation and PCA indicated that SPAD, dry weight, RSR, N content, N accumulation, NUE, and NUI might be used as the main indicators for N efficiency at the seedling stage.

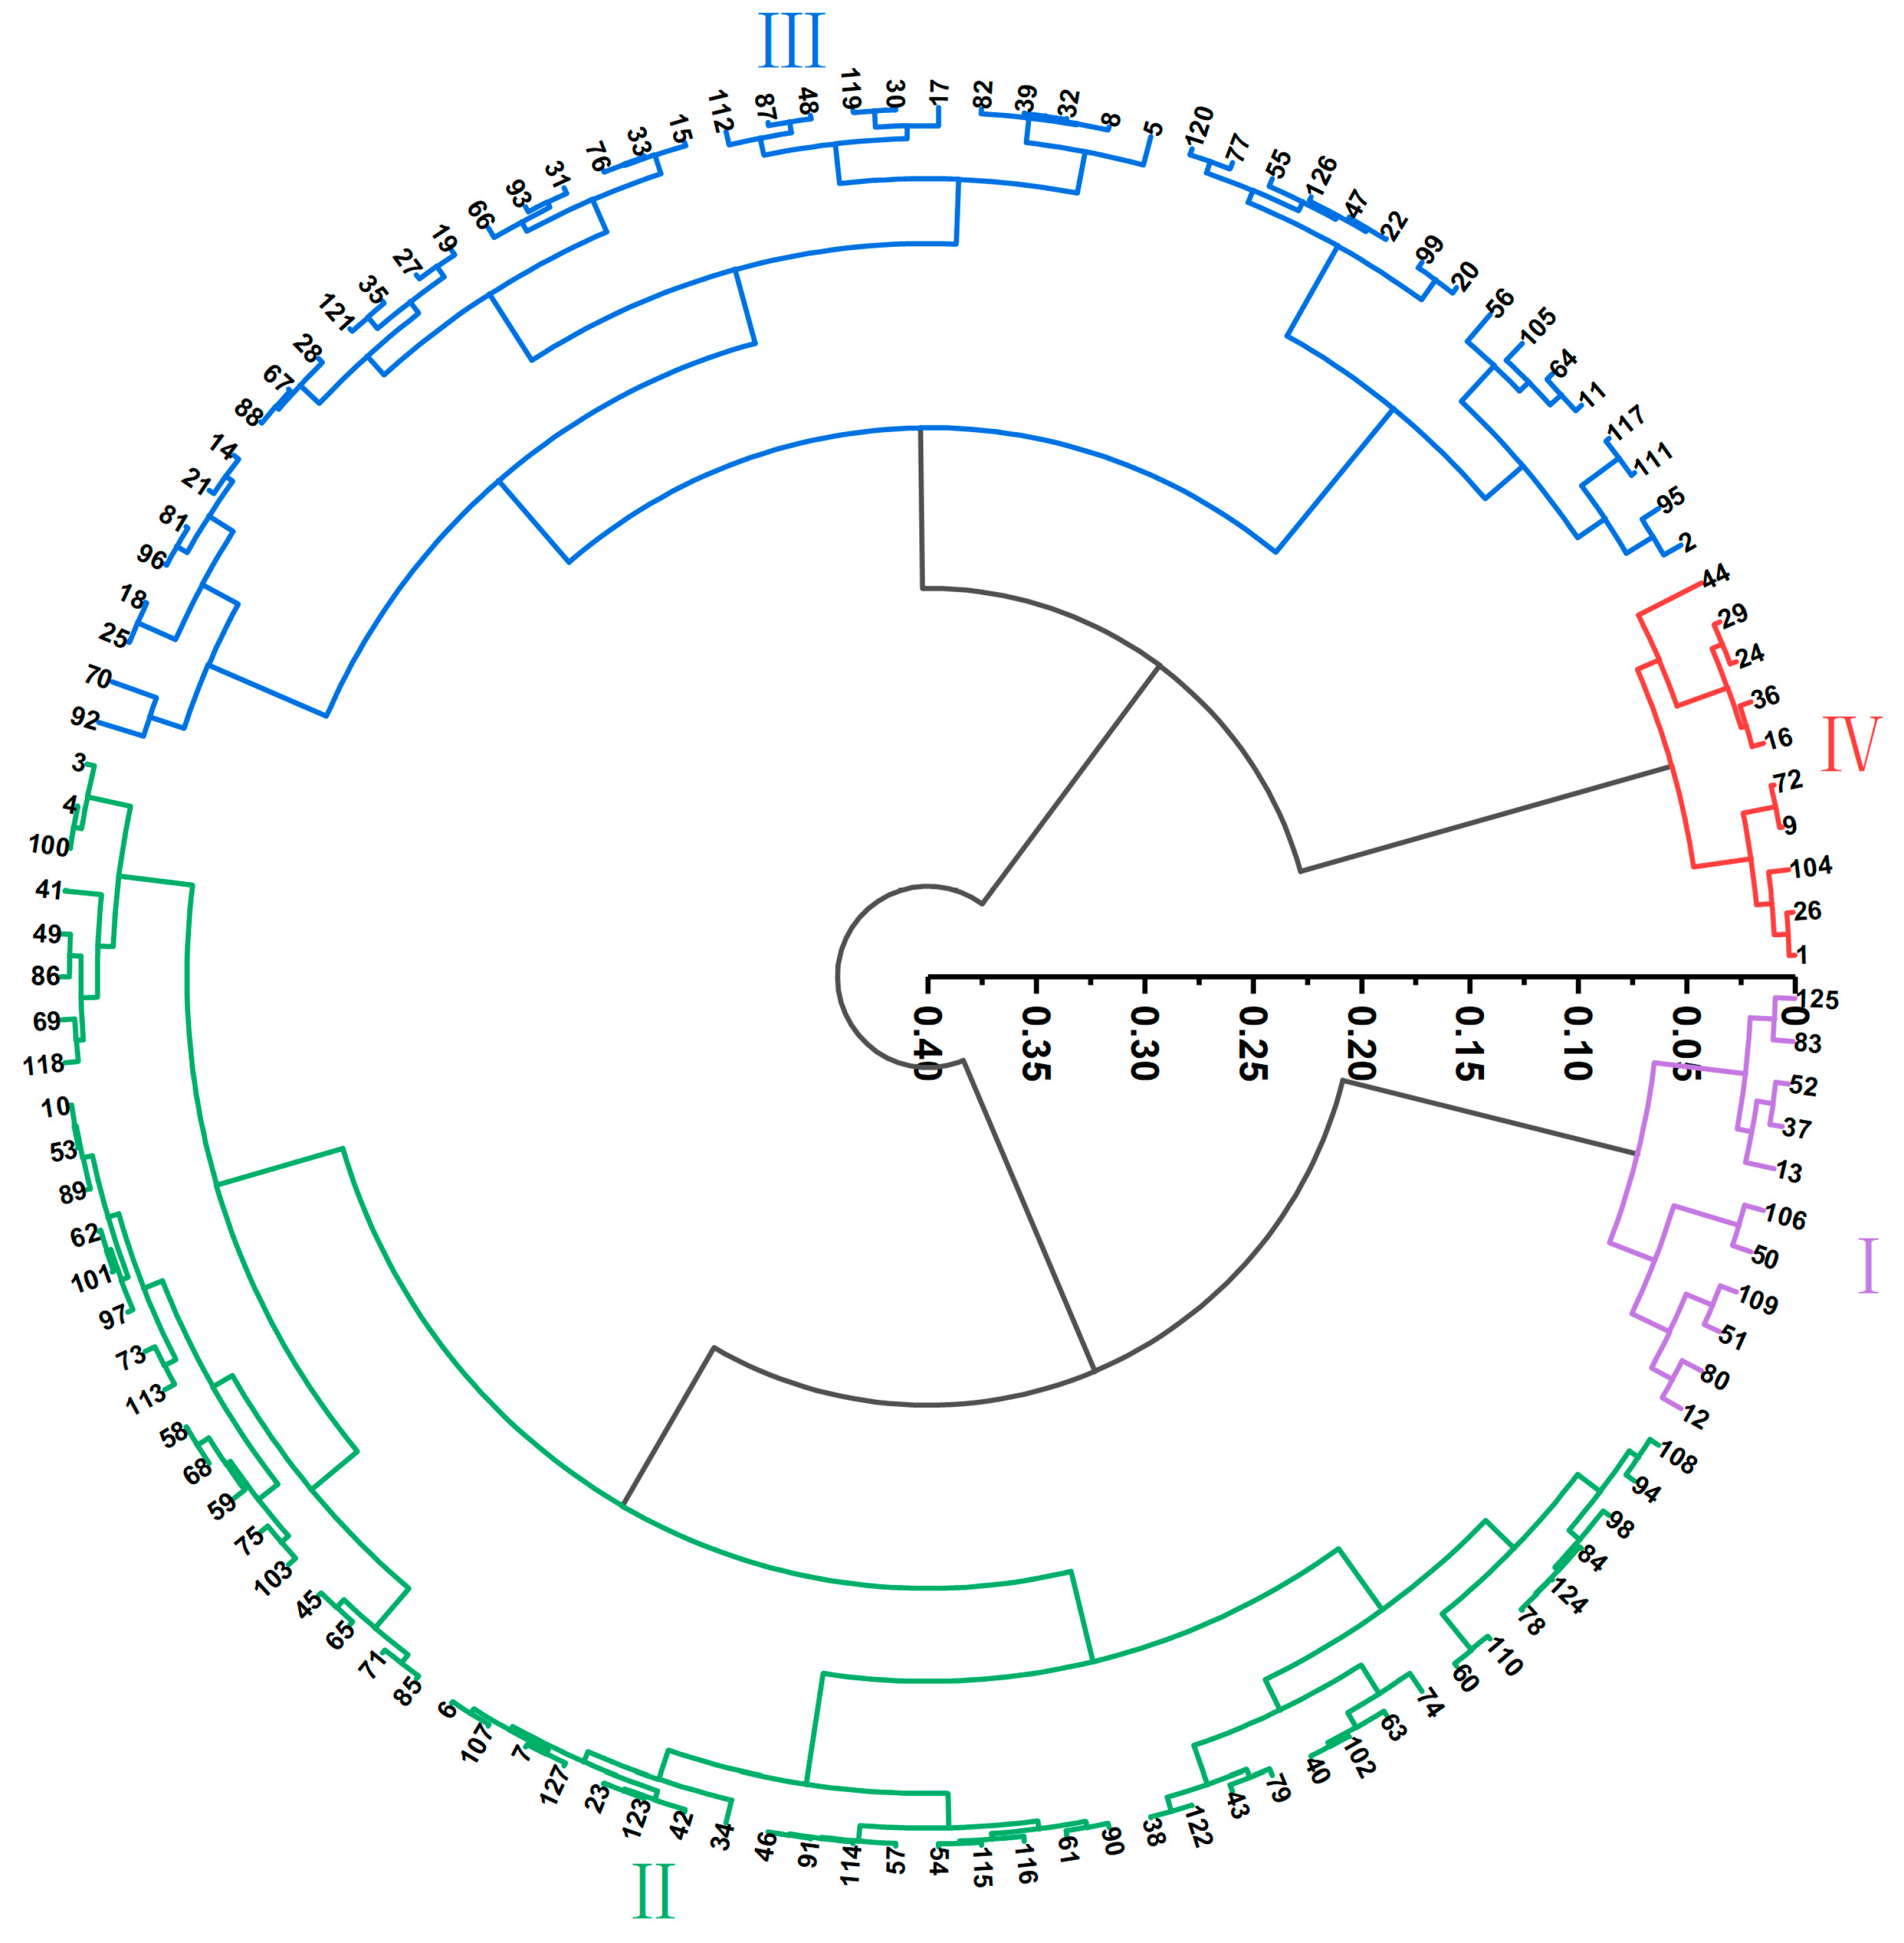
3.1.4. Cluster Analysis of the N Efficiency of the Peanut Materials

To combine multiple indicators and classify the N efficiency in different peanut genotypes, 127 peanut accessions were systematically clustered under N2 treatment (Figure 3). We found that the N efficiency types of 127 peanut materials could be divided into 4 categories: extremely N-efficient genotypes (I), highly N-efficient genotypes (II), highly N-inefficient genotypes (III), and extremely N-inefficient genotypes (IV). According to the comprehensive scores of standardized data on the indicators, N-efficient materials included 11 genotypes of I, such as Jinhua 15 and Yuhua 91, and 58 genotypes of II, such as Tiehua 20 and Nonghua 11; N-inefficient materials included 10 genotypes of III, such as Huayu 20 and Huayu 6309, and 48 genotypes of IV, such as Meilianhua 5 and Zhonghua 4, respectively.

3.2. Evaluation of N Efficiency in the Field

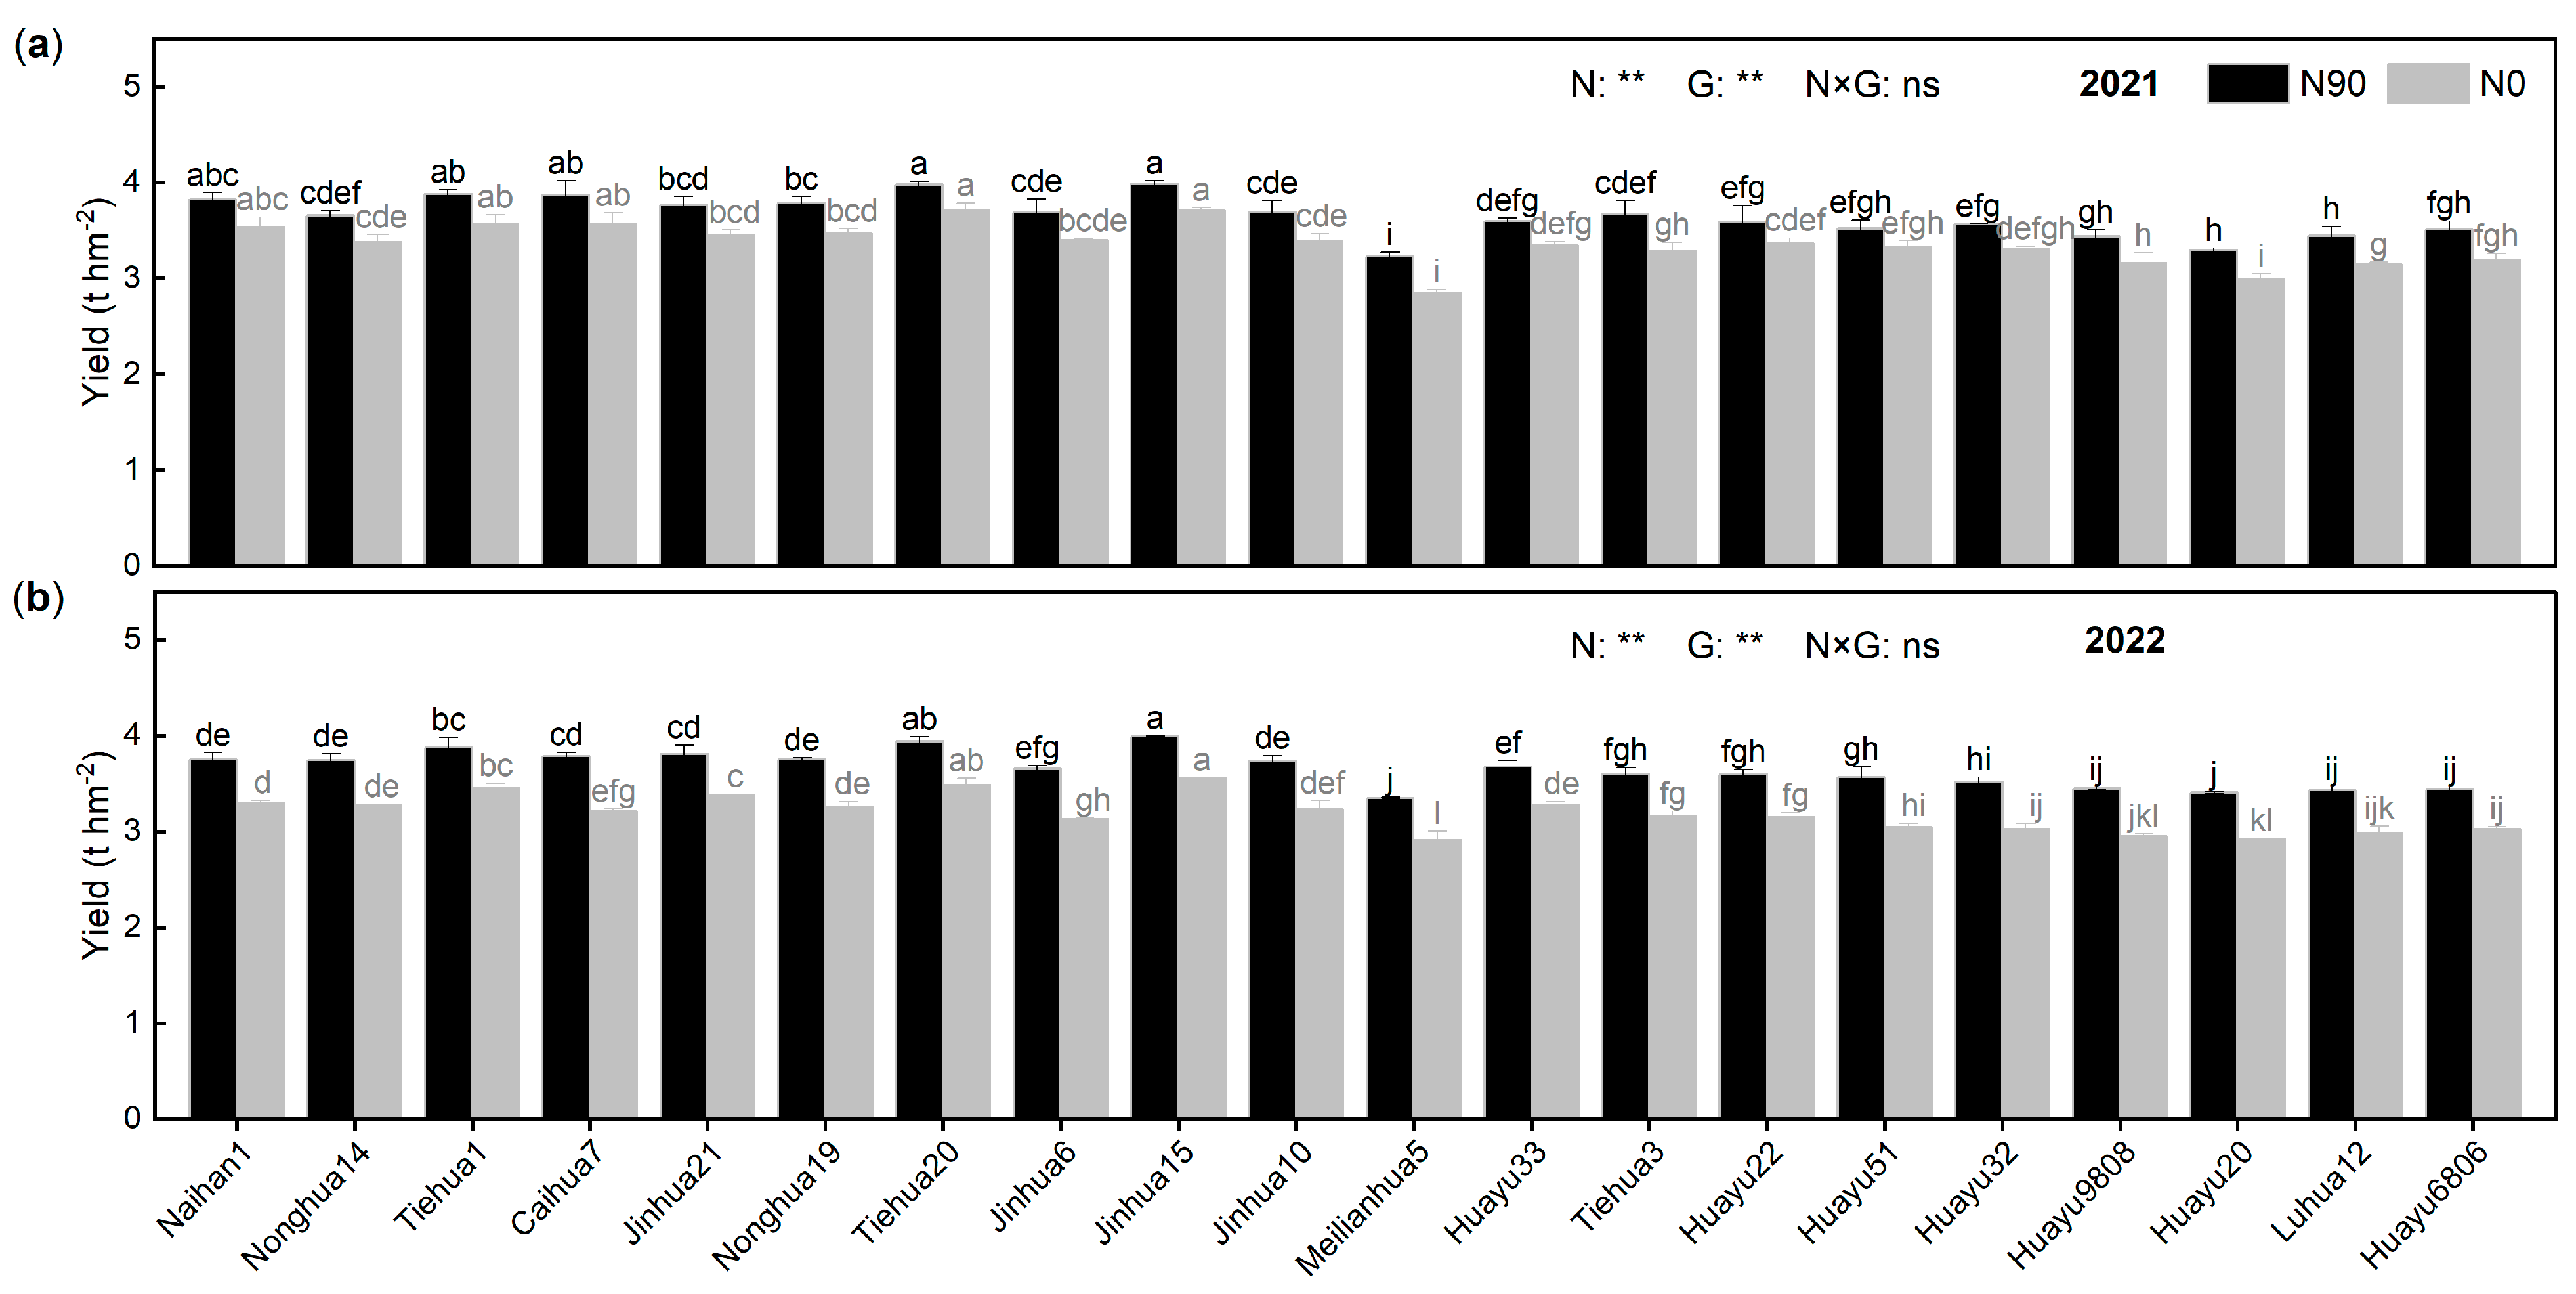
3.2.1. Response of Peanut Yield and Related Factors to N Stress

Figure 4 depicts the yield performance of 20 peanut genotypes in two years under normal nitrogen application (N90) and without N (N0) conditions. There were significant yield differences between N treatments and genotypes. Compared with N90, the average yield of 20 peanut genotypes under N0 applied was 3.36 t hm−2 in 2020–2021, a decrease of 8.04%, while the average yield in 2021–2022 was 3.19 t hm−2, a decrease of 12.83%, which was more noticeable (Figure 4). Over two years, Jinhua 15, Tiehua 20, Tiehua 1, and Naihan 1 showed a higher average yield (3.72–3.99 t hm−2), while Meilianhua 5, Huayu 9808, Huayu20, and Luhua 12 all had lower average yields (2.83–3.44 t hm−2). Jinhua 15, Huayu 33, and Tiehua 20 had the lowest average decrease (8.89–9.12%) under N0 within two years, indicating that it was less affected by N0, whereas Huayu 20, Tiehua 3, and Caihua 7 showed the biggest declines in production (11.46–11.86%), suggesting that N0 reduced the yields of these genotypes to a greater extent.
As regards yield-related factors, the coefficient of variation (CV) for pod number and full-pod number per plant increased by N0 compared to N90, with the largest CV for full-pod number per plant (15.98, 28.83%), yet it had little impact on 100 pod weight or 100 kernel weight, and consistent patterns were found in both years, which illustrated that a major factor contributing to the reduction in yield was a decrease in the pod number under N0 treatment (Table 2).

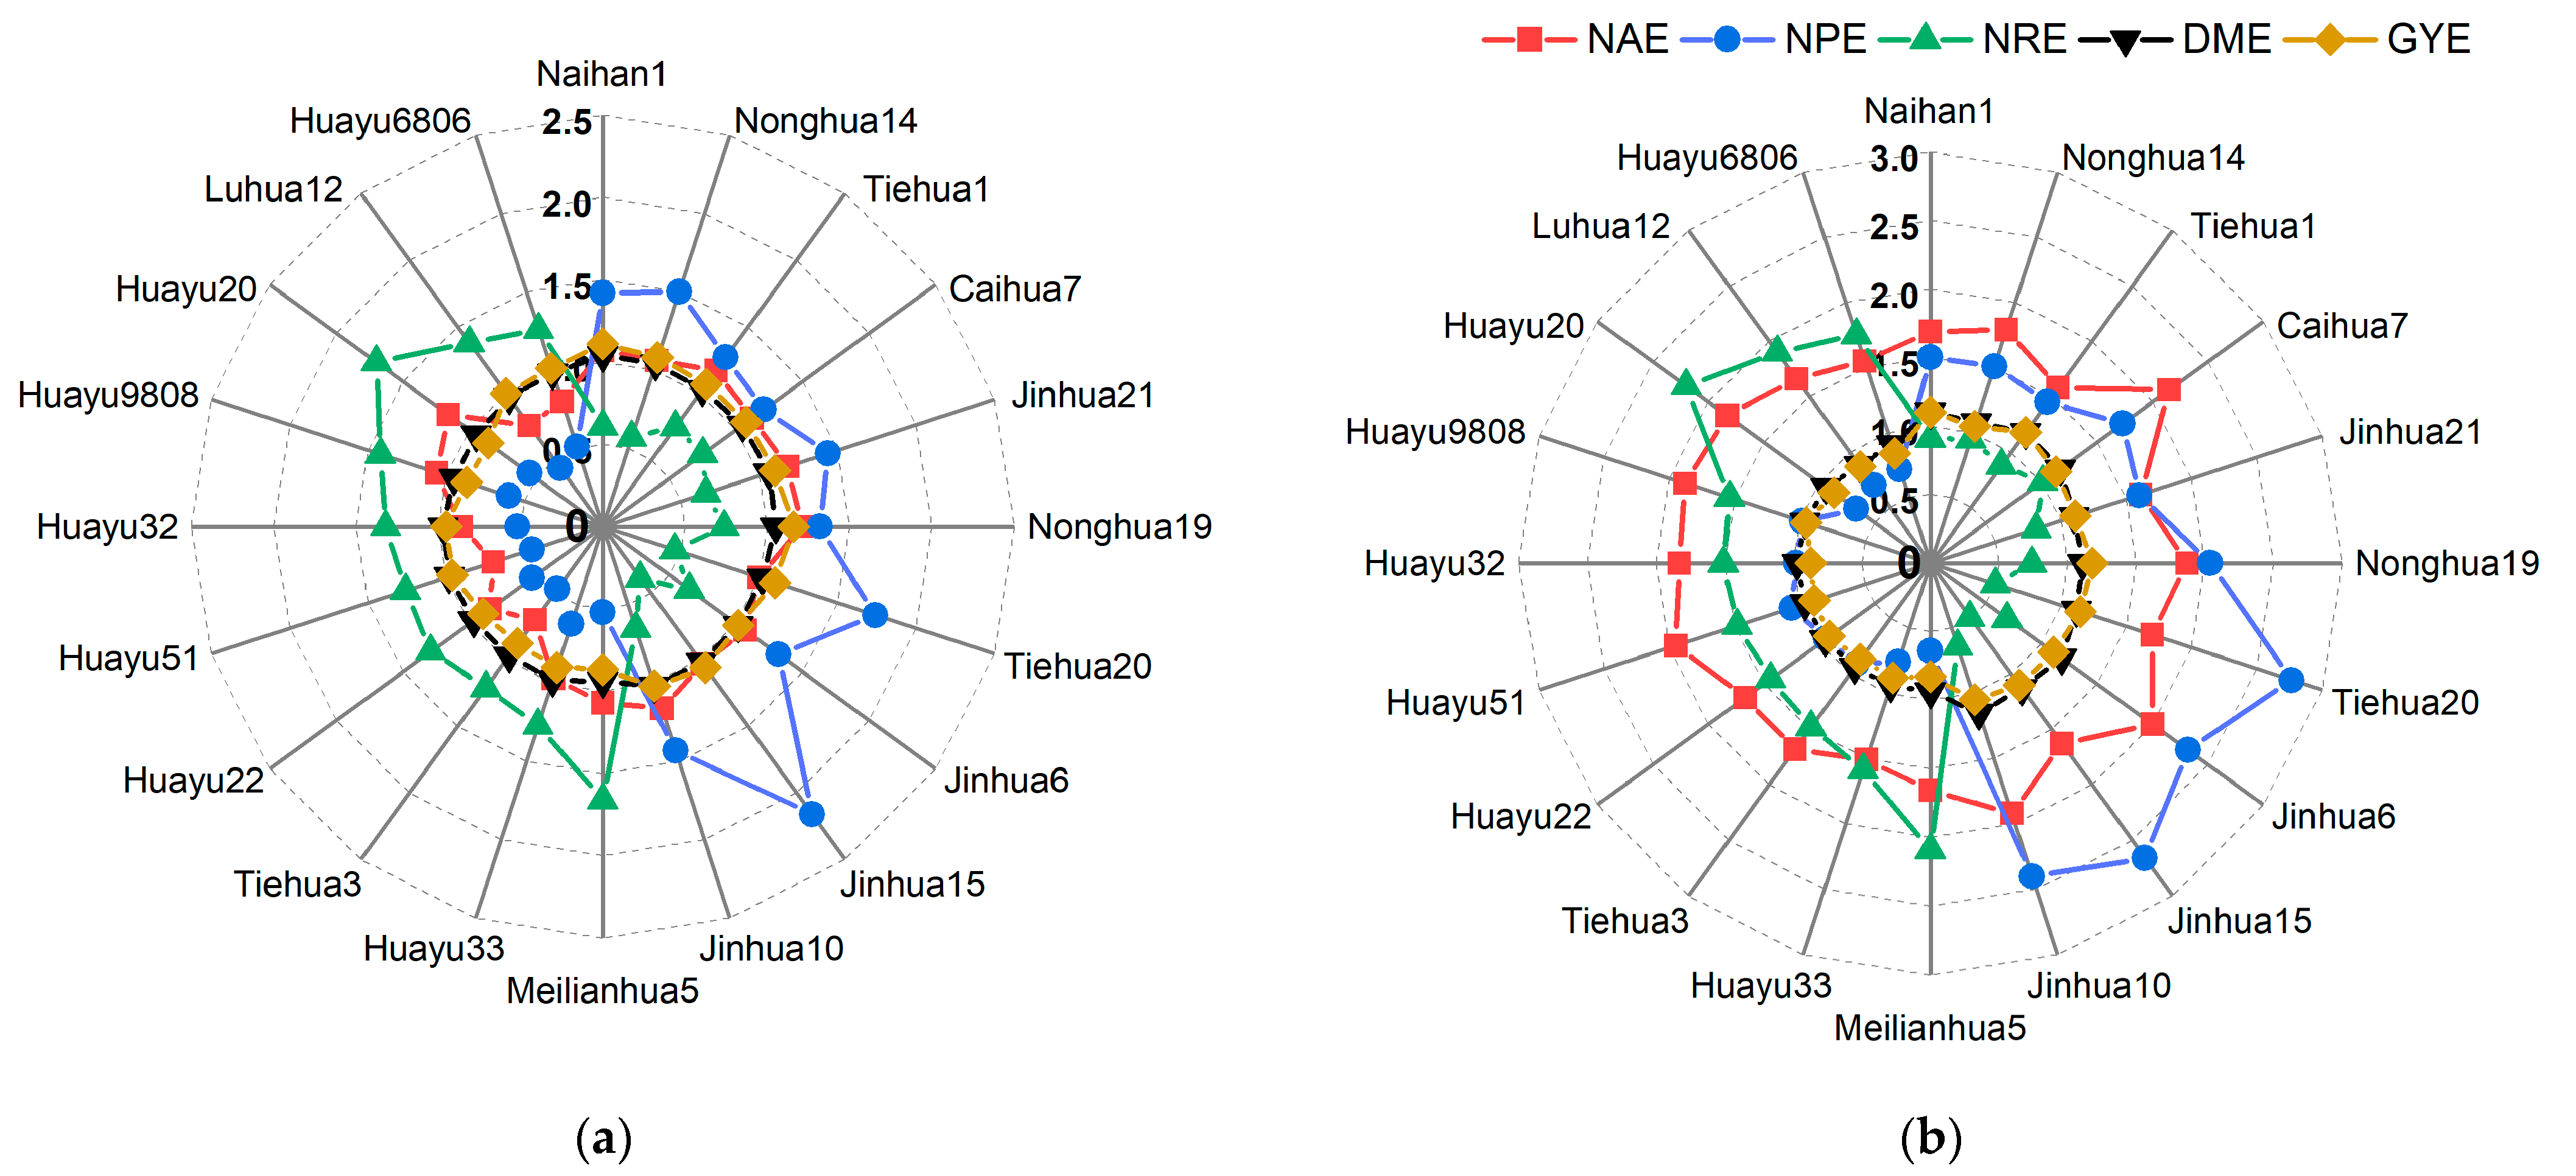
3.2.2. Response of Peanut N Efficiency to N Stress

Various N-efficiency indicators represent different aspects of absorption and utilization. Five indices, including NAE, NPE, NRE, DME, and GYE, were used for a comprehensive evaluation of N efficiency in different genotypes in the field. Due to the wide range of values between these N efficiencies, in this content, the ratios were calculated for each peanut genotype N efficiency to the mean group to compare the variances among varieties. Interspecific variations for N efficiency in 2022 were greater than in 2021 (Figure 5). However, the indices were expressed variably in efficient or inefficient materials. In two years, the NAE ratios ranged from 0.70 to 1.21 and 1.51 to 2.15, respectively, with higher values for Caihua 7 (1.12, 2.15) and Jinhua 10 (1.16, 1.92); the NPE ratios ranged from 0.44 to 2.16 and 0.64 to 2.77, and higher values were found in Jinhua 15 (2.16, 2.66) and Tiehua 20 (1.74, 2.77). This applied to other efficiencies as well; NRE had higher ratios for Huayu 20 (1.70, 2.20) and Meilianhua 5 (1.66, 2.09); DME for Tiehua 1 (1.03, 1.18) and Caihua 7 (1.05, 1.17); and GYE for Nonghua 19 (1.16,1.18) and Tiehua 20 (1.10, 1.15). Consequently, it was hard to comprehensively evaluate the N efficiency with a single indicator, thus rendering the comprehensive nitrogen efficiency index essential.

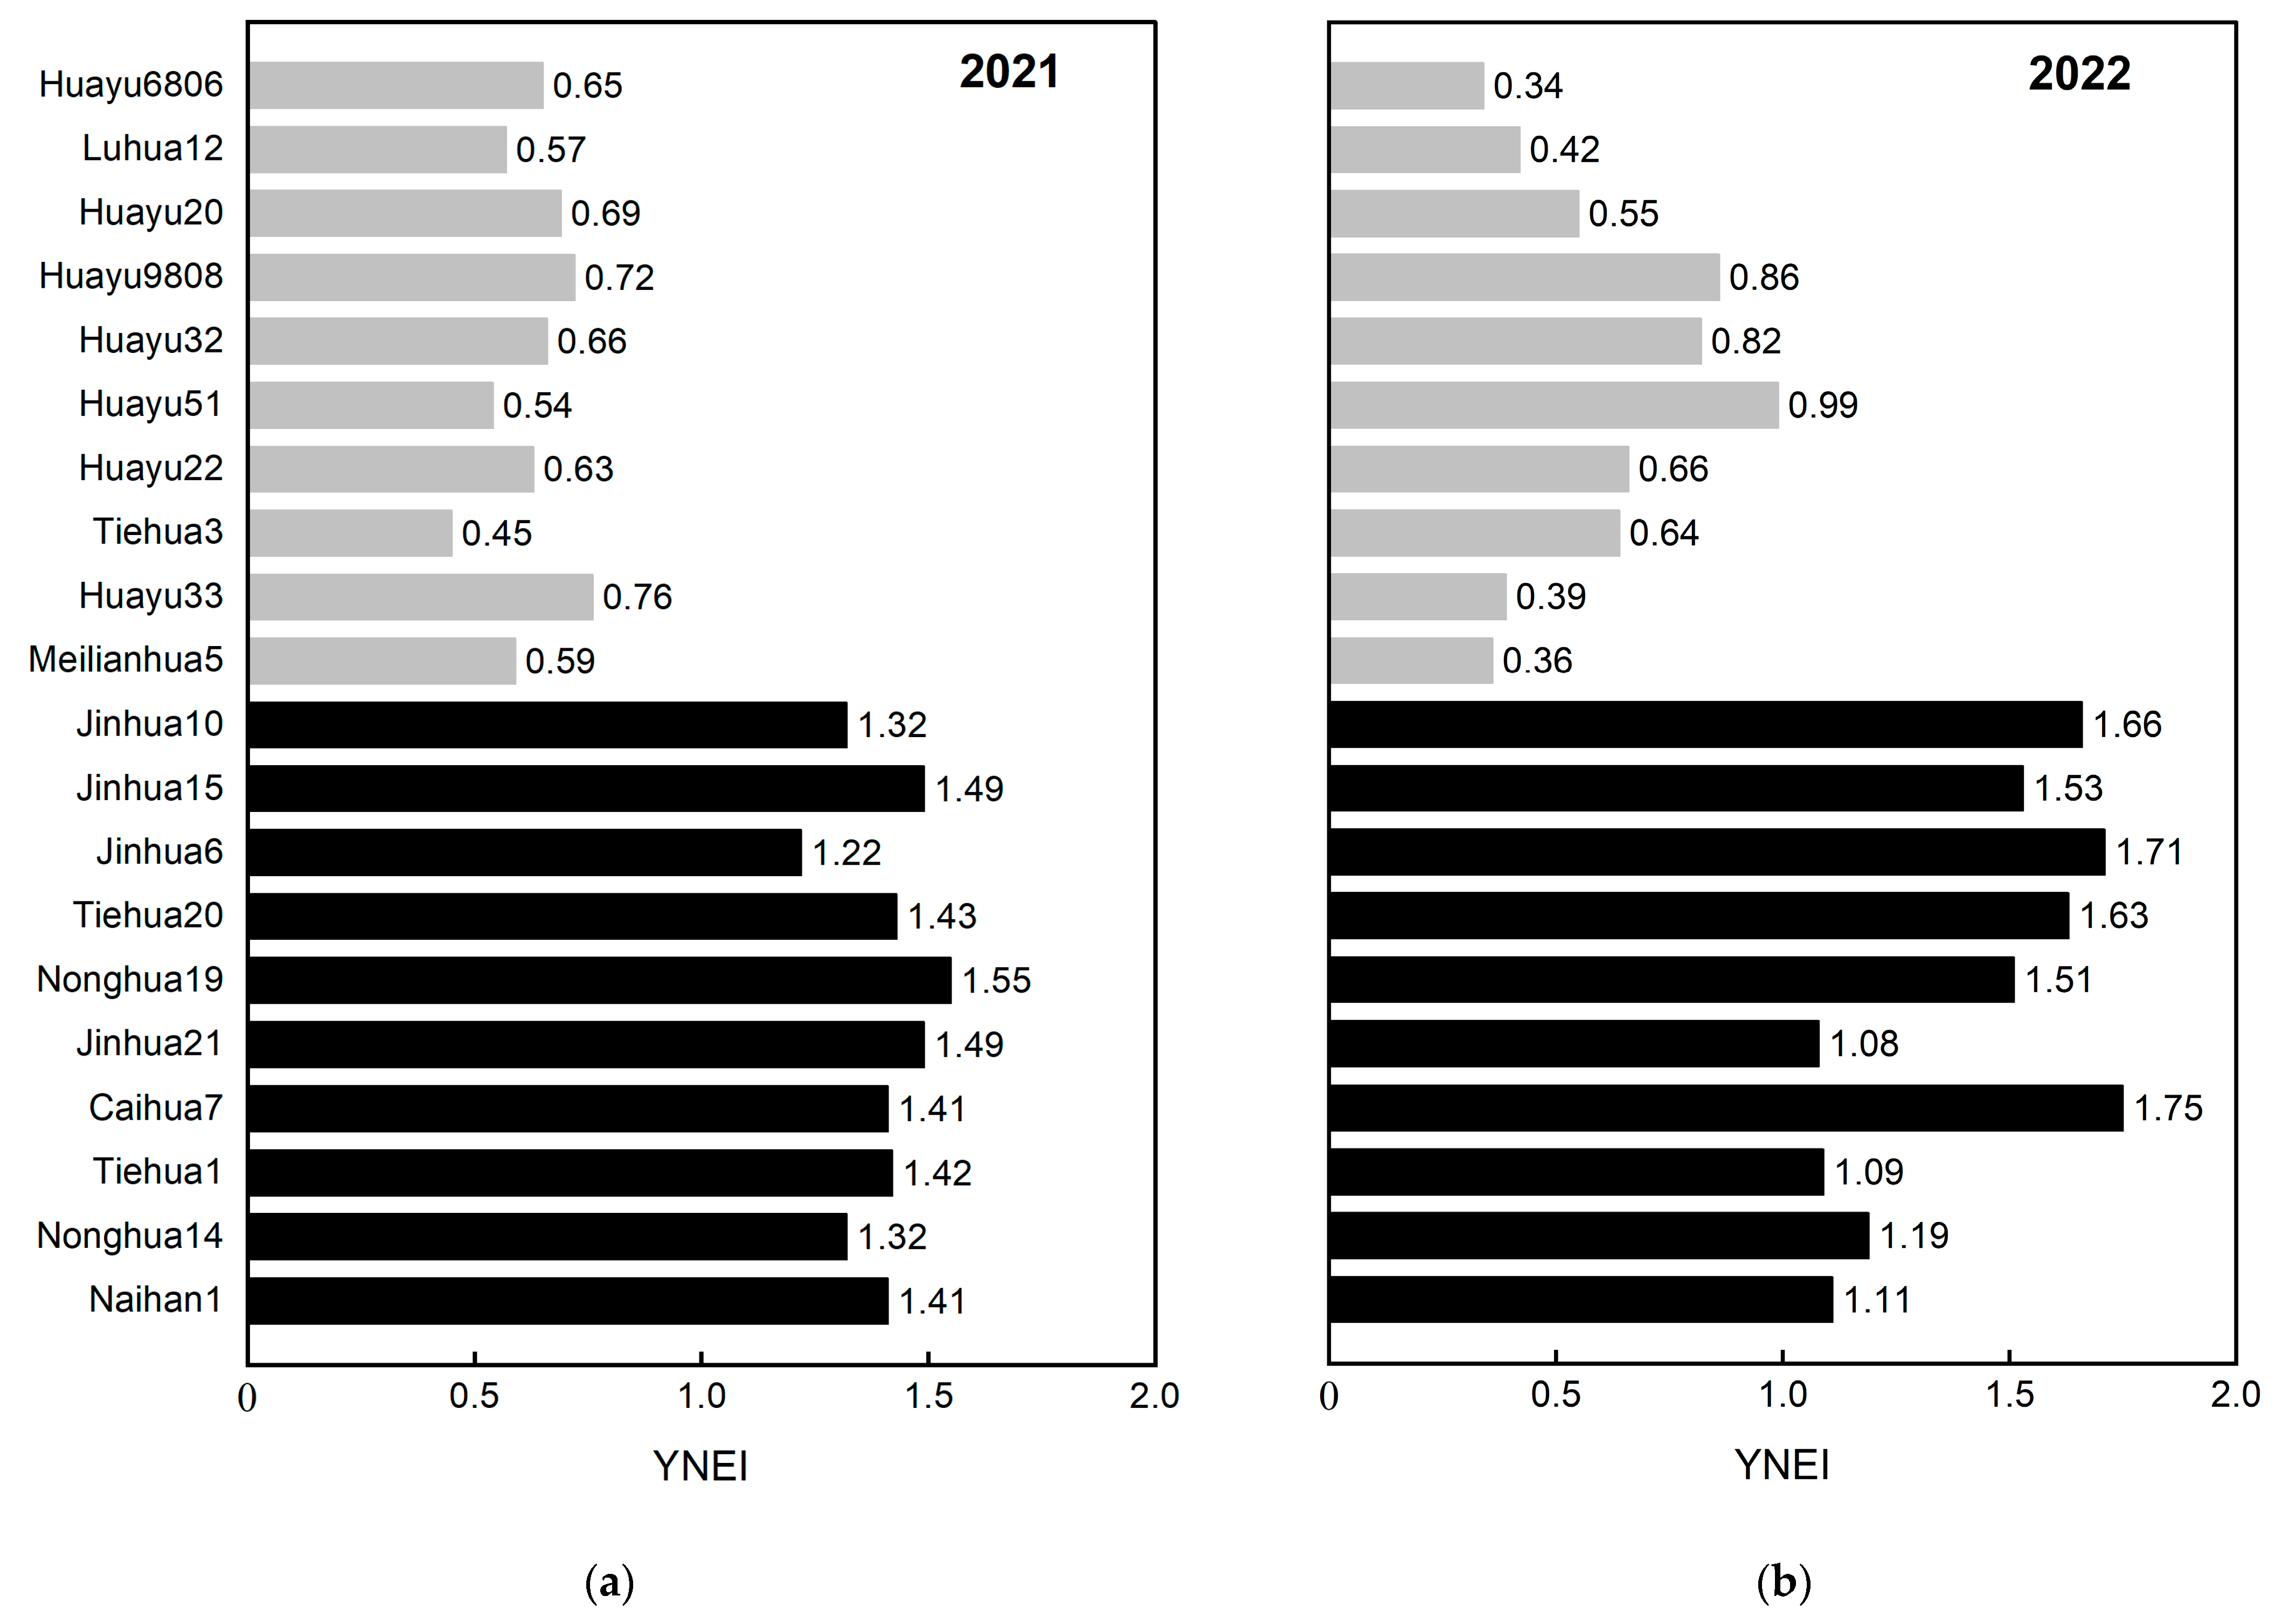
3.2.3. Screening for N-Efficient Genotypes in the Field

To combine the yield and N efficiency, N-efficient peanut genotypes were screened using the yield nitrogen efficiency index (YNEI) in the field (Figure 6). YNEI values of 20 peanut genotypes in 2021 ranged from 0.45 to 1.49; Jinhua 15 and Jinhua 21 performed better (1.49), and Tiehua 9 (0.45) and Huayu 51 (0.54) were worse, while in 2022, the range of change was 0.36–1.75, with higher values in Caihua 7 (1.75) and Jinhua 6 (1.71) and lower values for Huayu 6806 (0.34) and Meilianhua 5 (0.36). Each peanut genotype was ranked differently between the two years. using the reference value of 1. Genotypes with a value above 1 were classified into N-efficient genotypes, and genotypes with a value less than 1 were identified as N-inefficient genotypes. Over the two years, 20 peanut genotypes performed uniformly for N efficiency, and 10 genotypes, such as Naihan 1 and Nonghua 14, were finally defined as N-efficient genotypes. The other 10 genotypes, which included Meilianhua 5 and Huayu 33, were identified as N-inefficient genotypes in the field.

3.3. Identification of N Efficiency in Peanuts

3.3.1. Characterization of N-Efficient Peanut Seedlings

To determine the most appropriate concentration and clarify N adaptation, the screening period was adjusted to 24 days, and 13 seedling characteristics were measured based on previous studies. N stress increased NUE, NUI, and RSR, whereas other indices declined to a varying extent, as shown by lower dry weight, N content and N accumulation, and higher N utilization. Different peanut genotypes under three low-N concentrations of 0.25, 0.15, and 0.1 mM N performed variously, of which all the traits had the largest CV (6.23–25.18%) at 0.15 mM. Meanwhile, peanut varieties were relatively scattered at this concentration. Therefore, 0.15 mM N was identified as the optimum concentration for screening in the peanut seedlings (Figure 7).
To integrate 13 seedling traits in peanuts, we used the D value as a dependent variable and the low-N stress coefficient (NC) of each trait as an independent variable to establish the regression equation for predicting low-N tolerance in peanut seedlings. The optimal regression equation is as follows: Y = 1.57X1 + 0.792X2 − 0.324X3 + 2.197X4 + 1.213X5 + 1.509X6 − 0.724X7 − 2.778X8 + 0.799X9 + 0.008X10 + 0.148X11 + 0.072X12 + 1.387X13, where X1–X7 represent SPAD, SDW, RDW, TDW, SNC, RNC, TNC, SNA, RNA, TNA, RSR, NUE, and NUI, respectively. The comprehensive evaluation value of 20 peanut genotypes at the seedling stage was calculated by substituting the NC of each trait into the regression mathematical model. Thus, 10 genotypes with a value greater than 1 were classified as N-efficient genotypes, and those with a value less than 1 were classified as N-inefficient genotypes at the seedling stage.

3.3.2. Complementary Validation of N Efficiency for Peanut Genotypes in Different Conditions

In order to verify the consistency of N adaptation in peanut genotypes under different conditions, comprehensive values of 20 peanut genotypes for hydroponics seedlings were compared with the field according to the multiple phenotypic analysis (Figure 8). Most genotypes’ values, except for Luhua 12 (0.45), were less than 0.4, showing stable N efficiency in both conditions; even Naihan 1, Huayu 33, and Huayu 20 had values below 0.1. In this way, the classifications of N efficiency among 20 peanut genotypes were consistently divided between the two conditions, which indicated that these two screening experimental methods were reliable for establishing a comprehensive evaluation system for low-N peanuts.

4. Discussion

Peanuts are often cultivated on poor land, as they are resistant to drought [17], cold [18], and salt [19]. However, previous studies have focused more on the morphological and physiological response to stress among several genotypes, but few studies have been conducted on the N efficiency of peanut core germplasm resources. As is known, N absorption and utilization by different peanut genotypes vary significantly [20]. Recently, the evaluation of peanut N efficiency and the screening of N-efficient materials have become popular. N efficiency has been evaluated for many crops, such as rice [21], maize [22], and broomcorn millet [23]. Hydroponics and soil culture are usually used as low-N plant screening conditions. With hydroponics, the concentration can be accurately controlled, which can be less affected by the environment and is easy to repeat, but it cannot reflect the crop development at the later stages. Soil culture is time-consuming, involves heavy workloads, and is difficult to control, yet it is more direct and objective, which is consistent with the reality of production [24]. Therefore, this experiment combined hydroponic seedlings and the field for screening and established a comprehensive evaluation among peanut germplasm collections.
N adaptation is so complex that a single trait struggles to comprehensively and accurately evaluate N efficiency. In addition, peanut genotypes differ in performance under different low-N conditions, and any given genotype performs diversely under varying concentrations [25]. Therefore, the confirmation of low-N concentrations and indicators used for screening becomes particularly important. The peanut response to N is sensitive at the seedling stage. To avoid intrinsic differences between species, in this experiment, a low-N resistance coefficient (NC) of 127 peanut genotypes was used to characterize N efficiency at the seedling stage. Furthermore, if the N concentration is too low, genotypes that are extremely resistant to low-N will gradually wither; conversely, if the concentration is too high, the screening pressure will increase, and the genetic advantage of excellent genotypes will not be fully realized [26]. In the experiments reported herein, after N2 low-N treatment, the kurtosis, skewness, and μ and σ of the membership function values for each genotype were closest to 0, and the data were more concentrated. In addition, most of the indicators had the largest CV at this concentration, showing an obvious normal distribution. What is more, there are significant differences among genotypes. Thus, the N efficiency of each peanut genotype was graded and sorted. Therefore, our data showed that the N2 (0.15 mM N) treatment cultivated for 24 days can be used for effective low-N tolerance identification among a large number of genotypes in a germplasm collection.
The genotypes were ranked with different screening indices. Low N can lead to direct or indirect changes in a series of plant phenotypic traits. Therefore, selecting phenotypic traits that are closely related to N efficiency and can be measured immediately and easily can significantly improve screening efficiency [11]. Thus, for example, Liu [23] measured 12 indicators and screened plant height, root length, shoot biomass, and N content, which can be used for the rapid identification of low-N tolerance using Pearson’s correlation analysis and PCA analysis. Liu [27] found differences among 28 alfalfa varieties at the seedling stage based on the shoot or plant dry weight, N accumulation, root length, and volume. In this study, fifteen individual indices were divided into five factors through correlation and principal component analyses, and most parameters were correlated with each other. After removing the redundant indices, N content, dry matter weight, root/shoot ratio, and N accumulation, NUE, NUI, and SPAD were identified as important screening indicators, upon which the best regression equations were established based on the NC of peanut genotypes: Y = 1.57X1 + 0.792X2 − 0.324X3 + 2.197X4 + 1.213X5 + 1.509X6 − 0.724X7 − 2.778X8 + 0.799X9 + 0.008X10 + 0.148X11 + 0.072X12 + 1.387X13 (R2 = 0.999). Finally, the cluster method was used to compare the differences in various peanut genotypes, which were divided into extremely N-efficient genotypes (I), highly N-efficient genotypes (II), highly N-inefficient genotypes (III), and extremely N-inefficient genotypes (IV).
In order to ensure the reliability of the seedling hydroponic screening system for N-efficient peanut genotypes, we conducted validation studies in the field at the later growing stage. In the present study, 10 N-efficient and 10 N-inefficient genotypes screened at the seedling stage were assessed for N adaptation in the field under normal N (N90) and low-N (N0) conditions. N-efficient genotypes with high productivity can effectively relieve environmental stress and achieve nitrogen reduction, which has practical implications [28], so more desirable N-efficient genotypes are supposed to be both highly N-efficient and highly productive [21]. Peanut yield differed significantly among the genotypes [29], which was indirectly influenced by the number of pods and full pods per plant, 100 pod weight, and 100 kernel weight. Genotypic variation in these traits exists in peanuts and is also controlled by the N supply [30,31]. Through a two-year field experiment, we found that a large proportion of yield could be explained by pods and full pods per plant, which was consistent with Chen [32] and may result from changes in the sink strength that were driven by variations in the N transport and redistribution, which leads to differences in N efficiency among different genotypes. Yield and N efficiency are closely correlated, whereas the indicators and methods that have been used to assess N efficiency are complex. It is hard to reflect the overall N efficiency of peanut genotypes with a single indicator; therefore, a comprehensive evaluation based on multiple N efficiencies for accurate identification should be conducted. He [33] determined the biomass, yield, N content, and accumulation, and then classified fifty oilseed rape genotypes into four categories: N-responder, N-non-responder, N-efficient, and N-inefficient genotypes, according to NUtE. In this study, YNEI was employed to evaluate the N efficiency of peanut genotypes in the field. Those with values greater than 1 were identified as N-efficient genotypes, and those with values less than 1 were defined as N-inefficient genotypes. N-efficient genotypes probably provide stronger integration in N uptake and utilization, better distribute N to each component, regulate the balance of the source and sink, and increase biomass accumulation, thus improving the yield.
Plant N adaptation is a complex trait that is determined by heredity and environment [34]. Consequently, we ought to consider multiple factors when valuing the N efficiency within genotypes. The majority of genotypes showed consistent N adaptation across the growth stages, but others might perform variably. Limpens [35] compared over 115 glasshouse and 107 field experiments, giving similar qualitative and quantitative estimates in response to N application with the meta-analysis. He [33] found that the data for the field and pot experiments were not correlated, but a PCA analysis showed similar genetic correlations between NUtE and other traits. Under different experimental conditions, genotypes may behave diversely in terms of traits, resulting in changes in N-efficiency. Therefore, we should select the appropriate screening concentrations and indicators. Adopting the same criteria, we would ignore the important traits and then lose superior genotypes. In this study, we compared the results of the seedling hydroponics with the field validation with multiple phenotypic analyses and found that the differences in most genotypes between the two conditions were less than 0.4. The N efficiency classification of 20 peanut varieties was uniform, demonstrating the reliability as well as the mutual validation between the two methods, thereby constructing a comprehensive evaluation system for peanuts. The flow chart of the screening for N stress concentration, traits, and method of N-efficient peanut genotypes in Figure 9 provides a foundation for efficient and accurate identification for future peanut production research.

5. Conclusions

In this study, we carried out an integrated evaluation of N efficiency for 127 peanut genotypes with seedling hydroponics combined with field identification. At the seedling stage, 0.15 mM N for 24 days was the optimum screening condition determined by affiliation function analysis, standard normal distribution analysis, and variance analysis. A PCA and correlation analysis were performed to confirm the screening indicators, such as dry matter weight, RSR, N content, N accumulation, NUE, and NUI, as well as to establish a regression mathematical model. In the field, YNEI was taken as the evaluation index, and the two screening methods based on multiple phenotypic analyses were compared. Furthermore, we identified N-efficient and N-inefficient peanut core germplasm and established a comprehensive evaluation system for N efficiency in peanuts.

Supplementary Materials

The following supporting information can be downloaded at https://www.mdpi.com/article/10.3390/horticulturae10070669/s1. Table S1: Information on experimental peanut materials; Table S2: Composition of the normal-N nutrient solution; Table S3: Peanut leaf etiolation symptoms and grading; Table S4: Plant etiolation degree and SPAD value of different peanut genotypes under low N supply; Figure S1: Precipitation of the field in 2021–2022.

Author Contributions

Conceptualization, C.J. and H.Y.; software, P.Z.; validation, D.G. and Y.W.; formal analysis, P.G.; resources, X.Z.; data curation, P.Z.; writing—original draft preparation, P.Z.; writing—review and editing, C.J.; supervision, C.J. and H.Y.; project administration, X.Z.; funding acquisition, H.Y. All authors have read and agreed to the published version of the manuscript.

Funding

This research was funded by the earmarked fund for CARS-13.

Data Availability Statement

Data are contained within the article and supplementary materials.

Conflicts of Interest

The authors declare no conflicts of interest.

References

  1. Arya, S.S.; Salve, A.R.; Chauhan, S. Peanuts as functional food: A review. J. Food Sci. Technol. 2016, 53, 31–41. [Google Scholar] [CrossRef] [PubMed]
  2. Wang, Y.Y.; Cheng, Y.H.; Chen, K.E.; Tsay, Y.F. Nitrate Transport, Signaling, and Use Efficiency. Annu. Rev. Plant Biol. 2018, 69, 85–122. [Google Scholar] [CrossRef] [PubMed]
  3. Liu, Q.; Wu, K.; Song, W.Z.; Zhong, N.; Wu, Y.Z.; Fu, X.D. Improving Crop Nitrogen Use Efficiency toward Sustainable Green Revolution. Annu. Rev. Plant Biol. 2022, 73, 523–551. [Google Scholar] [CrossRef] [PubMed]
  4. Anas, M.; Liao, F.; Verma, K.K.; Sarwar, M.A.; Mahmood, A.; Chen, Z.L.; Li, Q.; Zeng, X.P.; Liu, Y.; Li, Y.R. Fate of nitrogen in agriculture and environment: Agronomic, eco-physiological and molecular approaches to improve nitrogen use efficiency. Biol. Res. 2020, 53, 20. [Google Scholar] [CrossRef] [PubMed]
  5. Zuluaga, D.L.; Sonnante, G. The Use of Nitrogen and Its Regulation in Cereals: Structural Genes, Transcription Factors, and the Role of miRNAs. Plants 2019, 8, 294. [Google Scholar] [CrossRef] [PubMed]
  6. Moll, R.H.; Kamprath, E.J.; Jackson, W.A. Analysis and Interpretation of Factors Which Contribute to Efficiency of Nitrogen Utilization. Agron. J. 1962, 74, 562–564. [Google Scholar] [CrossRef]
  7. Kessel, B.; Schierholt, A.; Becker, H.C. Nitrogen Use Efficiency in a Genetically Diverse Set of Winter Oilseed Rape (Brassica napus L.). Crop Sci. 2012, 52, 2546–2554. [Google Scholar] [CrossRef]
  8. Wu, Z.M.; Luo, J.S.; Han, Y.L.; Hua, Y.P.; Guan, C.Y.; Zhang, Z.H. Low Nitrogen Enhances Nitrogen Use Efficiency by Triggering NO3 Uptake and Its Long-Distance Translocation. J. Agric. Food Chem. 2019, 67, 6736–6747. [Google Scholar] [CrossRef] [PubMed]
  9. Wang, Y.J.; Wang, D.M.; Tao, Z.Q.; Yang, Y.S.; Gao, Z.X.; Zhao, G.C.; Chang, X.H. Impacts of Nitrogen Deficiency on Wheat (Triticum aestivum L.) Grain during the Medium Filling Stage: Transcriptomic and Metabolomic Comparisons. Front. Plant Sci. 2021, 12, 20. [Google Scholar] [CrossRef]
  10. Sinha, S.K.; Kumar, A.; Tyagi, A.; Venkatesh, K.; Paul, D.; Singh, N.K.; Mandal, P.K. Root architecture traits variation and nitrate-influx responses in diverse wheat genotypes under different external nitrogen concentrations. Plant Physiol. Biochem. 2020, 148, 246–259. [Google Scholar] [CrossRef]
  11. Chen, J.; Liu, L.T.; Wang, Z.B.; Zhang, Y.J.; Sun, H.C.; Song, S.J.; Bai, Z.Y.; Lu, Z.Y.; Li, C.D. Nitrogen Fertilization Increases Root Growth and Coordinates the Root-Shoot Relationship in Cotton. Front. Plant Sci. 2020, 11, 13. [Google Scholar] [CrossRef] [PubMed]
  12. The, S.V.; Snyder, R.; Tegeder, M. Targeting Nitrogen Metabolism and Transport Processes to Improve Plant Nitrogen Use Efficiency. Front. Plant Sci. 2021, 11, 22. [Google Scholar] [CrossRef] [PubMed]
  13. Masclaux-Daubresse, C.; Daniel-Vedele, F.; Dechorgnat, J.; Chardon, F.; Gaufichon, L.; Suzuki, A. Nitrogen uptake, assimilation and remobilization in plants: Challenges for sustainable and productive agriculture. Ann. Bot. 2010, 105, 1141–1157. [Google Scholar] [CrossRef]
  14. Liu, Y.; Yan, Z.H.; Wang, J.G.; Zhao, J.H.; Liu, Y.Y.; Zou, J.; Li, L.; Zhang, J.L.; Wan, S.B. Optimizing Initial Nitrogen Application Rates to Improve Peanut (Arachis hypogaea L.) Biological Nitrogen Fixation. Agronomy 2023, 13, 3020. [Google Scholar] [CrossRef]
  15. Rathore, V.S.; Nathawat, N.S.; Bhardwaj, S.; Yadav, B.M.; Kumar, M.; Santra, P.; Kumar, P.; Reager, M.L.; Yadava, N.D.; Yadav, O.P. Optimization of deficit irrigation and nitrogen fertilizer management for peanut production in an arid region. Sci. Rep. 2021, 11, 14. [Google Scholar] [CrossRef]
  16. Liu, Y.Y.; Song, P.H.; Zhang, Y.C.; Zhou, D.Y.; Dong, Q.Q.; Jia, P.Y.; Liu, Z.H.; Zhao, X.H.; Yu, H.Q. Physiological Mechanism of Photosynthetic, Nutrient, and Yield Responses of Peanut Cultivars with Different Tolerances under Low K Stress. Agronomy 2023, 13, 185. [Google Scholar] [CrossRef]
  17. Ren, J.Y.; Guo, P.; Zhang, H.; Shi, X.L.; Ai, X.; Wang, J.; Jiang, C.J.; Zhao, X.H.; Liu, X.B.; Yu, H.Q. Comparative physiological and coexpression network analyses reveal the potential drought tolerance mechanism of peanut. BMC Plant Biol. 2022, 22, 16. [Google Scholar] [CrossRef] [PubMed]
  18. Wang, X.; Liu, Y.; Han, Z.K.; Chen, Y.N.; Huai, D.X.; Kang, Y.P.; Wang, Z.H.; Yan, L.Y.; Jiang, H.F.; Lei, Y.; et al. Integrated Transcriptomics and Metabolomics Analysis Reveal Key Metabolism Pathways Contributing to Cold Tolerance in Peanut. Front. Plant Sci. 2021, 12, 15. [Google Scholar] [CrossRef]
  19. Xu, Y.; Zhang, Z.M.; Ding, H.; Wen, S.Q.; Zhang, G.C.; Qin, F.F.; Dai, L.X. Comprehensive effects of salt stress and peanut cultivars on the rhizosphere bacterial community diversity of peanut. Arch. Microbiol. 2022, 204, 11. [Google Scholar] [CrossRef]
  20. Wang, C.B.; Zheng, Y.M.; Shen, P.; Zheng, Y.P.; Wu, Z.F.; Sun, X.W.; Yu, T.Y.; Feng, H. Determining N supplied sources and N use efficiency for peanut under applications of four forms of N fertilizers labeled by isotope 15N. J. Integr. Agric. 2016, 15, 432–439. [Google Scholar] [CrossRef]
  21. Rakotoson, T.; Dusserre, J.; Letourmy, P.; Ramonta, I.R.; Cao, T.V.; Ramanantsoanirina, A.; Roumet, P.; Ahmadi, N.; Raboin, L.M. Genetic variability of nitrogen use efficiency in rainfed upland rice. Field Crop. Res. 2017, 213, 194–203. [Google Scholar] [CrossRef]
  22. Miao, J.J.; Shi, F.; Li, W.; Zhong, M.; Li, C.; Chen, S.S. Comprehensive screening of low nitrogen tolerant maize based on multiple traits at the seedling stage. Peerj 2022, 10, 17. [Google Scholar] [CrossRef]
  23. Liu, C.J.; Gong, X.W.; Wang, H.L.; Dang, K.; Deng, X.P.; Feng, B.L. Low-nitrogen tolerance comprehensive evaluation and physiological response to nitrogen stress in broomcorn millet (Panicum miliaceum L.) seedling. Plant Physiol. Biochem. 2020, 151, 233–242. [Google Scholar] [CrossRef] [PubMed]
  24. Sharma, N.; Sinha, V.B.; Gupta, N.; Rajpal, S.; Kuchi, S.; Sitaramam, V.; Parsad, R.; Raghuram, N. Phenotyping for Nitrogen Use Efficiency: Rice Genotypes Differ in N-Responsive Germination, Oxygen Consumption, Seed Urease Activities, Root Growth, Crop Duration, and Yield at Low N. Front. Plant Sci. 2018, 9, 16. [Google Scholar] [CrossRef] [PubMed]
  25. Schum, A.; Jansen, G. In vitro method for early evaluation of nitrogen use efficiency associated traits in potato. J. Appl. Bot. Food Qual. 2014, 87, 256–264. [Google Scholar]
  26. Mu, X.H.; Chen, Y.L. The physiological response of photosynthesis to nitrogen deficiency. Plant Physiol. Biochem. 2021, 158, 76–82. [Google Scholar] [CrossRef] [PubMed]
  27. Liu, X.J.; Zhao, Y.J.; Hao, F. Development of nitrogen efficiency screening system in alfalfa (Medicago sativa L.) and analysis of alfalfa nitrogen efficiency types. Peerj 2022, 10, 21. [Google Scholar] [CrossRef] [PubMed]
  28. Tantray, A.Y.; Hazzazi, Y.; Ahmad, A. Physiological, Agronomical, and Proteomic Studies Reveal Crucial Players in Rice Nitrogen Use Efficiency under Low Nitrogen Supply. Int. J. Mol. Sci. 2022, 23, 6410. [Google Scholar] [CrossRef]
  29. Aninbon, C.; Jogloy, S.; Vorasoot, N.; Nuchadomrong, S.; Holbrook, C.C.; Kvien, C.; Puppala, N.; Patanothai, A. Variability of arginine content and yield components in Valencia peanut germplasm. Breed. Sci. 2017, 67, 207–212. [Google Scholar] [CrossRef]
  30. Li, G.H.; Guo, X.; Sun, W.; Hou, L.; Wang, G.H.; Tian, R.Z.; Wang, X.J.; Qu, C.J.; Zhao, C.Z. Nitrogen application in pod zone improves yield and quality of two peanut cultivars by modulating nitrogen accumulation and metabolism. BMC Plant Biol. 2024, 24, 12. [Google Scholar] [CrossRef]
  31. Zhang, G.C.; Liu, Q.B.; Zhang, Z.M.; Ci, D.W.; Zhang, J.L.; Xu, Y.; Guo, Q.; Xu, M.L.; He, K. Effect of Reducing Nitrogen Fertilization and Adding Organic Fertilizer on Net Photosynthetic Rate, Root Nodules and Yield in Peanut. Plants 2023, 12, 2902. [Google Scholar] [CrossRef] [PubMed]
  32. Chen, B.Y.; Xu, K.; Li, J.; Li, F.; Qiao, J.W.; Li, H.; Gao, G.Z.; Yan, G.X.; Wu, X.M. Evaluation of yield and agronomic traits and their genetic variation in 488 global collections of Brassica napus L. Genet. Resour. Crop Evol. 2014, 61, 979–999. [Google Scholar] [CrossRef]
  33. He, H.Y.; Yang, R.; Li, Y.J.; Ma, A.S.; Cao, L.Q.; Wu, X.M.; Chen, B.Y.; Tian, H.; Gao, Y.J. Genotypic Variationin Nitrogen Utilization Efficiency of Oilseed Rape (Brassica napus) under Contrasting N Supply in Pot and Field Experiments. Front. Plant Sci. 2017, 8, 15. [Google Scholar] [CrossRef] [PubMed]
  34. Gaudinier, A.; Rodriguez-Medina, J.; Zhang, L.F.; Olson, A.; Liseron-Monfils, C.; Bagman, A.M.; Foret, J.; Abbitt, S.; Tang, M.; Li, B.H.; et al. Transcriptional regulation of nitrogen-associated metabolism and growth. Nature 2018, 563, 259. [Google Scholar] [CrossRef]
  35. Limpens, J.; Granath, G.; Aerts, R.; Heijmans, M.M.P.D.; Sheppard, L.J.; Bragazza, L.; Williams, B.L.; Rydin, H.; Bubier, J.; Moore, T. Glasshouse vs field experiments: Do they yield ecologically similar results for assessing N impacts on peat mosses? New Phytol. 2012, 195, 408–418. [Google Scholar] [CrossRef]
Figure 1. Normal distribution of 127 peanut genotypes under different low-N treatments; (a) frequency distribution histogram; (b) QQ-plot diagram.
Horticulturae 10 00669 g001
Figure 2. Pearson’s correlation analysis of N2 tolerance coefficients among 15 traits of peanut materials. SH (stem height); RL (root length); SDW (shoot dry weight); RDW (root dry weight); TDW (total dry weight); RSR (root shoot ratio); SNC (shoot nitrogen content); RNC (root nitrogen content); TNC (total nitrogen content); SNA (shoot nitrogen accumulation); RNA (root nitrogen accumulation); TNA (total nitrogen accumulation); NUE (nitrogen-use efficiency); and NUI (nitrogen utilization index).
Horticulturae 10 00669 g002
Figure 3. Cluster analysis of 127 peanut genotypes at the seedling stage. I: extremely N-efficient genotypes; II: highly N-efficient genotypes; III: highly N-inefficient genotypes; and IV: extremely N-inefficient genotypes.
Horticulturae 10 00669 g003
Figure 4. Yield of 20 peanut genotypes under different nitrogen applications. Yield of 20 peanut genotypes under N90 and N0 application during (a) 2021 and (b) 2022. Different lowercase letters on the columns indicate significant differences between the means of the same nitrogen treatments at the 5% level by the LSD test. N, nitrogen treatment; G, genotype; ns indicates no significant difference. ** indicates significant differences at p = 0.01.
Horticulturae 10 00669 g004
Figure 5. Nitrogen efficiency distribution of 20 peanut genotypes. The ratio of each peanut genotype nitrogen efficiency to the mean group nitrogen efficiency among 20 peanut genotypes in (a) 2021 and (b) 2022.
Horticulturae 10 00669 g005
Figure 6. YNEI of 20 peanut genotypes. YNEI of 20 peanut genotypes in the field over two years: (a) 2021 and (b) 2022. Grey bars: N-inefficient peanut genotypes, dark bars: N-efficient peanut genotypes.
Horticulturae 10 00669 g006
Figure 7. Distribution chart of traits for 20 peanut genotype seedlings under different nitrogen concentrations. CV refers to the coefficient of variation; CK represents the normal nitrogen concentration of 7.5 mM N; 0.25, 0.15, and 0.1 represent different low nitrogen concentrations of 0.25, 0.15, and 0.1 mM N, respectively. Grey, green, blue and red boxes indicate 0.75, 0.25, 0.15 and 0.1mM N, respectively.
Horticulturae 10 00669 g007
Figure 8. Comparison of N efficiency between hydroponics seedlings and the field based on multiple phenotypic analyses.
Horticulturae 10 00669 g008
Figure 9. Prediction model for peanut nitrogen-efficient comprehensive evaluation system.
Horticulturae 10 00669 g009
Table 1. Principal component analysis of 127 peanut genotypes.
ItemsIndicesPrinciple Component
Factor 1Factor 2Factor 3Factor 4
Characteristic vectorSPAD0.1080.134−0.0960.846
SH0.0620.281−0.129−0.717
RL−0.0070.0970.460−0.079
SDW−0.1840.9710.028−0.079
RDW−0.2630.5000.7740.092
TDW−0.2420.9180.303−0.027
RSR−0.047−0.4430.8130.108
SNC0.938−0.010−0.045−0.016
RNC0.7450.0190.1610.092
TNC0.9780.031−0.0630.010
SNA0.5550.794−0.017−0.088
RNA0.3250.4140.7640.099
TNA0.5540.7940.200−0.046
NUE−0.980−0.0460.036−0.004
NUI−0.7610.5760.2330.012
Eigen value4.8304.1072.3011.291
Contribution percentage (%)32.20227.37915.3428.606
Accumulative contribution percentage (%)83.529
SH (stem height); RL (root length); SDW (shoot dry weight); RDW (root dry weight); TDW (total dry weight); RSR (root shoot ratio); SNC (shoot nitrogen content); RNC (root nitrogen content); TNC (total nitrogen content); SNA (shoot nitrogen accumulation); RNA (root nitrogen accumulation); TNA (total nitrogen accumulation); NUE (nitrogen-use efficiency); and NUI (nitrogen utilization index).
Table 2. Yield and yield-related factors of 20 peanut genotypes under different nitrogen applications.
YearTraitsN90N0
RangeMeanCV (%)RangeMeanCV (%)
2021Pod number per plant17–24219.5915–231812.98
Full-pod number per plant14–231812.2912–221615.98
100 pods weight (g)152.85–231.62181.8611.43139.15–214.01171.2310.90
100 kernels weight (g)57.78–94.9974.2115.0057.67–90.0572.0614.45
Pod yield (t hm−2)3.23–3.983.655.712.85–3.713.366.53
2022Pod number per plant14–231813.8712–221620.02
Full-pod number per plant11–231621.978–211328.33
100 pods weight (g)152.66–238.24182.5811.82138.38–219.77173.0012.05
100 kernels weight (g)59.26–97.2374.3814.8058.93–93.2172.1914.39
Pod yield (t hm−2)3.35–3.993.655.052.91–3.563.196.00
Disclaimer/Publisher’s Note: The statements, opinions and data contained in all publications are solely those of the individual author(s) and contributor(s) and not of MDPI and/or the editor(s). MDPI and/or the editor(s) disclaim responsibility for any injury to people or property resulting from any ideas, methods, instructions or products referred to in the content.

