Article

Pre-Harvest UV-A Supplementation in Plant Factory with Artificial Lighting Improves Growth, Photosynthesis, and Phytonutrients in Kale

by
Weerasin Sonjaroon
1,†,
Teerapat Tepkaew
2,3,
Manop Kupia
4,
Pattama Tongkok
5,
Patchareeya Boonkorkaew
4 and
Jutiporn Thussagunpanit
4,*,†
1
School of Integrated Science, Kasetsart University, 50 Ladyao, Chatuchak, Bangkok 10900, Thailand
2
Department of Botany, Faculty of Science, Kasetsart University, 50 Ladyao, Chatuchak, Bangkok 10900, Thailand
3
Department of Agricultural Management, Faculty of Interdisciplinary Management and Technology, Kasetsart University, 98 Khok Khram, Bang Pla Ma District, Suphanburi 72150, Thailand
4
Department of Horticulture, Faculty of Agriculture, Kasetsart University, 50 Ladyao, Chatuchak, Bangkok 10900, Thailand
5
Kasetsart Agricultural and Agro-Industrial Product Improvement Institute, Kasetsart University, 50 Ladyao, Chatuchak, Bangkok 10900, Thailand
*
Author to whom correspondence should be addressed.
These authors contributed equally to this work.
Horticulturae 2024, 10(7), 701; https://doi.org/10.3390/horticulturae10070701
Submission received: 31 May 2024 / Revised: 23 June 2024 / Accepted: 28 June 2024 / Published: 2 July 2024
(This article belongs to the Section Vegetable Production Systems)

Abstract

:
UV-A (315–400 nm) is a component of solar radiation, which impacts plant physiology. Consequently, the impact was investigated of UV-A supplementation on various aspects of kale cultivation in a plant factory with artificial lighting. Three UV-A intensity treatments (5, 10, or 15 W/m2) were applied to kale plants for 5 days before harvesting. The results revealed that 5 or 10 W/m2 UV-A supplementation provided significant advantages for kale growth. The fresh weight of the kale shoots increased by over 35–50% after UV-A exposure. In particular, the 10 W/m2 UV-A exposure significantly improved the photosynthetic rate, water-use efficiency, and quantum efficiency of photosystem II (Y(II)). In addition, the treatment with UV-A positively impacted changes in leaf spectral indices, resulting in decreases in the simple ratio index (SR), the normalized phaeophytinization index (NPQI), and the normalized difference red edge index (NDRE). Furthermore, the phytonutrients in kale (Vitamin C, soluble protein, and total phenolics) were enhanced using the 10 W/m2 UV-A treatment. One notable outcome was the consistent reduction in nitrate contents across all UV-A treatment intensities. Therefore, supplementing kale cultivation with UV-A radiation was a valuable strategy for enhancing kale yield and quality in plant factory production.

1. Introduction

Kale (Brassica oleracea var. sabellica) is a leafy green vegetable of pronounced nutritional value and agronomic utility. This vegetable is an abundant source of essential nutrients, including proteins, phytonutrients, antioxidants, and Vitamins A, C, and K, as well as minerals such as calcium, manganese, potassium, and iron [1]. These qualities have contributed to the current high demand for kale production. Kale plants respond noticeably to their surrounding environment [2]. They are appropriate to grow in temperate climates with moderate sunlight exposure [3]. Kale can be cultivated in a plant factory with artificial lighting (PFAL) to ensure consistent year-round and widespread kale production and to maintain its quality. PFAL is a closed system of vertical farming for planting that can modify environmental parameters to suit the cultivation of a specific crop, including temperature, humidity, light intensity, water, and CO2 concentration. Such a system ensures the plants grow well, no matter the external conditions [4].
There have been numerous attempts to enhance both the yield and nutrient content of kale grown in a PFAL. The addition of NO3-N fertilizer to nutrient solutions has been shown to increase lutein and β-carotene levels [5]. Increasing the CO2 concentration over the ambient atmosphere (400 ppm) in the PFAL system has the potential to enhance the growth rate of plants by promoting the photosynthetic rate [4]. Among the light sources that are used in PFAL, the red-, green-, and blue-light-emitting diodes (RGB LEDs) are artificial lighting that have proven to be effective in kale production [6]. An extension in the photoperiod from 6 h to 12 h has been shown to enhance the pigment consisting of chlorophyll, β-carotene, and lutein accumulation in kale [7]. In addition, light conditions had a significant impact on the quantity and kind of phenolic components [6]. Research reported that some specific light wavelength has the capacity to differentially trigger the secondary metabolic accumulation in kale. For example, a light wavelength of 640 nm is optimal for activating the accumulation of chlorophyll a, chlorophyll b, and lutein, while a wavelength of 440 nm stimulates β-carotene accumulation [8]. Furthermore, ultraviolet (UV) radiation has an impact on vegetable production. UV-B radiation has been used successfully to increase the content of bioactive compounds in kale [9]. In addition, the glucosinolate and soluble protein contents in Chinese kale were increased by using 10 and 15 W/m2 UV-A for 10 days [10].
The impact of UV-A radiation on plant growth has been reported to influence various aspects of plant development, metabolism, photosynthesis, and final biomass [11,12]. UV-A, encompassing wavelengths 315–400 nm, is defined as the invisible part of the solar spectrum that is the major component of the UV radiation reaching the Earth’s surface [12,13]. Among UV light, it is crucial in plant photomorphogenesis and stress response [14]. It was found that UV-A treatment could activate biomass accumulation in various plant species [11], including kale [6,15]. Other studies focused on the treatment of UV-A radiation on the final yield quality, including the phytonutrients at harvest [2,6,15]. However, there have been no published reports on the effects of UV-A radiation on changes in photosynthetic efficiency and leaf spectral reflectance. Understanding the physiological effects of UV-A on plant growth is essential for optimizing agricultural practices and enhancing crop production, particularly in plant factory systems. In this study, we investigated the impact of UV-A on the pre-harvest of kale production to elucidate the effectiveness of UV-A on the promoting of growth, biomass, and phytonutrient accumulation, which are contents of plant-based chemical compounds through photosynthetic properties and leaf spectral reflectance under plant factory cultivation.

2. Materials and Methods

2.1. Plant Material and Growing Conditions

Kale (Brassica oleracea var. sabellica) seeds (Chia Tai Co., Ltd.; Bangkok, Thailand) were sown into a hydrated sponge block for 48 h. Subsequently, the germinated seedlings, about 200, were transferred to a vertical nursery tray system containing Enshi solution that had a controlled electrical conductivity (EC) of 0.6 mS/cm. After 11 days of development, the seedlings were relocated to a dynamic root-floating technique system [16] with artificial lighting in the plant factory. Throughout the experiment, the ambient temperature, relative humidity, CO2 concentration, and photosynthetically active radiation (PAR) light intensity were controlled at 25 °C, 60–70%, 400 ppm, and 200 µmol/(m2s) (white:blue:red light emitting diodes (LEDs) = 3:2:1 and 12 h/day during 06:00–18:00), respectively. The EC and pH of the nutrient solution were set at 2.2–2.4 mS/cm and 5.5–6, respectively.

2.2. UV-A Treatment and Experimental Design

The experiment was arranged in a completely randomized design with four levels of UV-A treatment. About 200 kale plants were grown for 6 weeks (Figure S1a) under a standard light system, using 30 × 150 cm LED panels (Panasonic Co., Ltd.; Bangkok, Thailand) containing white:blue:red (3:2:1) LEDs that supplied 200 µmol/(m2s) PAR light intensity. Then, the standard light system was supplemented with UV-A LEDs (Agrowlab; Bangkok, Thailand) at different treatment levels of 0 (no UV-A), 5, 10, or 15 W/m2 for 5 days. In each treatment, four replications were performed in separated growing trays (12 plants/tray). Light spectrograms were measured using a spectrometer (LI-180; LI-COR Environmental; Lincoln, NE, USA), as shown in Figure 1.

2.3. Growth and Biomass Measurements

The morphological parameters—shoot and root fresh weights, stem height, canopy width, and stem diameter (where the wounds of cotyledons were)—were measured 14 days before UV-A treatment and after the UV-A exposure period. The number of leaves was counted in fully expanded leaves (Figure S1b). After harvesting, the samples were dried at 60 °C for 5 days, after which the shoot and root dry weight were recorded, and the proportion of fresh weight-to-dry weight was calculated. Growth and biomass were measured from four replications with three plants/replication.

2.4. Photosynthetic Pigment Content Evaluation

At harvest day, the leaf greenness index of the first fully expanded leaf (Figure S1b) of each plant at that time was quantified using a portable chlorophyll meter (SPAD-502; Minolta Corp.; Kyoto, Japan). In addition, photosynthetic pigments were extracted from fresh leaf samples (each 0.1 g) using 10 mL N,N-dimethyl formamide in the dark for 24 h at room temperature. The absorbance of each extract solution was determined at 664 nm, 647 nm, and 480 nm using a spectrophotometer (PV1; Shanghai Mapada Instruments Co., Ltd., Shanghai, China). The total chlorophyll (total chl), chlorophyll a (chl a), chlorophyll b (chl b), and carotenoids in each kale sample were calculated and compared to their fresh weight (FW) according to Porra et al. [17] and Wellburn [18]. In addition, the chl a/b ratio was calculated.

2.5. Photosynthetic Efficiency Measurements

The photosynthetic efficiency (leaf gas exchange and chlorophyll fluorescence) was measured 1 day before and 5 days after the UV-A treatment. The measurements were performed on the first fully expanded leaf (Figure S1b) of each plant at that time to represent whole plants because that leaf was expected to exhibit the highest photosynthetic efficiency.
The leaf gas-exchange parameters—photosynthetic rate (Pn), stomatal conductance (gs), transpiration rate (E), and intercellular CO2 concentration (Ci)—were determined using a portable photosynthesis system (LI-6800; LI-COR Environmental; Lincoln, NE, USA). The measurements were conducted under an artificial red-and-blue LED light source. The parameters in the leaf chamber were maintained at 1500 μmol/m2/s (photosynthetic photon flux density), 400 μmol/mol (CO2 concentration), 25 °C (temperature), 50–60% (relative humidity), and 500 µmol/s (airflow rate). The water-use efficiency (WUE) was calculated from the Pn-to-E ratio.
Chlorophyll fluorescence measurements were conducted using a portable fluorescence system (MINI-PAM-II chlorophyll fluorometer; Walz; Effeltrich, Germany). The minimal fluorescence yield of leaves was measured after 30 min in the dark-adapted state, after which the leaves were exposed to LED lighting and, immediately, the maximal fluorescence yield was recorded. Next, the leaves were illuminated using 1500 μmol/m2/s actinic light for 15 s. The maximum quantum yield of photosystem II (Fv/Fm), quantum efficiency of photosystem II (Y(II)), photochemical quenching (qP), non-photochemical quenching (NPQ), and electron transport rate (ETR) were calculated, according to Maxwell and Johnson [19].

2.6. Leaf Reflectance and Spectral Index Measurement

Leaf reflectance was measured using a handheld spectroradiometer (PolyPen RP410 UVIS and RP410 NIR; Photon Systems Instruments; Drasov, Czech Republic) at wavelengths in the range of 380–790 nm and 640–1050 nm, respectively. Spectral indices were calculated, consisting of the normalized difference vegetation index (NDVI), the simple ratio index (SR), the normalized phaeophytinization index (NPQI), the photochemical reflectance index (PRI), the structure insensitive pigment index (SIPI), the normalized difference red edge index (NDRE), and water index (WI), according to Photon Systems Instruments’s manual [20].

2.7. Phytonutrients and Nitrate Analysis

After 5 days of UV-A supplementation, kale leaves were harvested. Leaf samples from whole plants were collected to analyze phytonutrients, consisting of Vitamin C, soluble protein, and total phenolics, as well as nitrate. The analysis of each compound was done by four samples/treatment. Fresh leaves were homogenized to analyze the Vitamin C and nitrate contents using a RQflex® 20 reflectometer (Merck; Darmstadt, Germany), according to Ağlar and Saraçoğlu [21] and Parks et al. [22], respectively. After harvesting, some fresh leaf samples were freeze-dried for the subsequent analysis of soluble protein and total phenolics. The soluble protein content was determined using the methodology described by Bradford [23]. In brief, a standard solution was prepared by combining bovine serum albumin with a solution of Coomassie brilliant blue. The soluble protein was measured using the spectrophotometer (PV1; Shanghai Mapada Instruments Co., Ltd.; Shanghai, China) at 595 nm absorbance and compared to the standard. Lastly, the total phenolics were analyzed using the Folin–Ciocalteu colorimetric method [24]. The solution was collected to measure the absorbance at 765 nm using the spectrophotometer (PV1; Shanghai Mapada Instruments Co., Ltd., Shanghai, China) and compared to gallic acid that were used for the calibration curve.

2.8. Statistical Analysis

Statistical analysis was conducted using the SPSS statistical software version 22 (SPSS Inc., Chicago, IL, USA). The significance of the observed differences among the treatments was determined using one-way analysis of variance. Mean differences were compared using Tukey’s honestly significant difference test at p < 0.05.

3. Results

3.1. Effect of UV-A on Growth and Biomass of Kale Plant

Kale plant-growth parameters (Table S1) before treatment with UV-A were checked and confirmed that all kale plants had a uniform fresh weight and plant size. After 5 days of UV-A supplementation, all UV-A supplementation enhanced kale growth. The growth observed in the 5 and 10 W/m2 UV-A treatments was comparatively higher than the control (Figure 2). After kale harvesting, the results revealed that UV-A supplementation was significantly effective in promoting the growth of kale across multiple parameters (Table 1). Treating with 5 and 10 W/m2 UV-A increased kale shoot fresh weight by 34.6% and 47.7%, respectively, with a similar trend in shoot dry weight, with enhanced weights of up to 32% and 46.9%, respectively. In addition, the 5 and 10 W/m2 UV-A treatments induced significantly higher root dry weights than the control and the 15 W/m2 UV-A treatments. The fresh-to-dry weight ratios for the 5 and 10 W/m2 UV-A treatments were significantly lower than for the control. The UV-A supplementation trended to enhance the stem height and canopy width of kale. However, the impacts were most evident in the 10 W/m2 UV-A treatment compared to other treatments. In the 10 W/m2 UV-A treatment, the stem height and canopy width were significantly higher (21.8% and 24%, respectively) than in the control, respectively. Furthermore, the 5 W/m2 UV-A treatments showed slightly higher numbers of leaves than the control. However, the stem diameter was not significantly different among the various intensities of UV-A application.

3.2. Effect of UV-A on Photosynthetic Pigment Accumulation in Kale Plant

The measurement of the leaf greenness index in kale leaves found that they were not significantly different among the various intensities of UV-A application (Table 2). In addition, the UV-A supplementation did not significantly alter the pigment contents (total chl, chl a, chl b, and carotenoids), as shown in Table 2. However, the UV-A supplementation tended to reduce total chl, chl a, and chl b. In addition, the chl a/b ratio and the carotenoid contents tended to increase compared to the control.

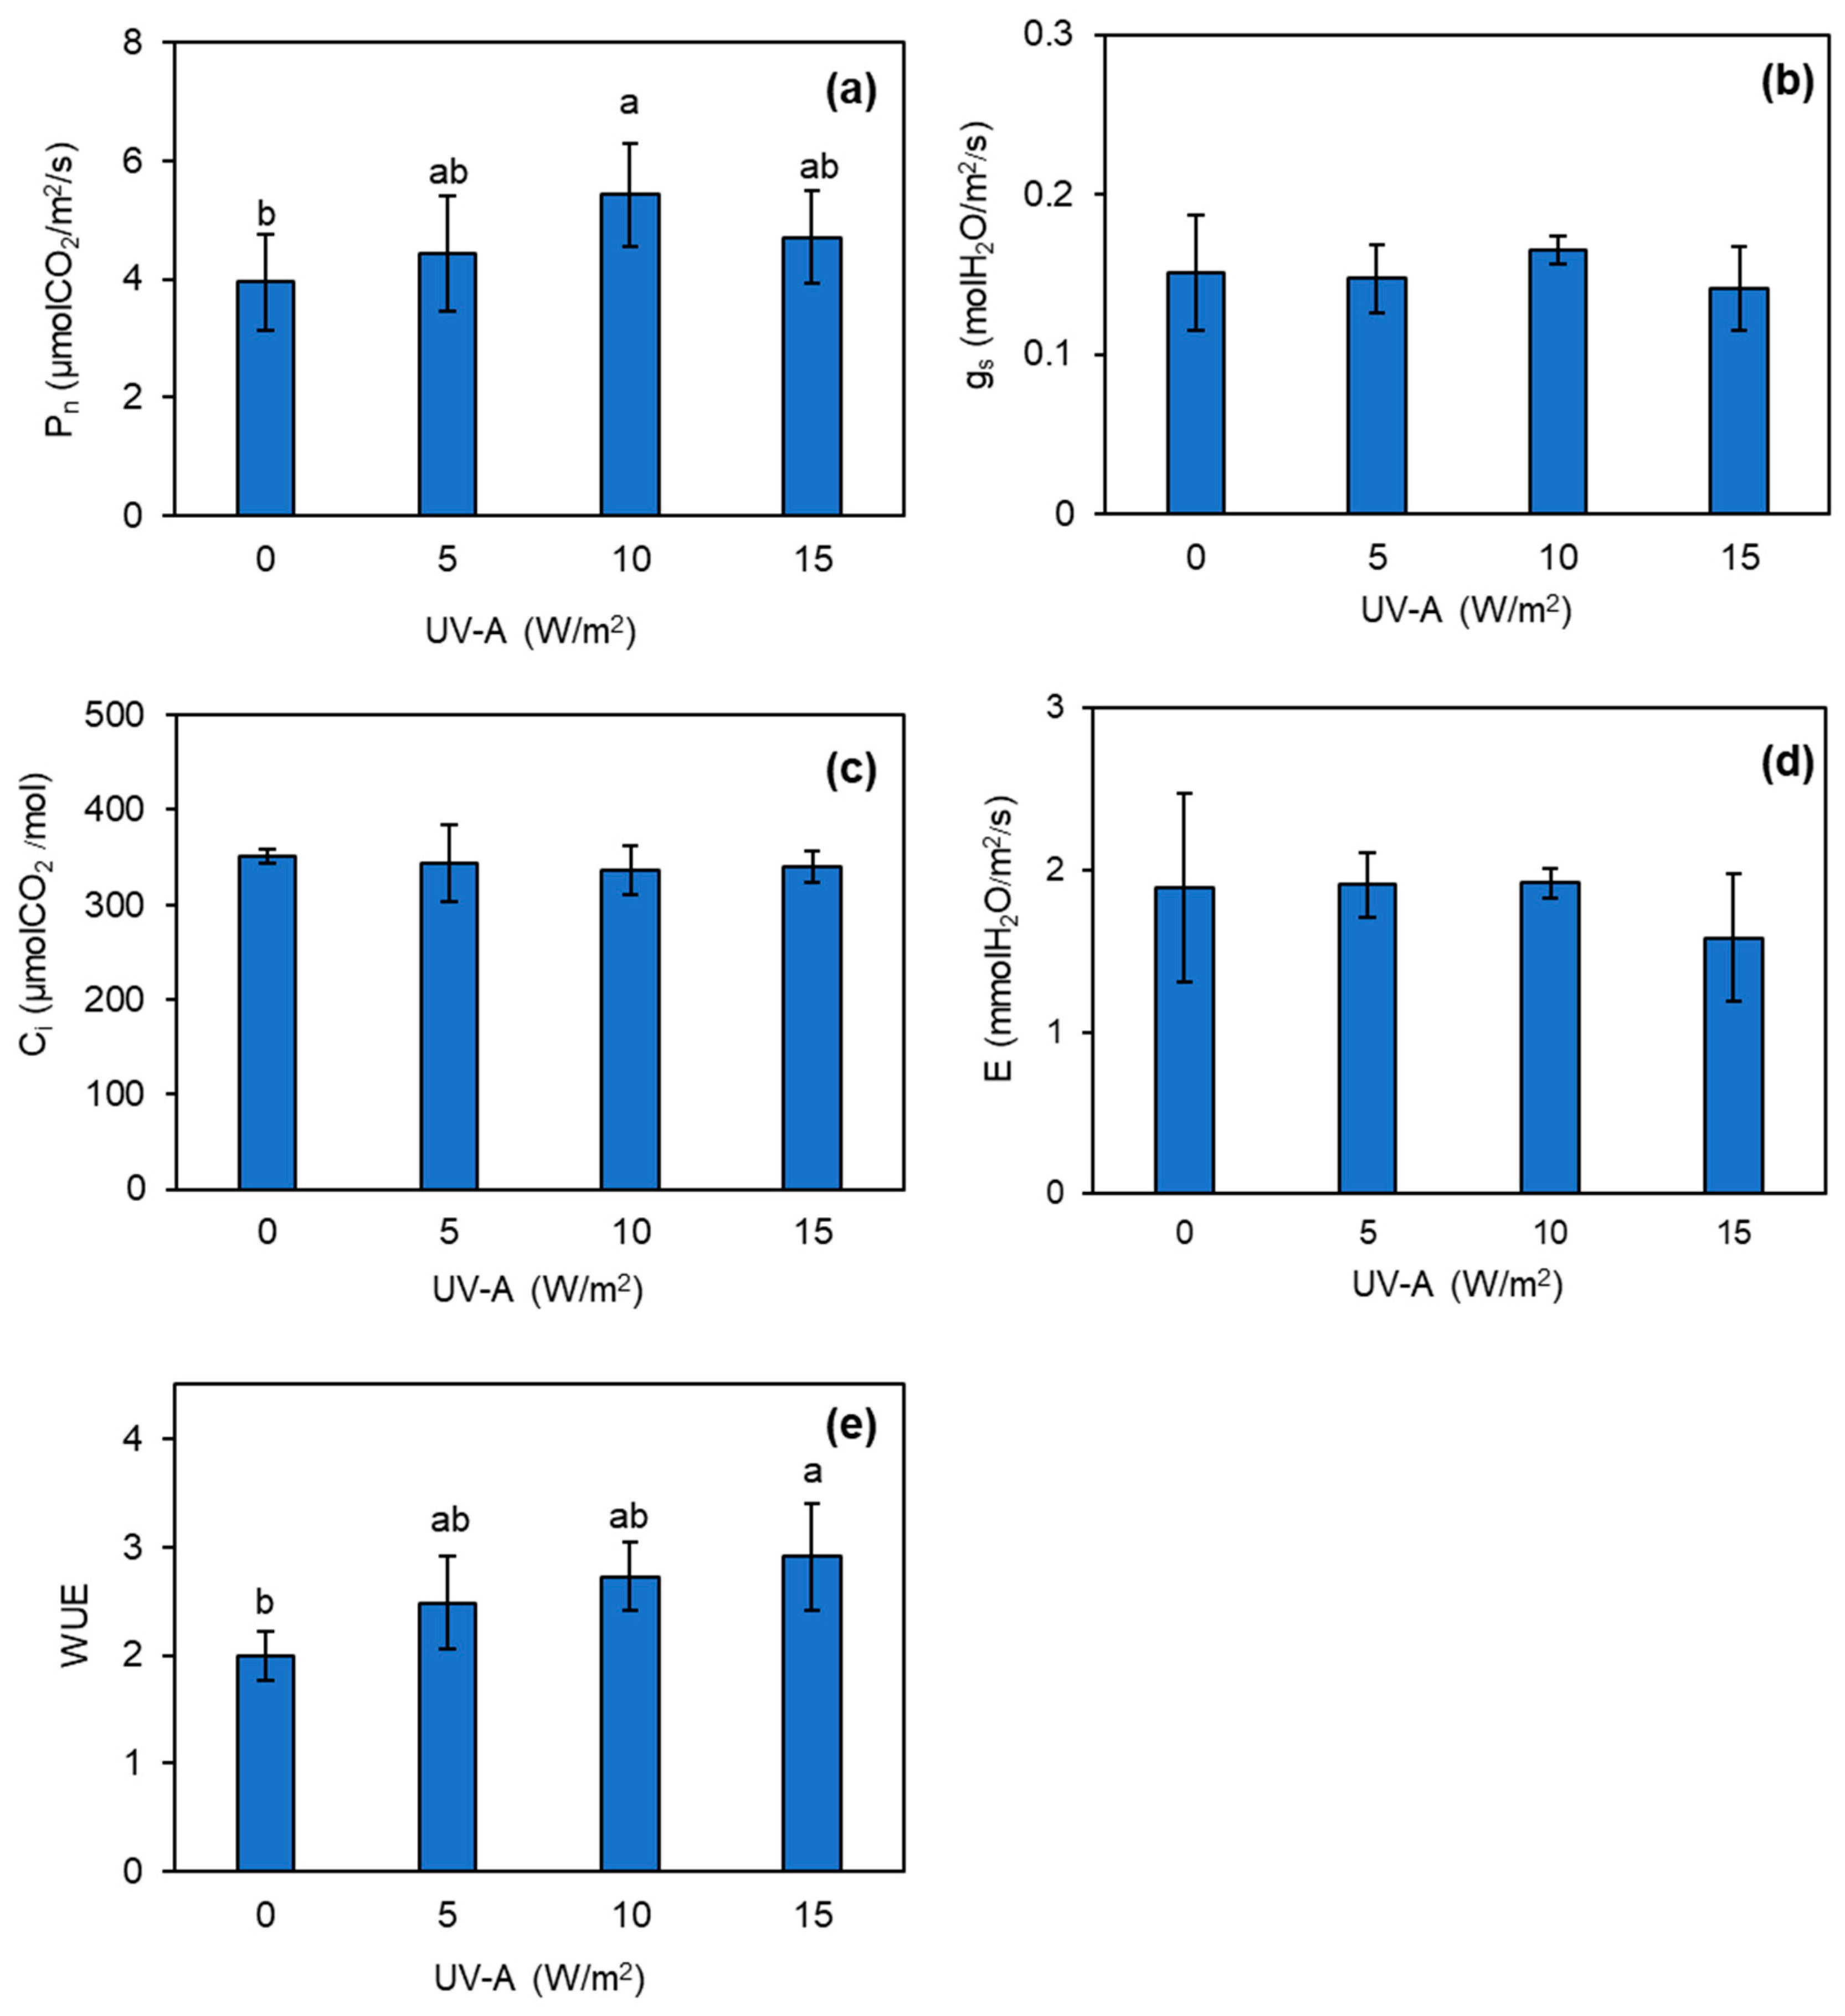
3.3. Changes in Photosynthetic Efficiency of Kale Plant Exposed to UV-A

The initial investigation into photosynthetic efficiency was performed prior to exposing the kale plants to UV-A. These results showed that there was no significant difference in any of the photosynthetic efficiency parameters (Figure S2). However, it became evident that all intensities of UV-A application increased the Pn values of kale. The 10 W/m2 UV-A application notably increased the Pn value by over 37% compared to the control (Figure 3a). Furthermore, 10 and 15 W/m2 UV-A supplementation tended to increase and significantly increase, respectively, the WUE in the kale plants (Figure 3e). However, the UV-A supplementation did not significantly affect the gs, E, and Ci values in the kale plants (Figure 3b–d).
The assessment of chlorophyll fluorescence was conducted to evaluate the efficiency of Photosystem II after the exposure of kale to UV-A. The results performed prior to the UV-A treatments showed that there was no significant difference in any of the chlorophyll fluorescence parameters (Figure S3). After the UV-A treatments were applied, the results indicated that 5 and 10 W/m2 UV-A levels increased the Y(II) values, whereas the increase in the UV-A intensity to 15 W/m2 tended to reduce the Y(II) values (Figure 4b). In addition, the qP values of the kale leaves exhibited a comparable pattern to that of Y(II). Specifically, 5 W/m2 UV-A supplementation significantly increased the qP value by about 20% compared to the control. Conversely, the 15 W/m2 UV-A treatment decreased the qP by about 20% compared to the control (Figure 4c). However, the UV-A supplementation had no clear effect in changing the values of Fv/Fm, NPQ, and ETR during this investigation (Figure 4a,d,e).

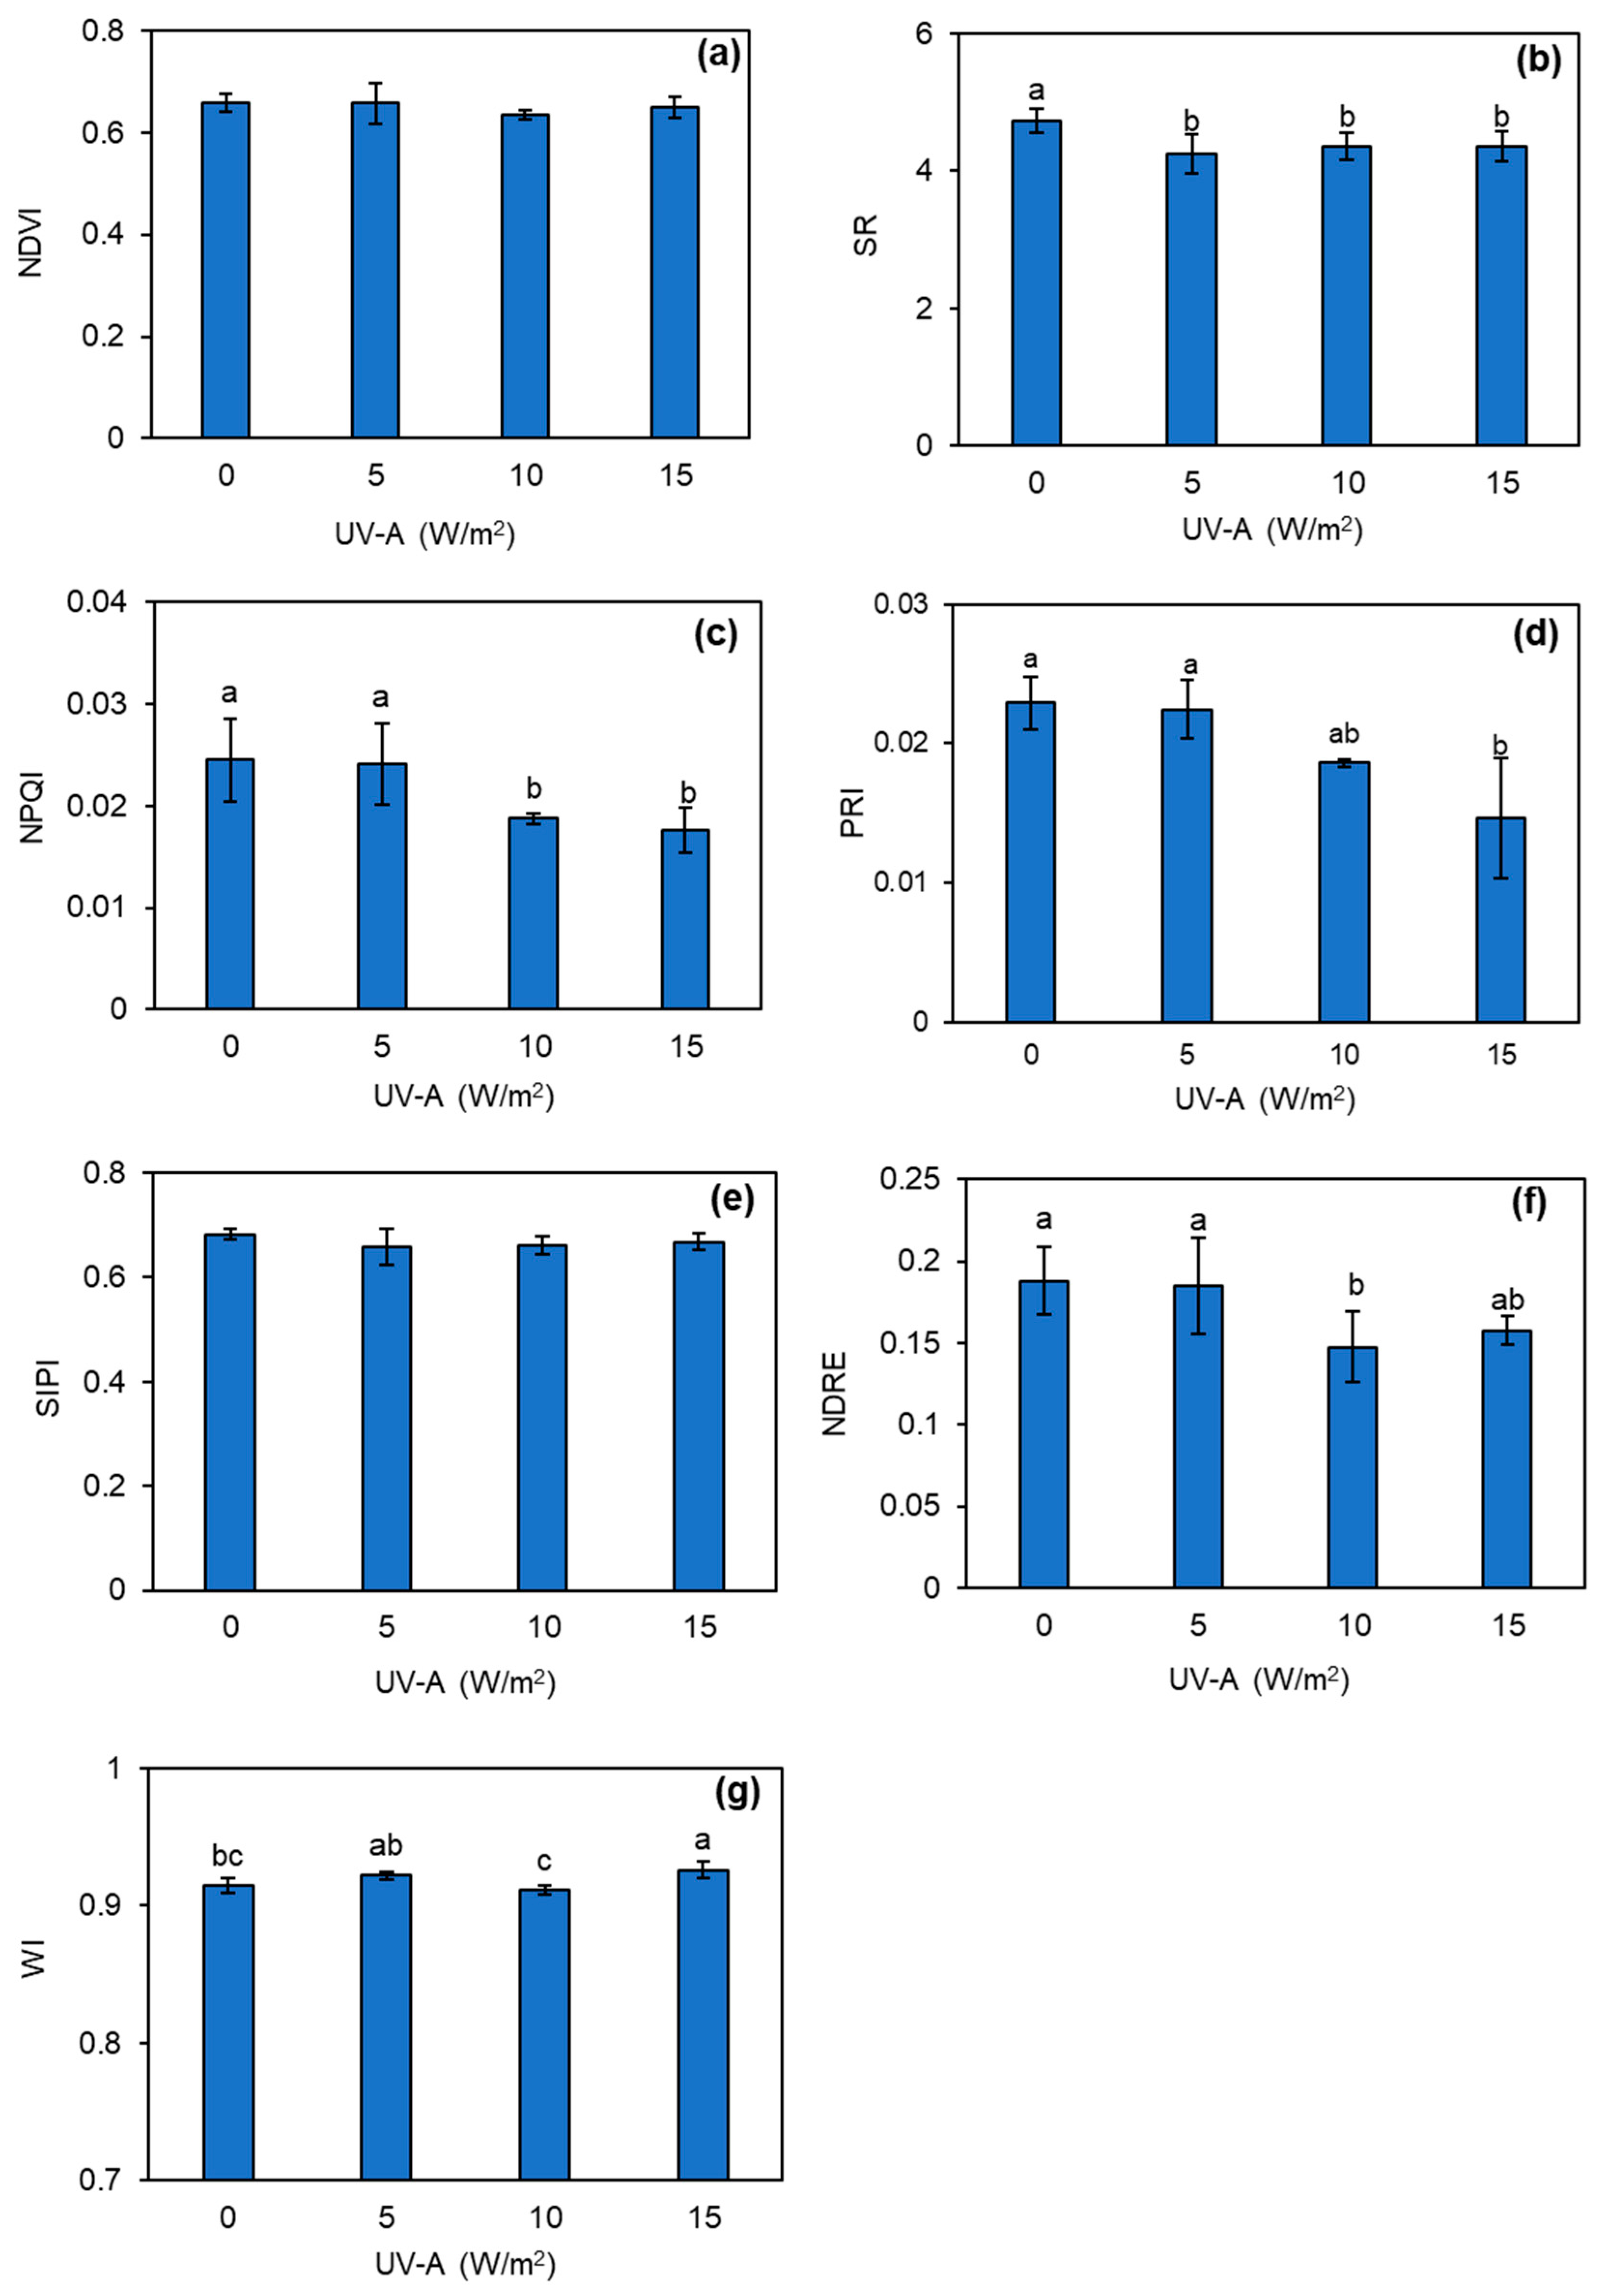
3.4. Changes in Leaf Spectral Indices of Kale Plant Treated with UV-A

The preliminary investigation during the pre-treatment period of UV-A revealed that there were no significant differences across all of the leaf spectral indices (NDVI, SR, NPQI, PRI, SIPI, NDRE, and WI) (Figure S4). However, the results of the leaf spectral indices after 5 days of UV-A treatment showed that the addition of UV-A had a significant impact on the changes in some spectral indices of kale leaves. The SR significantly declined when the kale was exposed to all intensities of UV-A (Figure 5b). In addition, the 10 and 15 W/m2 UV-A supplementation levels significantly decreased NPQI by approximately 20–28% compared to the control (Figure 5c). The PRI and NDRE values in kale plants also showed a downward trend when the UV-A intensity increased (Figure 5d,f). Supplemental UV-A at 15 W/m2 significantly increased the WI compared to the control (Figure 5g). However, the NDVI and SIPI values were not significantly different from varying the intensity of the UV-A treatment (Figure 5a,e).

3.5. Effect of UV-A on Phytonutrients and Nitrate Contents

The results showed that the application of UV-A increased the phytonutrients compared to the control. The total Vitamin C contents at all UV-A intensities were significantly higher than the control. The 10 W/m2 UV-A application provided the greatest increase in total Vitamin C content, being 2.6 times higher than the control (Figure 6a). The 10 and 15 W/m2 UV-A supplementation levels significantly enhanced the soluble protein content by 32.3% and 23.8% compared to the control (Figure 6b), and total phenolic contents also significantly increased when subjected to UV-A compared to the control. Among the tested UV-A intensities, the supplementation with 10 W/m2 UV-A produced the greatest increase in the total phenolics (by 56.7% compared to the control) (Figure 6c). On the other hand, the nitrate content of kale leaves was substantially reduced by 2.1–2.3 times after exposing the kale plants to UV-A at any of the tested intensities compared to no UV-A application (Figure 6d).

4. Discussion

The growth of the kale plants and their biomass were clear positive responses to the UV-A supplementation in this study (Table 1). The increase of growth and biomass by UV-A was caused from the activation in metabolic pathway [25] and the improvement of photosystem efficiency [26]. In addition, it was evident that the dry weight biomass of both the shoots and roots increased when exposed to UV-A supplementation. The validity of these dry weights as indicators of the actual biomass was confirmed by the determination of the proportion of fresh weight to dry weight across the entire yield. This proportion indicated the moisture influence on the observed biomass, with the results showing that the ratio of fresh-to-dry weight proportions of the 5 and 10 W/m2 UV-A treatments were lower than for the control and the 15 W/m2 treatments, respectively (Table 1). These results suggested that the total weight gain was not only affected by water content variations but also affected by others. Instead, the observed dry weight increase in this study may have been caused by the presence of other components, such as insoluble solids, insoluble proteins, and/or other structural organs in the biomass [27,28]. In the current study, the UV-A intensities of 5 and 10 W/m2 produced greater increases in the shoot fresh weight, stem height, and canopy width compared to the other intensities (Table 1). The application of UV-A that was lower or equal to 10 W/m2 onto plants was indicated as mild UV-A treatment, whereas UV-A higher than 20 W/m2 was considered as a high intensity of UV-A [29]. Therefore, it could be inferred that incorporating low-intensity UV-A supplementation was more appropriate for enhancing the growth and biomass of kale grown in plant factory settings. This result was consistent with a study where 10 W/m2 UV-A enhanced the biomass of Chinese kale baby leaves [10]. Furthermore, other studies have demonstrated the positive influence of UV-A on the enhancement of plant biomass in different plant species; for example, the increase of fresh and dry weight after supplementation with UV-A at 3 weeks after transplantation in lettuce [30] and sowthistle [31]. In addition, the application of 0.5 W/m2 UV-A for 40 days (30 min daily) increased dry mass in black gram [32].
UV-A has demonstrated its ability to enhance plant growth through the process of photosynthesis [11,33]. One of the positive effects might be closely linked to the change in the photosynthetic pigment contents. Studies have shown that UV-A rapidly increased the chlorophyll contents in radish [25], lettuce [34], and canola [35]. On the other hand, the pigment contents of eggplant leaves decreased after the plants had been treated with UV-A [36]. However, the current investigations identified no significant changes in the pigment contents, including chlorophyll a, chlorophyll b, and carotenoids (Table 2). As a result, there was no significant difference observed in the leaf greenness index (SPAD index), as shown in Table 2. This result was consistent with the findings of Ahandani et al. [37], who reported that the chlorophyll b content of Dracocephalum moldavica did not respond significantly to UV-A exposure. Similarly, the influence of UV-A radiation on the pigment contents of pepper did not produce any significant differences. Another study suggested that the observed impact on the pigment contents could more likely be attributed to UV-B and UV-C radiation than to UV-A radiation [38], perhaps because UV-B destroyed the chloroplast structure and enhanced chlorophyll degradation, as well as inhibiting chlorophyll synthesis more than UV-A [38]. Furthermore, the carotenoid content in plants exposed to UV-A more than 4 days tended to increase [39], leading to yellowish leaves, which was consistent with the increase of carotenoids after 5 days of UV-A treatment in this study (Table 2).
Numerous studies have focused on the impact of UV-B radiation on photosynthetic efficiency [40,41]. However, studies on the effects of isolated UV-A radiation remain limited. The results of the current study showed that exposure to a 10 W/m2 UV-A treatment resulted in an increase in the photosynthetic rate (Figure 3a), which could be attributed to the heightened light absorption capacity of plant leaves in terms of UV-A wavelength, enhancing the availability of light for photosynthesis. This becomes more pronounced under conditions of limited light availability [11,42]. In this study, kale plants were grown under 200 µmol/m2/s, which was lower than the light saturation point of kale plants (884–978 µmol/m2/s) [43]. Therefore, the UV-A supplementation in this time might help to increase the photosynthetic rate in kale plants. The enhancement of Pn following UV-A treatment in the current study was consistent with a study on sorghum that reported that UV-A and UV-B promoted the photosynthetic rate in certain cultivars [44]. The net carbon assimilation rate of barley was increased when exposed to UV-A radiation [33]. Furthermore, the supplementation of UV-A radiation exhibited an impact on water-use efficiency (Figure 3e). This observation suggests that kale plants have an improved ability to absorb and utilize water for growth and metabolic processes. Alternatively, it might indicate that the increased growth of kale resulted in a higher water uptake. In addition, there were no significant differences in the stomatal conductance and intercellular CO2 concentration following UV-A exposure. This suggests that an increase in the photosynthetic rate is not primarily influenced by the concentration of carbon dioxide. The study of four Mediterranean plant species (Daphne gnidium, Pistacia lentiscus, Ilex aquifolium, and Laurus nobilis) showed that UV-A did not affect gs under well watering conditions [45]. Therefore, UV-A supplementation in this time might not alter stomatal properties because kale plants are grown under enough water.
The comparable values of Fv/Fm between the untreated and UV-A treated plants suggested that the intensity of UV-A radiation did not induce stress on the plants since Fv/Fm values that were higher than 0.8 indicated that the plants were non-stressed [46]. According to Kolb et al. [47], the Fv/Fm values of grape leaves were not different between exposure to pure visible light and to UV-A + visible light. In the current study, the quantum efficiency of photosystem II (Y(II)) reached its peak at an intensity of 10 W/m2, which would be the optimal intensity for kale production. However, as the UV-A intensity increased to 15 W/m2, the efficiency of photosystem II declined (Figure 4b). The increase in Y(II) indicated that kale was able to absorb the UV-A for utilization in photosystem II, as evidenced by the increase in photochemical quenching (qP), as shown in Figure 4c, where qP is the fraction of absorbed light energy that is used for photochemistry in photosynthesis [19]. Photoreceptors that respond to UV-A might play a role in the signaling pathways that enhance PSII and photoprotective activities. Cryptochromes (CRY1 and CRY2), which is the blue-light-and-UV photoreceptor, plays the main photoreceptors regulating UV-A response in plants [48]. The activation of these photoreceptors might lead to a more efficient use of absorbed light energy. In addition, the NPQ and ETR were not different in this study. The intensities used in this study were mild UV-A intensities since they were lower than 20 W/m2 [29] and did not trigger significant changes in NPQ. ETR measures the rate of photosynthetic electron transport to produce ATP and NADPH [49]. Low intensities of UV-A might not directly interact with the electron transport chain components, resulting in little impact on ETR.
Leaf reflectance was measured to calculate the spectral indices. Some spectral indices could be related to plant biomass and plant stress. The NDVI and NDRE are generally applied to monitor environmental stress in plants [50,51], where a higher NDVI indicates that the plant is experiencing a non-stress condition [50]. In addition, it has been reported that some spectral indices could refer to phytonutrient contents, such as glucosinolates, with kale containing a high level of glucosinolates with high leaf reflectance at 425 nm [2]. Among spectral indices, the NPQI calculated from leaf reflectance at 415 and 435 nm was close to 425 nm. Furthermore, Soengas et al. [52] found that a low NPQI was associated with high glucosinolate contents. The current study found that supplementation with 10 and 15 W/m2 of UV-A resulted in lower values of NPQI than for the control (Figure 5c). This might indicate that UV-A could increase glucosinolate content in kale. Kale containing a high level of glucosinolate has been reported to have high leaf reflectance in the range of 700–1000 nm [2], which could be used to calculate various spectral indices, such as the NDVI, NDRE, SIPI, SR, and WI. The current study found that supplementation using 10 and 15 W/m2 of UV-A not only produced lower values for the NPQI but also for the SR, PRI, and NDRE than the control (Figure 5b–d,f). On the other hand, the addition of 15 W/m2 of UV-A significantly increased the WI compared to the control (Figure 5g). These results were consistent with Soengas et al. [52], who reported that kales containing high glucosinolates had low values for the PRI, NDVI, NDRE, SIPI, SR, and NPQI but had high WI values.
The phytochemical profiles of kale (total Vitamin C, soluble protein, and total phenolic contents) were notably impacted by UV-A supplementation, particularly at an intensity of 10 W/m2 (Figure 6a–c). Conversely, UV-A treatment reduced the nitrate content in the kale yield (Figure 6d). A study in pea sprouts noted that UV-A exposure induced the regulation of Vitamin C catabolism genes in plants, resulting in increased Vitamin C accumulation [53]. The increase of Vitamin C content induced by exposure to UV-A radiation provides the protective effect against heightened levels of reactive oxygen species (ROS) and DNA strand breaks [54]. In addition, the high Vitamin C accumulation affected by UV exposure was found in mung bean sprouts subjected to UV-B treatment [55]. This was also found in the investigation by He et al. [56] that studied the impact of UV-A supplementation in plant factory settings on lettuce production. Furthermore, the total phenolic had been reported to be higher after exposure to UV radiation in the tomatoes study [57]. Plants can produce more phenolic compounds when exposed to UV radiation since they play the role as a UV-absorbing substance, effectively protecting plant tissues from direct UV radiation and diminishing the infiltration of harmful UV radiation [58,59]. UV radiation has been reported to participate in the photolysis of nitrate ions [60], which could explain the reduction in nitrate content following exposure to UV treatments in this study (Figure 6d). These findings align with the research by He et al. [56], who examined the nitrate content of lettuce ‘Red butter’ grown in the plant factory was reduced following the increase of UV-A supplementation intensities. Nevertheless, it is important to note that the effect of UV-A on nitrate content might vary by different plant species. Furthermore, UV exposure could induce the production of stress proteins and activate defense mechanisms [61,62], resulting in temporary increases in soluble protein content as the plant responds to UV-induced stress. Additionally, it has been observed that there is an increase in soluble protein levels through the activation of antioxidant enzymes. These enzymes are crucial in mitigating the harmful effects of ROS induced by UV radiation exposure [63,64,65]. Therefore, the increase of soluble protein in kale after exposure to UV-A in this study might be caused because of these reasons.

5. Conclusions

Based on the significant increase in the growth, biomass, and phytochemical compositions, it is recommended that the 10 W/m2 UV-A supplementation could be the optimal approach for achieving high-quality kale production within the plant factory.

Supplementary Materials

The following supporting information can be downloaded at: https://www.mdpi.com/article/10.3390/horticulturae10070701/s1, Figure S1: Morphology of kale plants at 6 weeks after sowing; Figure S2: Changes in the gas exchange parameters; Figure S3: Changes in the quantum efficiency parameters; Figure S4: Changes in spectral indices; Table S1: Morphometrics and leaf greenness index of kale at 14 days before treating with different levels of UV-A.

Author Contributions

Conceptualization, W.S. and J.T.; Methodology, W.S. and J.T.; Validation, W.S. and J.T.; Formal analysis, W.S., P.T. and J.T.; Investigation, T.T. and M.K.; Resources, W.S. and P.T.; Data Curation, T.T. and J.T.; Writing—original draft preparation, W.S.; Writing—review and editing, J.T.; Project administration and funding acquisition, J.T.; Project consultant, P.B. All authors have read and agreed to the published version of the manuscript.

Funding

This research was supported by the Kasetsart University Research and Development Institute (KURDI), Bangkok, Thailand under Grant No. FF(S-KU)4.66.

Data Availability Statement

The original contributions presented in the study are included in the article and Supplementary Materials, further inquiries can be directed to the corresponding author.

Acknowledgments

We gratefully thank you the director of Kasetsart Agricultural and Agro- Industrial Product Improvement Institute (KAPI) to support us to do research at the Advanced Production with Artificial Light building.

Conflicts of Interest

The authors declare no conflicts of interest.

References

  1. Kim, M.J.; Chiu, Y.; Hindawi, K.K. Glucosinolates, carotenoids, and vitamins E and K variation from selected kale and collard cultivars. J. Food Qual. 2017, 2017, 5123572. [Google Scholar] [CrossRef]
  2. Chowdhury, M.; Kiraga, S.; Islam, M.N.; Ali, M.; Reza, M.N.; Lee, W.; Chung, S. Effects of temperature, relative humidity, and carbon dioxide concentration on growth and glucosinolate content of kale grown in a plant factory. Foods 2021, 10, 1524. [Google Scholar] [CrossRef] [PubMed]
  3. Terlaje, T.; Tuquero, J. Growing Kale Brassica oleracea; College of Natural & Applied Sciences (CNAS), University of Guam: Mangilao, GU, USA, 2019; pp. 1–5. [Google Scholar]
  4. Kozai, T.; Kubota, C.; Chun, C.; Afreen, F.; Ohyama, K. Necessity and concept of the closed transplant production system. In Transplant Production in the 21st Century, 1st ed.; Kubota, C., Chun, C., Eds.; Springer: Dordrecht, The Netherlands, 2000; pp. 3–19. [Google Scholar]
  5. Kopsell, D.A.; Kopsell, D.E.; Curran-Celentano, J. Carotenoid pigments in kale are influenced by nitrogen concentration and form. J. Sci. Food Agric. 2007, 87, 900–907. [Google Scholar] [CrossRef]
  6. Jiang, H.; Li, Y.; He, R.; Tan, J.; Liu, K.; Chen, Y.; Liu, H. Effect of supplemental UV-A intensity on growth and quality of kale under red and blue light. Int. J. Mol. Sci. 2022, 23, 6819. [Google Scholar] [CrossRef] [PubMed]
  7. Lefsrud, M.G.; Kopsell, D.A.; Augé, R.M.; Both, A.J. Biomass production and pigment accumulation in kale grown under increasing photoperiods. HortScience 2006, 41, 603–606. [Google Scholar] [CrossRef]
  8. Lefsrud, M.G.; Kopsell, D.A.; Sams, C.E. Irradiance from distinct wavelength light-emitting diodes affect secondary metabolites in kale. HortScience 2008, 43, 2243–2244. [Google Scholar] [CrossRef]
  9. Yoon, H.I.; Kim, H.Y.; Kim, J.; Son, J.E. Quantitative analysis of UV-B radiation interception and bioactive compound contents in kale by leaf position according to growth progress. Front. Plant Sci. 2021, 12, 667456. [Google Scholar] [CrossRef] [PubMed]
  10. He, R.; Gao, M.; Li, Y.; Zhang, Y.; Song, S.; Su, W.; Liu, H. Supplemental UV-A affects growth and antioxidants of Chinese kale baby-leaves in artificial light plant factory. Horticulturae 2021, 7, 294. [Google Scholar] [CrossRef]
  11. Verdaguer, D.; Jansen, M.A.; Llorens, L.; Morales, L.O.; Neugart, S. UV-A radiation effects on higher plants: Exploring the known unknown. Plant Sci. 2017, 255, 72–81. [Google Scholar] [CrossRef]
  12. Wellmann, E. UV radiation in photomorphogenesis. In Photomorphogenesis, 1st ed.; Shropshire, W., Mohr, H., Eds.; Springer: Berlin/Heidelberg, Germany, 1983; Volume 16, pp. 745–756. [Google Scholar]
  13. Roy, C.R.; Gies, H.P.; Lugg, D.J.; Toomey, S.; Tomlinson, D.W. The measurement of solar ultraviolet radiation. Mutat. Res. 1998, 422, 7–14. [Google Scholar] [CrossRef]
  14. Loconsole, D.; Santamaria, P. UV lighting in horticulture: A sustainable tool for improving production quality and food safety. Horticulturae 2021, 7, 9. [Google Scholar] [CrossRef]
  15. Lee, J.H.; Oh, M.M.; Son, K.H. Short-term ultraviolet (UV)-A light-emitting diode (LED) radiation improves biomass and bioactive compounds of kale. Front. Plant Sci. 2019, 10, 1042. [Google Scholar] [CrossRef]
  16. Wattanapreechanon, E.; Sukprasert, P. Development of soilless culture for crop production in Thailand. Kasetsart J. 2012, 33, 475–485. [Google Scholar]
  17. Porra, R.J.; Thomson, W.A.; Kriedemann, P.E. Determination of accurate extinction coefficients and simultaneous equations for assaying chlorophylls a and b extracted with four different solvents: Verification of the concentration of chlorophyll standards by atomic absorption spectroscopy. Biochim. Biophys. Acta 1989, 976, 384–394. [Google Scholar] [CrossRef]
  18. Wellburn, A.R. The spectral determination of chlorophyll a and b, as well total carotenoids, using various solvents with spectrophotometers of different resolution. J. Plant Physiol. 1994, 144, 307–313. [Google Scholar] [CrossRef]
  19. Maxwell, K.; Johnson, G.N. Chlorophyll fluorescence—A practical guide. J. Exp. Bot. 2000, 51, 659–668. [Google Scholar] [CrossRef] [PubMed]
  20. Photon Systems Instruments. Instruction Guide PolyPen RP410; PSI: Drásov, Czech Republic, 2023; pp. 5–6. [Google Scholar]
  21. Ağlar, E.; Saraçoğlu, O. Role of the foliar fertilization treatments on quality attributes of sweet cherry fruits (Prunus avium). Akademik Ziraat Dergisi 2018, 7, 131–136. [Google Scholar] [CrossRef]
  22. Parks, S.E.; Irving, D.E.; Milham, P.J. A critical evaluation of on-farm rapid tests for measuring nitrate in leafy vegetables. Sci. Hortic. 2012, 134, 1–6. [Google Scholar] [CrossRef]
  23. Bradford, M.M. A rapid and sensitive method for the quantitation of microgram quantities of protein utilizing the principle of protein-dye binding. Anal. Biochem. 1976, 7, 248–254. [Google Scholar] [CrossRef]
  24. Lourith, N.; Kanlayavattanakul, M.; Chanpirom, S. Free radical scavenging efficacy of Tamarind seed coat and its cosmetics application. J. Health Res. 2009, 23, 159–162. [Google Scholar]
  25. Tezuka, T.; Yamaguchi, F.; Ando, Y. Physiological activation in radish plants by UV-A radiation. J. Photochem. Photobiol. B 1994, 24, 33–40. [Google Scholar] [CrossRef]
  26. Gartia, S.; Pradhan, M.K.; Joshi, P.N.; Biswal, U.C.; Biswal, B. UV-A irradiation guards the photosynthetic apparatus against UV-B-induced damage. Photosynthetica 2003, 41, 545–549. [Google Scholar] [CrossRef]
  27. Adams, S.R.; Langton, F.A. Photoperiod and plant growth: A review. J. Hortic. Sci. Biotech. 2005, 80, 2–10. [Google Scholar] [CrossRef]
  28. Briggs, G. Inanimate Life, 1st ed; Milne Library Publishing: Geneseo, NY, USA, 2021; pp. 390–404. [Google Scholar]
  29. Kang, S.; Kim, J.E.; Zhen, S.; Kim, J. Mild-intensity UV-A radiation applied over a long duration can improve the growth and phenolic contents of sweet basil. Front. Plant Sci. 2022, 13, 858433. [Google Scholar] [CrossRef]
  30. Lee, M.J.; Son, J.E.; Oh, M.M. Growth and phenolic compounds of Lactuca sativa L. grown in a closed-type plant production system with UV-A, -B, or -C lamp. J. Sci. Food Agric. 2014, 94, 197–204. [Google Scholar] [CrossRef] [PubMed]
  31. Lee, M.; Son, J.E.; Oh, M. Growth and phenolic content of sowthistle grown in a closed-type plant production system with a UV-A or UV-B lamp. Hort. Environ. Biotechnol. 2013, 54, 492–500. [Google Scholar] [CrossRef]
  32. Jayakumar, M.; Amudha, P.; Kulandaivelu, G. Changes in growth and yield of Phaseolus mungo L. induced by UV-A and UV-B enhanced radiation. J. Plant Biol. 2003, 46, 59–61. [Google Scholar] [CrossRef]
  33. Štroch, M.; Materová, Z.; Vrábl, D.; Karlický, V.; Šigut, L.; Nezval, J.; Špunda, V. Protective effect of UV-A radiation during acclimation of the photosynthetic apparatus to UV-B treatment. Plant Physiol. Biochem. 2015, 96, 90–96. [Google Scholar] [CrossRef]
  34. Yongcheng, C.; Li, T.; Yang, Q.; Zhang, Y.; Zou, J.; Bian, Z.; Wen, X. UVA radiation is beneficial for yield and quality of indoor cultivated lettuce. Front. Plant Sci. 2019, 10, 1563. [Google Scholar]
  35. Tohidi-Moghadam, H.R.; Ghooshchi, F.; Jamshidpour, F.; Zahedi, H. Effect of UV radiation and elevated CO2 on physiological attributes of canola (Brassica napus L.) grown under water deficit stress. Polish J. Environ. Stud. 2012, 21, 1417–1427. [Google Scholar]
  36. Dáder, B.; Gwynn-Jones, D.; Moreno, A.; Winters, A.; Fereres, A. Impact of UV-A radiation on the performance of aphids and whiteflies and on the leaf chemistry of their host plants. J. Photochem. Photobiol. B 2014, 138, 307–316. [Google Scholar] [CrossRef]
  37. Ahandani, E.A.; Fazilati, M.; Boghozian, A.; Ahandani, M.A. Effect of ultraviolet (UV) radiation bonds on growth and chlorophyll content of Dracocephalum moldavica L. Herb. J. Biomol. Res. Ther. 2019, 8, 1000172. [Google Scholar]
  38. Mahdavian, K.; Kalantari, K.M.; Ghorbanli, M.; Torkzade, M. The effects of salicylic acid on pigment contents in ultraviolet radiation stressed pepper plants. Biol. Plant. 2008, 52, 170–172. [Google Scholar] [CrossRef]
  39. Badmus, U.O.; Crestani, G.; Cunningham, N.; Havaux, M.; Urban, O.; Jansen, M.A.K. UV radiation induces specific changes in the carotenoid profile of Arabidopsis thaliana. Biomolecules 2022, 12, 1879. [Google Scholar] [CrossRef]
  40. Teramura, A.H.; Sullivan, J.H. Effects of UV-B radiation on photosynthesis and growth of terrestrial plants. Photosynth. Res. 1994, 39, 463–473. [Google Scholar] [CrossRef]
  41. Lidon, F.J.; Reboredo, F.H.; Silva, M.M.A.; Duarte, M.P.; Ramalho, J.C. Impact of UV-B radiation on photosynthesis-an overview. Emir. J. Food Agric. 2012, 24, 546–556. [Google Scholar] [CrossRef]
  42. Mantha, S.V.; Johnson, G.A.; Day, T.A. Evidence from action and fluorescence spectra that UV-induced violet-blue-green fluorescence enhances leaf photosynthesis. Photochem. Photobiol. 2001, 73, 249–256. [Google Scholar]
  43. Erwin, J.; Gesick, E. Photosynthetic responses of swiss chard, kale, and spinach cultivars to irradiance and carbon dioxide concentration. HortScience 2017, 52, 706–712. [Google Scholar] [CrossRef]
  44. Kataria, S.; Guruprasad, K.N. Intraspecific variations in growth, yield and photosynthesis of sorghum varieties to ambient UV (280–400 nm) radiation. Plant Sci. 2012, 196, 85–92. [Google Scholar] [CrossRef] [PubMed]
  45. Llusia, J.; Llorens, L.; Bernal, M.; Verdaguer, D.; Penuelas, J. Effects of UV radiation and water limitation on the volatile terpene emission rates, photosynthesis rates, and stomatal conductance in four Mediterranean species. Acta Physiol. Plant. 2012, 34, 757–769. [Google Scholar] [CrossRef]
  46. Björkman, O.; Demmig, B. Photon yield of O2 evolution and chlorophyll fluorescence characteristics at 77 K among vascular plant of diverse origins. Planta 1987, 170, 489–504. [Google Scholar] [CrossRef]
  47. Kolb, C.A.; Kaser, M.A.; Kopecký, J.; Zotz, G.; Riederer, M.; Pfundel, E.E. Effects of natural intensities of visible and ultraviolet radiation on epidermal ultraviolet screening and photosynthesis in grape leaves. Plant Physiol. 2001, 127, 863–875. [Google Scholar] [CrossRef]
  48. Brelsford, C.C.; Morales, L.O.; Nezval, J.; Kotilainen, T.K.; Hartikainen, S.M.; Aphalo, P.J.; Robson, T.M. Do UV-A radiation and blue light during growth prime leaves to cope with acute high light in photoreceptor mutants of Arabidopsis thaliana? Physiol. Plant. 2019, 165, 537–554. [Google Scholar] [CrossRef]
  49. Rochaix, J. Regulation of photosynthetic electron transport. Biochim. Biophys. Acta Bioenerg. 2011, 1807, 375–383. [Google Scholar] [CrossRef]
  50. Gamon, J.; Peñuelas, J.; Field, C. A narrow-waveband spectral index that tracks diurnal changes in photosynthetic efficiency. Remote Sens. Environ. 1992, 41, 35–44. [Google Scholar] [CrossRef]
  51. Katsoulas, N.; Elvanidi, A.; Ferentinos, K.P.; Kacira, M.; Bartzans, T.; Kittas, C. Crop reflectance monitoring as a tool for water stress detection in greenhouses: A review. Biosyst. Eng. 2016, 151, 374–398. [Google Scholar] [CrossRef]
  52. Soengas, P.; Madloo, P.; Lema, M. Spectral reflectance indexes reveal differences in the physiological status of brassica oleracea with contrasting glucosinolate content under biotic stress. Plants 2023, 12, 2698. [Google Scholar] [CrossRef]
  53. Xu, Y.H.; Fu, X.; Lu, M.; Wei, B.D. A transcriptomic perspective on the effect of UV irradiation on vitamin C content in pea sprouts. Food Sci. Technol. 2022, 42, e09022. [Google Scholar] [CrossRef]
  54. He, Y.Y.; Häder, D.P. UV-B-induced formation of reactive oxygen species and oxidative damage of the cyanobacterium Anabaena sp.: Protective effects of ascorbic acid and N-acetyl-L-cysteine. J. Photochem. Photobiol. B 2002, 66, 115–124. [Google Scholar] [CrossRef]
  55. Wang, H.; Gui, M.; Tian, X.; Xin, X.; Wang, T.; Li, J. Effects of UV-B on vitamin C, phenolics, flavonoids and their related enzyme activities in mung bean sprouts (Vigna radiata). Int. J. Food Sci. Tech. 2017, 52, 827–833. [Google Scholar] [CrossRef]
  56. He, R.; Zhang, Y.; Song, S.; Su, W.; Hao, Y.; Liu, H. UV-A and FR irradiation improves growth and nutritional properties of lettuce grown in an artificial light plant factory. Food Chem. 2021, 345, 128727. [Google Scholar] [CrossRef] [PubMed]
  57. Luthria, D.L.; Mukhopadhyay, S.; Krizek, D.T. Content of total phenolics and phenolic acids in tomato (Lycopersicon esculentum Mill.) fruits as influenced by cultivar and solar UV radiation. J. Food Compos. Anal. 2006, 19, 771–777. [Google Scholar] [CrossRef]
  58. Valle, J.C.D.; Buide, M.L.; Whittall, J.B.; Valladares, F.; Narbona, E. UV radiation increases phenolic compound protection but decreases reproduction in Silene littorea. PLoS ONE 2020, 15, e0231611. [Google Scholar]
  59. Vanhaelewyn, L.; van der Straeten, D.; de Coninck, B.; Vandenbussche, F. Ultraviolet radiation from a plant perspective: The plant-microorganism context. Front. Plant Sci. 2020, 11, 597642. [Google Scholar]
  60. Sharpless, C.M.; Linden, K.G. UV photolysis of nitrate: Effects of natural organic matter and dissolved inorganic carbon and implications for UV water disinfection. Environ. Sci. Technol. 2001, 35, 2949–2955. [Google Scholar] [CrossRef]
  61. Nedunchezhian, N.; Annamalainathan, K.; Kulandaivelu, G. Induction of heat shock-like proteins in Vigna sinensis seedlings growing under ultraviolet-B (280–320 nm) enhanced radiation. Physiol. Plant. 1992, 85, 503–506. [Google Scholar]
  62. Kim, T.; Samraj, S.; Jiménez, J.; Gómez, C.; Liu, T.; Begcy, K. Genome-wide identification of heat shock factors and heat shock proteins in response to UV and high intensity light stress in lettuce. BMC Plant Biol. 2021, 21, 185. [Google Scholar]
  63. Rao, M.V.; Paliyath, G.; Ormrod, D.P. Ultraviolet-B- and ozone-induced biochemical changes in antioxidant enzymes of Arabidopsis thaliana. Plant Physiol. 1996, 110, 125–136. [Google Scholar]
  64. Erkan, M.; Wang, S.Y.; Wang, C.Y. Effect of UV treatment on antioxidant capacity, antioxidant enzyme activity and decay in strawberry fruit. Postharvest Biol. Technol. 2008, 48, 163–171. [Google Scholar]
  65. Berli, F.J.; Moreno, D.; Piccoli, P.; Hespanhol-Viana, L.; Silva, M.F.; Bresssan-Smith, R.; Cavagnaro, J.B.; Bottini, R. Abscisic acid is involved in the response of grape (Vitis vinifera L.) cv. Malbec leaf tissues to ultraviolet-B radiation by enhancing ultraviolet-absorbing compounds, antioxidant enzymes and membrane sterols. Plant Cell Environ. 2010, 33, 1–10. [Google Scholar]
Figure 1. Spectral profiles of LEDs with UV-A (315–400 nm) at 0 (a), 5 (b), 10 (c), and 15 (d) W/m2.
Horticulturae 10 00701 g001
Figure 2. Morphology of kale plants at 5 days after treatment with different intensities of UV-A.
Horticulturae 10 00701 g002
Figure 3. Changes in net photosynthetic rate (Pn) (a), stomatal conductance (gs) (b), intercellular CO2 concentration (Ci) (c), transpiration rate (E) (d), and water-use efficiency (WUE) (e) of kale grown under different levels of UV-A. Means with the same letter are not significantly different according to Tukey’s HSD test at p < 0.05. Data are means ± SD shown by vertical error bars.
Horticulturae 10 00701 g003
Figure 4. Changes in maximum quantum yield of PSII (Fv/Fm) (a), quantum efficiency of photosystem II (Y(II)) (b), photochemical quenching (qP) (c), non-photochemical quenching (NPQ) (d), and electron transport rate (ETR) (e) of kale grown under different levels of UV-A. Means with the same letter are not significantly different according to Tukey’s HSD test at p < 0.05. Data are means ± SD shown by vertical error bars.
Horticulturae 10 00701 g004
Figure 5. Changes in normalized difference vegetation index (NDVI) (a), simple ratio index (SR) (b), normalized phaeophytinization index (NPQI) (c), photochemical reflectance index (PRI) (d), structure insensitive pigment index (SIPI) (e), normalized difference red edge index (NDRE) (f), and water index (WI) (g) of kale grown under different levels of UV-A. Means with the same letter are not significantly different according to Tukey’s HSD test at p < 0.05. Data are means ± SD shown by vertical error bars.
Horticulturae 10 00701 g005
Figure 6. Contents of Vitamin C (a), soluble protein (b), total phenolics (c), and nitrates (d) of kale grown under different levels of UV-A. Means with the same letter are not significantly different according to Tukey’s HSD test at p < 0.05. Data are means ± SD shown by vertical error bars.
Horticulturae 10 00701 g006
Table 1. Morphometrics of kale grown under different levels of UV-A on day of harvest.
UV-A (W/m2)Shoot Fresh Weight (g)Root Fresh Weight (g)Shoot Dry Weight (g)Root Dry Weight (g)Fresh Weight/Dry WeightStem Height (cm)Canopy Width (cm)Stem Diameter (mm)Number of Leaves
0106.88 ± 22.31 b20.17 ± 3.89 ab7.98 ± 1.67 b1.08 ± 0.21 c14.02 ± 0.08 b36.80 ± 4.88 b44.00 ± 4.28 b8.37 ± 1.11 15.67 ± 2.16 ab
5143.84 ± 24.41 a24.88 ± 4.25 ab10.53 ± 1.79 a2.12 ± 0.36 a13.36 ± 0.02 c41.00 ± 3.41 ab46.67 ± 6.30 ab9.52 ± 2.04 16.50 ± 1.97 a
10157.90 ± 5.43 a17.58 ± 1.95 b11.72 ± 0.40 a1.69 ± 0.19 b13.09 ± 0.04 c44.82 ± 1.17 a54.54 ± 2.30 a9.13 ± 1.39 15.33 ± 1.63 ab
15111.73 ± 24.29 b15.40 ± 2.19 b6.08 ± 1.32 b1.23 ± 0.18 c17.39 ± 0.22 a41.80 ± 4.34 ab48.04 ± 7.15 ab9.02 ± 2.03 14.50 ± 0.55 b
Sig.*****************ns*
Data are means ± SD. Means with same lowercase letter are not significantly different according to Tukey’s HSD test. ns, * and *** indicate not significantly different at p < 0.05 and significantly different at p < 0.05 and 0.001, respectively.
Table 2. Photosynthetic pigments of kale grown under different levels of UV-A at harvesting day.
UV-A (W/m2)Leaf Greenness Index (SPAD Unit)Total Chl
(mg/gFW)
Chl a
(mg/gFW)
Chl b
(mg/gFW)
Chl a/b RatioCarotenoids
(mg/gFW)
043.13 ± 1.688.90 ± 1.566.32 ± 1.142.58 ± 0.442.45 ± 0.140.94 ± 0.41
541.08 ± 4.757.48 ± 0.675.52 ± 0.551.95 ± 0.172.83 ± 0.220.97 ± 0.08
1041.02 ± 1.367.60 ± 1.855.48 ± 1.342.12 ± 0.512.60 ± 0.211.03 ± 0.27
1543.55 ± 2.158.18 ± 0.765.96 ± 0.652.22 ± 0.152.68 ± 0.211.15 ± 0.16
Sig.nsnsnsnsnsns
Data are means ± SD. ns indicates not significantly different at p < 0.05.
Disclaimer/Publisher’s Note: The statements, opinions and data contained in all publications are solely those of the individual author(s) and contributor(s) and not of MDPI and/or the editor(s). MDPI and/or the editor(s) disclaim responsibility for any injury to people or property resulting from any ideas, methods, instructions or products referred to in the content.

