Article

Long-Term Evolution of the Climatic Factors and Its Influence on Grape Quality in Northeastern Romania

by
Roxana Mihaela Filimon
1,†,
Claudiu Ioan Bunea
2,†,
Răzvan Vasile Filimon
1,*,
Florin Dumitru Bora
3 and
Doina Damian
1
1
Research Development Station for Viticulture and Winemaking Iasi, 48 Mihail Sadoveanu Alley, 700490 Iasi, Romania
2
Department of Viticulture and Oenology, Faculty of Horticulture and Business in Rural Development, University of Agricultural Sciences and Veterinary Medicine Cluj-Napoca, 3-5 Mănăștur Street, 400372 Cluj-Napoca, Romania
3
Department of Viticulture and Oenology, Advanced Horticultural Research Institute of Transylvania, Faculty of Horticulture and Business in Rural Development, University of Agricultural Sciences and Veterinary Medicine Cluj-Napoca, 3-5 Mănăștur Street, 400372 Cluj-Napoca, Romania
*
Author to whom correspondence should be addressed.
These authors contributed equally to this work.
Horticulturae 2024, 10(7), 705; https://doi.org/10.3390/horticulturae10070705 (registering DOI)
Submission received: 3 June 2024 / Revised: 27 June 2024 / Accepted: 2 July 2024 / Published: 3 July 2024
(This article belongs to the Special Issue Orchard Management under Climate Change)

Abstract

:
Climate change is currently the greatest threat to the environment as we know it today. The present study aimed to highlight the changes in the main climatic elements during the last five decades (1971–2020) in northeastern Romania (Copou-Iaşi wine-growing center) and their impact on grape quality, as part of precision viticulture strategies and efficient management of grapevine plantations. Data analysis revealed a constant and significant increase in the average air temperature in the last 50 years (+1.70 °C), more pronounced in the last 10 years (+0.61 °C), with a number of days with extreme temperatures (>30 °C) of over 3.5-fold higher, in parallel with a fluctuating precipitation regime. The increase in average temperatures in the last 40 years was highly correlated with the advancement of the grape harvest date (up to 12 days), a significant increase in Vitis vinifera L. white grape sugar concentration (+15–25 g/L), and a drastic decrease in total acidity (−2.0–3.5 g/L tartaric acid). The significant increase in the values of the bioclimatic indices require the reclassification of the wine-growing area in higher classes of favorability, raising the opportunity to grow cultivars that are more suited to warmer climates, ensuring the efficiency of the plantation, and meeting current consumer expectations.

1. Introduction

Viticulture and wine production are ancient occupations that have accompanied humans for thousands of years. Currently, the world area under grapevines is estimated to be 7.2 mha, with the European Union (EU) being the world’s largest wine producer (144.5 mhL) and consumer (107 mhL; 48% of the world total volume) [1]. The latest international data highlight a decrease in the areas planted with grapevine in the interval 2001–2023, but especially the gradual decrease in wine production. In 2023, world wine production was estimated to be 237 mhL (−9.6% compared to 2022), a value that represents the smallest volume of wine recorded in the last 60 years [1]. Moreover, the OIV report mentioned that Italy, Spain, and Greece registered significant decreases in wine production compared to 2022 due to unfavorable weather conditions (extreme temperatures, along with flood and hail damage) that led to the appearance of downy mildew and severe droughts during the growing season [1]. These fluctuations are mainly attributed to climate changes, indicating a high variability and a lack of predictability in terms of grape yield and wine production.
In Romania, viticulture is a traditional occupation that appeared and evolved due to the favorable climate. Currently, Romania is one of the main wine-producing countries, occupying the 10th place in the world in terms of the area planted with grapevine. This represents over 187,000 ha, resulting, in 2023, in relatively large wine production of 4.6 mhl (+21.2% compared to 2022) [1]. In recent decades, the reality of climate change has been accepted by the majority of the scientific community [2]. As is often said, climate change is currently the greatest threat to the environment as we know it today, and we still do not know how things will evolve. Fortunately, grapevines managed to adapt to different climatic conditions, growing on six out of seven continents, in a large diversity of climates (mainly in the temperate climate of the northern hemisphere) [3]. However, climate plays a vital role in grapevine growing, influencing plant physiology, grape yield, and physico-chemical characteristics [3,4]. Each cultivar responds differently to climate change, being proof of grapevine plasticity and resilience to climate change [5].
The gradual warming of the climate affects the evolution of natural factors in the viticultural ecosystems; summers become hotter and drier, with longer autumns, shorter and excessive winters, more frequent periods of drought, and wet periods with excessive rain. Although it can adapt in time, at this point, the consequences for the grapevine are inevitable: compression of grapevine phenology, plants less prepared for the cold season and more sensitive to extreme temperatures, forced ripening of grapes, and advancement of harvest dates, the grapes being poor in their natural components [6,7,8]. As a result of global warming, the maintenance of grapevines on the perimeter of the traditional wine-growing regions remains a challenge for the producers, requiring the application of rigorous measures to protect or adapt the plants.
Climate change modifies the viticultural potential of vineyards, their specific wine styles, and even their limits [4]. In recent decades, several studies have highlighted the impact of climate change on viticulture [4,9,10,11], or how to adapt viticultural or winemaking practices under new climate conditions [12,13,14]. Most studies include the analysis of the risk factors under controlled conditions, and the design of favorability maps based on bioclimatic indices or statistical modeling, without the estimation of the economic impact and the real possibility of implementation of the proposed measures.
Jones et al. [9] suggested that growing season temperature indices can be effectively used to define vineyards’ climate, the impact of climate change being highly variable. In a certain vineyard, climatic conditions vary from one year to the other, inducing the “vintage effect”, respectively, annual changes in yield, quality, and wine typicity [12]. Wine-growing regions are characterized by a particular climate, which determines the use of specific cultivars and viticultural practices [3]. In the same context, the French term “terroir” is used to describe the environmental factors and farming practices that affect a crop’s phenotype, providing distinctive characteristics to the final product [15,16]. Climate plays an important role in the terroir concept, but current climate changes modify the known conditions, leading to a change in the terroir perception.
Jones et al. [9] showed that the mean air temperatures in the growing season increased by 1.3 °C between 1950 and 1999 and 1.7 °C from 1950 to 2004 for the main viticultural areas of the world. Certainly, in some northern areas, climate change may be beneficial for viticulture, allowing grape maturation. Still, most of the world’s vineyards will suffer due to warming and extreme climatic events, the producers being forced to find new cultivation strategies, including cultivars better adapted to the new conditions or relocation [3,17].
Among climate change-related effects are often mentioned advanced harvest data, increased grape sugar content (which leads to higher alcohol levels in wine), lower acidity, and modification of varietal aroma compounds [10]. Over time, the alcohol content of wine has evolved progressively, a trend related to climate change, respectively, to the gradual increase in air temperatures, which led to increasing sugar amounts in grapes [18,19]. In the general context of functional food consumption and healthy nutrition concept, a higher sugar content of grapes means wines with an increased alcohol content that are no longer in line with current consumer requirements [18,20,21]. High temperatures favor the degradation of grape acidity, modifying the sensory profile of the final wine [3,22]. Moreover, must and wine acidity corrections are more often necessary in recent years [23].
Global surface temperature was 1.09 °C higher in 2011–2020 than 1850–1900, with larger increases over land than over the ocean [24]. Temperatures in Europe have increased more than twice the global average over the past 30 years, the highest of any continent [25]. Moreover, over the 1991–2021 period, temperatures in Europe have warmed significantly, with about +0.5 °C per decade [25]. Recent scientific studies carried out in Romania indicate an expansion of the area of the suitability of grapevine culture by about 2.4 million ha, an increase in favorable altitude by approx. 180 m (to a maximum of 835 m), and a northward extension of the area of favorability by about 0.036° [4]. At the same time, the climatic suitability for the cultivation of white wine grape cultivars has decreased, the respective regions becoming more favorable for the cultivation of red wine cultivars that require higher temperatures and longer time intervals for the phenolic maturation of the grapes.
In the Romanian viticultural landscape, the wine-growing area of Moldavia occupies a very important place. Located in the northeast of Romania, the Iaşi wine-growing region is one of the oldest in the country and includes the Copou-Iaşi wine-growing center, located in the east-northeast of the Moldavian Plateau, in the area where the parallel of 47°10′ north latitude meets the meridian of 27°35′ east longitude. In the Copou-Iaşi wine-growing center, white wines represent the main direction of production, the largest areas being currently occupied by the cultivars Fetească albă, Fetească regală, Aligoté, Muscat Ottonel, Sauvignon blanc, and Chardonnay. In the east of Romania, the climate conditions are influenced by the Siberian anticyclone in the cold season and by the Asiatic cyclone during summer [26]. According to the Köppen–Geiger classification, the climate is currently characterized as humid continental, estimated by Beck et al. [27] to become a humid subtropical climate by 2100. Considering that climatic factors determine the wine-growing area and set the production directions, the current study aimed at highlighting the changes in the main climatic elements during the last five decades (1971–2020) in the vineyards of N-E Romania and their impact on sugar accumulation and total acidity reduction in grapes of some white wine cultivars (Vitis vinifera L.), as part of precision viticulture strategies and efficient management of actual grapevine plantations. In the context of the climate changes, it is necessary to continuously evaluate vineyards’ climate suitability and promote cultivars that correspond to the new climatic conditions that are better adapted and will maintain high production and satisfy consumer demands.

2. Materials and Methods

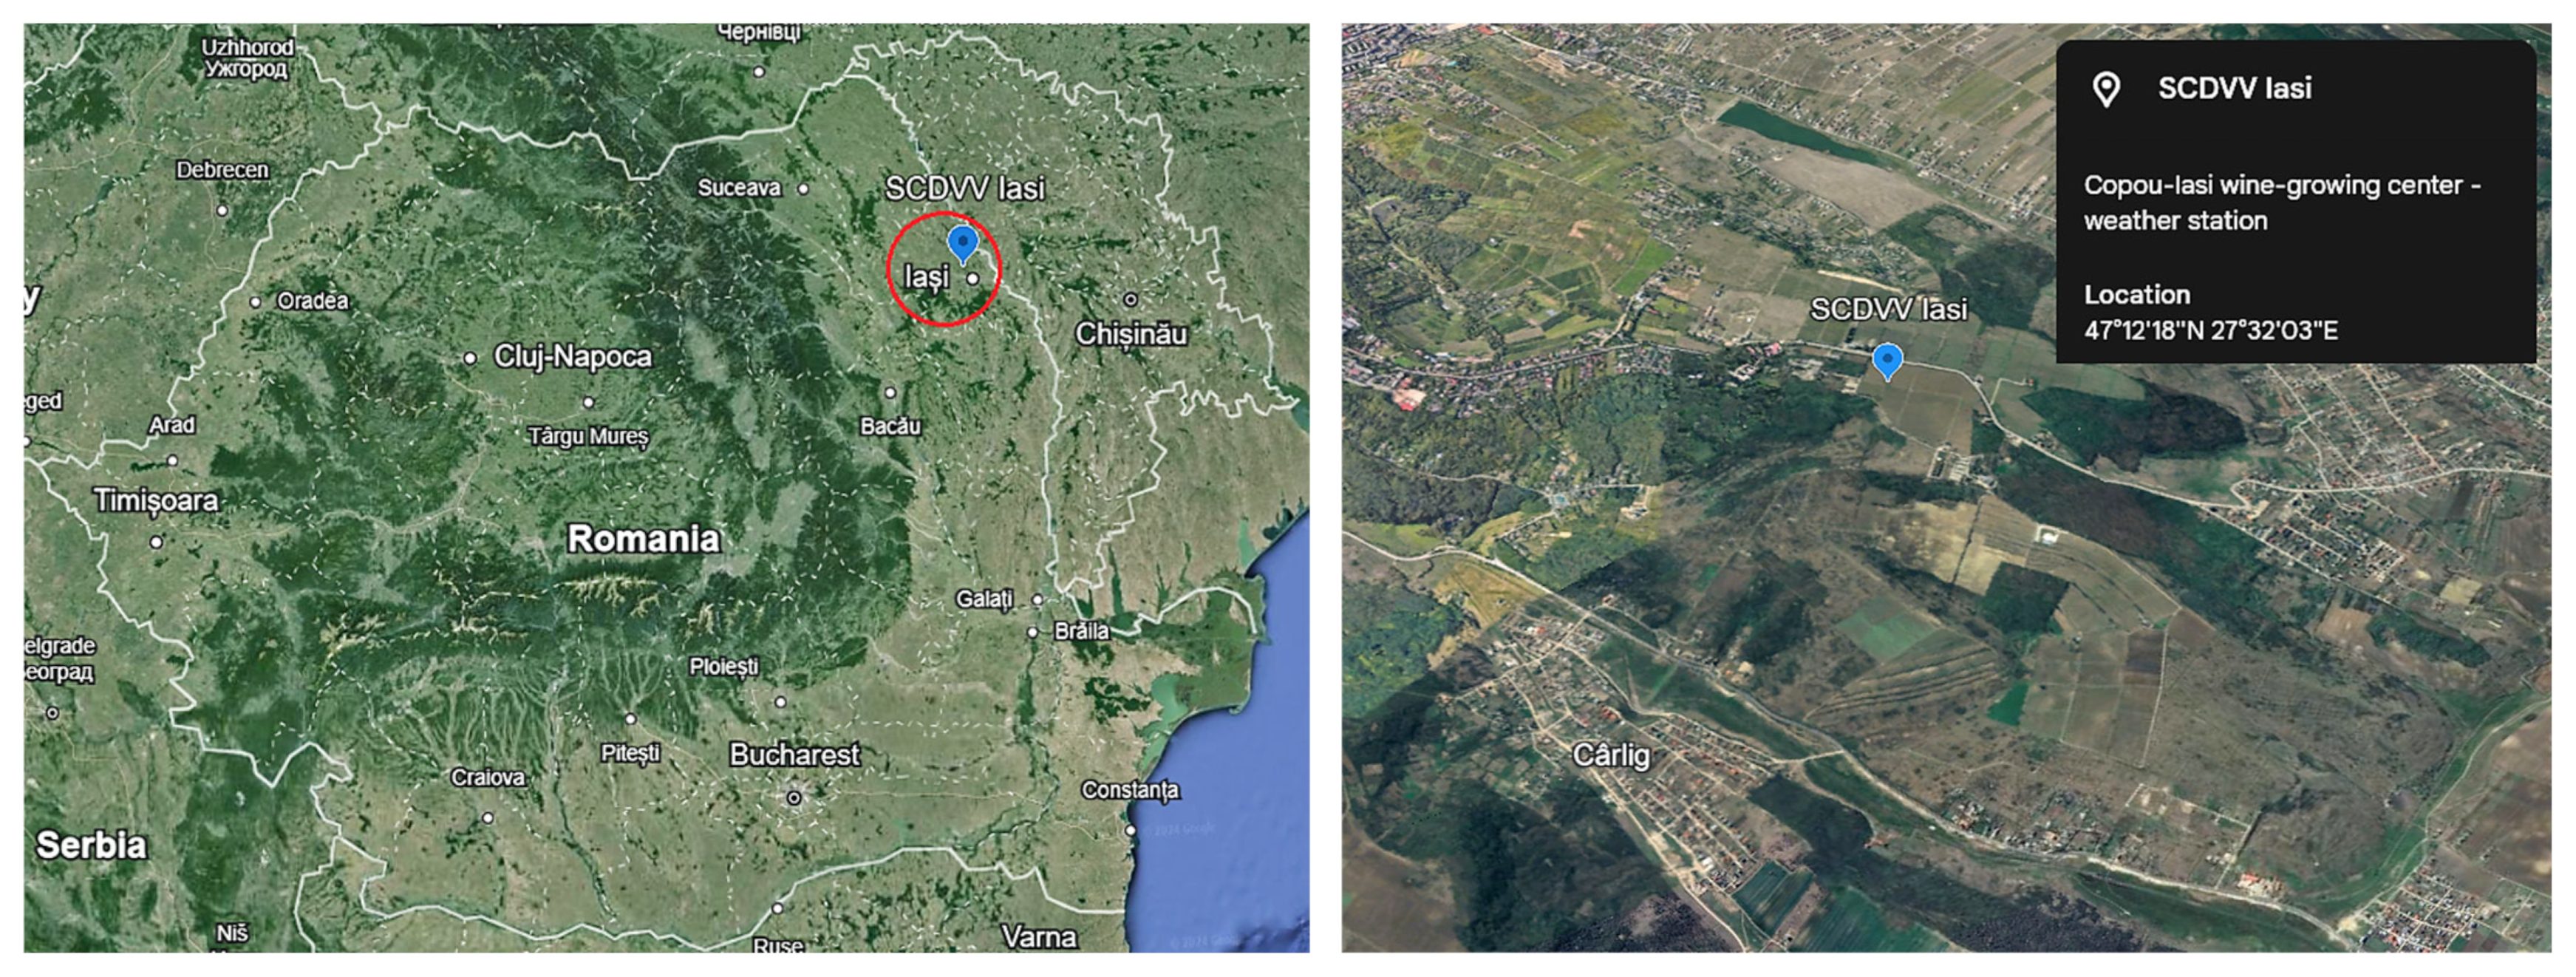
2.1. Climate Data Collection

The study was carried out on the grapevine plantations of the Research and Development Station for Viticulture and Winemaking Iasi (Copou-Iaşi wine-growing center, Iasi wine-growing region, NE of Romania), being focused on the analysis of the evolution of climatic factors in the period 1971–2020 (50 years). To allow data interpretation, the analyzed period was divided into five decades: 1971–1980, 1981–1990, 1991–2000, 2001–2010, and 2011–2020. The meteorological data were recorded daily using an AgroExpert® weather station generation 1 (Metrilog Systems, Bucharest, Romania) located in the experimental field (47°12′18″ N, 27°32′03″ E; at 191 m altitude) (Figure 1), connected to a computer.

2.2. Studied Parameters and Bioclimatic Indices

To highlight the climate changes, the following parameters were calculated: annual average temperature, growing season (April 1 to September 30) average temperature, annual precipitations, growing season precipitations, number of days with temperatures > 30 °C and with temperatures >35 °C, number of days with temperatures lower than −2 °C (spring frost) and –15 °C (winter frost), the sum of positive temperatures (Σt°g; the sum of average daily temperatures > 0 °C during the growing season (01.04–31.09)), the sum of active temperatures (Σt°a; the sum of growing season average temperatures >10 °C), and the sum of effective temperatures (Σt°u; the sum of differences between average daily temperatures > 10 °C and biological threshold for grapevine (10 °C)). To assess the heliothermic and water resources of the area, we calculated the hydrothermal coefficient (HC; the ratio between the growing season average precipitations and the sum of active temperatures, multiplied by 10) [29], De Martonne aridity index (IDM; the ratio between average annual precipitation and annual mean temperature plus 10) [30], actual heliothermal index (IHr; the result of multiplication of the growing season hours of real insolation and the Σt°u, multiplied by 106) [31], grapevine bioclimatic index (Ibcv; the ratio between the real insolation multiplied by Σt°a, and growing season precipitations multiplied by the number of days in the growing season with average temperatures >10 °C, divided by 10) [32], the oenoclimatic aptitude index (IAOe; the sum of real insolation and Σt°a, from which is subtracted the growing season average precipitations and 250) [33], the Huglin heliothermal index (HI; the sum of the growing season maximum temperature minus 10 and the growing season minimum temperature minus 10, divided by 2 and multiplied by the length of daylight hours coefficient—varying from 1.02 to 1.06 between 40° and 50° latitude) [34], the Winkler index (WI; the sum of daily average temperatures above 10 °C, from April 1 to October 31) [35], the cool night index (the average minimum temperatures of September, in the Northern Hemisphere) [36]. The values are shown as a 10-year average (decade average), with the multiannual average value (50 years) for each analyzed parameter also being presented.

2.3. Grapevine Cultivars and Growing Conditions

Two autochthonous Vitis vinifera L. cultivars for white wines (Fetească Albă and Fetească Regală), and two Vitis vinifera L. international cultivars for white wines (Aligoté and Muscat Ottonel), widely planted in most of the major wine-producing regions in Romania, were monitored for 40 years (1981–2020) in terms of sugar content and total acidity of grapes at ripening. All four cultivars are growing in the grapevine plantations of the Research and Development Station for Viticulture and Winemaking Iaşi; planting distances were 2.2 between rows and 1.2 m between plants, in the semi-high trunk system (80 cm), Guyot training system, with plants grafted on SO4 rootstock (Vitis berlandieri × Vitis riparia). The soil is cambic chernozem with a clayey–loamy texture (pH 6.8). The elevation is 150–160 m, S-SW, 6–7% slope, and N-S row orientation. The main applied agrotechnical operations were specific to the standard grapevine growing technology (manual pruning, weeding, and harvesting). Grape maturity and harvest date were established according to Eichhorn–Lorenz phenological stages (EL 38—berries ripe for harvest) [37], by weekly determination of sugar and total acidity concentrations.

2.4. Chemical Determinations

Grape must sugar (g/L), equated according to the total soluble solids content (digital refractometer HI96801, Hanna Instruments, Cluj Napoca, Romania), and total acidity (g/L as tartaric acid) were determined using the standard methods specified in the OIV Compendium of International Methods of Wine and Must Analysis [38].

2.5. Statistical Procedures

The one-way analysis of variance (ANOVA) was used to determine the statistically significant differences between the groups of data (n = 10) in XLSTAT 2021.5.1 for Microsoft® Excel 2019. The method used to discriminate among the means was Tukey’s test at 95% confidence level. Values noted with the same letter indicate statistically non-significant differences (p > 0.05). Regression analysis was performed to look for relationships between data (Microsoft® Excel; data analysis) (Pearson correlation). Principal Component Analysis and Agglomerative Hierarchical Clustering (Ward’s method) were performed to investigate data group formation using the XLSTAT 2021.5.1 statistical software.

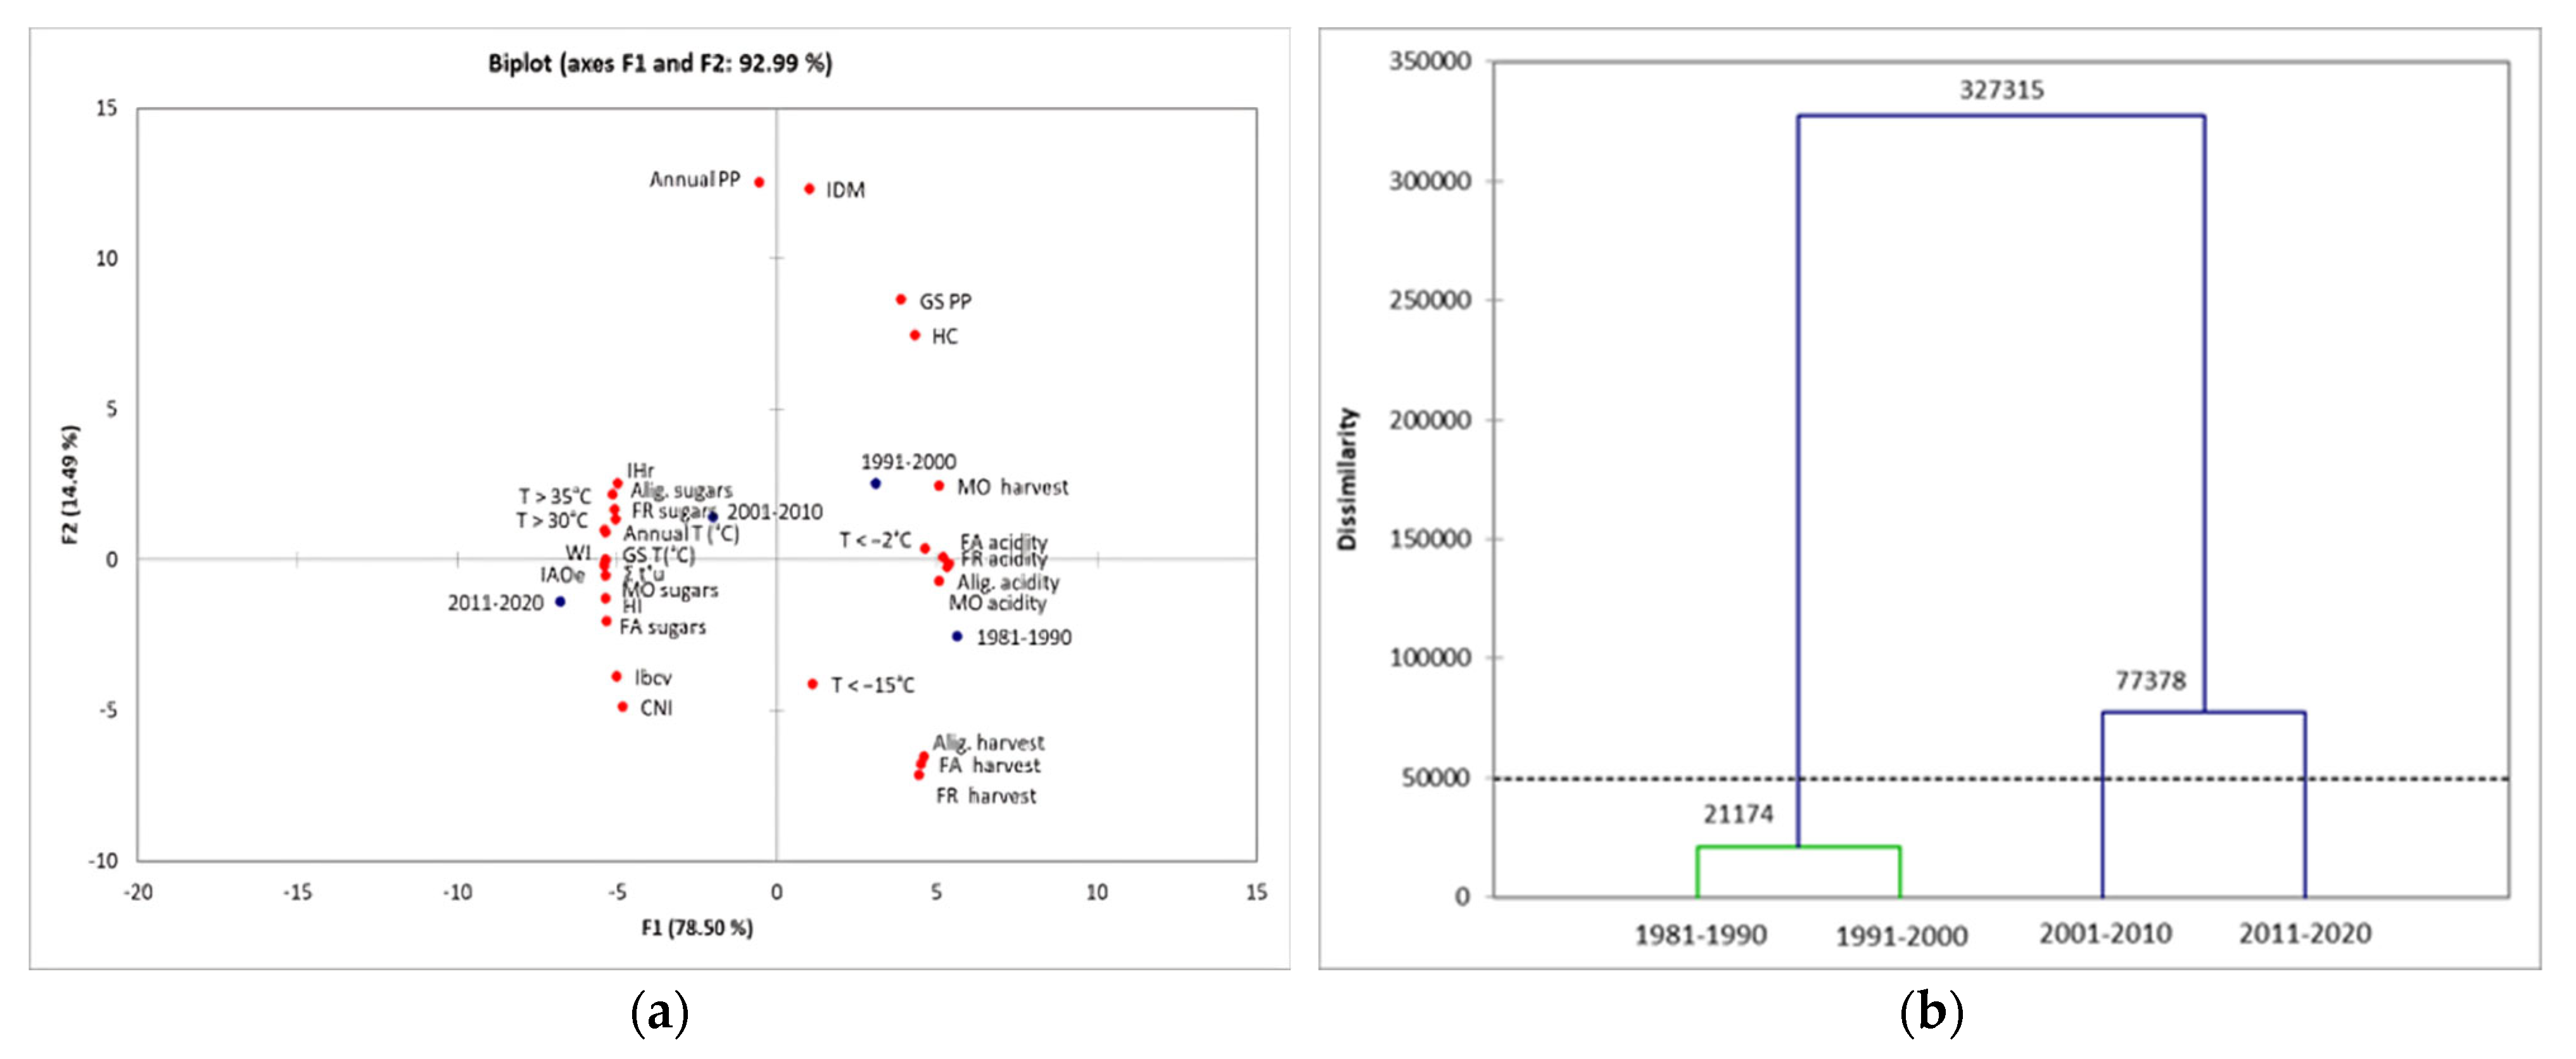
3. Results and Discussion

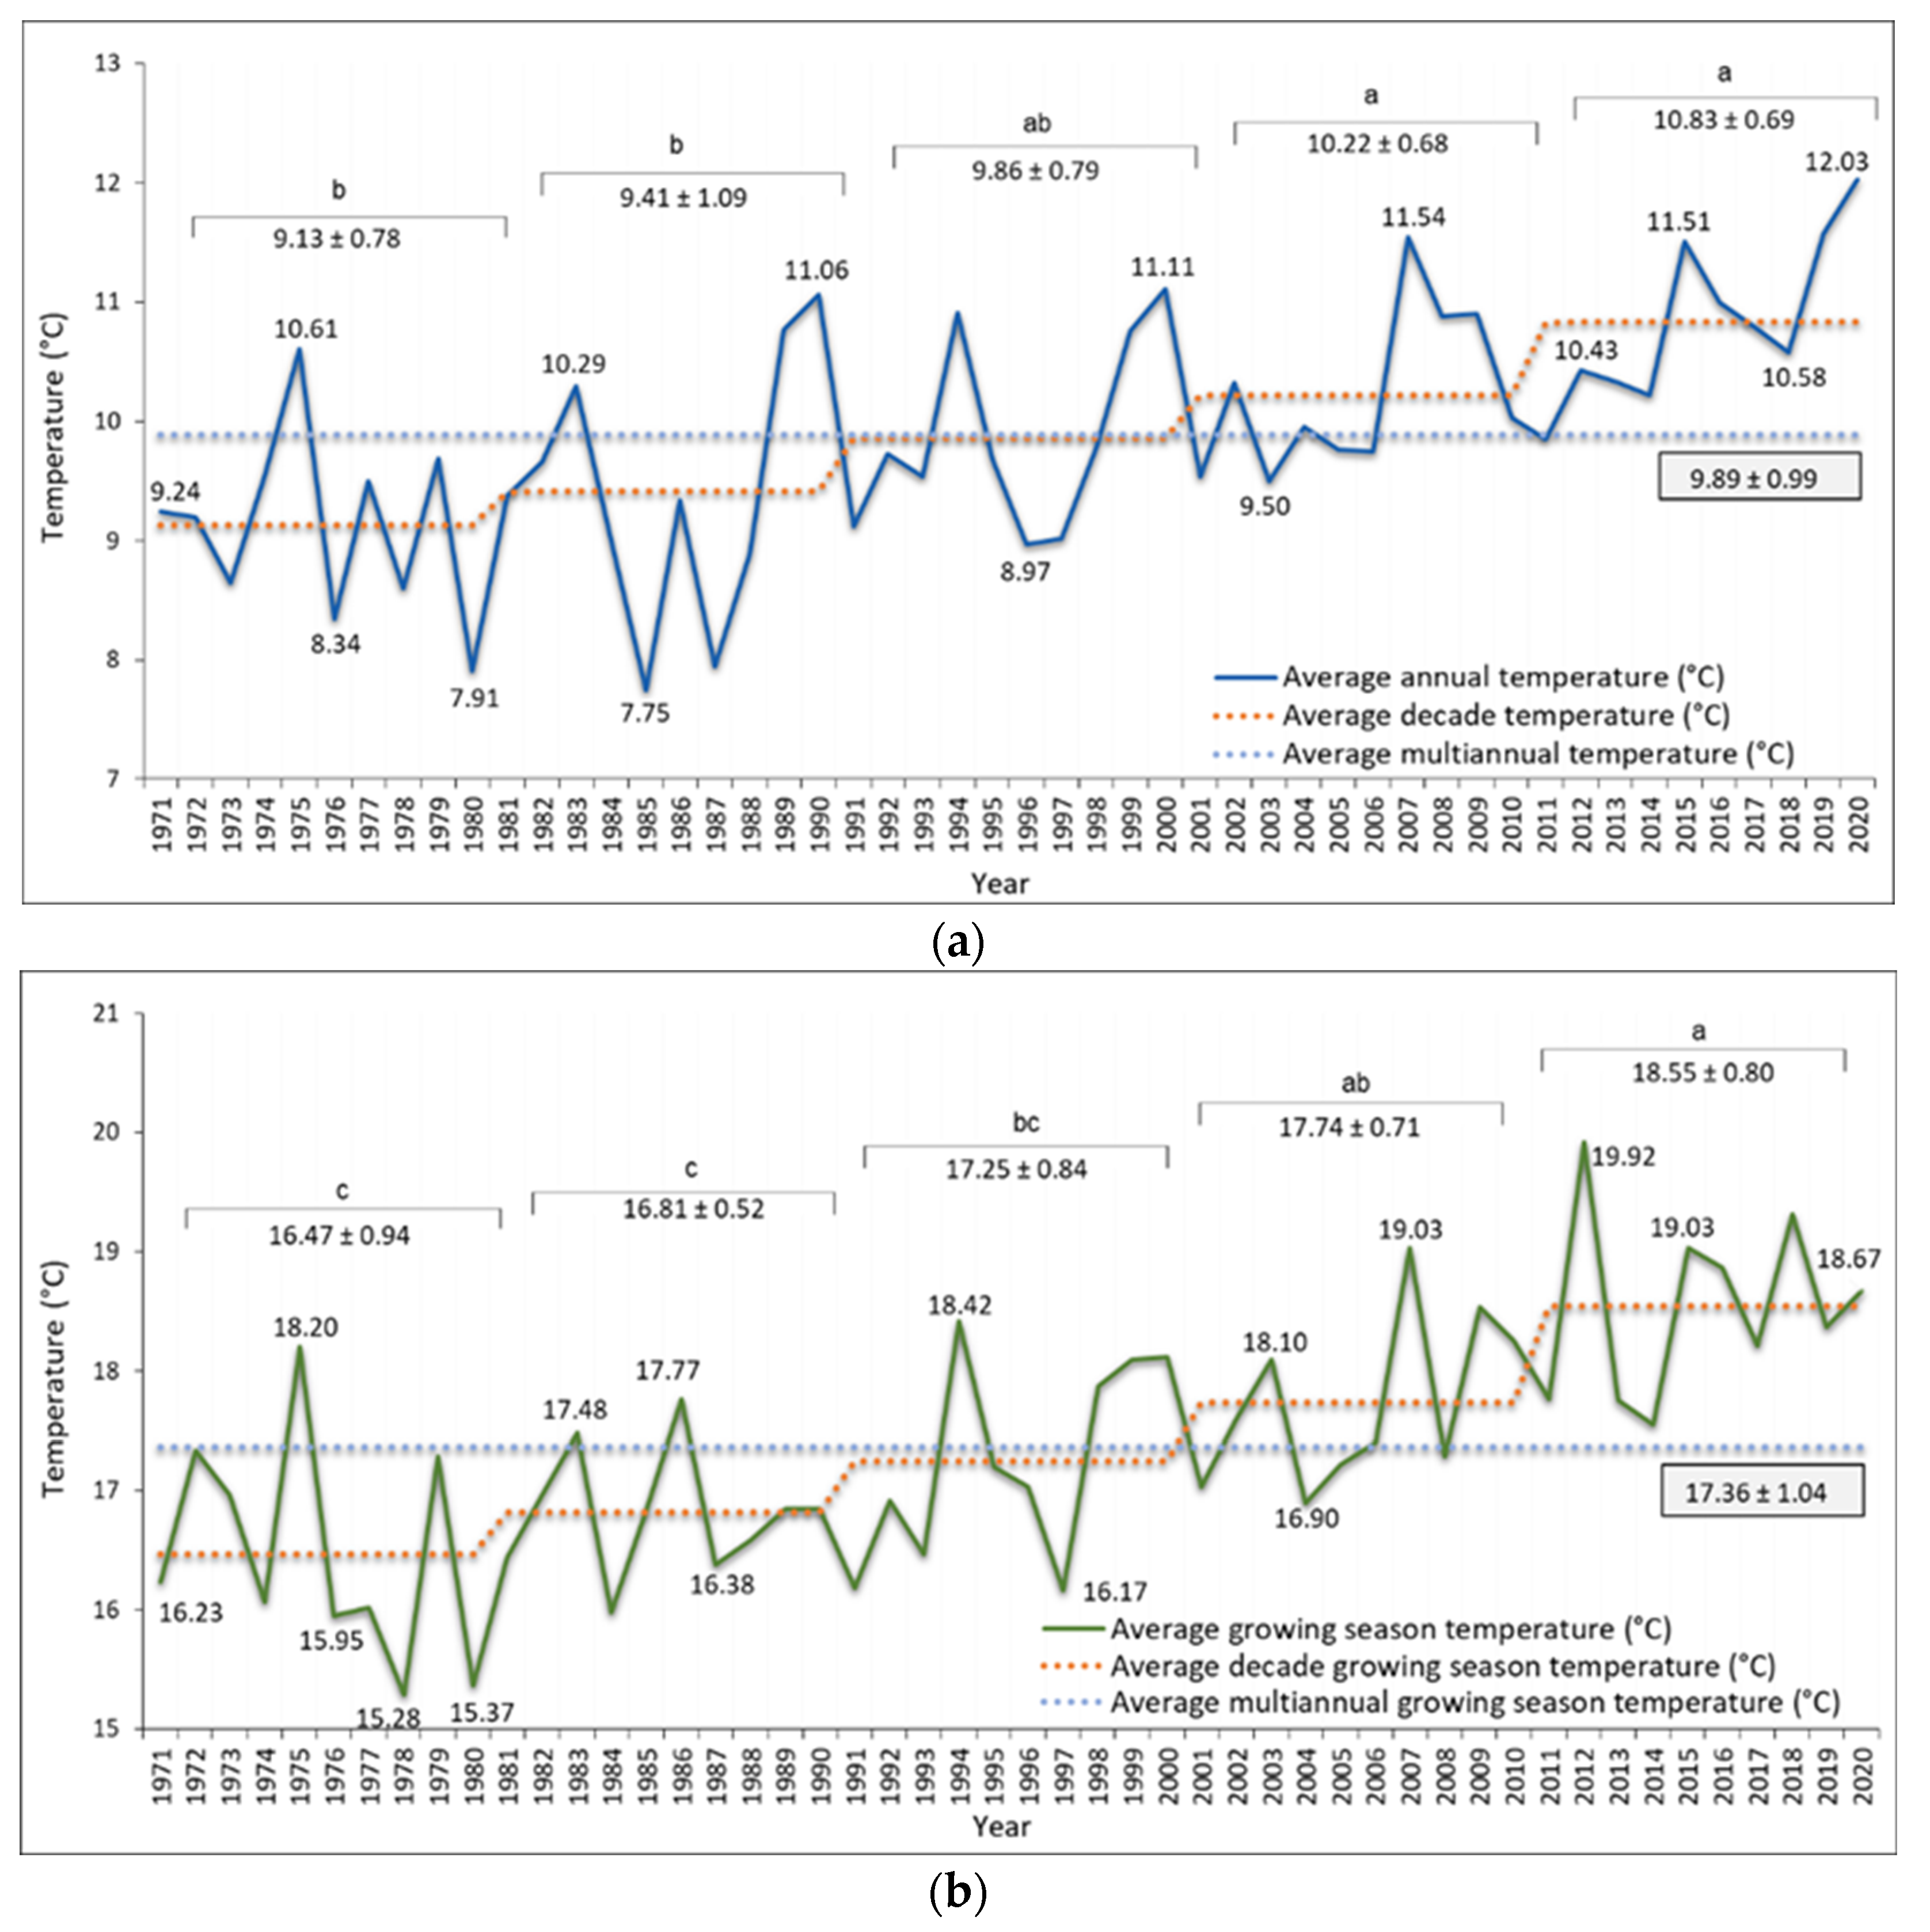
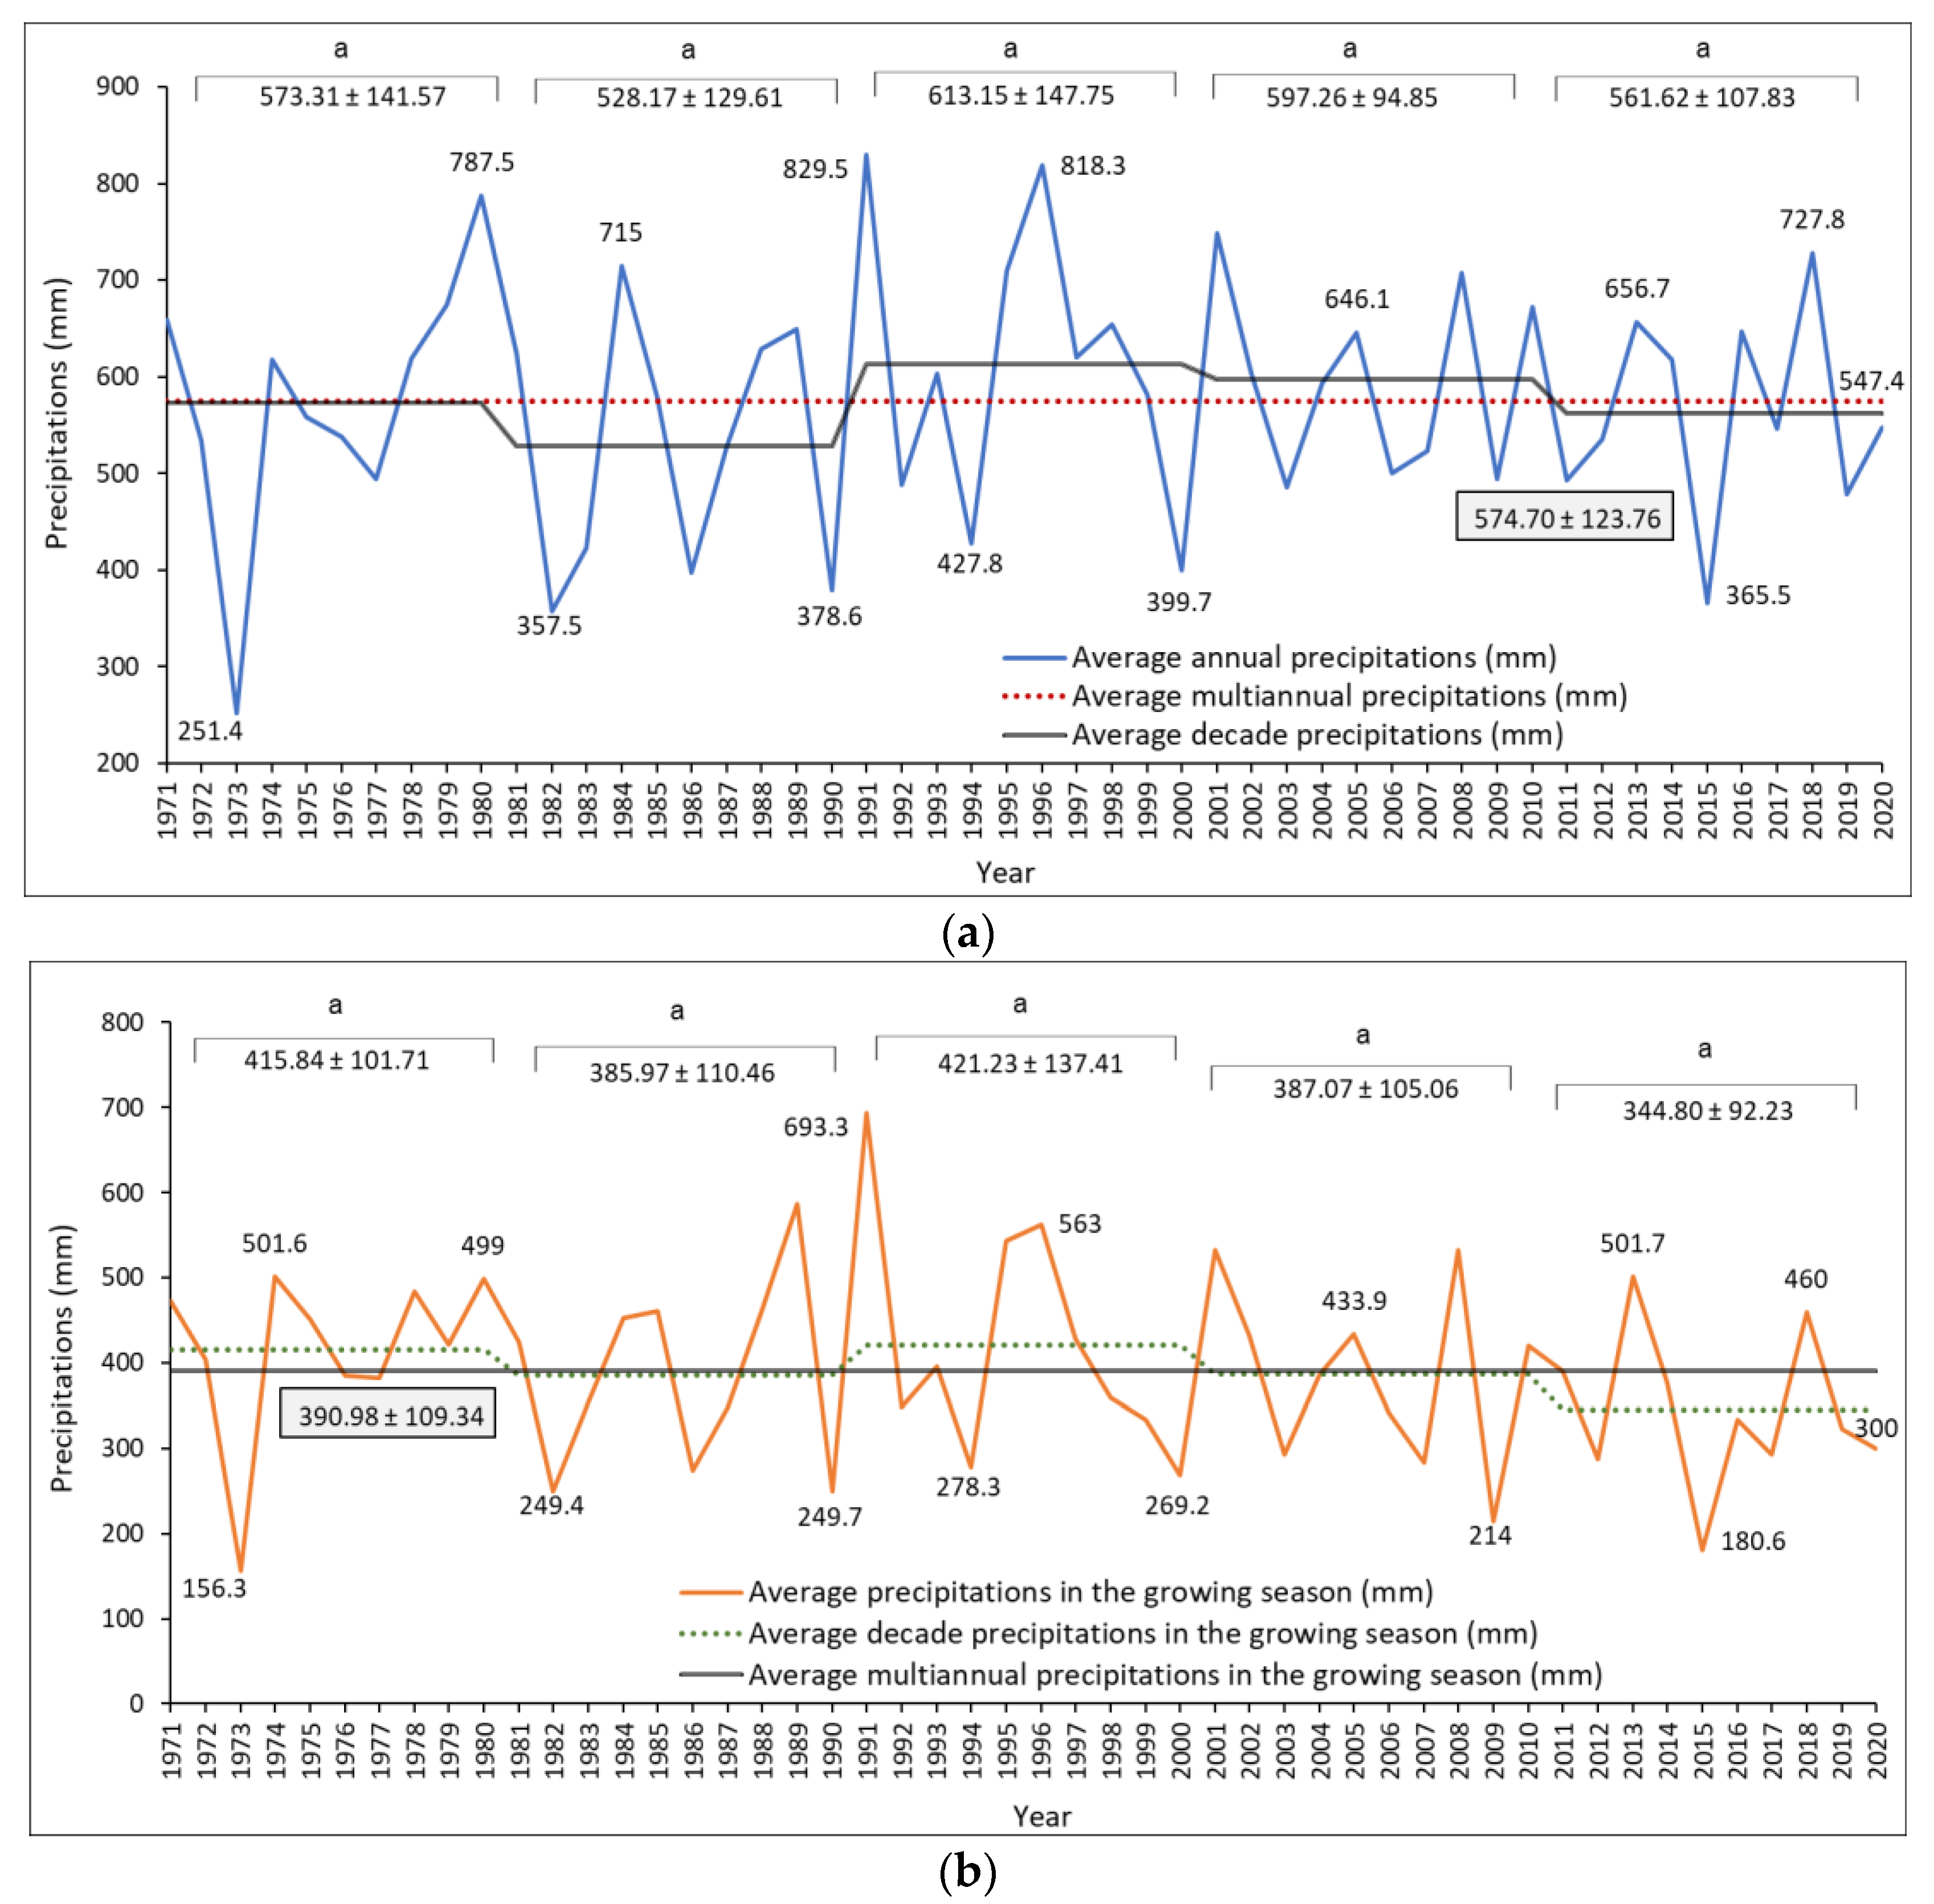
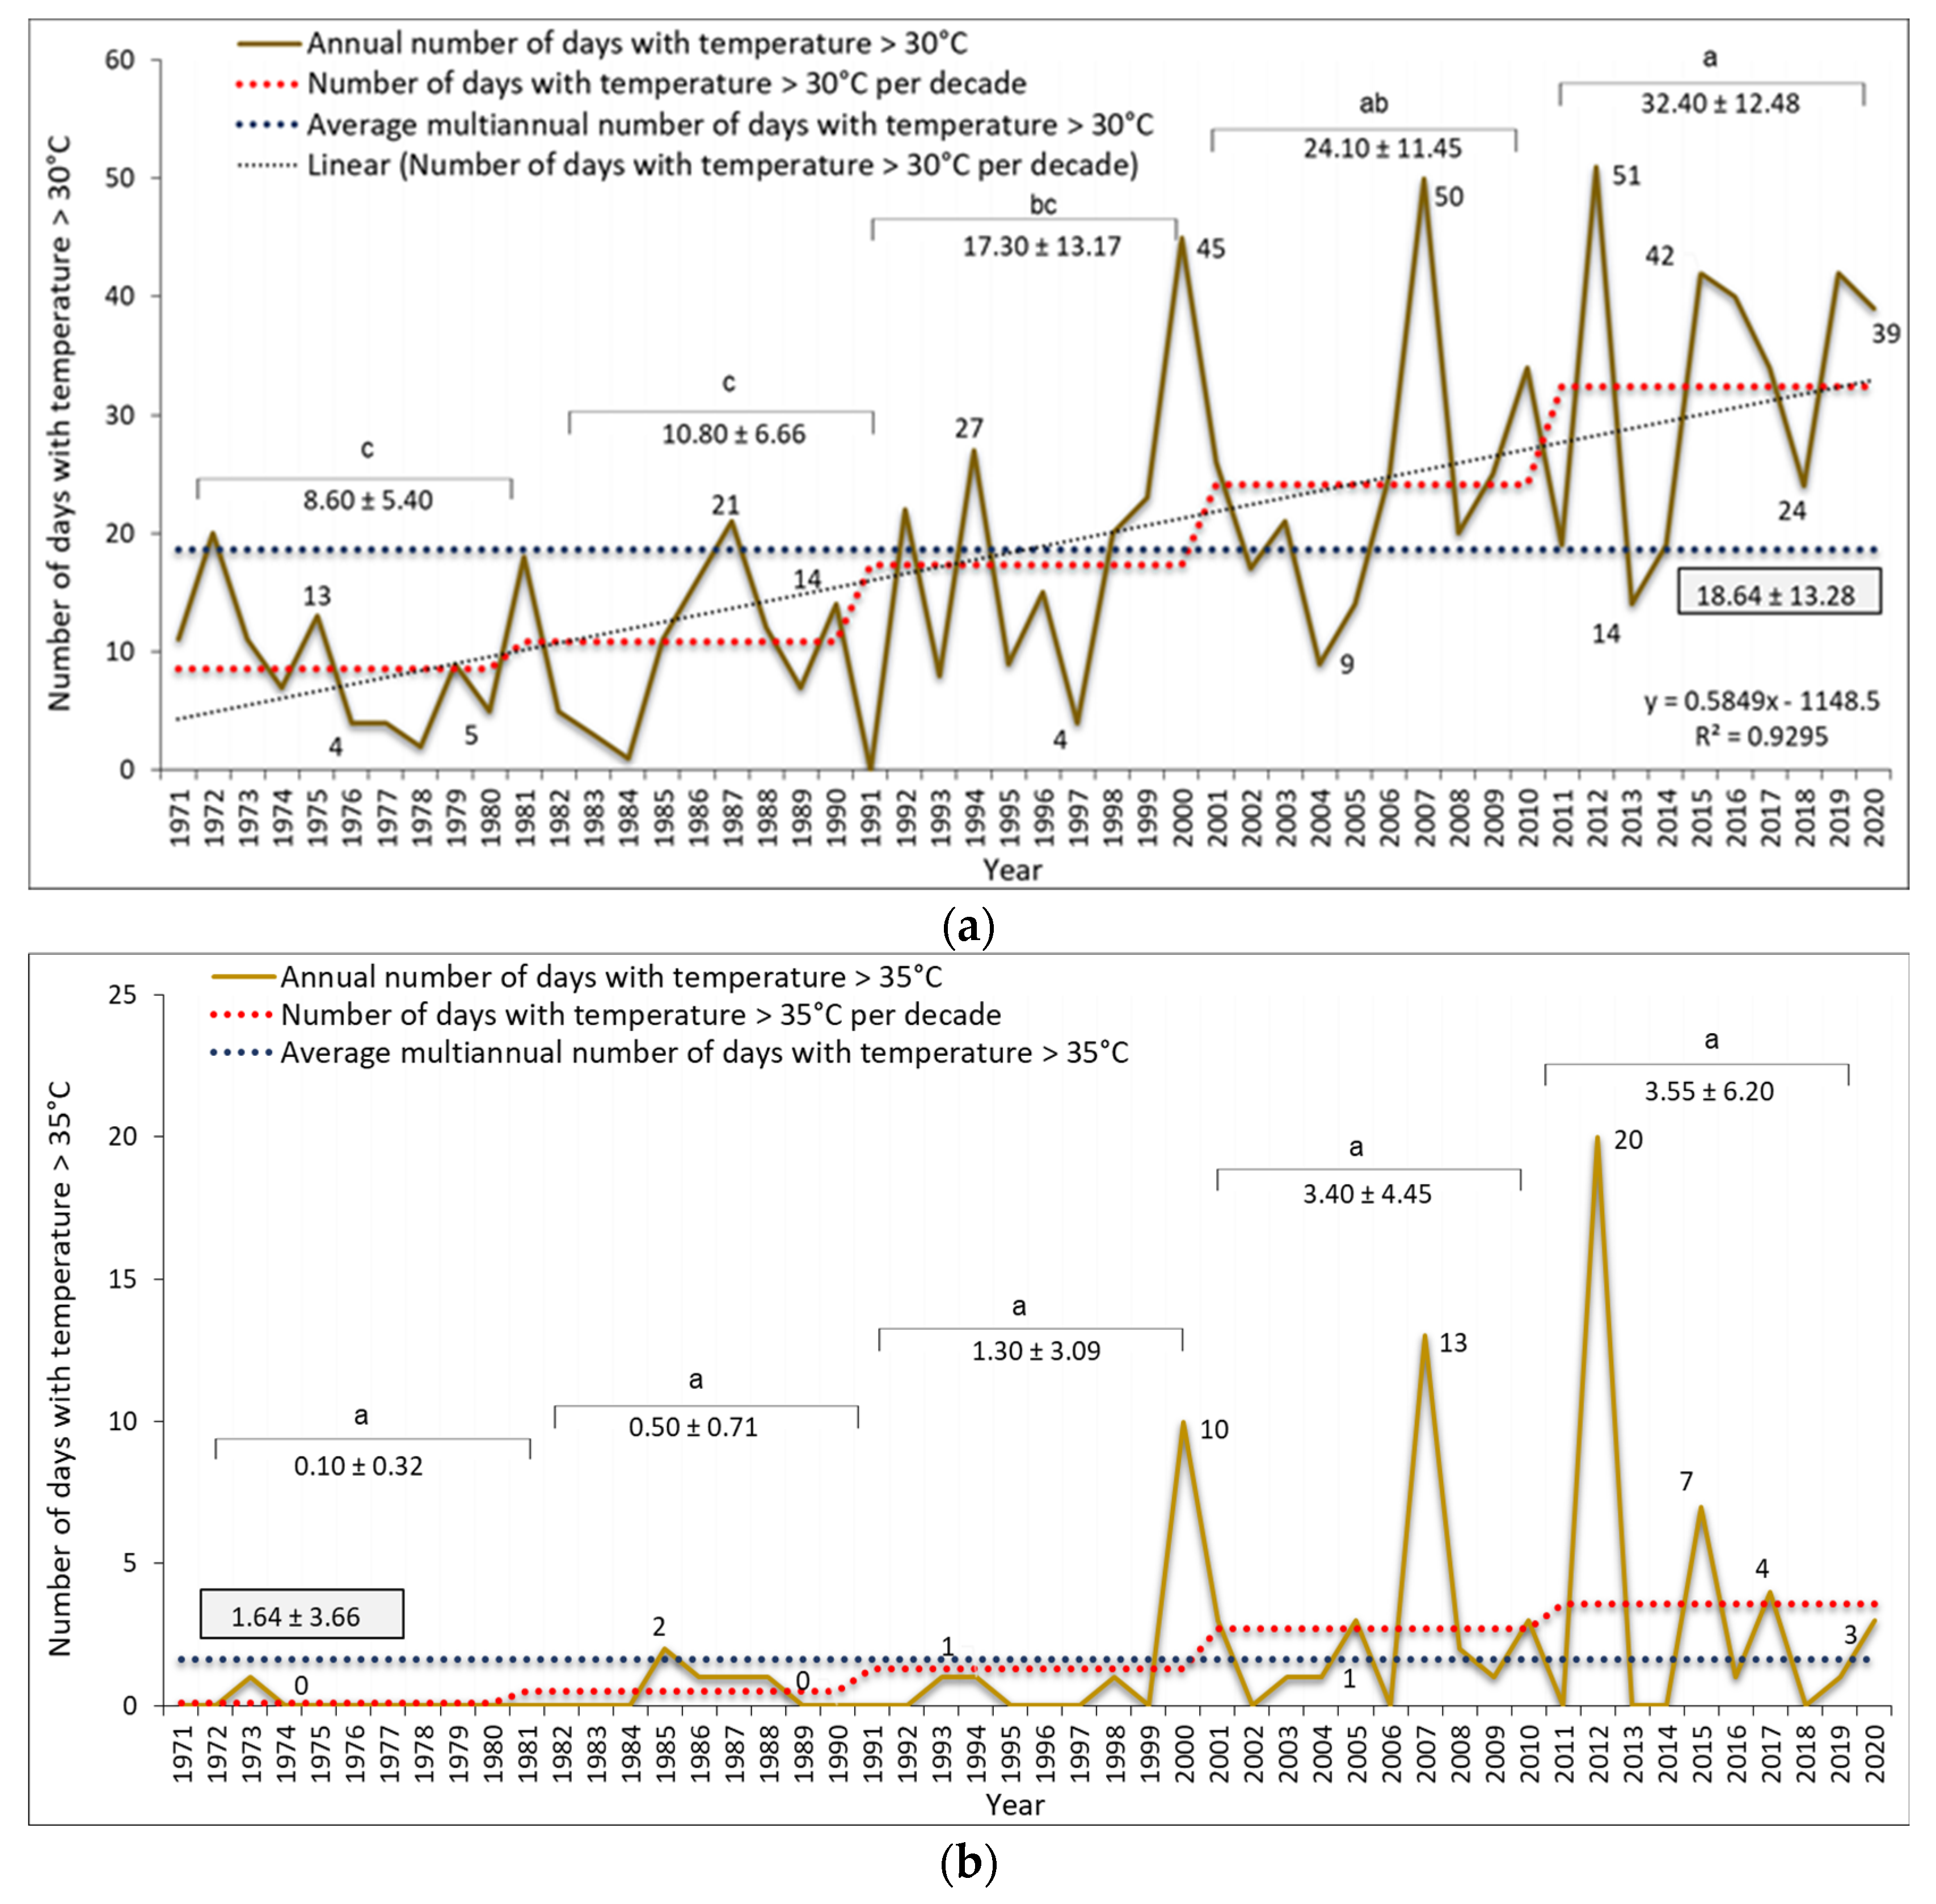
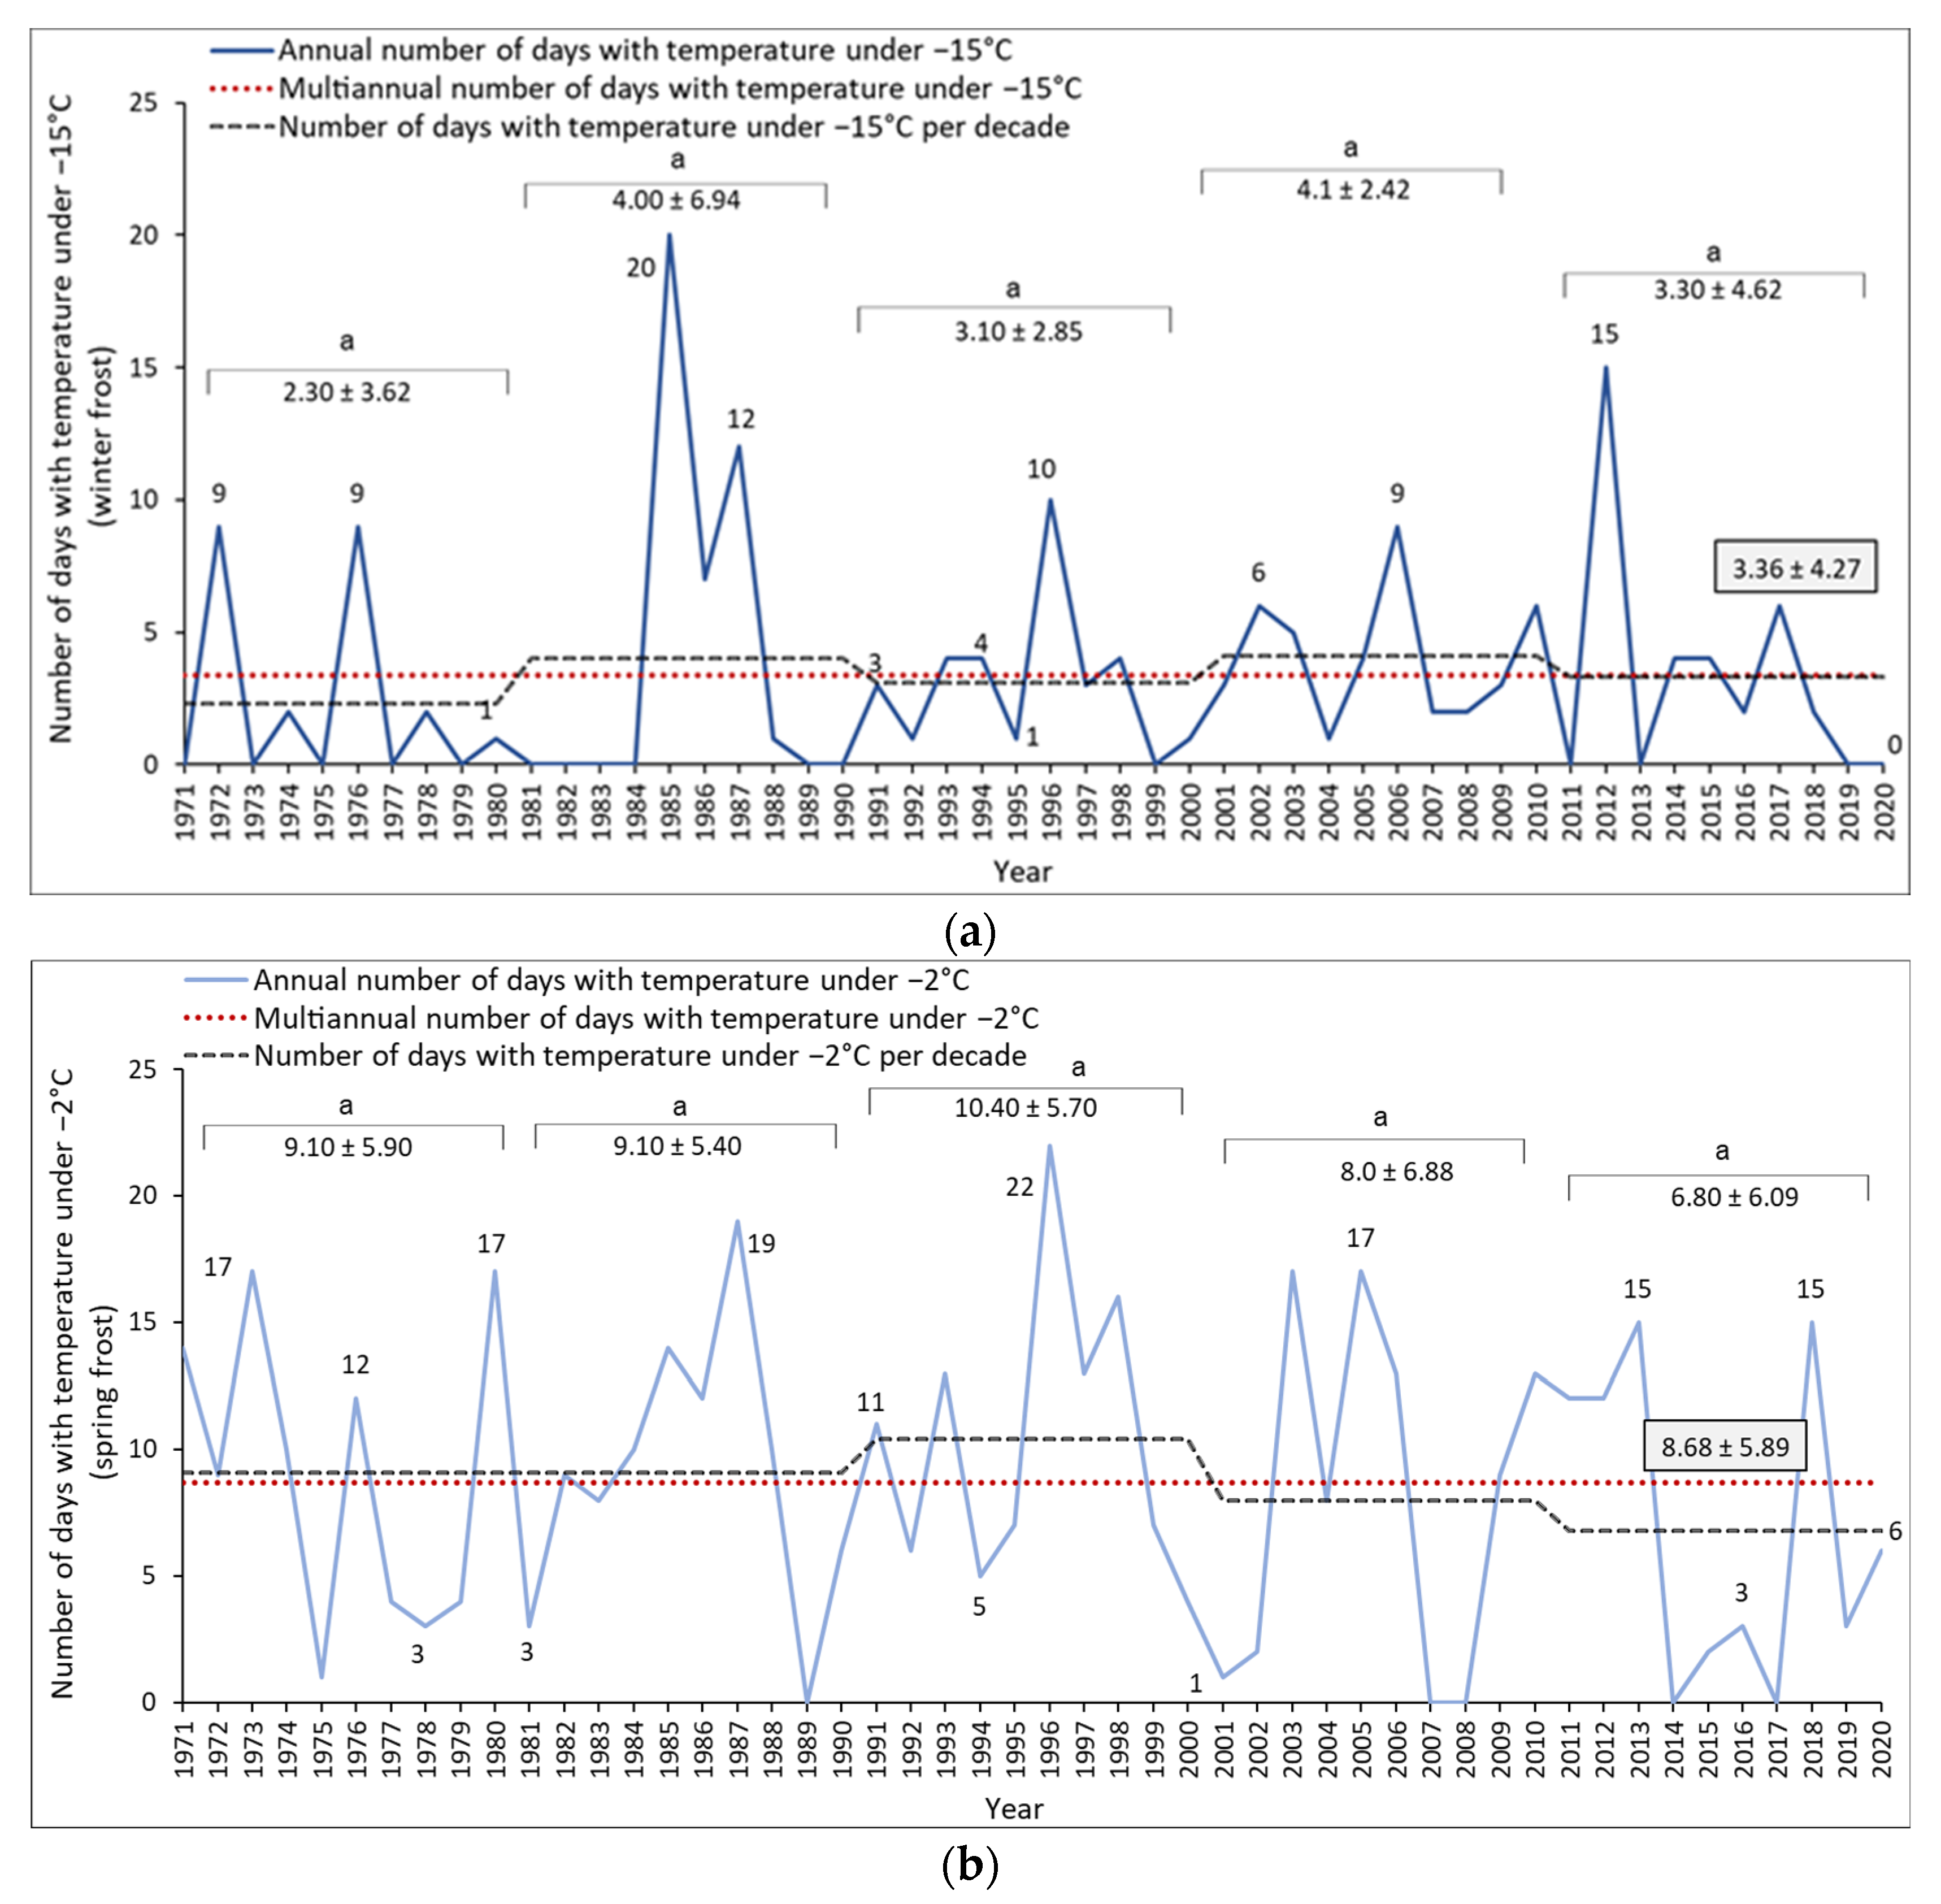
3.1. Climatic Elements

Climate is defined as the long-term pattern of weather conditions in a particular area [39]. Global warming gradually modifies the climate conditions, creating new patterns, increasing climate variability. According to Antón et al. [40], climate change is expected to increase the variability of weather conditions and the frequency of extreme events. However, temperature is considered the main climatic element and a good indicator of climate change because it has a significant impact on the entire ecosystem by guiding the life cycle of various organisms [41,42]. Temperature tolerances differ for various species and cultivars, but grapes are generally produced in areas with an annual average temperature between 10 and 20 °C, and growing season average temperatures between 13 and 21 °C, mostly in the mid-latitude regions of the continents [43,44]. In the Copou-Iasi wine-growing center, NE of Romania, in the period 1971–2020, the multiannual average temperature was calculated as 9.89 ± 0.98 °C. The lowest temperature recorded in the studied interval was −27.2 °C (December 1996), and the highest was 42.3 °C (July 2007). In the analyzed period, the average air temperature increased from one decade to another by at least 0.28 °C. Thus, the difference between the first analyzed decade (1971–1980) and the last decade (2011–2020) was +1.70 °C (Figure 2a). A significant increase in annual temperatures was highlighted starting with the year 2000, the period 1991–2000 being one of transition. If in the interval 1971–1990 were years when the average air temperature frequently reached 7–8 °C, in recent years, due to climate change, the lowest average air temperature is around 10 °C. According to the U.S. Environmental Protection Agency, worldwide, the decade 2012–2021 was the warmest since thermometer-based observations were made, confirming the similar trend of increasing air temperatures [45].
Regarding the average temperatures in the growing season (April–September), recent studies conducted in most European countries indicated a general increasing trend [3]. In our study, a significant increase in air temperatures was observed during the growing season (Figure 2b). The multiannual average temperature in the growing season was 17.36 ± 1.04, the difference between the first analyzed decade and the 2011–2020 interval being +2.08 °C. The rise in air temperature during the growing season was more evident starting with the year 2000, the statistical differences being significant compared to the 1971–1990 interval. However, the most important increase in the growing season average temperature was observed in the last decade, over 0.81 °C.
Precipitation has important effects on the development of ecosystems. Rain and snow can affect the amount of water on the surface, while the timing of snowmelt influences the availability of groundwater for irrigation. As the temperatures rise, a more intense evaporation of water takes place, which subsequently generates more consistent precipitation; thus, theoretically, climate warming is expected to increase the amount of precipitation. According to US EPA [46], on average, since 1901, global precipitation has increased from decade to decade at an average rate of 1.016 mm (0.04 inches). On the other hand, grapevine is a species with moderate demands on water, the daily consumption of a grapevine stock being 0.2–1.5 L, which means approx. 8000 L/day/ha [47]. Considering losses through evaporation and soil infiltration, for the correct supply of grapevine, a rainfall volume of 300–350 mm is necessary during the growing season, respectively, 500–700 mm annual precipitation [43]. The IPCC group predicts that most vineyards will face an increase in drought intensity and a reduction in surface and groundwater resources in the future; the cultivars to be planted must be selected according to their drought tolerance [2]. In the Copou-Iaşi area, after a maximum value of precipitations reached in the interval 1991–2000 (613.15 ± 147.75 mm), the average values of the decades remained relatively constant, with a slight non-significant decrease (Figure 3a).
The multiannual average of precipitation was 574.70 mm, with a high standard deviation (±123.76 mm) that indicates a large variability of the annual values. There were years (e.g., 1991, 1996) with high precipitation values (>800 mm) followed by dry years, in which the precipitation was up to two times lower (250–400 mm); in general, the conditions for efficient cultivation of grapevine were found in eight out of ten years.
Water deficit in the growing season affects photosynthesis and shoot growth and reduces berry size, while excessive water deficit stress can damage the leaves and stop grape ripening [12]. Also, excess water in soil causes a vigorous growth of shoots, sensitivity to fungal diseases, a delay in grape ripening, and lower rates of sugar accumulation [43,48,49]. In our study, the multiannual (1971–2020) average of growing season precipitation was 390.98 ± 109.34 mm, the decrease in the amount of precipitation being more obvious (−71 mm between the first and the last analyzed decades), but still statistically non-significant due to the very high data dispersion (Figure 3b).
Worldwide, over recent decades, no significant changes in the average precipitation regime during the growing season were reported [50]. However, Chen et al. [51], showed that the number of rainfall days decreased significantly in northeast China, increasing the daily rainfall amounts. In general, precipitation in the high latitudes of the northern hemisphere have increased, while rainfall in eastern Asia, Australia, and the Pacific region has declined, with rainfall variability increasing almost everywhere in the world [52]. Across Europe, a significant positive annual trend in precipitation was reported, with regional differences, however, with northern Europe becoming wetter and southern Europe becoming drier [53].
High-temperature variations directly affect photosynthesis and grapevine growth, the physiological processes being reduced when the temperature rises above an optimum limit [54]. The optimum photosynthetic temperature for grapevine is between 25 and 35 °C [55]. Above 35 °C, vegetation activity is impaired, and in some extreme cases, vineyards may suffer severe and irreversible damage [11,54]. Heat stress was evaluated based on the number of days with maximum temperatures above 30 and 35 °C. In the N-E of Romania, the parameter that increased most during the 1971–2020 period was the number of days with temperatures >30 °C. If in the first analyzed decade (1971–1980) the number of days with temperatures >30 °C was low (~9 days); during the following decades, there was a gradual and significant increase in the number of days with maximum temperatures >30 °C, exceeding an average of 30 days in the 2011–2020 interval (Figure 4a). If, until 2000, there were years when the temperatures did not exceed 30 °C (e.g., 1991), after the year 2000, the number of days with risky temperatures for grapevine was between 9 and 51, the heat stress on the plants increasing exponentially.
An upward trend was also registered in the case of the number of days with temperatures above 35 °C, the values being 10-fold higher in the decades after 2000, compared to the 1971–2000 interval (Figure 4b). Even if statistically the differences between the decades are non-significant due to the large fluctuations from year-to-year values, there is a clear trend towards an increase in the number of days with maximum temperatures above 35 °C, which seriously affects the normal development of plants, and, finally, the grape yield and quality. Prolonged exposure to extremely high temperatures (above 35 °C) can negatively affect plant development, with severe sunburns being reported, which increases the incidence of fungal infection [11,56]. A similar trend was reported by Bucur and Dejeu [57] in seven viticultural wine-growing regions in Romania, the number of days with temperatures above 30 and 35 °C gradually increasing significantly in the last 20 years.
The grapevine is a deciduous perennial fruit crop, and annually the canes and buds should withstand low temperatures during winter. However, grapevine has a limited resistance to winter frosts, varying depending on genetic factors (species and variety). The widely cultivated Vitis vinifera L. is a cold-sensitive species and cannot survive severe winter in regions with extremely low temperatures [58]. The most resistant to negative temperatures are the cultivars originating from temperate-continental climates, while the most sensitive cultivars come from the Mediterranean area [43,59]. Cold stress, including chilling (0 to 15 °C) and freezing (<0 °C) stresses, has an adverse effect on plant growth, development, and productivity, limiting grapevine geographical distribution [58,60].
Low temperatures are among the abiotic factors with an important negative impact on the grapevine, depending on the time of occurrence. Thus, the number of days with frosts in winter (<−15 °C) and spring (<−2 °C) was evaluated. In the case of winter frosts (temperatures below −15 °C), a large fluctuation of years with very low temperatures was highlighted. Thus, decades with a higher number of days with frost (>4) alternated with decades with fewer days with frosts; however, the differences between decades were non-significant (Figure 5a). On average, in the period 1971–2020, in the Copou-Iaşi wine-growing center, there were 3.3 days of frost during winter (December, January, and February), a particularly important aspect when deciding on the cultivars to be planted in the area and wine type production.
Temperature is the main factor influencing the budburst in spring. Mild winters cause early budbursts, which can lead to devastating damage from late spring frost affecting the green shoots and young leaves, with significant harvest decreases [61]. Knowing the frequency of winter and spring frosts is essential in the selection process of cultivars that can better withstand the action of low temperatures. On average (1971–2020), in the Copou-Iaşi area, spring frosts occurred more than 8 days/year. If, in the period 1971–1990, the number of days with spring frost (<−2 °C) was on average 9–10, after the year 2000, the average annual number of days with freezing temperatures decreased non-significantly to 6–7, as well as the annual frequency of the phenomenon (in some years, no spring frosts occurred; two out of ten) (Figure 5b).

3.2. Bioclimatic Indices

To assess the climate characteristics of a vineyard, a series of bioclimatic indices must be calculated, based on the summation of active, useful, or global temperatures throughout the year or during the growing season (Winkler index, Huglin index, cool night index) or combinations of thermal and hydrological indices, such as the oenoclimatic aptitude index (IAOe) or grapevine bioclimatic index (Ibcv). These bioclimatic indicators are very effective in representing the climate suitability for wine production in various climates by integrating factors such as temperature, precipitation, or sunshine duration [62,63]. The Huglin Index (HI) is widely applied as an effective tool for viticultural zoning [34,64], while IAOe is largely used to analyze vineyard climate suitability for specific cultivars [62].
Hygroscopicity (relative air humidity), which influences the intensity of physiological processes, showed values between 84 and 88%, without significant variations between decades, ensuring the optimal level of air humidity throughout the annual biological cycle of plants. Also, the multiannual average of the actual sunshine duration (as the sum of the hours of effective sunshine during the growing season) was 2062 ± 120 h, with small non-significant variations between decades, the climate being favorable for grapevine growing from this point of view. In the Romanian wine regions, a sunshine duration of over 1520 h is considered sufficient for the production of red wines [43]. The values of the main bioclimatic indices in the Copou-Iaşi wine-growing center, for the period 1971–2020 (on decades), are shown in Table 1.
The sum of temperatures varies from one year to another, determining the different favorability of the years for grape production. The increase in Σt°g, Σt°a, and Σt°u was significant in the last 20 years. Regarding the Σt°u, in the decade 2011–2020, the values increased by 358 °C compared to the period 1971–1980, resulting in a multiannual average of 1403 ± 178 °C, which allows the efficient cultivation of grapevine. According to the studies conducted by Oşlobeanu et al. [65], in Romanian wine-growing regions, the Σt°g values are within the range 2700–3600 °C, Σt°a between 2600 and 3500 °C, while the Σt°u values vary between 1000 and 1700 °C. High values favor the ripening of grapes, and the accumulation of sugars and phenolic compounds, while the thermal deficit delays the ripening of grapes, determines a high level of total acidity, and limits the accumulation of useful organic substances.
Lower values (<0.6) of the hydrothermal coefficient (HC) indicate the need to irrigate the grapevine plantations [59,66]. In the Copou-Iaşi area, HC showed optimal values, varying between 1.1 and 1.5, decreasing non-significantly in recent decades. However, in the decade 2011–2020, a transition from a climate with moderate humidity to one with insufficient humidity was observed, indicating a stagnation of the precipitation regime in parallel with the increase in thermal resources.
The actual heliothermal index (IHr) reveals the availability of thermal resources in the analyzed viticultural area. In the reference interval, IHr values increased significantly from 1.8 (1971–1990) to 2.4 (2011–2020), with a multiannual average of 2.1 ± 0.3, offering after the year 2000 the possibility of obtaining quality red wines in the Copou-Iași center.
The values of the viticultural bioclimatic index (Ibcv), which integrates the influence of temperature, precipitation, and insolation (being recommended for the temperate climate), registered an upward trend, from 7.0 (1971–1980) to 9.2 (2011–2020), indicating, in this case, an increase in the humidity deficit, and at the same time, an abundance of heliothermic resources in the vineyard.
The oenoclimatic aptitude index (IAOe) expresses the combined action of insolation, temperature, and precipitation during the growing season and reveals the possibility of producing red wines in a specific vineyard [33]. Due to climate change, the IAOe values in the last 50 years showed a significant increase, evolving from 4152 (value unsuitable for the production of red wines) in the period 1971–1980, to 4325 (medium favorability for red wine production) in the period 1991–2000, and to 4690, in the period 2011–2020, placing the climate of the Copou- Iași wine-growing center in the class of very favorable areas for the ripening of grapevine cultivars for red wines. However, the IAOe showed a multiannual value of 4375 ± 352, corresponding to an area with medium favorability for the production of red wines, in which suitable conditions are met only in some years.
The Huglin index and the Winkler index are extensively used to determine the relationship between climate and the sugar content of grapes [67]. Grapevine cultivars need a certain amount of heat and precipitation to ripen the grapes. The Huglin heliothermal index (HI) provides information regarding the thermal potential of the vineyard and the possibility of growing certain cultivars with various periods of grape maturation. In the case of the Copou-Iaşi wine-growing center, the average value of HI in the period 1971–2020 was 2018 ± 222, corresponding to the theoretical class HI3 (values between 1800 and 2100), respectively, a classic temperate climate. The significant increase in HI values in the last 40 years made it so that in the last decade (2011–2020), the Copou-Iaşi area became part of an upper climatic class, respectively, warm temperate climate—HI4 (values between 2100 and 2400), in which there are no heliothermic constraints for grapevine, being recommended for planting cultivars regardless of the length of the vegetation period.
The Winkler index (WI) is used for classifying the climate of wine regions based on heat summation, the areas being divided into five climate regions based on temperature converted to growing degree-days [35]. According to WI climate classification, the Copou-Iaşi wine-growing center was initially (1971–1990) included in Region Ib (1111–1389 °C). In the interval 1991–2010, the recorded WI values framed the Copou-Iaşi wine-growing area in Region II (1389–1667), the continuous heating from the last decade leading to the integration of the monitored area in Region III (1667–1994 °C), with the recent climate change being significant. Thus, according to WI average values (1469 ± 181 °C), the Copou-Iaşi wine-growing center climate is favorable for high production of standard to good-quality wines.
The cool night index showed a relatively constant value in the last 50 years, the slight increase from the decade 2011–2020 being sufficient for the transition of the Copou-Iaşi wine-growing center from the class with “very cold nights” to “cold nights” classification, daily temperatures increasing more than night temperatures. The obtained data are consistent with those reported by Bucur and Dejeu [57], who showed that in many Romanian vineyards, the values of the cool night index were not significantly affected by climate change. Also, the research carried out in the last 10 years in different areas of Romania revealed the increasing trend of extreme weather conditions or shifts in climate suitability of traditional vineyards [23,26,62].

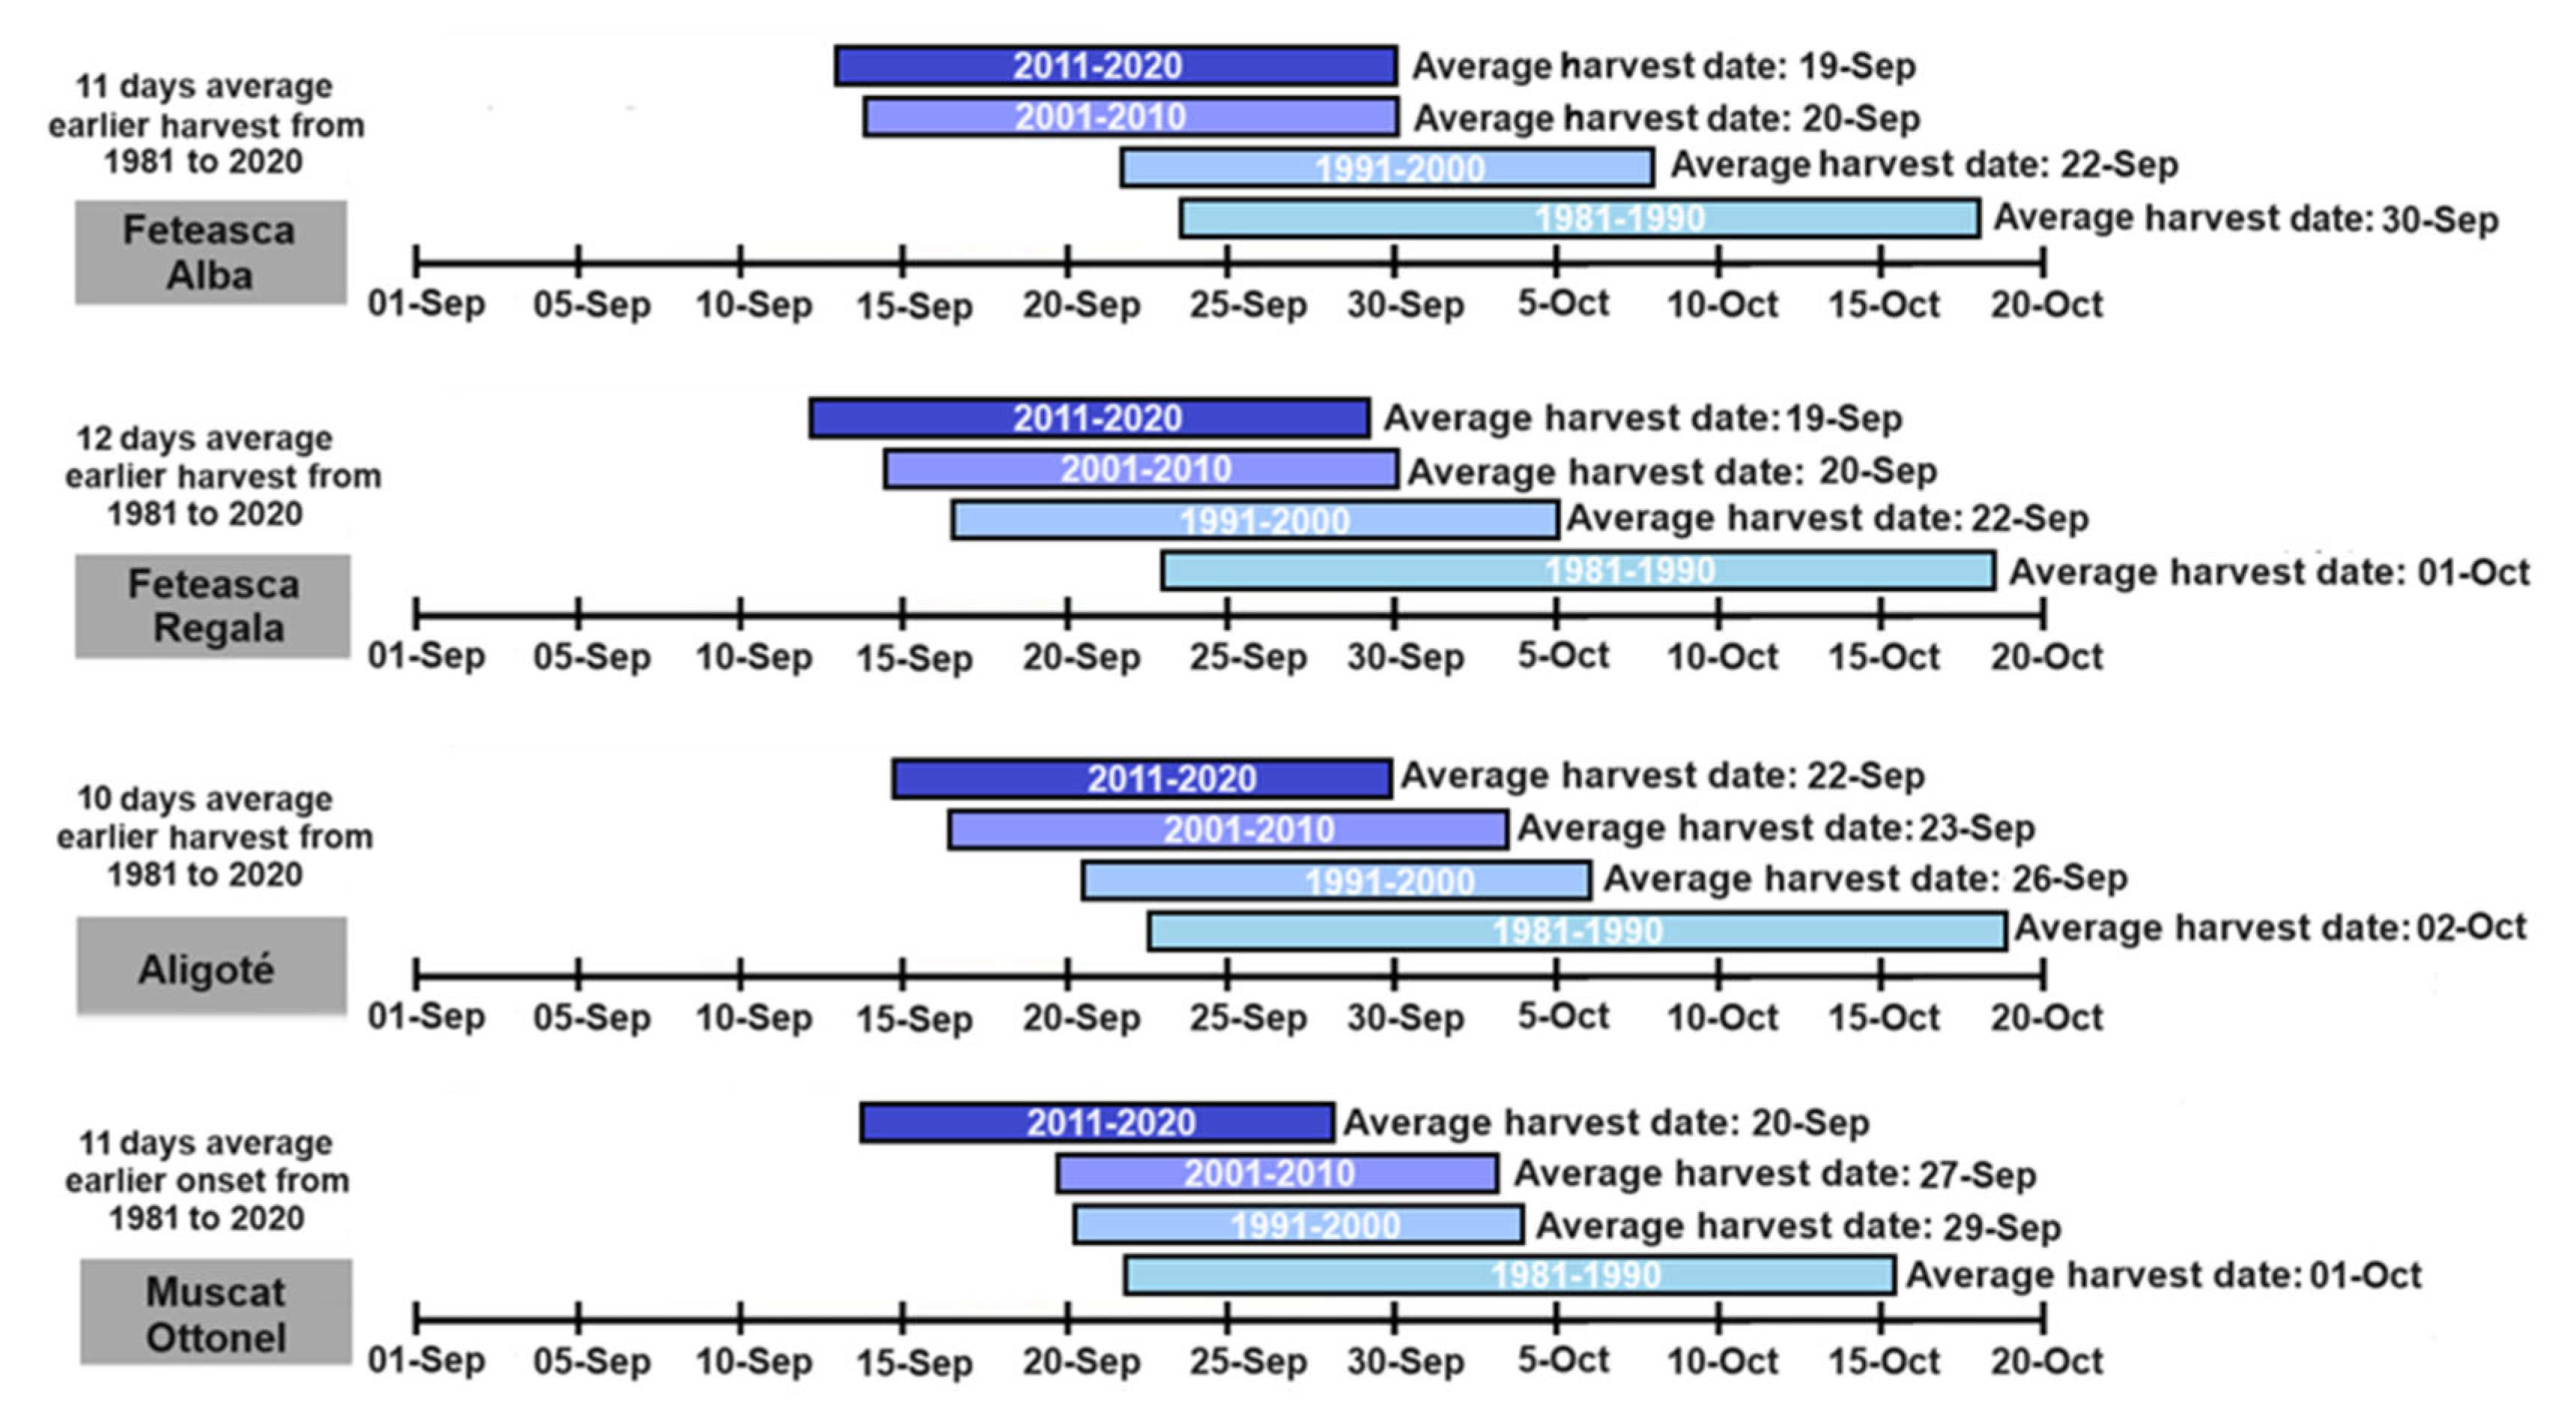
3.3. Changes in Harvest Date

Among the most evident biological effects of global warming are the phenological shifts [54]. As previously shown, phenological stages are highly influenced by temperature, thermal amplitude, and solar radiation, which together determine the initiation and length of the phenophases for a certain cultivar [68,69,70]. Previous studies conducted in Copou-Iaşi wine-growing center showed that high temperatures and soil water deficit may determine a shift in phenological phases and a forced ripening of grapes, with negative impact on the yield of various cultivars [71]. Overall, the warming process makes the grapevine go through some phenological phases faster, starting with budburst and finishing with an earlier grape ripening and harvest. According to Ruml et al. [72], an increase in the average temperature by 1 °C is enough to advance average harvest times by up to 7.4 days. To highlight this aspect, four V. vinifera L. grape cultivars for white wines were monitored in the interval 1981–2020 (40 years), determining the date of grape harvesting, respectively, the time of reaching grape technological maturity, considering that the production direction and the obtained wine style were not modified during this time interval (Figure 6).
Although the faster occurrence of grape maturity is obvious, each cultivar responded differently to climate changes, as proof of their different plasticity and adaptability. If, in the decade 1981–1990, the date of grape harvest varied in a wider range (21 September–20 October), the increase in temperatures in recent decades led to a shortening of this interval (12 September–30 September), with a delay being determined in the average harvest date by about 11 days in the case of autochthonous cultivars (Fetească Albă and Fetească Regală). A lower advance in the date of grape harvest was recorded for the Aligoté cultivar, respectively, 10 days earlier than 40 years ago, a difference registered mainly in recent decades (2001–2020).
A similar trend was reported by Venios et al. [54] and Koch and Oehl [73], which showed a clear change in the date of harvest for five grapevine cultivars over approximately 40 years, in S-W Germany, significantly changing in the last two decades (about four weeks earlier comparing to the 1980–1990 decade). Trends related to earlier harvest dates have been frequently reported for various regions in Europe, confirming this process of continuous climate warming [26,74,75].

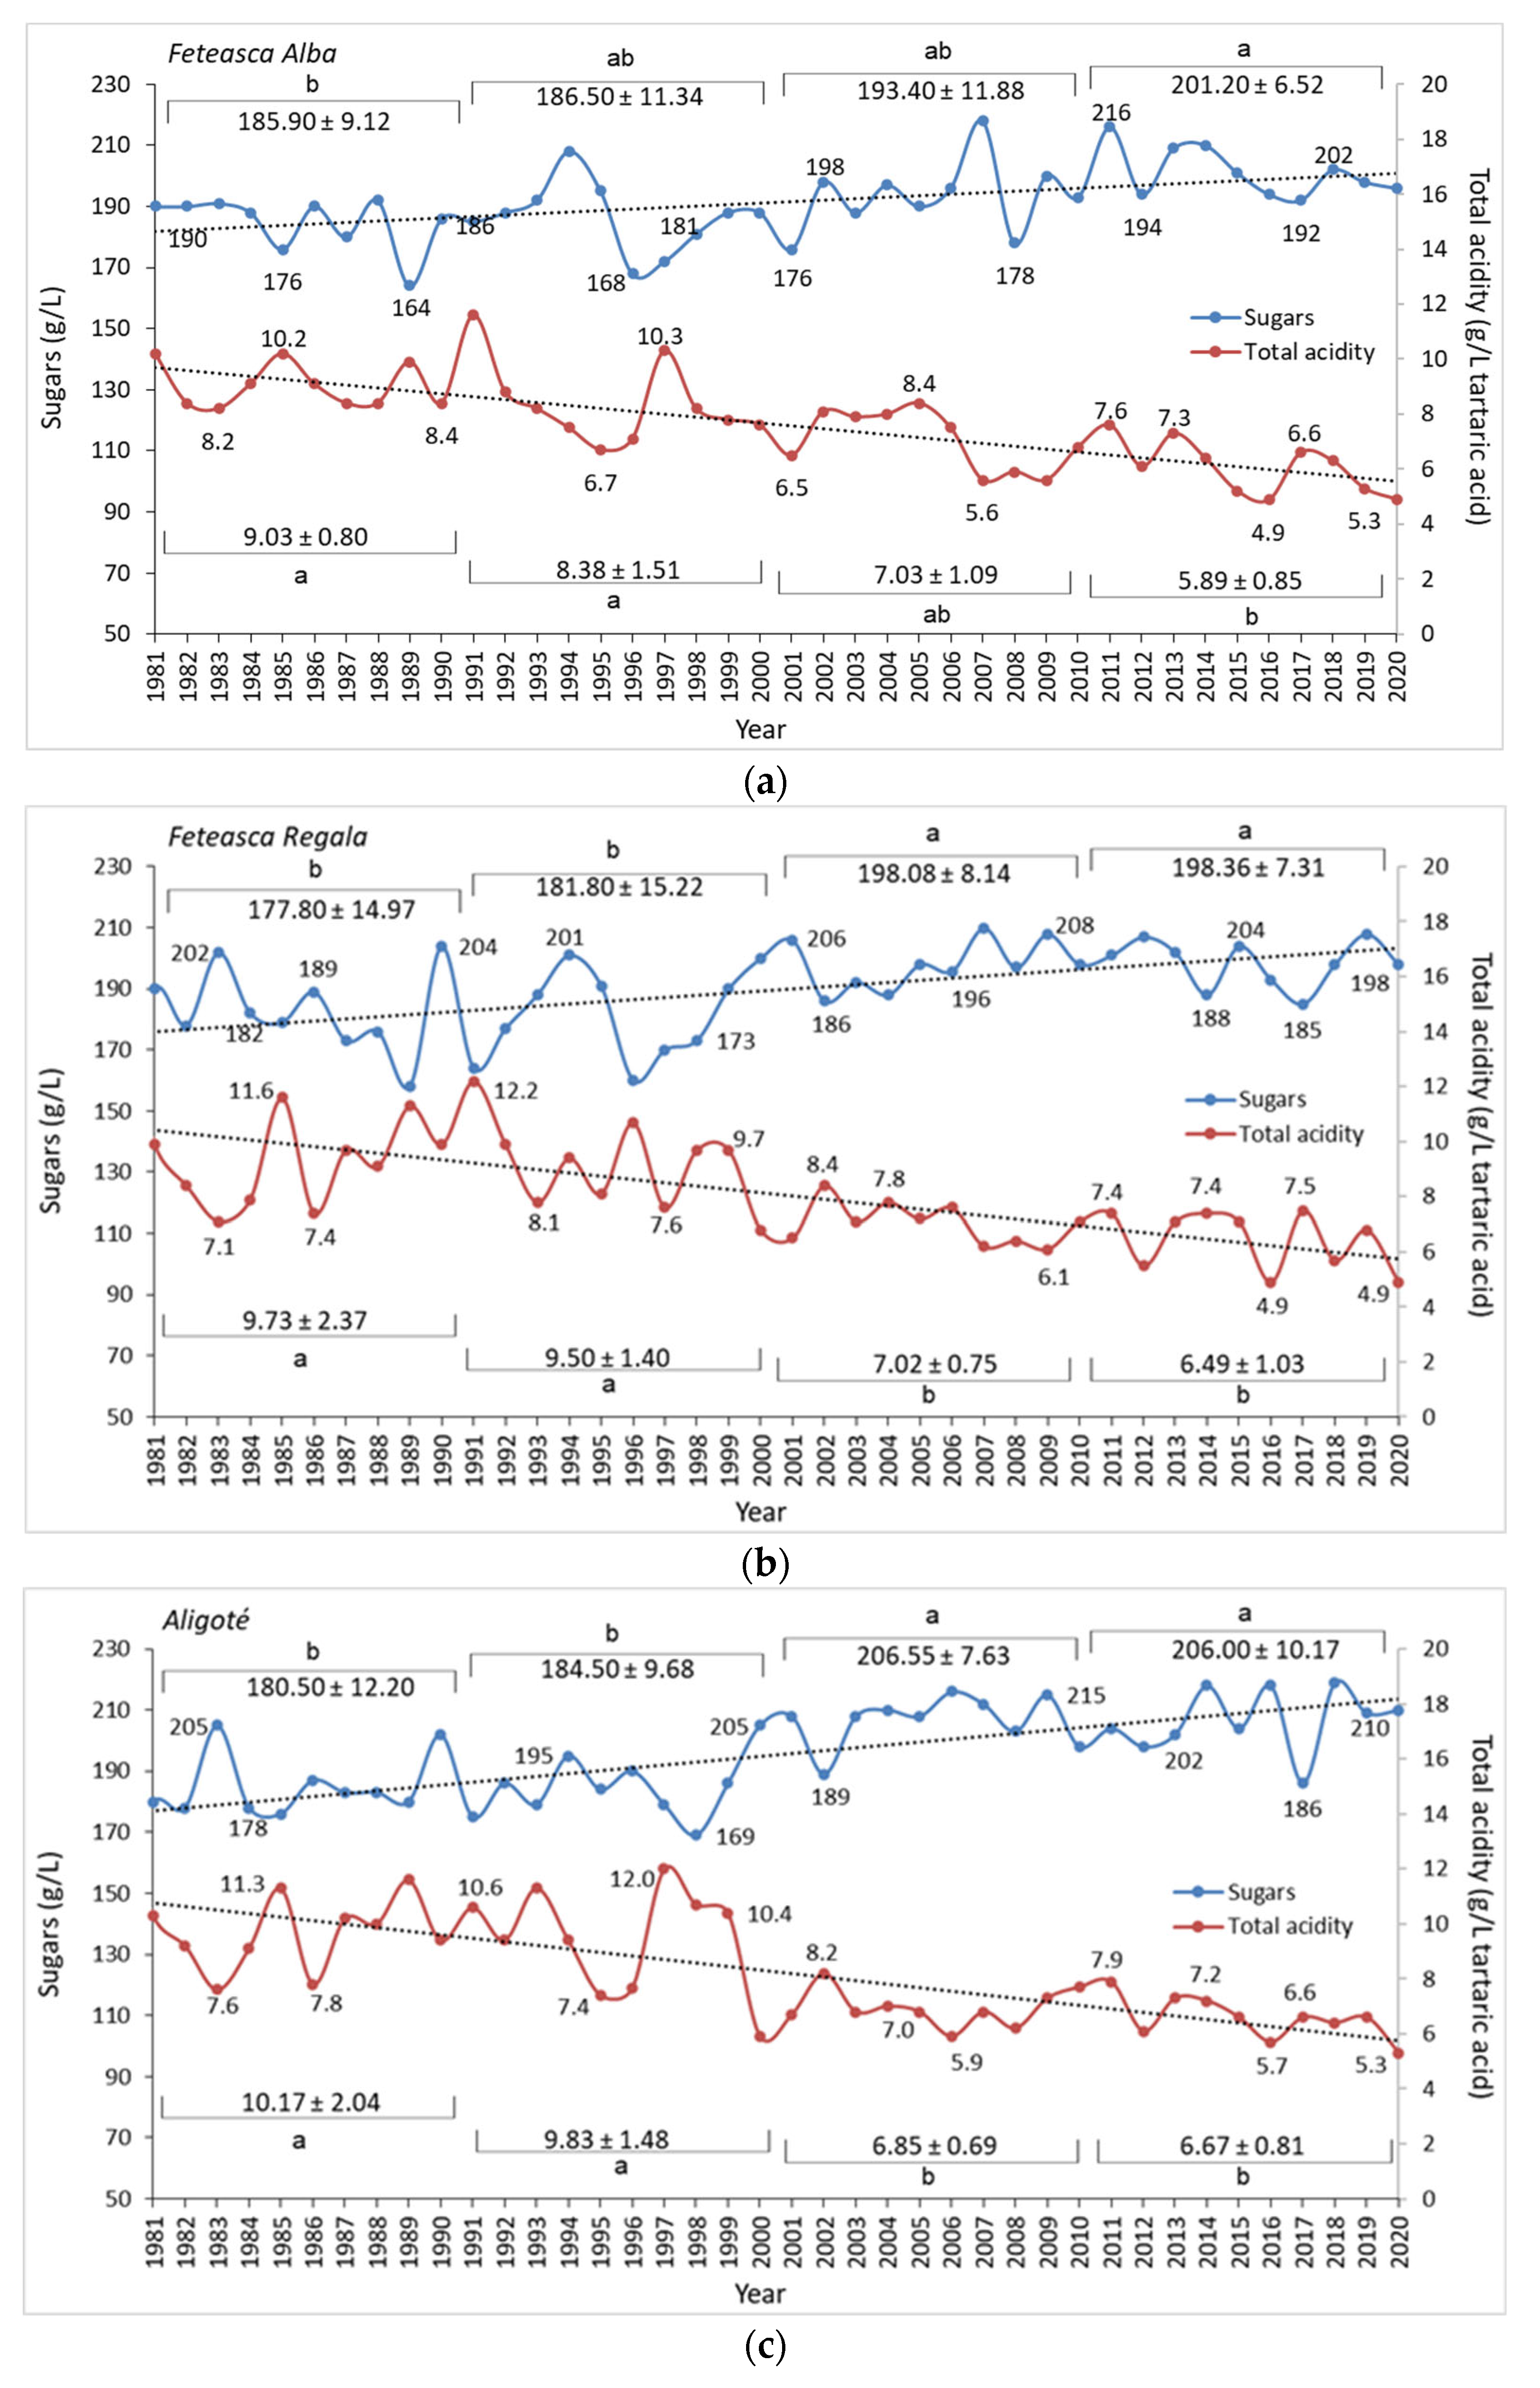
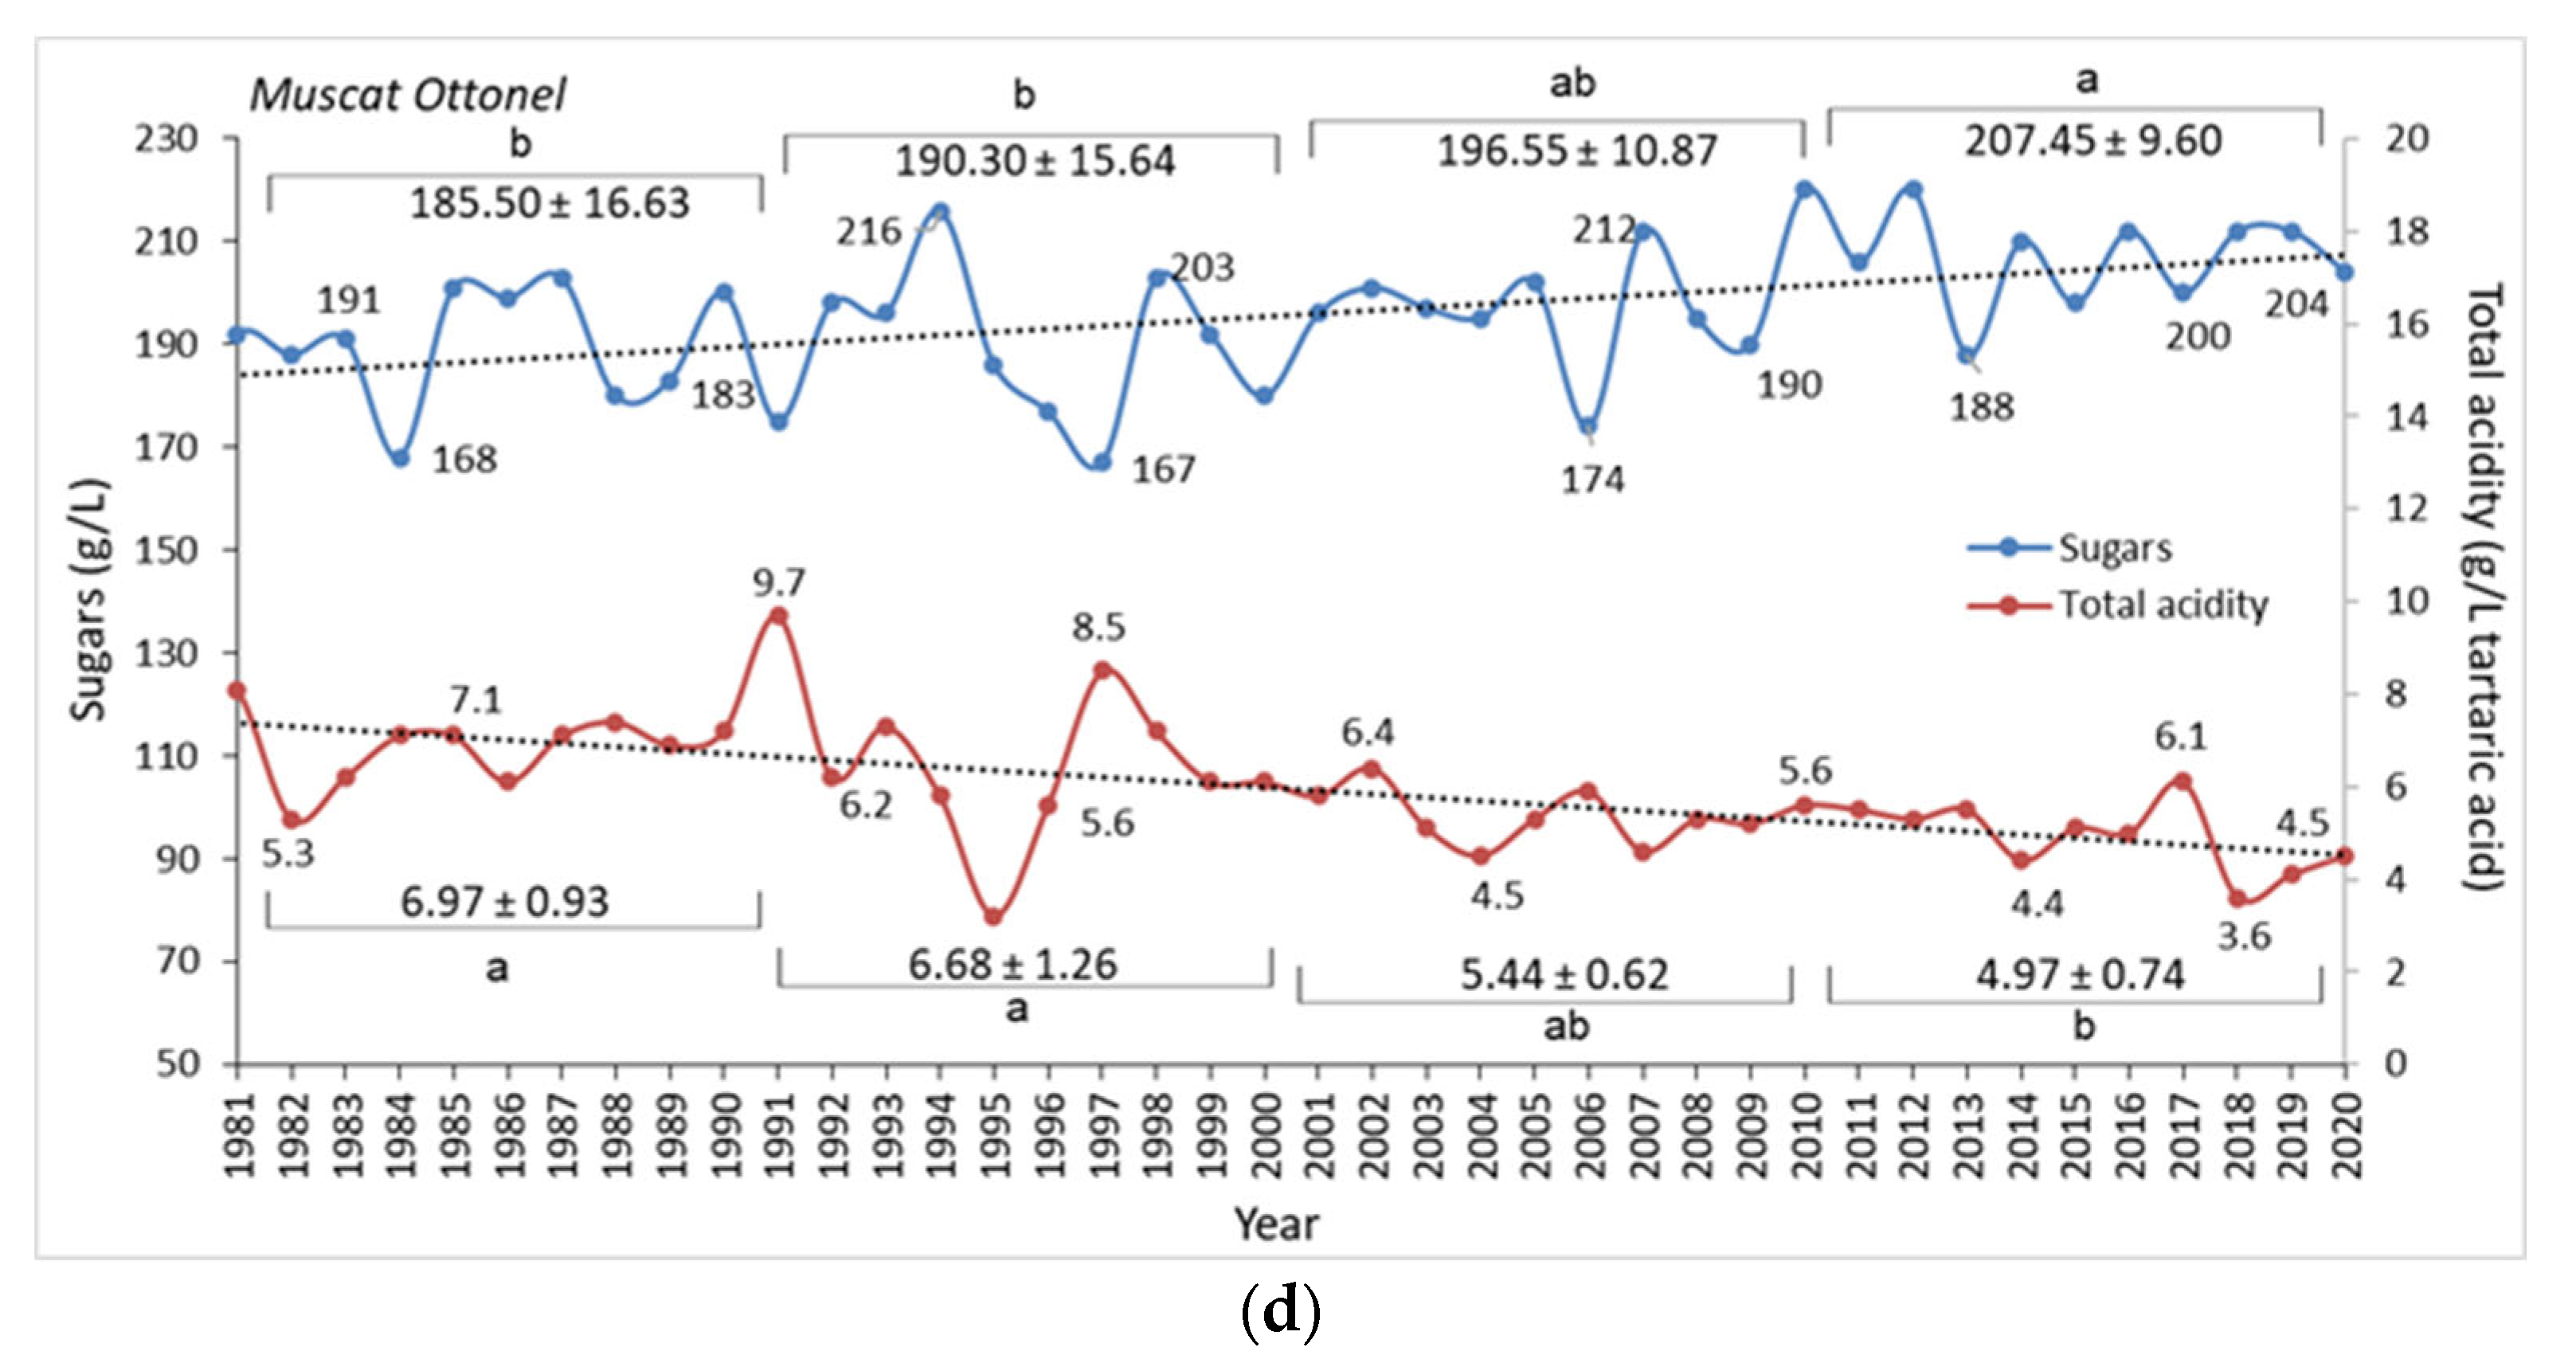
3.4. Changes in Grape Chemical Composition

Grape quality depends on the relationships between the plant and the environment. Long-term temperature increases all over the world had a direct impact on grape composition, the sugar content increasing and total acidity decreasing [67,76,77]. Climate influences grape quality by modifying the concentration of sugars, organic acids, and secondary compounds [9,78]. Overall, climate change accelerates the ripening process due to warming temperatures, and grapes reach maturity in a shorter time and accumulate large amounts of sugars [78,79]. However, grape sugar content can be indirectly affected by changes in water content and berry size [80].
Changes in sugars and total acidity content in matured grapes of Fetească Albă, Fetească Regală, Aligoté, and Muscat Ottonel cultivars, in the period 1981–2020, are shown in Figure 6 (as average values per decades). In the last 40 years, a significant increase in the average sugar content of grapes was observed, these increases varying depending on the cultivar. In the case of the autochthonous cultivars, the average sugar amount in grapes increased between +15.30 g/L (~8%) (Fetească Albă) and +20.56 g/L (~10%) (Fetească Regală) (Figure 7a,b).
Although the advance of the harvest date was almost similar for all four analyzed cultivars, the increase in sugar concentrations was much higher in the cultivars from the international assortment. Thus, the highest differences compared to the 1981–1990 decade in terms of sugar accumulation were recorded in grapes of Muscat Ottonel (+21.95 g/L; ~11%) and Aligoté (+25.4 g/L; ~12%) cultivars (Figure 7c,d). Regarding the multi-annual dynamics, grape sugar concentration has increased compared to the values of 40 years ago, but a slowing down of the process (Fetească Albă, Muscat Ottonel) or even a stagnation (Aligoté, Fetească Regală) was observed after the year 2000, even if the average air temperatures increased more during this period. Venios et al. [54] concluded that, in time, the grapevine might develop strategies to maintain homeostasis and cope with high-temperature stress, mechanisms that may include physiological adaptations and activation of signaling pathways and gene regulatory networks governing heat stress response and thermotolerance. However, the increase in sugar in grapes led to wines with higher alcohol concentrations or, in certain cases, wines with residual sugar (semisweet) [81].
Regarding the total acidity of mature grapes, a significant decrease was observed over the last 40 years. Unlike sugar accumulations, the decrease in total acidity was continuous. In grapes of the Fetească Albă cultivar, in the last decade (2011–2020), total acidity was lower by about 3.14 g/L tartaric acid (−33%) compared to the 1981–1990 interval. Along with the Fetească Albă cultivar, Aligoté (−3.50 g/L tartaric acid; −34%) suffered the most important losses of total acidity in the analyzed interval (1981–2020). Also, in the case of Fetească Regală (−3.24 g/L tartaric acid) and Muscat Ottonel cultivars (−2.00 g/L tartaric acid), the average acidity of matured grapes was lower by a percentage between 28 and 33% compared with the values of the 1981–1990 decade.
Climatic and biochemical data correlation for the interval 1981–2020 revealed the negative impact of the increasing annual and growing season temperatures on the date of the grape harvest, especially for the cultivars Aligoté (r > −0.9017) and Muscat Ottonel (r > −0.9832) (Table 2). For the same cultivars, a negative correlation between the high number of days with temperatures > 30 °C and the advance of the grape harvest date was highlighted (r = −0.9045–−0.9416). The annual average temperature (r = 0.8884–0.9851), growing season average temperature (r= 0.8891–0.9856), and the number of days with temperatures >30 °C (r = 0.9562–0.9815) were positively correlated (p < 0.05) with grape sugar content of all V. vinifera L. analyzed cultivars.
Also, the decrease in grapes’ total acidity was inversely correlated with the increase in annual and growing season temperatures (r = −0.8966–−0.9854), as well as with the high number of days with temperatures >30 °C (r = −0.9094–−0.9940). Growing season precipitation showed a strong negative correlation with grape sugar concentrations (r = −0.9252–−0.9660) and a direct positive relationship with decreasing acidity values (r = 0.9128–0.9777). In the same context, the sugar content of grapes was negatively correlated with total acidity (r > −0.9416), meaning that a high concentration of sugar in grapes corresponded to a lower acidity. In the analyzed interval, increases in Σt°g, Σt°a, and Σt°u showed a direct influence on sugar accumulation (r > 0.90) and total acidity reduction in grapes of all analyzed cultivars (r > −0.90). Taking into account the calculation method, the main bioclimatic indices (IHr, Ibcv, IAOe, HI, WI) showed a positive correlation with carbohydrate accumulation (r = 0.8930–0.9924) and a negative relation with grape acidity (r > −0.9285), while hydrothermal coefficient (HC) and De Martonne aridity index (IDM), which involve the annual and growing season precipitation, were positively correlated with the acidity of the grapes (r > 0.85) (Table 2). Previously, Navrátilová et al. [67] revealed a higher correlation rate of the HI with the sugar content, while the WI proved to be less suitable for all viticultural areas. In our study, the Winkler index (WI) showed a high correlation with grape sugar content (r = 0.89–0.99), close to that of the Huglin index (r = 0.93–0.99).
Principal component analysis (PCA), as a multivariate technique, allows visual representation of the correlations between multiple variables, increasing data interpretability and explaining data variation [82]. PCA biplot showed the grouping of grape sugar of analyzed cultivars along with the annual and growing season temperatures during the last decade, while the number of days with freezing temperatures in winter (T < −15 °C) and spring (T < −2 °C) was paired with grape acidity in the period 1981–2000 (Figure 8a). WI, HI, IAOe, and IHr, together with the increasing number of days with high temperatures (T > 30 °C; T > 35 °C), were related to grape sugar concentrations, grouped especially in the quadrants of recent decades.
The cluster method admits the existence of the polythetic groups, whose elements are equivalent or similar for several criteria, but not for all characteristics. At the same time, the similitude of the elements from the group and the difference among groups are measured [83]. However, cluster analysis is a convenient method for identifying homogenous groups considering a multitude of factors. Agglomerative Hierarchical Clustering (AHC)—Ward’s method—was used to group the analyzed decades (1981–2020), considering all the features analyzed in the study (climatic, phenological, and chemical factors). AHC analysis indicated the formation of two main clusters, grouping the decades 1981–1990 and 1991–2000 in a separate homogeneous node, these periods being more similar concerning the studied characteristics (Figure 8b). Also, the last two decades (2001–2020) were grouped in a separate branch, less homogenous, being aggregated at a higher dissimilarity index (77,378).
Similar studies concluded that increasing temperatures accelerate the rate of sugar accumulation in grapes, forcing growers to harvest earlier [78]. Thus, it is necessary for producers to sync grapevine cultivars with climates that are most compliant to their specific growing conditions. Harvest dates have shifted earlier historically, and climate models predict the further acceleration of grape ripening [10,78,84]. Extreme temperatures during grape maturation reduce grapevine metabolism, resulting in higher sugar levels and lower total acidity, affecting taste balance and the overall quality of the grapes [77]. According to Iland et al. [85], grapes from a hot environment are likely to possess lower acidity compared to fruit from a cool environment. For precision viticulture and the economic success of the grapevine plantation, it is necessary to know and select cultivars with a growing season length suitable for the type of climate and with biological resistance to extreme temperatures and erratic precipitation. Research on climate suitability must continue permanently, for a better understanding of what we are facing, testing the ability of plants to adapt to the new conditions and finding the best measures to ensure the sustainable cultivation of the grapevine and support its resilience to climate change.

4. Conclusions

Climate change poses a major challenge for viticulture. Global warming affects both grapevine physiology and biochemistry, changing grapevine phenology and berry composition. For the Copou-Iaşi wine-growing area, in northeastern Romania, the study revealed a significant gradual increase in the average air temperature in the last 50 years (+1.71 °C), more pronounced in the last 10 years (+0.61 °C). In the last decade, the number of days with extremely hot temperatures (>30 °C) was over 3.5 times higher compared with the first decades (1971–1990), in parallel with a fluctuating precipitation regime. The increase in the average air temperature in the last 40 years (1981–2020) was highly correlated with the advancement of grape maturity and harvesting date of V. vinifera L. white grape cultivars (up to 12 days), a significant increase in grape sugar accumulation (+15–25 g/L), and a drastic decrease in total acidity (−2.0–3.5 g/L as tartaric acid). Increasing positive, active, and effective sum of temperatures directly influences sugar accumulation and total acidity decrease in grapes of all analyzed cultivars (r > 0.90). However, climate changes exerted a distinctive impact on grapevine physiology and biochemistry depending on the cultivar. In the viticultural area of northeastern Romania, the last decade (2011–2020) made the transition from a humid temperate climate, unsuitable for red wine production (Winkler Region Ib-II), to a semi-humid warm temperate climate (Winkler Region III), more suitable for cultivars with a longer growing season or intended for red wine production. However, the transition from a climate with very cold nights to a climate with cold nights was noticed. Long-term climate change analysis, as part of the precision viticulture strategy and efficient management of vineyards, is of particular importance for grape producers and winemakers, to be prepared and to take action to counter the effects of global warming, to choose the most effective measures to maintain economic and sustainable grape growing, and to increase the resilience of viticulture to climate change.

Author Contributions

Conceptualization, R.M.F., R.V.F. and C.I.B.; methodology, R.M.F., R.V.F. and F.D.B.; software, R.V.F.; validation, D.D. and C.I.B.; formal analysis, R.M.F. and F.D.B.; investigation, R.M.F., R.V.F. and D.D.; resources, C.I.B., D.D. and R.V.F.; data curation, R.V.F. and F.D.B.; writing—original draft preparation, R.V.F.; writing—review and editing, R.M.F., D.D. and C.I.B.; visualization, D.D. and C.I.B.; supervision, R.M.F. and R.V.F.; funding acquisition, C.I.B. and F.D.B. All authors have read and agreed to the published version of the manuscript.

Funding

This research was funded by Ministry of Agriculture and Rural Development of Romania, project number ADER 6.3.10/21.07.2023.

Data Availability Statement

All data are contained within the article.

Acknowledgments

The authors gratefully acknowledge the University of Agricultural Sciences and Veterinary Medicine Cluj-Napoca for the financial and scientific support given in carrying out the research.

Conflicts of Interest

The authors declare no conflicts of interest.

References

  1. OIV (International Organization of Vine and Wine). State of the World Vine and Wine Sector in 2023. 2024. Available online: https://www.oiv.int/sites/default/files/2024-04/OIV_STATE_OF_THE_WORLD_VINE_AND_WINE_SECTOR_IN_2023.pdf (accessed on 5 April 2024).
  2. IPCC (Intergovernmental Panel on Climate Change). Climate change 2014: Synthesis Report. In Contribution of Working Groups I, II and III to the fifth Assessment Report of the Intergovernmental Panel on Climate Change; Pachauri, R.K., Meyer, L.A., Eds.; IPCC: Geneva, Switzerland, 2014; Available online: https://www.ipcc.ch/site/assets/uploads/2018/02/AR5_SYR_FINAL_Front_matters.pdf (accessed on 11 February 2024).
  3. Santos, J.A.; Fraga, H.; Malheiro, A.C.; Moutinho-Pereira, J.; Dinis, L.-T.; Correia, C.; Moriondo, M.; Leolini, L.; Dibari, C.; Costafreda-Aumedes, S.; et al. A review of the potential climate change impacts and adaptation options for European viticulture. Appl. Sci. 2020, 10, 3092. [Google Scholar] [CrossRef]
  4. Irimia, L.M.; Patriche, C.V.; Roșca, B. Climate change impact on climate suitability for wine production in Romania. Theor. Appl. Climatol. 2018, 133, 1–14. [Google Scholar] [CrossRef]
  5. Ilina-Dumitru, A.M.; Manolescu, A.E.; Sumedrea, D.I.; Florea, A.C.; Cosmulescu, S.N. Climate influence on the phenology of table grapes in Stefanesti, Romania. Acta H ortic. 2024, 1385, 181–188. [Google Scholar] [CrossRef]
  6. Lorenzo, M.N.; Taboada, J.J.; Lorenzo, J.F.; Ramos, A.M. Influence of climate on grape production and wine quality in the Rías Baixas, north-western Spain. Reg. Environ. Chang. 2013, 13, 887–896. [Google Scholar] [CrossRef]
  7. Palliotti, A.; Tombesi, S.; Silvestroni, O.; Lanari, V.; Gatti, M.; Poni, S. Changes in vineyard establishment and canopy management urged by earlier climate-related grape ripening: A review. Sci. Hortic. 2014, 178, 43–54. [Google Scholar] [CrossRef]
  8. Filimon, V.R.; Rotaru, L.; Filimon, R. Quantitative investigation of leaf photosynthetic pigments during annual biological cycle of Vitis vinifera L. table grape cultivars. S. Afr. J. Enol. Vitic. 2016, 37, 1–14. [Google Scholar] [CrossRef]
  9. Jones, G.V.; White, M.A.; Cooper, O.R.; Storchmann, K. Climate change and global wine quality. Clim. Chang. 2005, 73, 319–343. [Google Scholar] [CrossRef]
  10. Mira de Orduña, R. Climate change associated effects on grape and wine quality and production. Food Res. Int. 2010, 43, 1844–1855. [Google Scholar] [CrossRef]
  11. Droulia, F.; Charalampopoulos, I. Future climate change impacts on European viticulture: A review on recent scientific advances. Atmosphere 2021, 12, 495. [Google Scholar] [CrossRef]
  12. Van Leeuwen, C.; Darriet, P. The impact of climate change on viticulture and wine quality. J. Wine Econ. 2016, 11, 150–167. [Google Scholar] [CrossRef]
  13. Dequin, S.; Escudier, J.L.; Bely, M.; Noble, J.; Albertin, W.; Masneuf-Pomarède, I.; Marullo, P.; Salmon, M.J.; Sablayrolles, J.M.; Ollat, N. How to adapt winemaking practices to modified grape composition under climate change conditions. Oeno ONE 2017, 51, 205–214. [Google Scholar] [CrossRef]
  14. Jones, G.V.; Edwards, E.J.; Bonada, M.; Sadras, V.O.; Krstic, M.P.; Herderich, M.J. Climate change and its consequences for viticulture—Chapter 17. In Managing Wine Quality, Vol. 1: Viticulture and Wine Quality, 2nd ed.; Reynolds, A.G., Ed.; Woodhead Publishing: London, UK, 2022; pp. 727–778. [Google Scholar] [CrossRef]
  15. OIV (International Organization of Vine and Wine). Resolution OIV/VITI 333/2010. Definition of Vitivinicultural “Terroir”. 2010. Available online: https://www.oiv.int/public/medias/379/viti-2010-1-en.pdf (accessed on 12 February 2024).
  16. Brillante, L.; Bonfante, A.; Bramley, R.G.V.; Tardaguila, J.; Priori, S. Unbiased scientific approaches to the study of terroir are needed! Front. Earth Sci. 2020, 8, 539377. [Google Scholar] [CrossRef]
  17. Laget, F.; Tondut, J.L.; Deloire, A.; Kelly, T.M. Climate trend in a specific Mediterranean viticultural area between 1950 and 2006. J. Int. Sci. Vigne Vin. 2008, 42, 113–123. [Google Scholar] [CrossRef]
  18. Filimon, V.R.; Sandu-Ville, Ș.; Bora, F.D.; Tudor, G.; Filimon, R.; Nechita, A.; Damian, D. Methods for producing low-alcohol wine I. Viticultural and pre-fermentation strategies. Lucr. Şt. USAMV Iaşi-Serie Hortic. 2020, 63, 95–100. Available online: https://repository.uaiasi.ro/xmlui/handle/20.500.12811/1372 (accessed on 16 February 2024).
  19. Filimon, V.R.; Sandu-Ville, Ș.; Bora, F.D.; Tudor, G.; Filimon, R.; Nechita, A.; Zaiț, M. Methods for producing low-alcohol wine II. Fermentation and post-fermentation strategies. Lucr. Şt. USAMV Iaşi-Serie Hortic. 2020, 63, 101–106. Available online: https://repository.uaiasi.ro/xmlui/handle/20.500.12811/1373 (accessed on 18 February 2024).
  20. Pickering, G.J.; Heatherbell, D.A.; Barnes, M.F. The production of reduced alcohol wine using glucose oxidase treated juice. Part I. Composition. Am. J. Enol. Vitic. 1999, 50, 291–298. [Google Scholar] [CrossRef]
  21. Longo, R.; Blackman, J.W.; Antalick, G.; Torley, P.J.; Rogiers, S.Y.; Schmidtke, L.M. A comparative study of partial dealcoholisation versus early harvest: Effects on wine volatile and sensory profiles. Food Chem. 2018, 261, 21–29. [Google Scholar] [CrossRef] [PubMed]
  22. Ganichot, B. Évolution de la date des vendanges dans les Côtes-du-Rhône méridionales. In Proceedings of the 6th Rencontres rhodaniennes; Institut Rhodanien Editeur: Orange Avignon, France, 2002; pp. 38–41. [Google Scholar]
  23. Bucur, G.M.; Cojocaru, G.A.; Antoce, A.O. The climate change influences and trends on the grapevine growing in Southern Romania: A long-term study. BIO Web Conf. 2019, 15, 01008. [Google Scholar] [CrossRef]
  24. IPCC (Intergovernmental Panel on Climate Change). Summary for Policymakers. In Climate Change 2023: Synthesis Report. In Contribution of Working Groups I, II and III to the Sixth Assessment Report of the Intergovernmental Panel on Climate Change; Lee, H., Romero, J., Eds.; IPCC: Geneva, Switzerland, 2023; pp. 1–34. [Google Scholar] [CrossRef]
  25. WMO (World Meteorological Organization). Temperatures in Europe Increase more Than Twice Global Average. 2022. Available online: https://wmo.int/news/media-centre/temperatures-europe-increase-more-twice-global-average (accessed on 20 March 2024).
  26. Colibaba, L.C.; Bosoi, I.; Pușcalău, M.; Bodale, I.; Luchian, C.; Rotaru, L.; Cotea, V.V. Climatic projections vs. grapevine phenology: A regional case study. Not. Bot. Horti Agrobot. 2024, 52, 13381. [Google Scholar] [CrossRef]
  27. Beck, H.E.; McVicar, T.R.; Vergopolan, N.; Berg, A.; Lutsko, N.J.; Dufour, A.; Zeng, Z.; Jiang, X.; van Dijk, A.I.J.M.; Miralles, D.G. High-resolution (1 km) Köppen-Geiger maps for 1901-2099 based on constrained CMIP6 projections. Sci. Data 2023, 10, 724. [Google Scholar] [CrossRef] [PubMed]
  28. Google Earth. Map Showing Location of Iasi County, Romania. 2024. Available online: https://earth.google.com/web/search/Rom%C3%A2nia (accessed on 12 April 2024).
  29. Selyaninov, G.L. O selskogo khozyaistvennoi otsenka klimata [About the agricultural evaluation of the climate]. Trudy GGO. 1928, 20, 177–185. [Google Scholar]
  30. De Martonne, E. Aerisme et índices d’aridite. Comptesrendus de L’Academie Des. Sci. 1926, 182, 1395–1398. [Google Scholar]
  31. Branas, J.; Bernon, G.; Levadoux, L. Éléments de Viticulture Générale; Impr. Delmas: Montpellier, France, 1946. [Google Scholar]
  32. Constantinescu, G. Méthodes et principes de détermination des aptitudes viticoles d’une région et du choix des cépages appropriés. Bull. OIV 1967, 40, 1179–1205. [Google Scholar]
  33. Teodorescu, S.; Popa, A.I.; Sandu, G.H.N. Oenoclimatul României [The Oenoclimate of Romania]; Ştiinţifică şi Enciclopedică: Bucharest, Romania, 1987. [Google Scholar]
  34. Huglin, P. Biologie et Ecologie de la Vigne; Edition Payot: Lausanne, Switzerland, 1986. [Google Scholar]
  35. Winkler, A.J.; Cook, A.; Kliewer, W.M.; Lider, I.A. General Viticulture; University of California Press: Berkeley, CA, USA, 1974. [Google Scholar]
  36. Tonietto, J. Les Macroclimats Viticoles Mondiaux et L’influence du Mésoclimat sur la Typicité de la Syrah et du Muscat de Hambourg dans le sud de la France: Méthodologie de caractérisation. Ph.D. Dissertation, Ecole Nationale Supérieure Agronomique, Montpellier, France, 1999. [Google Scholar]
  37. Eichhorn, K.W.; Lorenz, D.H. Phänologische entwicklungsstadien der rebe [Phenological stages of the vine]. Nach Deut. Pflanzenschutzd 1977, 29, 119–120. Available online: https://www.openagrar.de/servlets/MCRFileNodeServlet/openagrar_derivate_00037935/1977-032.pdf (accessed on 10 February 2024).
  38. OIV (International Organization of Vine and Wine). Compendium of International Methods of Wine and Must Analysis; OIV: Paris, France, 2019; Volume 1, Available online: https://www.oiv.int/public/medias/7907/oiv-vol1-compendium-of-international-methods-of-analysis.pdf (accessed on 10 February 2024).
  39. Antón, J.; Cattaneo, A. Chapter 15—Agricultural Risk Management and Climate Change: What role for policy? In Handbook of International Food and Agricultural Policies. Vol. IV: Global Challenges for Future Food and Agricultural Policies; Blandford, D., Hassapoyannes, K., Eds.; World Scientific Publishing: Hackensack, NJ, USA, 2019; pp. 281–306. [Google Scholar] [CrossRef]
  40. Antón, J.; Cattaneo, A.; Kimura, S.; Lankoski, J. Agricultural risk management policies under climate uncertainty. Glob. Environ. Chang. 2013, 23, 1726–1736. [Google Scholar] [CrossRef]
  41. Chan, E.Y. Climate change is the world’s greatest threat—In Celsius or Fahrenheit? J. Environ. Psychol. 2018, 60, 21–26. [Google Scholar] [CrossRef]
  42. Dimri, A.P.; Kumar, D.; Choudhary, A.; Maharana, P. Future changes over the Himalayas: Mean temperature. Glob. Planet. Chang. 2018, 162, 235–251. [Google Scholar] [CrossRef]
  43. Irimia, L.M. Biologia, Ecologia şi Fiziologia Viţei de vie [Biology, Ecology and Physiology of the Grapevine]; Ion Ionescu de la Brad: Iaşi, Romania, 2012. [Google Scholar]
  44. Jones, G.V. Climate, grapes, and wine: Structure and suitability in a changing climate. Acta Hortic. 2012, 931, 19–28. [Google Scholar] [CrossRef]
  45. US EPA (U.S. Environmental Protection Agency). Climate Change Indicators: U.S. and Global Temperature. 2022. Available online: https://www.epa.gov/climate-indicators/climate-change-indicators-us-and-global-temperature (accessed on 10 April 2024).
  46. US EPA (U.S. Environmental Protection Agency). Climate Change Indicators: U.S. and Global Precipitation. 2022. Available online: https://www.epa.gov/climate-indicators/climate-change-indicators-us-and-global-precipitation (accessed on 10 April 2024).
  47. Galet, P. Précis de Viticulture Pratique, 6th ed.; Pierre Galet: Montpellier, France, 1993. [Google Scholar]
  48. Williams, L.E. Grapevine water relations. In Raisin Production Manual; Christensen, L.P., Ed.; DANR Publications, University of California: Oakland, CA, USA, 2000; pp. 121–126. [Google Scholar]
  49. Burzo, I.; Dejeu, L.; Şerdinescu, A.; Bădulescu, L. Fiziologia plantelor de Cultură. Fiziologia viţei de vie [The Physiology of crop Plants. Grapevine Physiology]; Elisavaros: Bucharest, Romania, 2005; Volume 3. [Google Scholar]
  50. Asseng, S.; Zhu, Y.; Wang, E.; Zhang, W. Chapter 20—Crop modeling for climate change impact and adaptation. In Crop Physiology, 2nd ed.; Sadras, V.O., Calderini, D.F., Eds.; Academic Press: Amsterdam, The Netherlands, 2015; pp. 505–546. [Google Scholar] [CrossRef]
  51. Chen, G.; Liu, H.; Zhang, J.; Liu, P.; Dong, S. Factors affecting summer maize yield under climate change in Shandong Province in the Huanghuaihai Region of China. Int. J. Biometeorol. 2012, 56, 621–629. [Google Scholar] [CrossRef] [PubMed]
  52. Dore, M.H.I. Climate change and changes in global precipitation patterns: What do we know? Environ. Int. 2005, 31, 1167–1181. [Google Scholar] [CrossRef]
  53. Caloiero, T.; Caloiero, P.; Frustaci, F. Long-term precipitation trend analysis in Europe and in the Mediterranean basin. Water Environ. J. 2018, 32, 433–445. [Google Scholar] [CrossRef]
  54. Venios, X.; Korkas, E.; Nisiotou, A.; Banilas, G. Grapevine responses to heat stress and global warming. Plants 2020, 9, 1754. [Google Scholar] [CrossRef] [PubMed]
  55. Zhang, K.; Chen, B.-H.; Hao, Y.; Yang, R.; Wang, Y.-A. Effects of short-term heat stress on PSII and subsequent recovery for senescent leaves of Vitis vinifera L. cv. Red Globe. J. Integr. Agric. 2018, 17, 2683–2693. [Google Scholar] [CrossRef]
  56. Berry, J.; Bjorkman, O. Photosynthetic response and adaptation to temperature in higher plants. Annu. Rev. Plant Physiol. 2003, 31, 491–543. [Google Scholar] [CrossRef]
  57. Bucur, G.M.; Dejeu, L. Research on phenotyping and eno-carpological traits of twenty-three new Romanian table grape varieties (Vitis vinifera L.). Conf. Proceeding Agric. Life. Life Agric. 2018, 1, 268–275. [Google Scholar] [CrossRef]
  58. Ren, C.; Fan, P.; Li, S.; Liang, Z. Advances in understanding cold tolerance in grapevine. Plant Physiol. 2023, 192, 1733–1746. [Google Scholar] [CrossRef] [PubMed]
  59. Rotaru, L.; Colibaba, L.C. Elemente de Geografie Viticolă [Elements of Viticultural Geography]; Ion Ionescu de la Brad: Iaşi, Romania, 2022. [Google Scholar]
  60. Ding, Y.; Shi, Y.; Yang, S. Advances and challenges in uncovering cold tolerance regulatory mechanisms in plants. New Phytol. 2019, 222, 1690–1704. [Google Scholar] [CrossRef] [PubMed]
  61. Marcon Filho, J.L.; Allebrandt, R.; de Bem, B.; Mudrei, P.I.; Macedo, T.A.; Schlemper, C.; Lerin, S.; Outemane, M.; Kretzschmar, A.A.; Rufato, L. Damage to ‘Cabernet Sauvignon’ after late frost in the southern Brazilian highlands. Acta Hortic. 2016, 1115, 211–216. [Google Scholar] [CrossRef]
  62. Irimia, L.M.; Patriche, C.V.; Roșca, B. Changes in oenoclimate aptitude index characterizing climate suitability of Romanian wine growing regions. Appl. Ecol. Environ. Res. 2017, 15, 755–767. [Google Scholar] [CrossRef]
  63. Rotaru, L.; Filimon, V.R.; Filimon, R.M.; Mustea, M.; Bernardis, R.R.; Colibaba, L.C. Preliminary studies on some morpho-structural and biochemical characterization of some genotypes of Vitis vinifera L. cultivated in northeast Romania. J. Appl. Life Sci. Environ. 2024, 57, 69–90. [Google Scholar] [CrossRef]
  64. Jones, G.V.; Duff, A.A.; Hall, A.; Myers, J.W. Spatial analysis of climate in wine grape growing regions in the Western United States. Am. J. Enol. Vitic. 2010, 61, 313–326. [Google Scholar] [CrossRef]
  65. Oşlobeanu, M.; Macici, M.; Georgescu, M.; Stoian, V. Zonarea Soiurilor de viţă de vie în România [The Zoning of Grapevine Varieties in Romania]; Ceres: Bucharest, Romania, 1991. [Google Scholar]
  66. Voropay, N.N.; Ryazanova, A.A. A comparative assessment of the aridity indices for analysis of the hydrothermal conditions. IGCCMR IOP Publ. IOP Conf. Ser. Earth Environ. Sci. 2018, 190, 012041. [Google Scholar] [CrossRef]
  67. Navrátilová, M.; Beranová, M.; Severová, L.; Šrédl, K.; Svoboda, R.; Abrhám, J. The impact of climate change on the sugar content of grapes and the sustainability of their production in the Czech Republic. Sustainability 2021, 13, 222. [Google Scholar] [CrossRef]
  68. Zapata, D.; Salazar-Gutierrez, M.; Chaves, B.; Keller, M.; Hoogenboom, G. Predicting key phenological stages for 17 grapevine cultivars (Vitis vinifera L.). Am. J. Enol. Vitic. 2016, 68, 60–72. [Google Scholar] [CrossRef]
  69. Nechita, A.; Zaldea, G.; Damian, D.; Filimon, R.M.; Pisticiuc, I.; Filimon, V.R. The evolution over time of the development of vegetation phenophases of the vine varieties cultivated in the Copou Iaşi wine center in the context of climate change. Lucr. Şt. USAMV Iaşi Ser. Hortic. 2020, 63, 89–94. Available online: https://repository.uaiasi.ro/xmlui/handle/20.500.12811/1369 (accessed on 10 March 2024).
  70. Ausseil, A.E.; Law, R.M.; Parker, A.K.; Teixeira, E.I.; Sood, A. Projected wine grape cultivar shifts due to climate change in New Zealand. Front Plant Sci. 2021, 12, 618039. [Google Scholar] [CrossRef]
  71. Zaldea, G.; Nechita, A.; Damian, D.; Ghiur, A.D.; Cotea, V.V. Climate changes in recent decades, the evolution of the drought phenomenon and the impact on vineyards in north-eastern Romania. Not. Bot. Horti Agrobot. 2021, 49, 12448. [Google Scholar] [CrossRef]
  72. Ruml, M.; Korać, N.; Vujadinović, M.; Vuković, A.; Ivanišević, D. Response of grapevine phenology to recent temperature change and variability in the wine-producing area of Sremski Karlovci, Serbia. J. Agric. Sci. 2016, 154, 186–206. [Google Scholar] [CrossRef]
  73. Koch, B.; Oehl, F. Climate change favors grapevine production in temperate zones. Agric. Sci. 2018, 9, 247–263. [Google Scholar] [CrossRef]
  74. Duchêne, E.; Schneider, C. Grapevine and climatic changes: A glance at the situation in Alsace. Agron. Sustain. Dev. 2005, 25, 93–99. [Google Scholar] [CrossRef]
  75. Schultz, H.R.; Jones, J.V. Climatic induced historic and future changes in viticulture. J. Wine Res. 2010, 21, 137–145. [Google Scholar] [CrossRef]
  76. Schultz, H.R. Global climate change, sustainability, and some challenges for grape and wine production. J. Wine Econ. 2016, 11, 181–200. [Google Scholar] [CrossRef]
  77. Hussain Shah, M.; Rafique, R.; Rafique, T.; Naseer, M.; Khalil, U.; Rafique, R. Effect of Climate Change on Polyphenols Accumulation in Grapevine; IntechOpen: London, UK, 2022. [Google Scholar] [CrossRef]
  78. Stanfield, R.C.; Forrestel, E.J.; Elmendorf, K.E.; Bagshaw, S.B.; Bartlett, M.K. Phloem anatomy predicts berry sugar accumulation across 13 wine-grape cultivars. Front. Plant Sci. 2024, 15, 1360381. [Google Scholar] [CrossRef] [PubMed]
  79. Rogiers, S.Y.; Greer, D.H.; Liu, Y.; Baby, T.; Xiao, Z. Impact of climate change on grape berry ripening: An assessment of adaptation strategies for the Australian vineyard. Front. Plant Sci. 2022, 13, 1094633. [Google Scholar] [CrossRef] [PubMed]
  80. Arias, L.A.; Berli, F.; Fontana, A.; Bottini, R.; Piccoli, P. Climate change effects on grapevine physiology and biochemistry: Benefits and challenges of high altitude as an adaptation strategy. Front. Plant Sci. 2022, 13, 835425. [Google Scholar] [CrossRef]
  81. Filimon, V.R.; Filimon, R.M.; Nechita, A.; Bora, F.D.; Cotea, V.V. Compositional characteristics of low-alcohol wines obtained by staggered grape harvesting technology. Lucr. Şt. USAMV Iaşi Ser. Agron. 2021, 64, 69–74. Available online: https://repository.uaiasi.ro/xmlui/handle/20.500.12811/3000 (accessed on 12 March 2024).
  82. Filimon, R.M.; Rotaru, L.; Filimon, V.R. Effects of exogenous growth regulators on agrobiological, technological and physiological characteristics of an interspecific grapevine cultivar. Biol. Agric. Hortic. 2023, 39, 91–114. [Google Scholar] [CrossRef]
  83. Rotaru, L. Identifying the phenotypic resemblances of the vine breeds by means of cluster analysis. Not. Bot. Hort. Agrobot. 2009, 37, 249–252. [Google Scholar]
  84. Delrot, S.; Grimplet, J.; Carbonell-Bejerano, P.; Schwandner, A.; Bert, P.F.; Bavaresco, L.; Costa, L.D.; Di Gaspero, G.; Duchêne, E.; Hausmann, L.; et al. Genetic and genomic approaches for adaptation of grapevine to climate change. In Genomic Designing of Climate-Smart Fruit Crops; Kole, C., Ed.; Springer: Cham, Switzerland, 2020. [Google Scholar] [CrossRef]
  85. Iland, P.; Dry, P.; Proffit, T.; Tyerman, S.; Collins, C.; Pagay, V.; Steel, C. The Grapevine: From the Science to the Practice of Growing Vines for Wine; Patrick Iland Wine Promotions: Adelaide, Australia, 2024. [Google Scholar]
Figure 1. The location of the Copou-Iaşi wine-growing center (NE of Romania). Source: Google Earth [28].
Horticulturae 10 00705 g001
Figure 2. Evolution of annual average temperatures (a) and growing season average temperature (b) in the Copou-Iaşi wine-growing center, NE of Romania (1971–2020). Note: The mean values of the decades are presented as the average of the annual data (n = 10) with standard deviation (±). Values with the same letter are not statistically significant (p > 0.05) using Tukey’s test.
Horticulturae 10 00705 g002
Figure 3. Changes in the annual average precipitation (a) and growing season average precipitation (April–September) (b) in the Copou-Iaşi wine-growing center, NE of Romania (1971–2020). Note: The mean values of the decades are presented as the average of the annual data (n = 10) with standard deviation (±). Values with the same letter are not statistically significant (p > 0.05) using Tukey’s test.
Horticulturae 10 00705 g003
Figure 4. The average number of days with temperatures above 30 °C (a) and above 35 °C (b) in the Copou-Iaşi wine-growing center, NE of Romania (1971–2020). Note: The mean values of the decades are presented as the average of the annual data (n = 10) with standard deviation (±). Values with the same letter are not statistically significant (p > 0.05) using Tukey’s test.
Horticulturae 10 00705 g004
Figure 5. The average number of days with temperatures below −15 °C (December, January, and February; winter frost) (a) and below −2 °C (March, April, May; spring frost) (b) in the Copou-Iaşi wine-growing center, NE of Romania (1971–2020). Note: The mean values of the decades are presented as the average of the annual data (n = 10), with standard deviation (±). Values with the same letter are not statistically significant (p > 0.05) using Tukey’s test.
Horticulturae 10 00705 g005
Figure 6. The comparative presentation of the grape harvest intervals (by decade), in the Copou-Iasi wine-growing center, NE of Romania (1981–2020). Note: The decade average was calculated as the mean value of the annual data (n = 10), for each cultivar.
Horticulturae 10 00705 g006
Figure 7. Changes in sugar amount (g/L) and total acidity (g/L as tartaric acid) in mature grapes of Fetească Albă (a), Fetească Regală (b), Aligoté (c), and Muscat Ottonel (d) cultivars in the period 1981–2020, in the Copou-Iaşi wine-growing center (NE of Romania). Note: The mean values of the decades are presented as the average of the annual data (n = 10), with standard deviation (±). Values with the same letter are not statistically significant (p > 0.05) using Tukey’s test.
Horticulturae 10 00705 g007aHorticulturae 10 00705 g007b
Figure 8. Principal Component Analysis (PCA) biplot combining the output variables (a) and the Agglomerative Hierarchical Clustering (AHC) of the decades (b) for the interval 1981–2020, in the Copou-Iaşi wine-growing center. Note: FA—Fetească Albă cv.; FR—Fetească Regală cv.; Alig.—Aligoté; MO—Muscat Ottonel cv.; GS—growing season; T—temperature; Harvest—harvest date; Σt°u—the sum of active temperatures; HC—hydrothermal coefficient; IDM—De Martonne aridity index; IHr—actual heliotermal index; Ibcv—grapevine bioclimatic index; IAOe—oenoclimate aptitude index; HI—Huglin index; Wi—Winkler index; CNI—cool night index.
Horticulturae 10 00705 g008
Table 1. Changes in the main bioclimatic indices of the Copou-Iaşi wine-growing center, NE of Romania, in the period 1971–2020.
Bioclimatic
Indices
DecadesAverage
(1971–2020)
1971–19801981–19901991–20002001–20102011–2020
Σt°g (°C)3020 ± 172 c3083 ± 99 c3159 ± 148 bc3262 ± 140 ab3398 ± 139 a3185 ± 191
Σt°a (°C)2864 ± 191 c2958 ± 139 c3021 ± 191 bc3151 ± 130 ab3291 ± 168 a3057 ± 219
Σt°u (°C)1251 ± 160 c1308 ± 87 c1379 ± 126 bc1469 ± 136 ab1609 ± 132 a1403 ± 178
HCAverage1.5 ± 0.41.3 ± 0.41.4 ± 0.51.3 ± 0.41.1 ± 0.31.3 ± 0.4
ClassModerate humidityModerate
humidity
Moderate
humidity
Moderate
humidity
Insufficient humidityModerate humidity
IDMAverage30 ± 827 ± 731 ± 830 ± 527 ± 629 ± 7
ClassHumid Semi-humid Humid HumidSemi-humidHumid
IHrAverage1.8 ± 0.3 bc1.8 ± 0.3 cd2.1 ± 0.3 c2.1 ± 0.2 ab2.4 ± 0.3 a2.1 ± 0.3
IbcvAverage7.0 ± 3.67.2 ± 2.77.2 ± 2.67.7 ± 2.99.2 ± 3.37.7 ± 3.0
IAOeAverage4152 ± 280 c4223 ± 301 c4325 ± 399 bc4482 ± 266 cb4690 ± 252 ab4375 ± 352
ClassUnsuitable for red wine productionUnsuitable for red wine productionMedium
favorability for red wine
Medium
favorability for red wine
Very
favorable for red wine
Medium
favorability for red wine
HIAverage1822 ± 181 c1928 ± 130 c1976 ± 190 bc2098 ± 150 ab2268 ± 161 a2018 ± 222
ClassHI3—temperate climateHI3
temperate climate
HI3
temperate climate
HI4
temperate
climate
HI4—warm temperate climateHI3
temperate climate
WIAverage1303 ± 159 c1374 ± 78 c1452 ± 133 bc1535 ± 120 ab1682 ± 139 a1469 ± 181
ClassIbIbIIIIIIIII
CNIAverage10.9 ± 1.210.9 ± 1.310.8 ± 1.811.1 ± 0.612.2 ± 1.211.2 ± 1.3
ClassVery cold nightsVery cold nightsVery cold nightsVery cold nightsCold nightsVery cold nights
Note: Σt°g—the sum of positive temperatures; Σt°a—the sum of active temperatures; Σt°u—the sum of effective temperatures; HC—hydrothermal coefficient; IDM—De Martonne aridity index; IHr—actual heliothermal index; Ibcv—grapevine bioclimatic index; IAOe—oenoclimate aptitude index; HI—Huglin index; WI—Winkler index; CNI—cool night index. Values with the same letter are not statistically significant (p > 0.05) using Tukey’s test.
Table 2. Pearson correlation coefficients of the relationships between climatic factors (1981–2020), phenological and chemical data of the analyzed V. vinifera L. cultivars (Copou-Iaşi wine-growing center; NE of Romania).
ParametersNo. Days T > 35 °CNo. Days T > 30 °CGST (°C)Annual T (°C)GS
PP (mm)
Annual PP (mm)FA
Sugars
FR
Sugars
Al
Sugars
MO SugarsFA AcidityFR AcidityAl
Acidity
MO Acidity
FA H-date −0.6186−0.6731−0.6825−0.68450.4956−0.2119
FR H-date −0.7260−0.8280−0.8534−0.85500.6604−0.1025
Al H-date −0.8395−0.9045−0.9017−0.90260.78000.0811
MO H-date −0.7806−0.9416−0.9833−0.98320.86420.2408
FA sugars 0.90400.98150.97050.9696−0.9660−0.47001
FR sugars 0.98020.95950.89830.8977−0.9352−0.44130.89771
Al sugars 0.98640.95620.88910.8884−0.9420−0.47280.89690.99931
MO sugars 0.85220.97100.98560.9851−0.9252−0.36220.99170.86450.85951
FA acidity −0.9094−0.9895−0.9854−0.98540.91280.2782−0.9520−0.9554−0.9473−0.95411
FR acidity −0.9902−0.9793−0.9199−0.91890.97770.5237−0.9456−0.9884−0.9904−0.91070.95761
Al acidity −0.9926−0.9649−0.8975−0.89660.96090.5101−0.9168−0.9962−0.9981−0.87820.94840.99671
MO acidity −0.9720−0.9940−0.9534−0.95270.97150.4608−0.9646−0.9821−0.9812−0.94160.97960.99530.98771
Σt°g 0.89370.99250.99670.9964−0.9308−0.32550.98280.92330.91680.9875−0.9894−0.9471−0.9265−0.9733
Σt°a 0.91350.99670.99120.9908−0.9482−0.37180.98800.93460.92980.9861−0.9877−0.9603−0.9405−0.9820
Σt°u 0.87890.98630.99470.9943−0.9319−0.34440.99000.90070.89490.9961−0.9768−0.9345−0.9086−0.9627
HC−0.9698−0.9851−0.9384−0.93720.99420.5578−0.9807−0.9540−0.9569−0.95120.95120.98780.97190.9895
IDM−0.9649−0.9202−0.8388−0.83680.99250.7320−0.9326−0.9061−0.9171−0.87830.85740.95550.93930.9393
IHr0.88900.98790.99440.9944−0.9068−0.26090.96020.93540.92650.9682−0.9978−0.9441−0.9300−0.9712
Ibcv0.92690.99750.98610.9858−0.9395−0.34350.97050.95850.95270.9666−0.9972−0.9702−0.9579−0.9890
IAOe0.91760.99360.98630.9862−0.9249−0.30640.96050.95740.95040.9601−0.9995−0.9637−0.9532−0.9843
HI0.92900.99720.98200.9813−0.9653−0.42700.99300.93860.93600.9842−0.9800−0.9692−0.9489−0.9863
WI0.86890.98440.99860.9984−0.9169−0.30050.98180.90040.89300.9924−0.9822−0.9285−0.9042−0.9593
CNI0.71270.87000.91300.8820−0.8842−0.29360.94430.70630.70500.9278−0.8802−0.7946−0.7305−0.8251
Note: FA—Fetească Albă cv.; FR—Fetească Regală cv.; Al—Aligoté; MO—Muscat Ottonel cv.; Σt°g—the sum of positive temperatures; Σt°a—the sum of active temperatures; Σt°u—the sum of effective temperatures; HC—hydrothermal coefficient; IDM—De Martonne aridity index; IHr—actual heliotermal index; Ibcv—grapevine bioclimatic index; IAOe—oenoclimate aptitude index; HI—Huglin index; WI—Winkler index; CNI—cool night index; PP (mm)—precipitation; T (°C)—temperature; GS—growing season; H-date—harvest date. Correlation coefficients marked in bold are shown in the text (p < 0.05; Microsoft® Excel; data analysis).
Disclaimer/Publisher’s Note: The statements, opinions and data contained in all publications are solely those of the individual author(s) and contributor(s) and not of MDPI and/or the editor(s). MDPI and/or the editor(s) disclaim responsibility for any injury to people or property resulting from any ideas, methods, instructions or products referred to in the content.

