Article

Genome-Wide Identification and Characterization of Sucrose Metabolism Genes Involved in Actinidia rufa and Their Expression Profiling during the Fruit Developmental Stages

1
Xi’an Botanical Garden of Shaanxi Province (Institute of Botany of Shaanxi Province), Xi’an 710061, China
2
School of Biological Science and Technology, Baotou Teachers’ College, Baotou 014030, China
3
Key Laboratory of Resource Biology and Biotechnology in Western China (Ministry of Education), College of Life Sciences, Northwest University, Xi’an 710069, China
4
State Key Laboratory of Arid Land Crop Science, Gansu Agricultural University, Lanzhou 730070, China
*
Authors to whom correspondence should be addressed.
Horticulturae 2024, 10(7), 772; https://doi.org/10.3390/horticulturae10070772
Submission received: 24 June 2024 / Revised: 18 July 2024 / Accepted: 19 July 2024 / Published: 21 July 2024
(This article belongs to the Section Genetics, Genomics, Breeding, and Biotechnology (G2B2))

Abstract

:
Soluble sugars, as an indispensable source of energy, play crucial roles in plant growth and development. However, to date, scant information about the sucrose metabolism-related gene families is available in kiwifruit (Actinidia rufa Planch). Here, we systematically identified the members of various gene families encoding crucial enzymes or transporters involved in sucrose metabolism, re-analyzed their expression patterns under different fruit development stages, and determined the regulatory mechanism involving key transcription factors. A total of sixty-two genes from six gene families (thirty-one ArINVs, two ArSPPs, four ArSPSs, nine ArSUSs, six ArSUCs/SUTs, and ten ArSWEETs) were identified in the A. rufa genome. The characterization of these members, including gene structure, motifs, conserved domains, and cis-acting elements, were analyzed. Phylogenetic analysis revealed that these gene families could be categorized into six distinct subgroups. These six gene families have undergone strong purifying selection during domestication. In addition, expression analysis of the 62 genes indicated that differential expression patterns are highly regulated by developmental processes. Specifically, we identified 11 transcription factors that were rigorously correlated (r > 0.98) with key gene expression profiles. This represents a comprehensive analysis of the genes involved in sucrose metabolism in kiwifruit, which provides useful information for further functional analysis of these genes.

1. Introduction

Soluble sugars are the key players not only as predominant energy and nutrient sources but also as key signaling molecules for regulating the gene expression in various metabolic pathways [1,2]. Especially, in fruit crops, sweetness has a strong influence on organoleptic fruit quality, which is determined by soluble sugars, including sucrose and its degradation products glucose and fructose [3,4]. Thus, systematically dissecting the genes involved in fruit sugar metabolism during fruit development is an indispensable aspect of enhancing fruit quality research.
The sugar metabolism process is known to act as an elaborate system and is assigned to synthesis, transport, and degradation [5,6]. In higher plants, sucrose is the preferred long-distance transport form in which photosynthetic carbohydrate is transported from mesophyll cells to sink cells (e.g., fruit, root, or shoot tips) in the phloem [7]. In sink tissues, two enzymes, namely, neutral invertase (INV, EC 3.2.1.26) and sucrose synthase (SUS, EC 2.4.1.13), convert sucrose into Fru and Glc or Fru and UDP glucose (UDPG). The resulting Fru and Glc are then phosphorylated to fructose 6-phosphate (F6P) and glucose 6-phosphate (G6P) by fructokinase (FK, EC 2.7.1.4) and hexokinase (HK, EC 2.7.1.1), respectively [1]. The following sucrose re-synthesis processes involve two major enzymes, in which both F6P and UDPG can be catalyzed by sucrose phosphate synthase (SPS) and sucrose-6-phosphate (S6P) and subsequently converted to sucrose by sucrose-6-phosphate phosphatase (SPP) [1]. Being major players in sucrose synthesis and degradation, various gene families encoding key enzymes (e.g., INV, SUS, SPS, and SPP) have been extensively documented in edible fruits, such as pear [8], watermelon [3], and tomato [9]. However, our knowledge remains quite limited regarding their biological functions and the relationships among these gene families during fruit development.
Furthermore, photosynthetic sucrose translocation requires the assistance of sugar transporters (STs) across plant membranes, such as sucrose transporters (SUTs/SUCs) and SWEETs (sugars will eventually be exported transporters) [10,11]. The SUT gene family is a rather small protein family that contains twelve transmembrane domains (TMDs), with nine genes in Arabidopsis [12]. The SWEET family is structurally a different type of superfamily and is characterized by seven TMDs, and there are seventeen SWEETs encoded in Arabidopsis [10]. Members of the sucrose translocation between source and sink organs are important, and most of the STs have been isolated from crops, fruits, and other plants, e.g., four SUCs/SUTs in Ananas comosus [13] and fifteen SWEETs in Prunus salicina [14].
The involvement of sucrose in fruit development and ripening has been well documented, and several gene families that encode key enzymes or transporters have been characterized to be critical for modulating sucrose concentration and distribution by their expression patterns. For instance, at the early development stage of apple (Malus domestica), the rapid utilization of sucrose is attributed to higher SUS, INV, HK, and FK activities for fruit growth compared with ripe fruit, with low levels of sugar accumulation, whereas SPS activity is increased at the late development stage, particularly MdSPS5 and MdSPS6, which corresponds to massive sucrose accumulation [8]. In mango (Mangifera indica), the expression of two sucrose transporter genes, MiSWEET12 and MiSWEET15, was highly upregulated, accompanied by an increase in sugar content [15]. In addition, there is accumulating evidence to support the suggestion that the expression of soluble sugar metabolizing structural genes is tightly controlled by transcription factors. In kiwifruit (A. chinensis), AcERF182 has been shown to interact with AcBAM3.5 proteins and function in soluble sugar accumulation [16]. Numerous transcription factors (TFs), including ERF, NAC, MYB, and bHLH, had expressions that were highly correlated with sugar metabolic regulation genes and formed a correlation network [17]. Therefore, members of the gene family and TFs involved in sugar metabolism are important for understanding the regulatory mechanisms of sugar accumulation in fruit.
Kiwifruit (Actinidia rufa Planch, Actinidiaceae), an economically important fruit crop, is native to subtropical and warm–temperate regions, such as Korea, Taiwan, and Japan [16,17,18]. Owing to its agricultural characteristics (e.g., drought resistance, disease resistance, and waterlogging tolerance), A. rufa is favored by breeders for enhancing the quality of commercial kiwifruit cultivars [19]. Especially, the hybrids of A. rufa and A. chinensis have high-quality small fruits with a sugar content of 17 to 20% and a low level of protease, thus eliminating any mouth irritation [20]. Previous studies on A. rufa have analyzed its chemical compounds from roots to explore potential anti-tumor mechanisms [21]. Despite its potential in medicine and crop improvement, molecular studies on A. rufa lag behind those of other kiwifruit cultivars. In recent years, whole-genome sequences are now available for many Actinidia species (e.g., A. arguta, A. chinensis, and A. eriantha;, a large number of functional genes and their gene family members are involved in ascorbic acid (AsA), and anthocyanin and resistance had been reported [22,23,24]. The differential expression patterns of gene members indicate the specific functions of each member in plants under different development stages [25,26]. Although there have been some reports on the accumulation of sucrose and a related single family or several gene families during kiwifruit development [22,26,27,28], how multiple gene families related to sucrose metabolism are regulated at the gene expression level and their correlation with developmental stages remain unclear.
The A. rufa genome and the transcriptome of fruit development were recently reported [25,29], laying a foundation for a genome-wide analysis of the sucrose metabolism gene family in kiwifruit. In this study, six gene families (ArINVs, ArSPPs, ArSPSs, ArSUSs, ArSUCs/SUTs, and ArSWEETs) encoding crucial enzymes or transporters involved in sucrose metabolism were identified. The characterization of these members, including gene structure, motifs, conserved domains, and cis-acting elements, were detected. We further compared their expression patterns in different stages and analyzed the relationship between their relative transcript and TFs. The results could provide clues for elucidating the functions of genes in sucrose transport or accumulation of kiwifruit.

2. Materials and Methods

2.1. Identification of Sucrose Metabolism Genes in the A. rufa Genome

The genome details of A. rufa were downloaded from the Genome Warehouse (GWH, https://ngdc.cncb.ac.cn/gwh/ (accessed on 1 December 2023)). For the identification of sucrose metabolism-related gene families (INV, SPP, SPS, SUS, SUC/SUT, and SWEET) in A. rufa, the Hidden Markov Model (HMM) profiles containing the representative domains were retrieved from PFAM [30] and were then used to search candidates against the A. rufa genome using HMMER v3.1 [31]. Subsequently, these six kinds of gene families were further verified as to whether they were known members of sucrose metabolism gene families from Arabidopsis thaliana (https://www.arabidopsis.org/ (accessed on 5 December 2023)) using BLASTP v2.2.30+ with an E-value < 1 × 10⁻⁵. The redundant hits generated from the HMM and BLASTP v2.2.30+ searches were removed. The details for the structural domains and the HMM profiles of all protein sequences were arranged in Table S1. Finally, the physicochemical properties of the resulting candidate sucrose metabolism genes in A. rufa were assessed by EXPASY (http://ca.expasy.org/ (accessed on 10 December 2023)).

2.2. Phylogenetic Analysis

To study the key genes involved in sucrose metabolism in A. rufa, we used the six gene families (INV, SPP, SPS, SUS, SUC/SUT, and SWEET) derived in Actinidia chinensis cv. Hongyang, Actinidia eriantha, Actinidia hemsleyana, Arabidopsis thaliana, Solanum lycopersicum, and Vitis vinifera, to construct phylogenetic trees (Table S2). The unrooted evolutionary tree was constructed based on the aligned amino acid sequences using MEGA v7.0 with the neighbor-joining (NJ) method [32]. The parameters were as follows: aligne, muscle; model, p-distance; bootstraps, 1000 replicates; and gaps/missing data, partial deletion.

2.3. Gene Structure Construction, Conserved Motifs, and Cis-Acting Elements Identification

The exon/intron structure was retrieved from GSDS v2.0 [33]. The conserved protein motifs were analyzed by MEME [34]. The upstream 2k bp region of the candidates extracted from the four kiwifruit genomes (A. chinensis, A. eriantha, A. hemsleyana, and A. rufa) and the putative promoter sequences were explored by the PlantCARE database (https://bioinformatics.psb.ugent.be/webtools/plantcare/html/ (accessed on 20 December 2023)).

2.4. Subcellular Localization and Protein Physicochemical Properties Analysis

The physicochemical properties of the identified candidates were predicted by the online tool EXPASY (https://www.expasy.org (accessed on 10 December 2023)). The subcellular localization of all genes was predicted using subCELlular LOcalization predictor: CELLO v2.5 (http://cello.life.nctu.edu.tw/ (accessed on 12 December 2023)).

2.5. Collinearity and Selective Pressure Analysis

The Multiple Collinearity Scan toolkit (MCScanX) in TBtools v2.084 with default parameters was adopted to analyze the syntenic chains among the gene family members [35,36]. All the amino acid sequences were aligned with MUSCLE in ParaAT v2.0 [37]. Then, the KaKs_Calculator v2.0 was employed to calculate the nonsynonymous (Ka) and synonymous (Ks) substitution ratio, where Ka/Ks < 1 or Ka/Ks > 1 indicated purifying selection and positive selection, respectively [38].

2.6. Transcriptome Profile Analysis

For the transcriptome analysis, the raw RNA-seq reads of the eight fruit samples from A. rufa at 20 days after fruiting (DAF20), DAF40, DAF60, and DAF120 were obtained from Liu et al. [23], and then filtered adapters and low-quality reads using Trimmomatic v0.33 with the default parameters [39]. The generated clean reads were mapped to the reference genome of A. rufa using HISAT2 v2.2.1 with the default settings [40]. Subsequently, HTseq was employed to evaluate the read counts of each gene [41], and then the expression patterns of the genes were calculated using the FPKM values. The differential expressed genes (DEGs) between different stages were identified by DESeq2 based on the following criteria: log2Fold Change > 1 with adjusted p-values < 0.05 [42].
To investigate the expression dynamics of the sucrose metabolism genes with fruit development and ripening, the identified gene family members were further subjected to clustering analysis using Mfuzz [43]. In addition, the heatmaps of the expression level of candidates were displayed using TBtools v2.084 [36]. Gene Ontology (GO) and Kyoto Encyclopedia of Genes and Genomes (KEGG) enrichment analyses were performed using the R package clusterProfiler v4.0 [44] and visualized in OmicShare tools. The sucrose metabolic regulatory networks were generated by combining the PCC (PCC ≥ 0.98) between TFs and structural genes.

3. Results

3.1. Genome-Wide Identification of Sucrose Metabolism-Related Gene Families from A. rufa

To identify and characterize the six gene families (INV, SPP, SPS, SUS, SUC/SUT, and SWEET) involved in sucrose metabolism, seven completely sequenced genomes from Actinidia species, A. thaliana, S. lycopersicum, V. vinifera have been selected for such analyses, as shown in Table 1. A total of 58~89 sucrose metabolism-related gene members were identified in these seven selected plant genomes, which included 19~33 INVs, 2~5 SPPs, 4~7 SPSs, 6~10 SUSs, 2~10 SUTs, and 10~29 SWEETs (Table 1). Among these six kinds of gene families, significant variations occurred in the SWEETs, such that the quantity was less in A. rufa than in other Actinidia species, while the remaining five gene families were slightly different. The putative polypeptides of sucrose metabolism gene families from A. rufa contained between 69 (ArSWEET4) to 1240 (ArSUS8) amino acids, with molecular weight ranging from 7.68 to 140.46 kDa, whereas the isoelectric points varied from 4.53 (ArINV1) to 9.71 (ArSWEET10) and the estimated hydrophilicity ranged from 72.8 (ArINV2) to 127.99 (ArSWEET3) (Table 2).
Subcellular analysis showed that most members of the ArINV protein were located in the plasma membrane (54.84%), eleven proteins were located in the chloroplast (35.44%), and seven proteins were located in the cytoplasm. Additionally, two proteins (ArINV1 and ArINV30) were classified into vacuole invertases (VINVs) that are essential for the accumulation of hexose and other β-fructoses based on their location in the vacuole [45]. By contrast, the majority of SPSs and SUSs are located in the cytoplasm and nucleus. Additionally, all the other ArSUT and ArSWEET proteins were located in the plasma membrane, except ArSWEET4, which was located in the extracellular matrix (Figure S1).

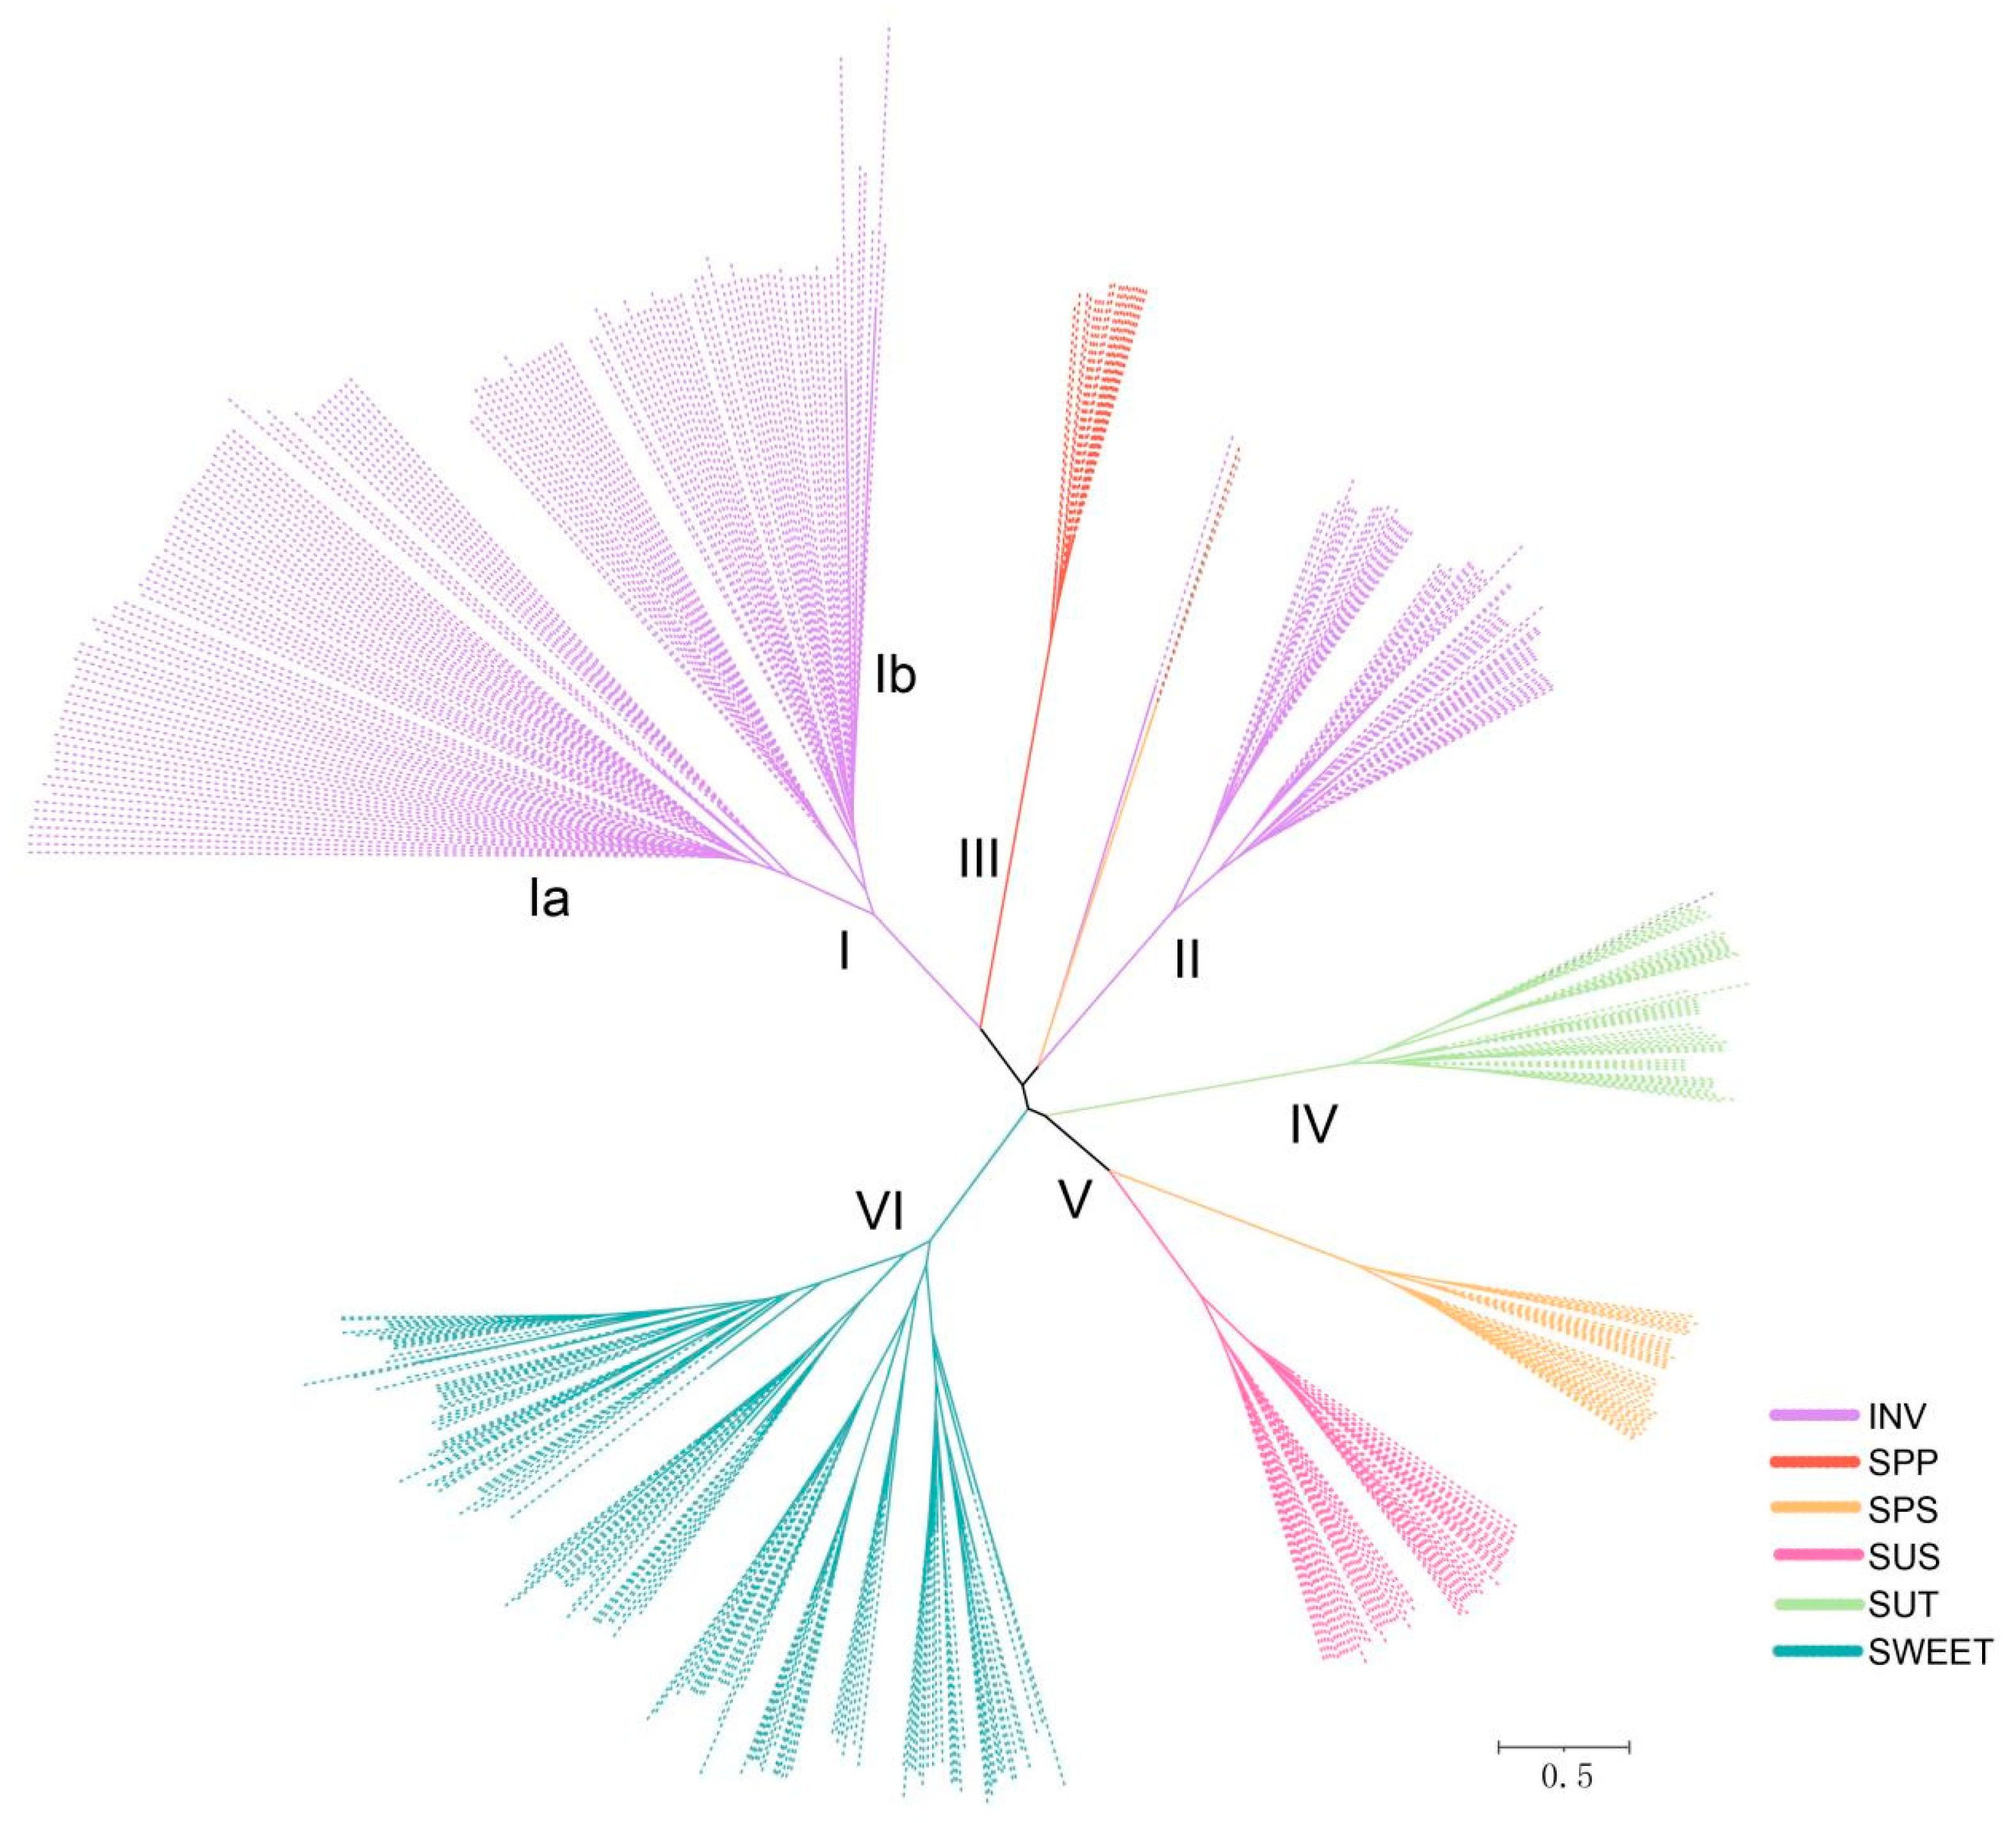
3.2. Phylogenetic Analysis

Multiple sequence alignment and phylogenetic tree analysis containing 499 sucrose metabolism genes from Actinidia species, A. thaliana, S. lycopersicum, and V. vinifera were performed (Tables S3–S8). The sucrose metabolism gene families were clustered into six branches designated branches I to VI and were drawn in different colors (Figure 1). Each branch contained proteins from Actinidia species, A. thaliana, S. lycopersicum, and V. vinifera, indicating that these sucrose metabolism genes were consistent and conserved in seven plant species. The INV members from seven plant species were organized into two branches (I and III), referred to as acid invertases (AINVs) and alkaline invertases (NINVs). Clade I further clustered into two distinct subgroups (clade Ia and clade Ib) belonging to the VINVs and CWINVs located in the vacuole or cell wall, respectively. The phylogenetic analyses suggested that the INV in each branch evolved independently, although some SPPs in branch III can also convert sucrose. Further functional exploration of genes from different branches is still needed. Notably, the number of SWEET members of Arabidopsis and other Actinidia was about twice to triple that in A. rufa, which may be related to the genomic replication events experienced during the evolution process. In addition, the phylogenetic relationship of sucrose metabolism gene families in A. rufa was generated by the same method. As shown in Figure 2A, the genetic clusters of subfamilies mostly corresponded to their biological functions. For example, the SUSs and SPSs were clustered into one subgroup, which was known to be involved in sucrose translocation and contained certain distinct domains (PF00534).

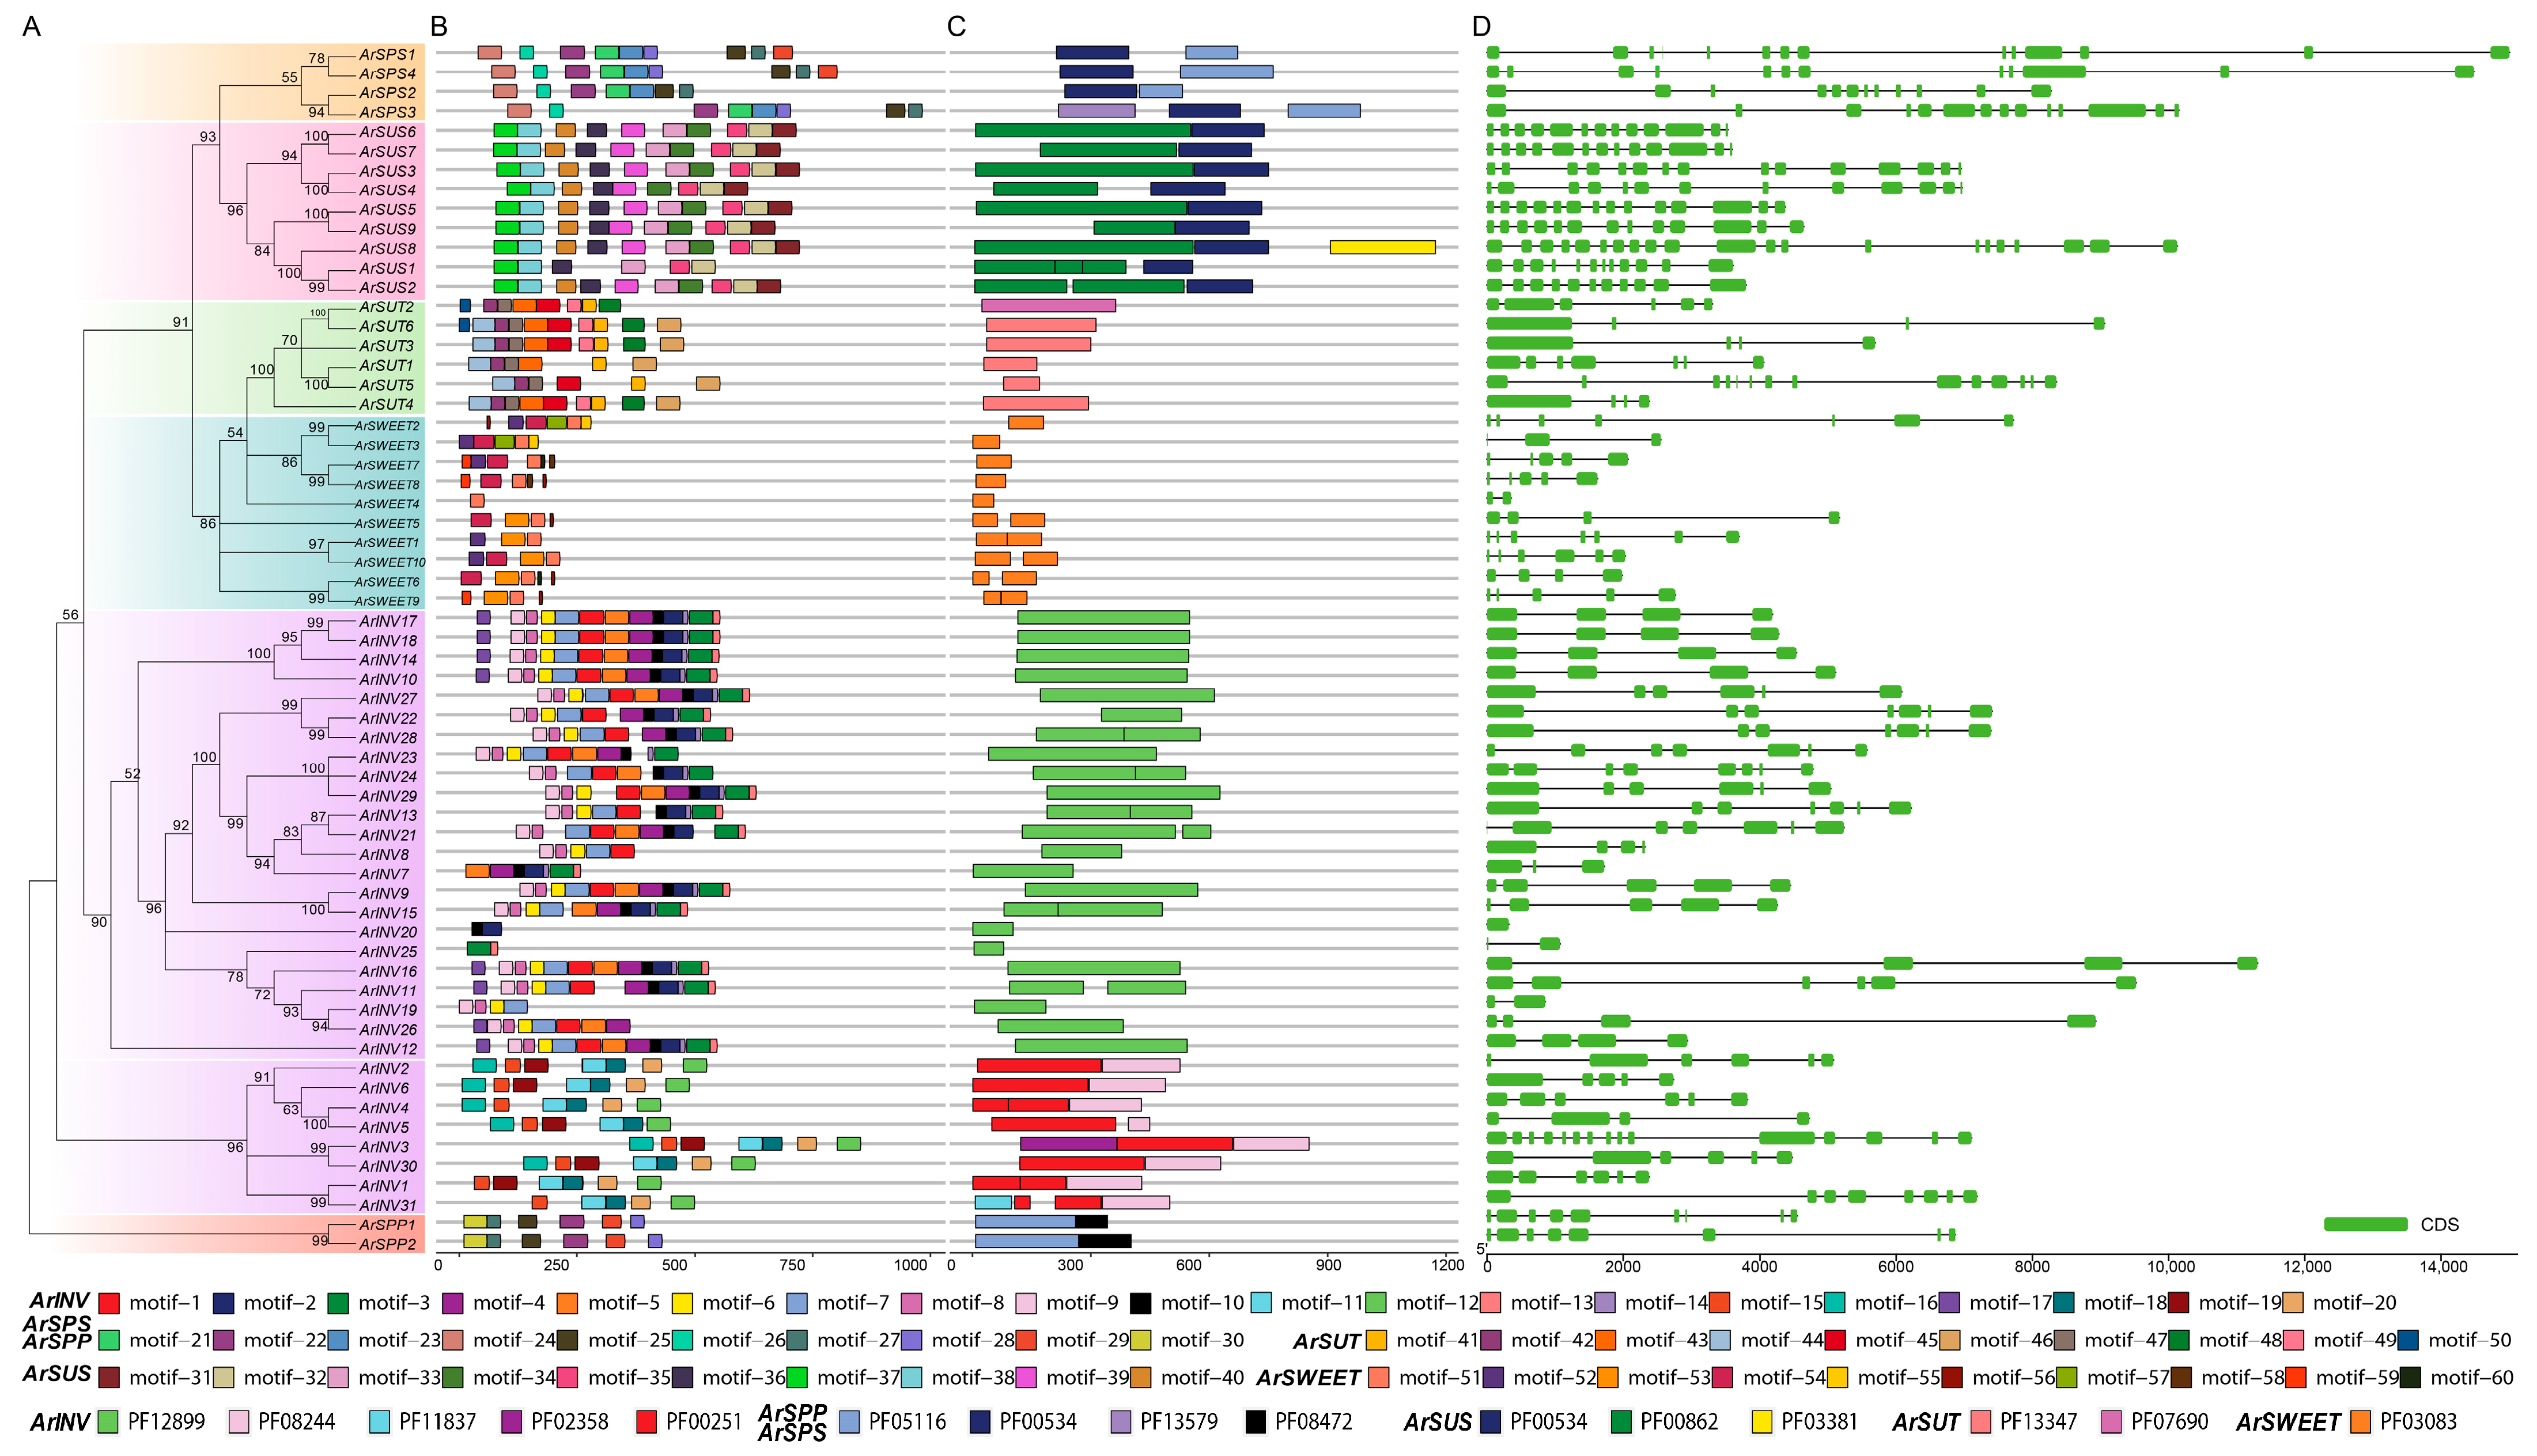
3.3. Gene Structure, Conserved Motif, and Protein Domain Analysis

To further investigate the characteristic regions of sucrose metabolism gene families, the gene structure, the conserved motifs, and the protein domain for each family were devised based on the protein sequences (Figure 2B–D; Table S1). For sucrose synthesis genes, a total of 10 conserved motifs (motif 21 to motif 30) were identified, and all members of the ArSPS and ArSPP contain motif 22, motif 25, and motif 27, corresponding to domain PF05116. However, motif 21, motif 23, motif 24, and motif 26 only existed in ArSPS, and motif 30 only existed in ArSPP (Figure 2B). It is worth noting that ArSPS3 has expanded out the new domain PF13579.
For sucrose degradation genes, ArINV and ArSUS contained 20 motifs and 10 motifs, labeled as motifs 1~20 and motifs 31~40, respectively. Some motifs occurred in the majority of the ArINV members, while some were distinct in subfamilies or groups. For instance, motifs 1~10 were conserved across most ArINV proteins and located on a specific domain, Glyco_hydro_100 (PF12899), but motifs 11, 12, 15, 16, 18, and 19 were only distributed in some ArINV and were located on two functional domains (PF00251 and PF08244), suggesting a functional divergence within the ArINV gene family (Figure 2B). In addition, the motifs of the ArSUS proteins were highly similar in terms of size and type (10 motifs), which all formed the complete ArSUS conserved structural domain (PF00534 and PF00862), indicating a functional similarity within the same family. Interestingly, we found that ArSUS8 has expanded out the new domain PF03381 (Figure 2C).
For sucrose transport genes, there were 10 motifs predicted in each of the ArSUT and ArSWEET proteins, corresponding to the specific conserved domains, PF13347 and PF03083, respectively. All ArSUT proteins have similar conserved motifs, with motifs 1, 2, and 7 detected in almost all ArSUT proteins, suggesting they are necessary for ArSUT. However, some ArSUT had variations, such as ArSUT2, which lacked motif 6 and expanded out the new domain PF07690. For ArSWEET, we found that all ArSWEET had one distinct motif 1, and the number of motifs in each of the ArSWEET members was quite different, even though they had the same functional domains (PF03083) (Figure 2C).
We further analyzed the intron/exon arrangement of each sucrose metabolism gene in A. rufa. The number of introns/exons of each gene varied from 0 to 20 and 1 to 21, respectively (Figure 2D). The lowest and highest number of introns/exons was possessed by ArINV20 and ArSUS8, respectively. For ArINV, a great number of members (24 members, 77.42%) had a conserved gene structure with 3–6 introns and 4–7 three exons, while ArINV20 contained one exon, suggesting that exon loss might be present in the ArINV gene family. For ArSUS, there were similar exon–intron structural patterns among members, especially the exon number and exon length, which were relatively conservative.

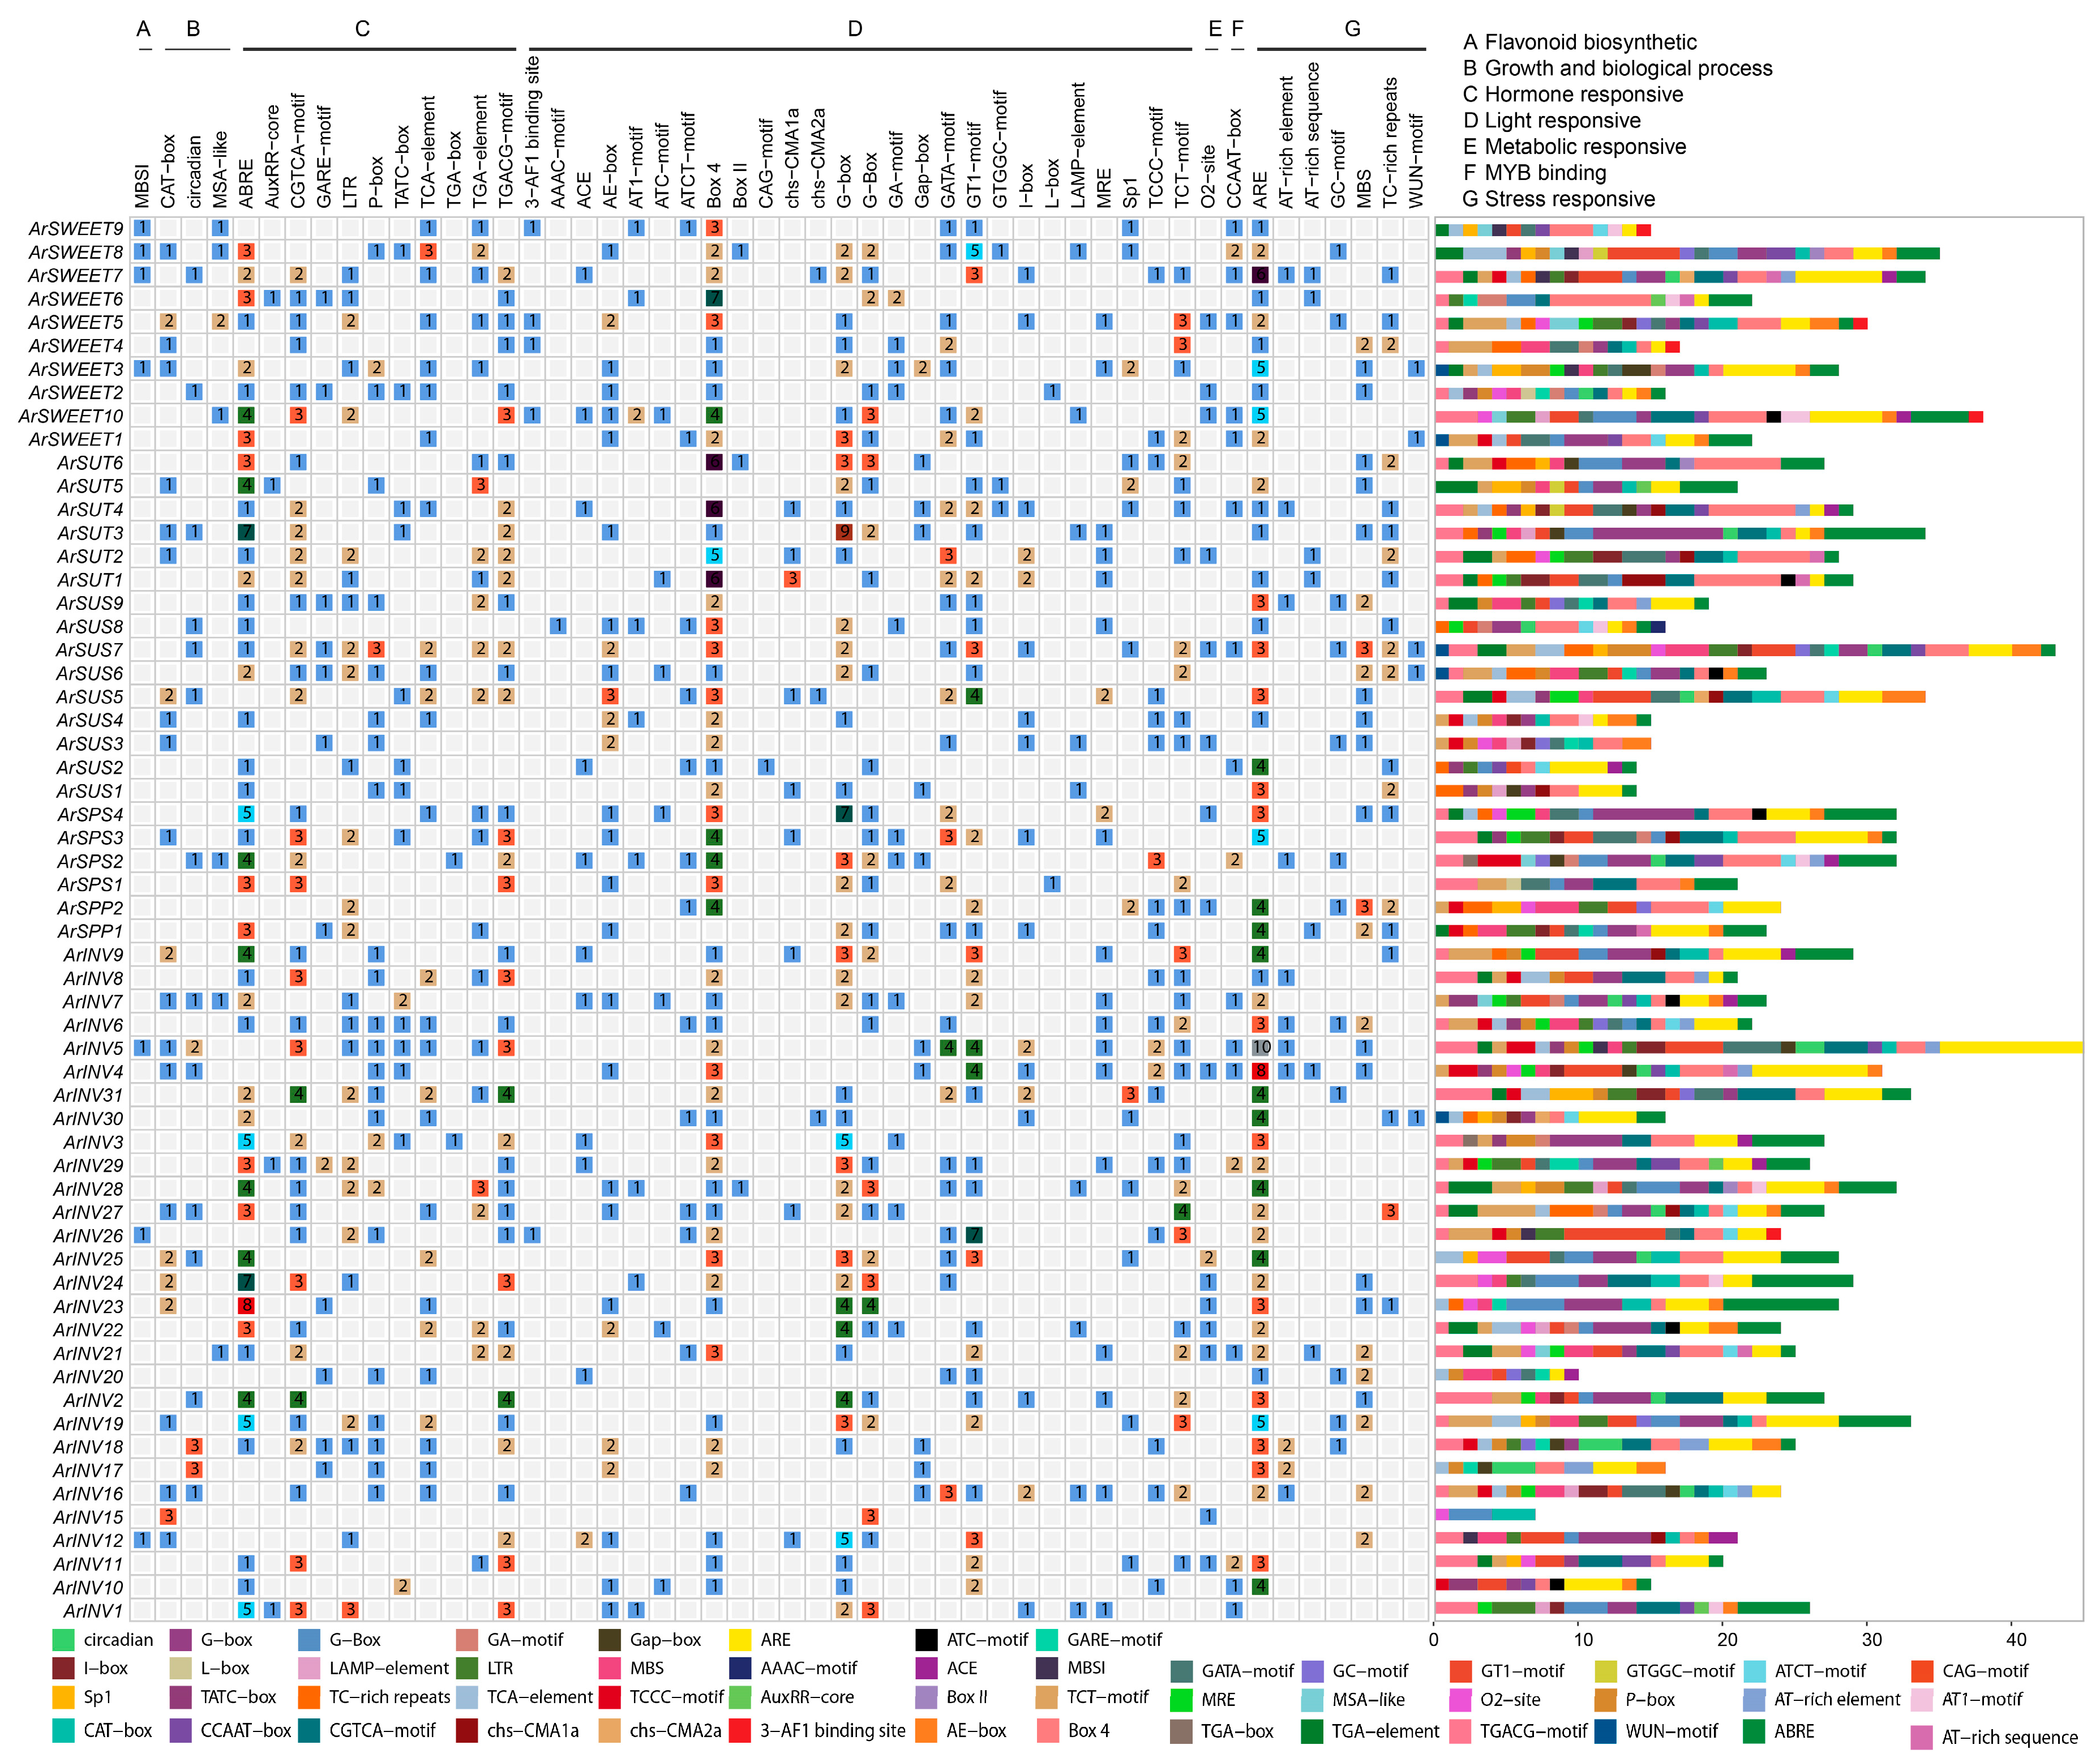
3.4. Promoter Cis-Elements Analysis of Sucrose Metabolism Genes

A total of 1496 cis-elements containing 50 primary types were identified and assigned to the following top three prominent categories, hormone responsive, light responsive, and stress responsive. The ABRE (related to the abscisic acid hormone response), Box 4, and ARE elements were the largest and most highly represented in these three main terms, respectively (Figure 3). Interestingly, all sucrose metabolism genes possessed the cis-elements involved in light responsiveness, indicating that these family members in A. rufa play an essential role in delivering the synthesized photosynthetic glycosides and other secondary metabolisms. A variety of hormone-responsive and stress-responsive elements were also identified as important components. For instance, the GARE motif is associated with IAA responsiveness and GA responsiveness, and the MBS element is involved in drought responsiveness and flavonoid biosynthesis. In addition, the largest group of cis-acting elements appeared in ArINV5, followed by ArSUS7 and ArSWEET10 (Figure 3). More detailed information is listed in Table S9.

3.5. Collinearity and Selective Pressure Analysis of Sucrose Metabolism Genes

To explore the evolutionary relationship between sucrose metabolism genes and different species, a collinear map of A. rufa with A. chinensis and A. thaliana was constructed (Figure S2). Considering that the reported A. rufa genome has not been assembled to the chromosome level genome [29], a total of 33 scaffolds were selected for collinearity predictions with A. rufa, A. chinensis, and A. thaliana. We found that there were eight and six homologous gene pairs shared with A. chinensis and A. thaliana, respectively (Figure S2). Among these homologous genes, and two ArINV and three ArSUS members were found to have collinearity with A. chinensis, four ArINV, two ArSPP, and two ArSUS family members were found to have collinearity with A. thaliana (Figure S2). Interestingly, ArSUS3 had a collinear relationship with A. chinensis (Achv4p23g036786:Achv4p23g036798) and A. thaliana (AT4G02280.1:AT4G02380.1), indicating that these genes were highly conserved and might have existed prior to ancestral divergence. Accordingly, it was speculated that they might have played a crucial role in the evolution of the SUS gene family in kiwifruit. To further investigate selection pressure on the evolution of sucrose metabolism genes, the ratio of Ka and Ks for each duplicated gene pair was calculated. The results showed that the Ka/Ks ratios for all duplicate gene pairs were less than 1, ranging from 0.068 to 0.414, illustrating that all the duplicate pairs underwent strong negative or purifying selection during the evolutionary history (Table S10).

3.6. Genome-Wide Expression Analysis of Sucrose Metabolism Genes

To determine the expression of the six gene families potentially controlling sucrose metabolism, we performed statistical transcriptomic analyses based on developing fruits at 20, 40, 60, and 120 DAF based on Liu et al. [25]. We extracted the expression of 62 transcripts annotated as the above gene family members in A. rufa, as shown in Figure S3. Pearson correlation coefficient analysis showed that the expression level showed a high correlation (Pearson’s r > 0.85, p < 0.05) across transcripts, such as ArINV1/ArSPS3, ArSPP1/ArINV4, ArSUS5/ArSWEET9, and ArSUT3/ArINV31. However, their relative expressions were distinct in the whole fruit development stage of A. rufa (Figure 4; Table S11). For instance, ArSWEET10, ArSWEET4, and ArSWEET3 were specifically highly expressed at 20, 40, and 60 DAF, respectively, whereas ArSWEET6, ArSWEET8, and ArSWEET9 were highly expressed at 120 DAF. Furthermore, comparing 20 DAF with other stages resulted in 54 (40 vs. 20), 57 (60 vs. 20), and 53 (120 vs. 20) DEGs, respectively (Figure S4A; Tables S12–S14). We observed that the expression of three families (ArINV2, ArINV3, ArINV4, ArINV5, ArINV12, ArSUT3, ArSWEET7, and ArSWEET9) was increased in 60 vs. 20 and 120 vs. 20 (Figure S4B). Furthermore, the expression of four families (ArINV1, ArINV14, ArINV17, ArINV18, ArSUS1, ArSUS2, ArSUS5, ArSUS9, ArSUT4, ArSWEET1) was significantly increased in 120 vs. 20 (Figure S4D). These data suggested that a dramatic alteration of gene expression would result in significant changes in the contents of sucrose.

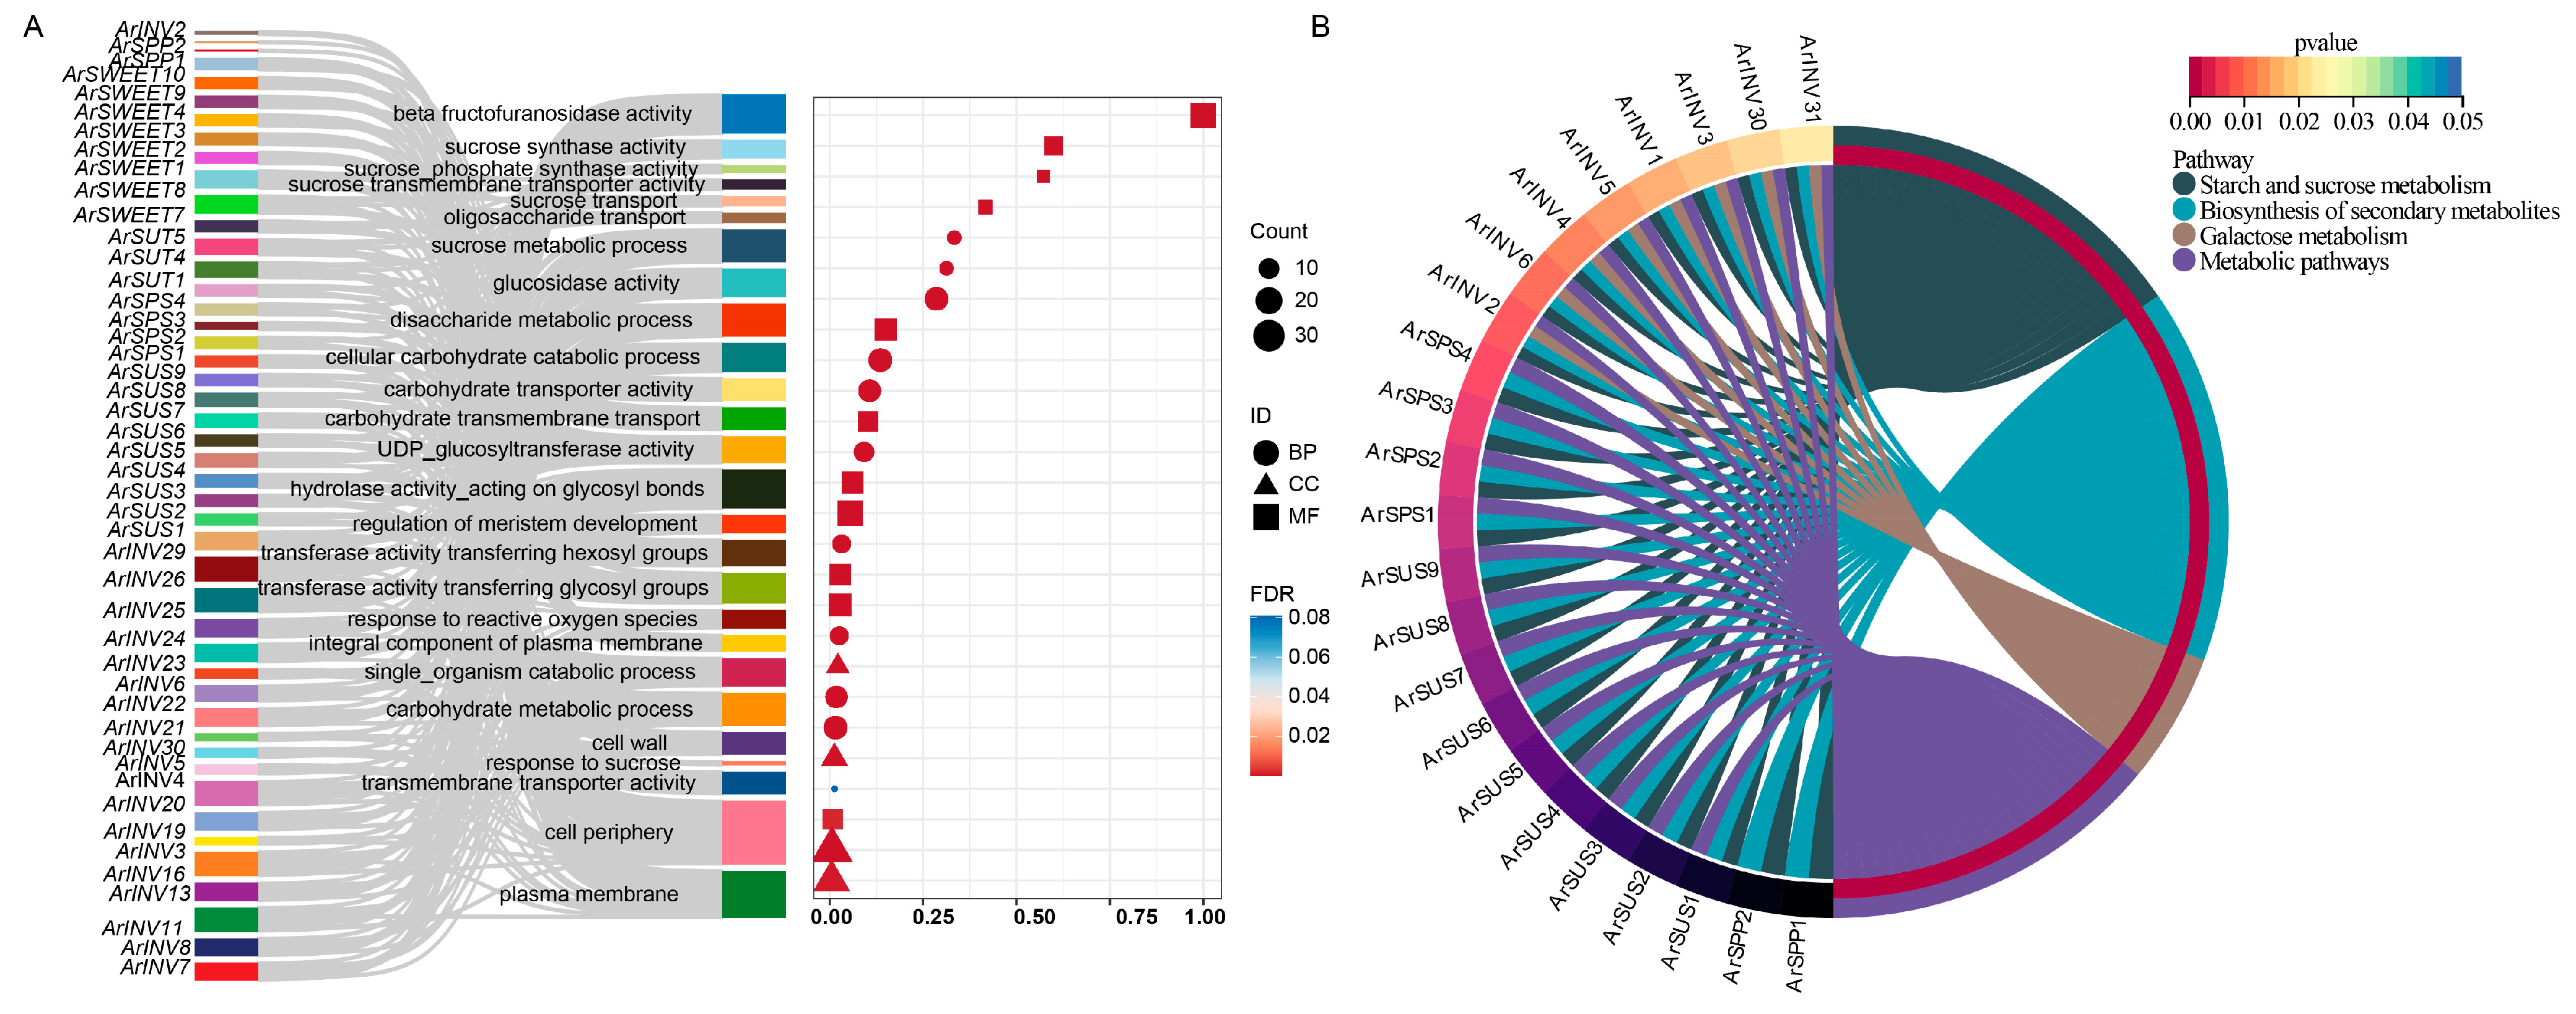
3.7. GO and KEGG Functional Annotation of Sucrose Metabolism Genes

To uncover the potential biological roles of the six gene families, GO and KEGG functional prediction analyses were conducted. GO enrichment analysis was performed for 62 transcripts based on biological process (BP), cellular component (CC), and molecular function (MF) terms (Figure 5A). In terms of BP, these proteins mainly function in the carbohydrate metabolic process and the disaccharide metabolic process, which are closely related to the sucrose metabolic process. In terms of MF, the most enriched terms were “beta-fructofuranosidase activity”, “hydrolase activity, acting on glycosyl bonds”, and “transferase activity, transferring glycosyl groups”, all of which have been shown to be associated with sucrose translocation and degradation in plants. In addition, KEGG enrichment analysis indicated that twenty-three transcripts were significantly enriched in the top four key biological pathways, including the biosynthesis of secondary metabolites, galactose metabolism, metabolic pathways, and starch and sucrose metabolism (Figure 5B). Interestingly, ArINV tends to be specifically enriched in galactose metabolism, which might be related to drought stress.

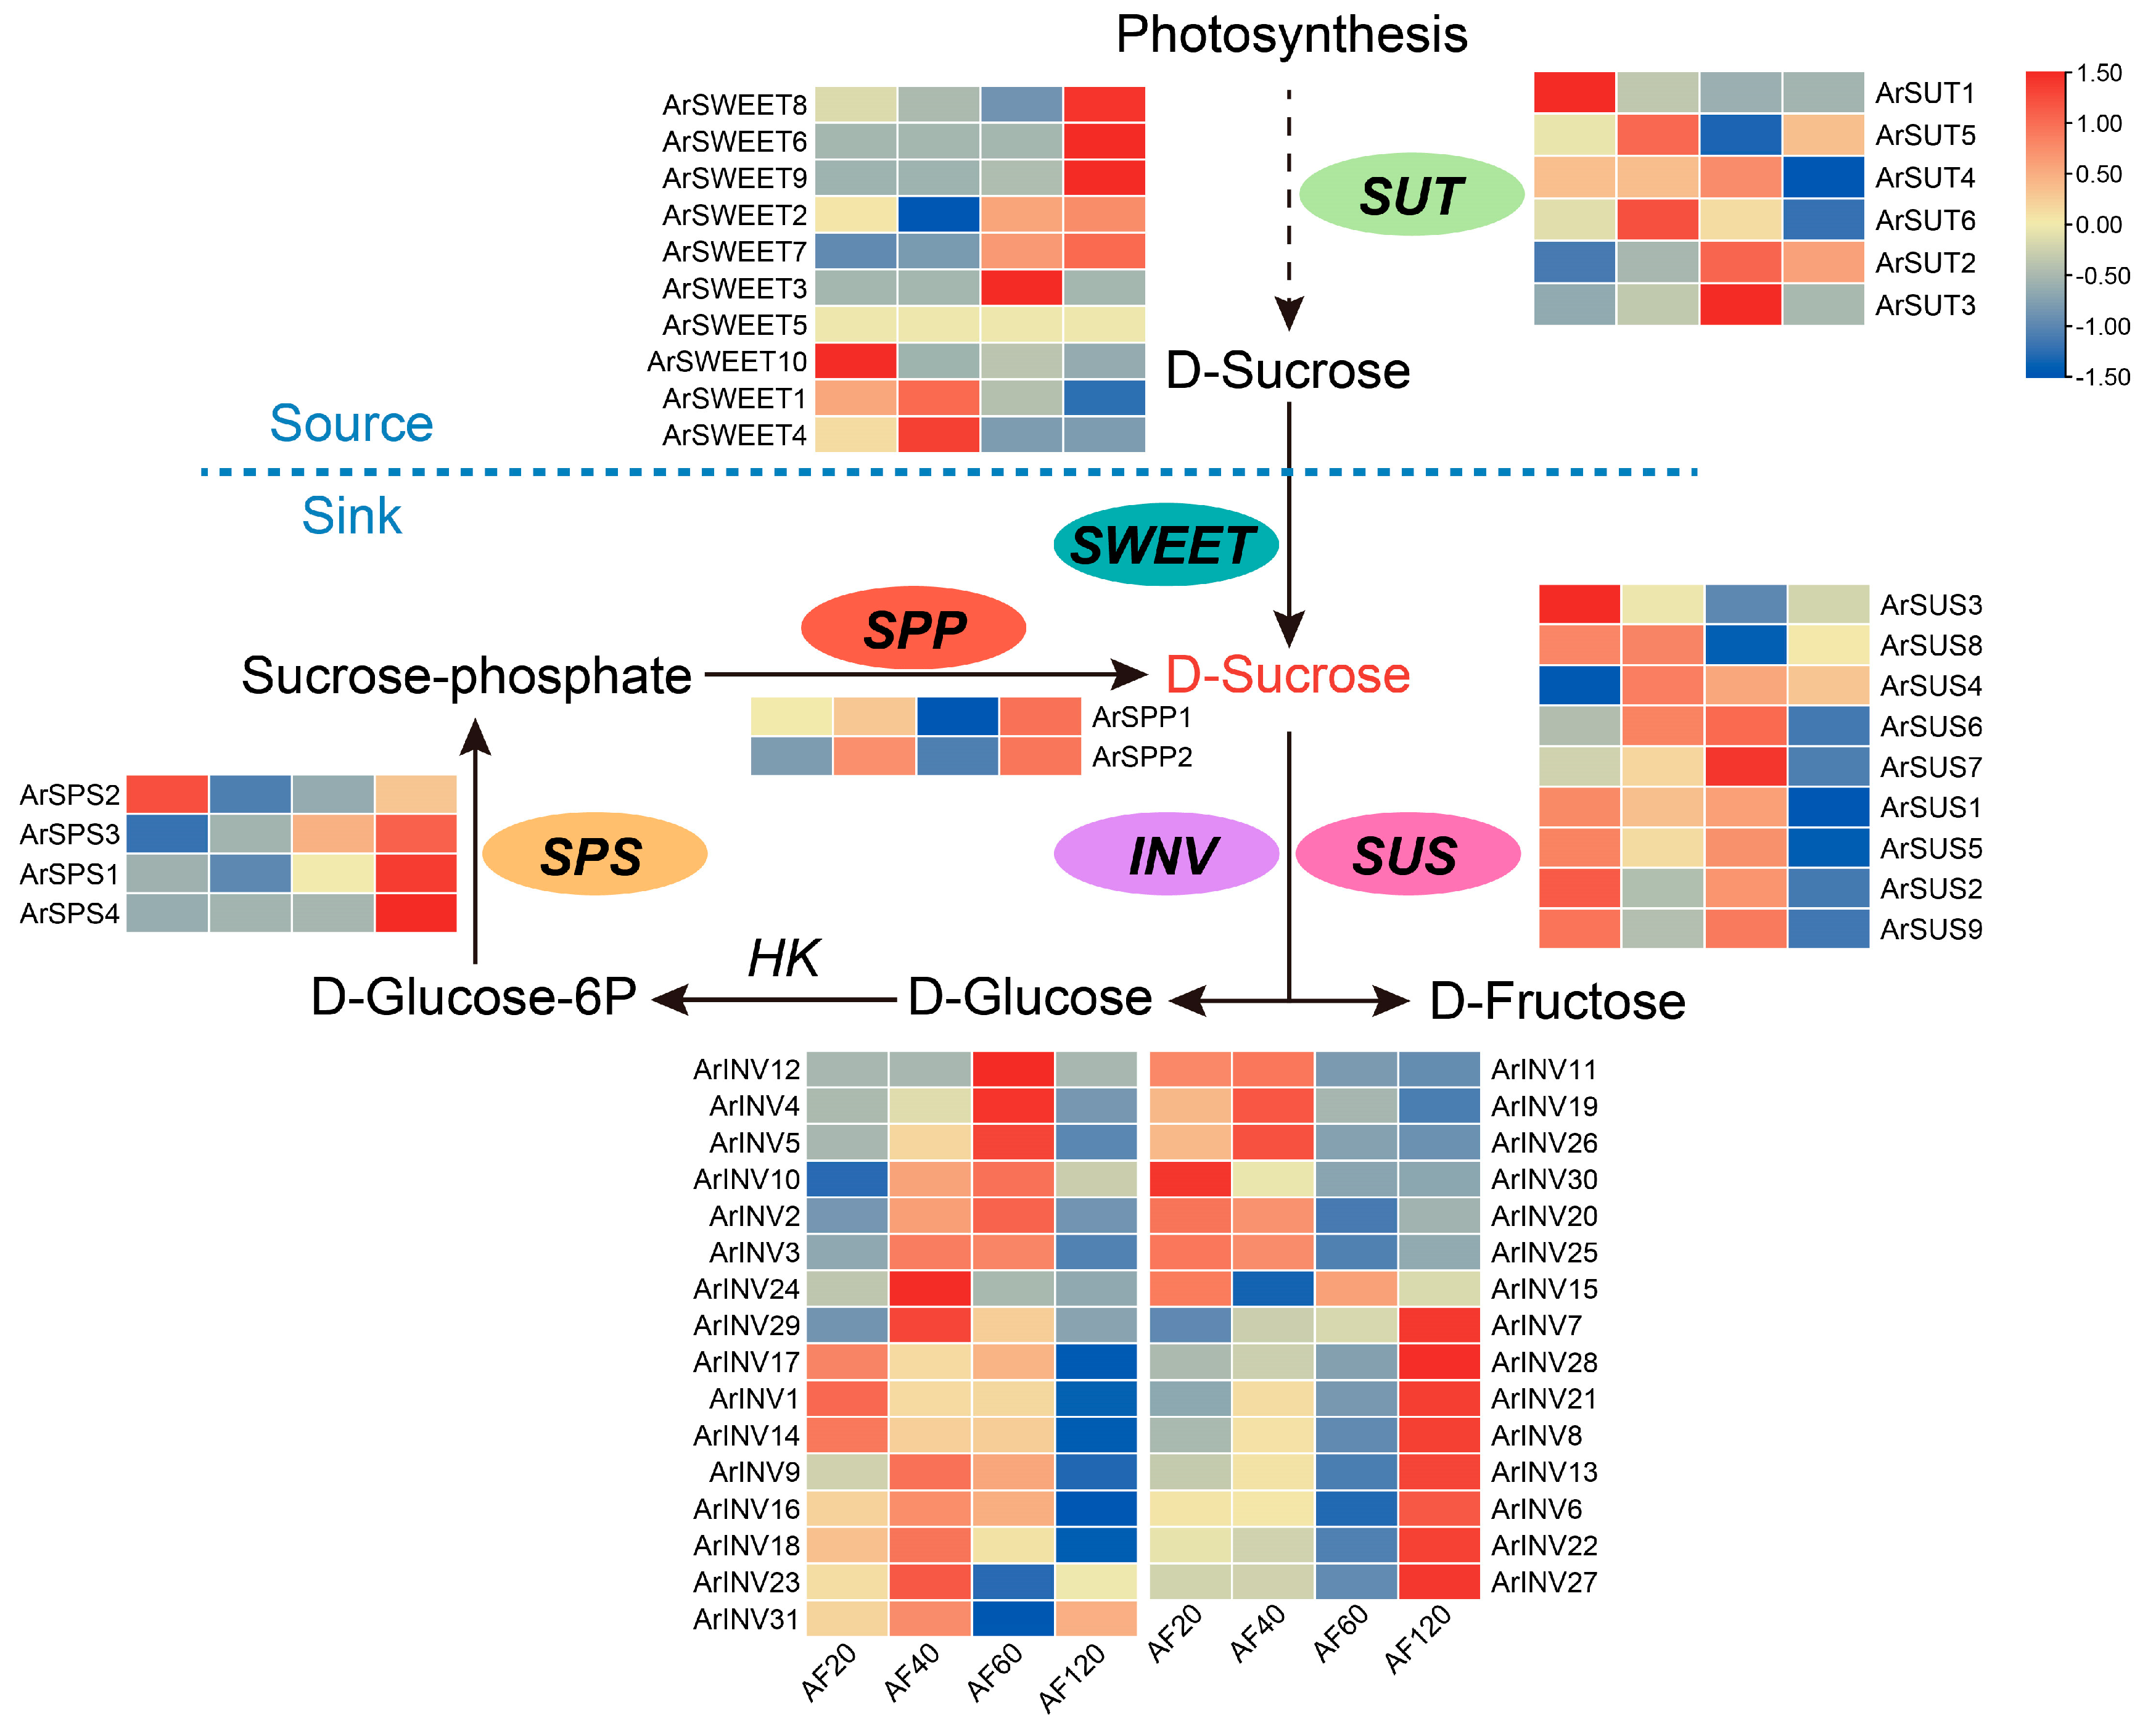
3.8. Temporal Gene Expression Dynamics during Fruit Development and Ripening

To gain further insight into sucrose metabolism genes that respond to fruit ripening, a comprehensive clustering analysis was applied using Mfuzz. The expression patterns of the sixty-two transcripts during the different development stages exhibited four distinct clusters, named Cluster 1~Cluster 4 (Figure 6A). Cluster 1 produced the largest number of transcripts (18 in total), and their expression levels decreased with the progression of fruit development (20~60 DAF) but showed an opposite trend with an increased expression during fruit ripening (120 DAF). Conversely, Cluster 2 encompassed 13 transcripts, exhibiting a substantial decrease in expression levels during fruit ripening. The members of Cluster 3 (16 transcripts) and Cluster 4 (14) had approximately similar gene expression patterns, characterized by a significant decrease with time in their expression levels. This observation implies that these genes may possess a negative regulatory function during fruit development and ripening.
To characterize key transcription factors potentially controlling sugar metabolism, we then performed a correlation analysis of the transcripts and TFs. We screened 261 TFs belonging to 64 families whose expression was highly correlated with the 62 transcripts (r > 0.98) and categorized them into four clusters (Figure 6B). The expression patterns of TFs in Cluster 1 exhibited an escalating trend with maturity (60~120 DAF), while TFs in Cluster 2 were more striking from 40 DAF to 60 DAF and from 60 DAF to 120 DAF. The TFs related to soluble sugars (e.g., bHLH, bZIP, MYB, and NAC) in each cluster were counted (Figure 6B).

3.9. Identification of Key TFs Regulating Sucrose Metabolism

To construct sucrose metabolic regulatory networks, we first examined eighteen critical genes, including eight INVs, two SPPs, three SPSs, and five SWEETs, in Cluster 1, which were specifically highly upregulated during the ripening stage (Figure 6A). This dynamic expression pattern suggests that the genes in Cluster 1 might be involved in the response to fruit ripening. Correspondingly, 85 TFs were identified and rigorously correlated (r > 0.98) with the sucrose metabolic profile in Cluster 1, e.g., bHLH, NAC, B3-ARF, C3H, and MYB. Of these candidates, five TFs, annotated bHLH, MYB, MYB related, and NAC (GFY89126.1, GFY88176.1, GFS35226.1, GFY99141.1, and GFZ20220.1), showed fruit-ripening-associated expression patterns with low transcription levels at the development stage and with significantly increased levels at the ripening stage (Figure 6B). The regulatory networks mediated by these five TFs were then constructed (Figure 7A).
Furthermore, in Cluster 2, thirteen genes, including seven INVs, three SUSs, two SUTs, and one SWEET, were detected and were upregulated gradually during fruit development and specifically highly downregulated during the ripening stage. Correspondingly, we observed that the expression of TFs was decreased during fruit maturation. Six TFs, annotated bHLH, bZIP, MYB, MYB related, and NAC (GFY85017.1, GFY86711.1, GFZ17103.1, GFS39520.1, GFY94141.1, and GFY88467.1), were selected from the sixty-seven TFs in Cluster 2 and formed a correlation network (Figure 7B).

4. Discussion

Elucidating the gene families and regulators governing sucrose synthesis and accumulation is essential in energy provisioning during growth and development in plants and improving yield fruit quality [46]. Members of the various gene families (e.g., SUS, SUT, SPS, SPP, HK, etc.) involved in sucrose metabolism have been characterized in many higher plants, with 73 members in Arabidopsis (A. thaliana), grape (V. vinifera), and tomato (S. lycopersicum), in addition to 41 in apple (M. domestica) and 46 in maize (Z. mays) [47,48]. In the present study, we systematically analyzed the characteristics of six sucrose metabolism gene families in A. rufa and elucidated the relationship between gene expression and fruit development. A total of 62 genes related to sucrose metabolism were derived in the A. rufa genome (Tables S3–S8), among which ArINVs had a larger number of A. rufa members (n = 31, 50.0%), similar to that in Arabidopsis (n = 33, 45.2%) and A. chinensis (n = 31, 34.8%), whereas the number of ArSWEETs is fewer than in other species (Table 1). The difference in the number of gene family members may be due to gene loss in the process of gene evolution. However, considering that genome assembly occurs at the scaffold level, it may also lead to a decrease in the number of genes. Additionally, 29, 28, and 19 SWEETs were identified in A. chinensis, A. eriantha, and A. hemsleyana, respectively, suggesting that SWEETs have expanded in Actinidia species. Similar results were also observed in Punica [49]. It is known that the expansion of the SWEET gene family in many higher plants is mainly the result of recent duplication events [50].
Combined with the phylogenetic analysis, these six kinds of gene families had a specific distribution branch with the known Arabidopsis, kiwifruit, tomato, and grape, indicating that these genes have undergone specific differentiation (Figure 1). Among the known identifications, the INV family contains three categories according to their location in the cell, namely, NINVs, CWINVs, and VINVs [51,52]. Correspondingly, our analysis found that all INVs can be classified into the I (AINV) and III (NINV) classes. AINVs can be divided into Ia and Ib, corresponding to the VINV and CWINV subgroups, suggesting that the INV in each group evolved independently. However, the thirty-nine SPS genes identified here, together with the SUS in seven other species, were was consistent with ArSPS and ArSUS and had the closest relationship in A. rufa, although they were involved in sucrose synthesis and sucrose re-synthesis processes, respectively (Figure 2A). In addition, we illustrated that each gene family’s members share similar protein motif distribution and gene structure (Figure 2), which may be associated with the conservative and specific functions of proteins, as well as the evolutionary history of kiwifruit. The four gene families, including INV, SPP, SPS, and SUS, had Ka/Ks ratios of less than 1, suggesting that these genes had undergone purifying selection. Our results provide insights into the evolutionary relationship of sucrose metabolism gene families in kiwifruit and other species.
Each enzyme involved in sucrose metabolism is encoded by a family of genes that are differentially expressed during fruit development and ripening. The overexpression of the MiINV, MiSWEET, MiSUS, MiSPS, and MiSPP genes revealed that in the mango (M. indica) ripening stage, the levels of sucrose and mannitol exhibited an upward trend [15]. The expression profile analysis indicated an important role of the WmSWEET1 gene screened from watermelon in increasing sugar transport and accumulation throughout the development of fruit [3]. Our data clearly indicate that sucrose metabolism mainly depends on developmental processes in kiwifruit. At the late ripening stage (60–120 DAB), high activities of INV, SWEET, SPS, SPP, SUT, and SUS detected in Clusters 1/2 and reported previously by Zhao et al. [53] match the high expression levels of their genes (Figure 4 and Figure 6). Furthermore, 11 TFs, including bHLH, bZIP, MYB, MYB related, and NAC, were identified and significantly upregulated at the ripening stage of kiwifruit (Figure 6B). As mentioned above, bHLH is a transcription factor family in fruit ripening because it can affect ethylene sensitivity and multiple metabolisms targeted by RIN [54,55]. The NAC transcription factor family SlNAC4 controls the ripening regulator RIN expression to regulate carotenoid accumulation and ethylene synthesis in tomatoes [56]. Furthermore, the MYB family member, SlMYB70, has been proven to negatively regulate fruit ripening by directly modulating ethylene biosynthesis [57]. Many other important TF families, including ERF, WRKY, and C3H, play important roles in fruit development and still need to perform further functional exploration in many plant species.
In summary, we performed a genome-wide identification and analysis of six gene families involved in sucrose metabolism in kiwifruit. A total of sixty-two gene families were identified and grouped into six subfamilies on the phylogenetic tree, and the results were further supported by gene structural domain and motif analysis. Furthermore, purifying selection and differential expression patterns during the fruit developmental stages provide insights into the functional diversity of sucrose metabolism genes.

Supplementary Materials

The following supporting information can be downloaded at: https://www.mdpi.com/article/10.3390/horticulturae10070772/s1, Figure S1: Subcellular localization map of sucrose metabolism genes involved in A. rufa. The different colors and shapes were used to recognize various types of gene families. Figure S2: Genome-wide collinearity analysis for sucrose metabolism related gene families among Arabidopsis thaliana, Actinidia chinensis, and A. rufa, respectively. Red and purple lines indicate orthologous gene pairs. Figure S3: Correlation analysis of sucrose metabolism genes involved in A. rufa. Blue and red colors represent positive and negative correlations with significant p-values (p-value < 0.05), respectively. The color intensities are proportional to the correlation coefficients (r). Figure S4: Volcano plot (A) and heatmap of genes expression (B) from developing fruits at 40 vs. 20, 60 vs. 20 and 120 vs. 20 DAF. Table S1: The Pfam domain of sucrose metabolism genes. Table S2: Genome information for genome-wide identification of sucrose metabolism genes in this study. Table S3: Amino acid sequence of INV gene family in seven species. Table S4: Amino acid sequence of SPP gene family in seven species. Table S5: Amino acid sequence of SPS gene family in seven species. Table S6: Amino acid sequence of SUS gene family in seven species. Table S7: Amino acid sequence of SUT gene family in seven species. Table S8: Amino acid sequence of SWEET gene family in seven species. Table S9: The detailed information of Cis-acting elements in six gene family. Table S10: Homologous gene pairs and Ka/Ks values in A. rufa. Table S11: Transcriptome expression data of sucrose metabolism genes during four different stages of fruit development. Table S12: Differentially expressed genes from developing fruits at 40 vs. 20 DAF. Table S13: Differentially expressed genes from developing fruits at 60 vs. 20 DAF. Table S14: Differentially expressed genes from developing fruits at 120 vs. 20 DAF.

Author Contributions

Conceptualization, Y.J.; methodology, Y.J. and X.Q.; software, X.Q.; validation, X.Q., T.R. and P.D.; formal analysis, X.Q., T.R. and P.D.; investigation, Y.J. and Y.Y.; resources, Y.Z.; data curation, X.Q.; writing—original draft preparation, Y.J.; writing—review and editing, Y.Y.; supervision, Y.J. and Y.Y.; funding acquisition, Y.J. and Y.Y. All authors have read and agreed to the published version of the manuscript.

Funding

This research was supported by the Shaanxi Academy of Science Research Funding Project (2024p-12), the Science and Technology Department of Shaanxi Province Project (2023-JC-QN-0253), and the Xi’an Science and Technology Bureau Project (22NYYF002).

Data Availability Statement

Data are contained within this article and the Supplementary Materials.

Conflicts of Interest

The authors declare no conflicts of interest.

References

  1. Ruan, Y.L. Sucrose metabolism: Gateway to diverse carbon use and sugar signaling. Annu. Rev. Plant Biol. 2014, 65, 33–67. [Google Scholar] [CrossRef] [PubMed]
  2. Rolland, F.; Baena-Gonzalez, E.; Sheen, J. Sugar sensing and signaling in plants: Conserved and novel mechanisms. Annu. Rev. Plant Biol. 2006, 57, 675–709. [Google Scholar] [CrossRef] [PubMed]
  3. Umer, M.J.; Bin, S.L.; Gebremeskel, H.; Zhao, S.; Yuan, P.; Zhu, H.; Kaseb, M.O.; Anees, M.; Lu, X.; He, N.; et al. Identification of key gene networks controlling organic acid and sugar metabolism during watermelon fruit development by integrating metabolic phenotypes and gene expression profiles. Hortic. Res. 2020, 7, 193. [Google Scholar] [CrossRef] [PubMed]
  4. Yu, X.; Ali, M.M.; Li, B.; Fang, T.; Chen, F. Transcriptome data-based identification of candidate genes involved in metabolism and accumulation of soluble sugars during fruit development in ‘Huangguan’ plum. J. Food Biochem. 2021, 45, e13878. [Google Scholar] [CrossRef] [PubMed]
  5. Nguyen-Quoc, B.; Foyer, C.H. A role for futile cycles involving invertase and sucrose synthase in sucrose metabolism of tomato fruit. J. Exp. Bot. 2001, 52, 881–889. [Google Scholar] [CrossRef] [PubMed]
  6. Kim, J. Sugar metabolism as input signals and fuel for leaf senescence. Genes Genom. 2019, 41, 737–746. [Google Scholar] [CrossRef] [PubMed]
  7. Van Bel, A. The phloem, a miracle of ingenuity. Plant Cell Environ. 2003, 26, 125–149. [Google Scholar] [CrossRef]
  8. Li, J.; Qin, M.; Qiao, X.; Cheng, Y.; Li, X.; Zhang, H.; Wu, J. A new insight into the evolution and functional divergence of SWEET transporters in chinese white pear (Pyrus bretschneideri). Plant Cell Physiol. 2017, 58, 839–850. [Google Scholar] [CrossRef]
  9. Xu, Y.; Yao, Z.; Cheng, Y.; Ruan, M.; Ye, Q.; Wang, R.; Zhou, G.; Liu, J.; Liu, C.; Wan, H. Divergent retention of sucrose metabolism genes after whole genome triplication in the tomato (Solanum lycopersicum). Plants 2023, 12, 4145. [Google Scholar] [CrossRef]
  10. Reuscher, S.; Akiyama, M.; Yasuda, T.; Makino, H.; Aoki, K.; Shibata, D.; Shiratake, K. The sugar transporter inventory of tomato: Genome-wide identification and expression analysis. Plant Cell Physiol. 2014, 55, 1123–1141. [Google Scholar] [CrossRef]
  11. Chen, L.Q.; Hou, B.H.; Lalonde, S.; Takanaga, H.; Hartung, M.L.; Qu, X.Q.; Guo, W.J.; Kim, J.G.; Underwood, W.; Chaudhuri, B.; et al. Sugar transporters for intercellular exchange and nutrition of pathogens. Nature 2010, 468, 527–532. [Google Scholar] [CrossRef]
  12. Johnson, D.A.; Thomas, M.A. The monosaccharide transporter gene family in Arabidopsis and rice: A history of duplications, adaptive evolution, and functional divergence. Mol. Biol. Evol. 2007, 24, 2412–2423. [Google Scholar] [CrossRef]
  13. Fakher, B.; Jakada, B.H.; Greaves, J.G.; Wang, L.; Niu, X.; Cheng, Y.; Zheng, P.; Aslam, M.; Qin, Y.; Wang, X. Identification and expression analysis of pineapple sugar transporters reveal their role in the development and environmental response. Front. Plant Sci. 2022, 13, 964897. [Google Scholar] [CrossRef]
  14. Jiang, C.; Zeng, S.; Yang, J.; Wang, X. Genome-wide identification and expression profiling analysis of SWEET family genes involved in fruit development in plum (Prunus salicina Lindl). Genes 2023, 14, 1679. [Google Scholar]
  15. Wu, S.; Wu, D.; Song, J.; Zhang, Y.; Tan, Q.; Yang, T.; Yang, J.; Wang, S.; Xu, J.; Xu, W.; et al. Metabolomic and transcriptomic analyses reveal new insights into the role of abscisic acid in modulating mango fruit ripening. Hortic Res. 2022, 9, uhac102. [Google Scholar] [CrossRef] [PubMed]
  16. Wang, R.; Shu, P.; Zhang, C.; Zhang, J.; Chen, Y.; Zhang, Y.; Du, K.; Xie, Y.; Li, M.; Ma, T.; et al. Integrative analyses of metabolome and genome-wide transcriptome reveal the regulatory network governing flavor formation in kiwifruit (Actinidia chinensis). New Phytol. 2022, 233, 373–389. [Google Scholar] [CrossRef] [PubMed]
  17. Shu, P.; Zhang, Z.; Wu, Y.; Chen, Y.; Li, K.; Deng, H.; Zhang, J.; Zhang, X.; Wang, J.; Liu, Z.; et al. A comprehensive metabolic map reveals major quality regulations in red-flesh kiwifruit (Actinidia chinensis). New Phytol. 2023, 238, 2064–2079. [Google Scholar] [CrossRef]
  18. Kim, S.C.; Lee, J.W.; Baek, S.H.; Lee, M.W.; Kang, Y.J. The complete chloroplast genome sequence of Actinidia rufa (Actinidiaceae). Mitochondrial DNA B Resour. 2018, 3, 564–565. [Google Scholar] [CrossRef]
  19. Han, F.; Zhao, T.T.; Liu, X.L.; Zhang, Q.; Li, D.W.; Tian, H.; Peng, J.; Zhong, C.H. Genetic analysis of fruit traits in Actinidia rufa (Siebold and Zuccarini) Planchon ex Miquel × Actinidia chinensis var. chinensis C. F. Liang kiwifruit hybrid population. Plant Sci. J. 2022, 40, 505–512. [Google Scholar]
  20. Kisaki, G.; Shimagami, T.; Matsudaira, K.; Tsugi, Y.; Moriguchi, K.; Nakashima, K.; Morimoto, T.; Gomi, K.; Ichimura, K.; Hamano, K.; et al. A kiwifruit cultivar crossbred with Actinidia chinensis and Actinidia rufa has practical tolerance to Pseudomonas syringae pv. actinidiae biovar 3. J. Plant Pathol. 2019, 101, 1211–1214. [Google Scholar] [CrossRef]
  21. Huang, C.S.; Ma, S.Y.; Liu, H.X.; Lu, Q.; Shi, L.G.; Liao, N.; Wei, L.B. Chemical constituents from roots of Actinidia rufa and their cytotoxicity. Chin. J. Chin. Mater. Med. 2017, 42, 2714–2718. [Google Scholar]
  22. Liao, G.; Chen, L.; He, Y.; Li, X.; Lv, Z.; Yi, S.; Zhong, M.; Huang, C.; Jia, D.; Qu, X.; et al. Three metabolic pathways are responsible for the accumulation and maintenance of high AsA content in kiwifruit (Actinidia eriantha). BMC Genom. 2021, 22, 13. [Google Scholar] [CrossRef]
  23. Liu, Y.; Ma, K.; Qi, Y.; Lv, G.; Ren, X.; Liu, Z.; Ma, F. Transcriptional regulation of anthocyanin synthesis by MYB-bHLH-WDR complexes in kiwifruit Actinidia chinensis. J. Agric. Food Chem. 2021, 69, 3677–3691. [Google Scholar] [CrossRef] [PubMed]
  24. Liu, X.; Wu, R.; Bulley, S.M.; Zhong, C.; Li, D. Kiwifruit MYBS1-like and GBF3 transcription factors influence L-ascorbic acid biosynthesis by activating transcription of GDP-L-galactose phosphorylase 3. New Phytol. 2022, 234, 1782. [Google Scholar] [CrossRef] [PubMed]
  25. Liu, X.; Xie, X.; Zhong, C.; Li, D. Comparative transcriptome analysis revealed the key genes regulating ascorbic acid synthesis in Actinidia. Int. J. Mol. Sci. 2021, 22, 12894. [Google Scholar] [CrossRef] [PubMed]
  26. Xu, X.; Liao, G.; Huang, C.; Zhong, M.; Jia, D.; Qu, X.; Liu, Q.; He, Y.; Li, Y. Differences of sucrose accumulation concentration and related genes expression between two sucrose accumulation types of Actinidia eriantha. Sci. Rep. 2020, 10, 20474. [Google Scholar] [CrossRef] [PubMed]
  27. Liao, G.; Li, Y.; Wang, H.; Liu, Q.; Zhong, M.; Jia, D.; Huang, C.; Xu, X. Genome-wide identification and expression profiling analysis of sucrose synthase (SUS) and sucrose phosphate synthase (SPS) genes family in Actinidia chinensis and A. eriantha. BMC Plant Biol. 2022, 22, 215. [Google Scholar] [CrossRef] [PubMed]
  28. Xu, X.; Yang, Y.; Liu, C.; Sun, Y.; Zhang, T.; Hou, M.; Huang, S.; Yuan, H. The evolutionary history of the sucrose synthase gene family in higher plants. BMC Plant Biol. 2019, 19, 566. [Google Scholar] [CrossRef] [PubMed]
  29. Akagi, T.; Varkonyi-Gasic, E.; Shirasawa, K.; Catanach, A.; Henry, I.M.; Mertten, D.; Datson, P.; Masuda, K.; Fujita, N.; Kuwada, E.; et al. Recurrent neo-sex chromosome evolution in kiwifruit. Nat. Plants 2023, 9, 393–402. [Google Scholar] [CrossRef]
  30. El-Gebali, S.; Mistry, J.; Bateman, A.; Eddy, S.R.; Luciani, A.; Potter, S.C.; Qureshi, M.; Richardson, L.J.; Salazar, G.A.; Smart, A.; et al. The pfam protein families database in 2019. Nucleic Acids Res. 2019, 47, D427–D432. [Google Scholar] [CrossRef]
  31. Mistry, J.; Finn, R.D.; Eddy, S.R.; Bateman, A.; Punta, M. Challenges in homology search: HMMER3 and convergent evolution of coiled-coil regions. Nucleic Acids Res. 2013, 41, e121. [Google Scholar] [CrossRef] [PubMed]
  32. Kumar, S.; Stecher, G.; Tamura, K. MEGA7: Molecular evolutionary genetics analysis version 7.0 for bigger datasets. Mol. Biol. Evol. 2016, 33, 1870. [Google Scholar] [CrossRef] [PubMed]
  33. Hu, B.; Jin, J.; Guo, A.-Y.; Zhang, H.; Luo, J.; Gao, G. GSDS 2.0: An upgraded gene feature visualization server. Bioinformatics 2015, 31, 1296–1297. [Google Scholar] [CrossRef] [PubMed]
  34. Bailey, T.L.; Williams, N.; Misleh, C.; Li, W.W. MEME: Discovering and analyzing DNA and protein sequence motifs. Nucleic Acids Res. 2006, 34, W369–W373. [Google Scholar] [CrossRef] [PubMed]
  35. Chen, C.; Wu, Y.; Li, J.; Wang, X.; Zeng, Z.; Xu, J.; Liu, Y.; Feng, J.; Chen, H.; He, Y.; et al. TBtools-II: A “one for all, all for one” bioinformatics platform for biological big-data mining. Mol. Plant 2023, 16, 1733–1742. [Google Scholar] [CrossRef] [PubMed]
  36. Wang, Y.; Tang, H.; Debarry, J.D.; Tan, X.; Li, J.; Wang, X.; Lee, T.H.; Jin, H.; Marler, B.; Guo, H.; et al. MCScanX: A toolkit for detection and evolutionary analysis of gene synteny and collinearity. Nucleic Acids Res. 2012, 40, e49. [Google Scholar] [CrossRef] [PubMed]
  37. Zhang, Z.; Xiao, J.; Wu, J.; Zhang, H.; Liu, G.; Wang, X.; Dai, L. ParaAT: A parallel tool for constructing multiple protein-coding DNA alignments. Biochem. Biophys. Res. Commun. 2012, 419, 779–781. [Google Scholar] [CrossRef] [PubMed]
  38. Wang, D.; Zhang, Y.; Zhang, Z.; Zhu, J.; Yu, J. KaKs_Calculator 2.0: A toolkit incorporating gamma-series methods and sliding window strategies. Genom. Proteom. Bioinf. 2010, 8, 77–80. [Google Scholar] [CrossRef] [PubMed]
  39. Bolger, A.M.; Lohse, M.; Usadel, B. Trimmomatic: A flexible read trimming tool for Illumina NGS data. Bioinformatics 2014, 30, 2114–2120. [Google Scholar] [CrossRef]
  40. Kim, D.; Paggi, J.M.; Park, C.; Bennett, C.; Salzberg, S.L. Graph-based genome alignment and genotyping with HISAT2 and HISAT-genotype. Nat. Biotechnol. 2019, 37, 907–915. [Google Scholar] [CrossRef]
  41. Putri, G.H.; Anders, S.; Pyl, P.T.; Pimanda, J.E.; Zanini, F. Analysing high-throughput sequencing data in Python with HTSeq 2.0. Bioinformatics 2022, 38, 2943–2945. [Google Scholar] [CrossRef] [PubMed]
  42. Trapnell, C.; Roberts, A.; Goff, L.; Pertea, G.; Kim, D.; Kelley, D.R.; Pimentel, H.; Salzberg, S.L.; Rinn, J.L.; Pachter, L. Differential gene and transcript expression analysis of RNA-seq experiments with TopHat and Cufflinks. Nat Protoc. 2012, 7, 562–578. [Google Scholar] [CrossRef] [PubMed]
  43. Gao, Y.; Liu, X.; Tang, B.; Li, C.; Kou, Z.; Li, L.; Liu, W.; Wu, Y.; Kou, X.; Li, J.; et al. Protein Expression Landscape of Mouse Embryos during Pre-implantation Development. Cell Rep. 2017, 21, 3957–3969. [Google Scholar] [CrossRef] [PubMed]
  44. Wu, T.; Hu, E.; Xu, S.; Chen, M.; Guo, P.; Dai, Z.; Feng, T.; Zhou, L.; Tang, W.; Zhan, L.; et al. clusterProfiler 4.0: A universal enrichment tool for interpreting omics data. Innovation 2021, 2, 100141. [Google Scholar] [CrossRef] [PubMed]
  45. Ruan, Y.L.; Jin, Y.; Yang, Y.J.; Li, G.J.; Boyer, J.S. Sugar input, metabolism, and signaling mediated by invertase: Roles in development, yield potential, and response to drought and heat. Mol. Plant 2010, 3, 942–955. [Google Scholar] [CrossRef] [PubMed]
  46. Barbosa, A.C.O.; Rocha, D.S.J.; Silva, G.C.B.; Santos, M.G.M.; Camillo, L.R.; de Oliveira, P.H.G.A.; Cavalari, A.A.; Costa, M.G.C. Dynamics of the sucrose metabolism and related gene expression in tomato fruits under water deficit. Physiol. Mol. Biol. Plants 2023, 29, 159–172. [Google Scholar] [CrossRef] [PubMed]
  47. Li, M.; Feng, F.; Cheng, L. Expression Patterns of Genes Involved in Sugar Metabolism and Accumulation during Apple Fruit Development. PLoS ONE 2012, 7, e33055. [Google Scholar] [CrossRef] [PubMed]
  48. Jiang, S.Y.; Chi, Y.H.; Wang, J.Z.; Zhou, J.X.; Cheng, Y.S.; Zhang, B.L.; Ma, A.; Vanitha, J.; Ramachandran, S. Sucrose metabolism gene families and their biological functions. Sci. Rep. 2015, 5, 17583. [Google Scholar] [CrossRef] [PubMed]
  49. Zhang, X.; Wang, S.; Ren, Y.; Gan, C.; Li, B.; Fan, Y.; Zhao, X.; Yuan, Z. Identification, analysis and gene cloning of the SWEET gene family provide insights into sugar transport in Pomegranate (Punica granatum). Int. J. Mol. Sci. 2022, 23, 2471. [Google Scholar] [CrossRef]
  50. Hu, W.; Hua, X.; Zhang, Q.; Wang, J.; Shen, Q.; Zhang, X.; Wang, K.; Yu, Q.; Lin, Y.R.; Ming, R.; et al. New insights into the evolution and functional divergence of the SWEET family in Saccharum based on comparative genomics. BMC Plant Biol. 2018, 18, 270. [Google Scholar] [CrossRef]
  51. Veillet, F.; Gaillard, C.; Coutos-Thevenot, P.; La Camera, S. Targeting the AtCWIN1 gene to explore the role of invertases in sucrose transport in roots and during Botrytis cinerea infection. Front. Plant Sci. 2016, 7, 1899. [Google Scholar] [CrossRef] [PubMed]
  52. Zhu, C.; Yang, K.; Li, G.; Li, Y.; Gao, Z. Identification and expression analyses of invertase genes in Moso Bamboo reveal their potential drought stress functions. Front. Genet. 2021, 12, 696300. [Google Scholar] [CrossRef] [PubMed]
  53. Zhao, L.; Zhang, B.; Huang, H.; Huang, W.; Zhang, Z.; Wang, Q.; Luo, H.; An, B. Metabolomic and transcriptomic analyses provide insights into metabolic networks during cashew fruit development and ripening. Food Chem. 2023, 404 Pt B, 134765. [Google Scholar] [CrossRef]
  54. Zhou, D.; Shen, Y.; Zhou, P.; Fatima, M.; Lin, J.; Yue, J.; Zhang, X.; Chen, L.Y.; Ming, R. Papaya CpbHLH1/2 regulate carotenoid biosynthesis-related genes during papaya fruit ripening. Hortic Res. 2019, 6, 80. [Google Scholar] [CrossRef] [PubMed]
  55. Zhang, L.; Kang, J.; Xie, Q.; Gong, J.; Shen, H.; Chen, Y.; Chen, G.; Hu, Z. The basic helix-loop-helix transcription factor bHLH95 affects fruit ripening and multiple metabolisms in tomato. J. Exp. Bot. 2020, 71, 6311–6327. [Google Scholar] [CrossRef] [PubMed]
  56. Zhu, M.; Chen, G.; Zhou, S.; Tu, Y.; Wang, Y.; Dong, T.; Hu, Z. A new tomato NAC (NAM/ATAF1/2/CUC2) transcription factor, SlNAC4, functions as a positive regulator of fruit ripening and carotenoid accumulation. Plant Cell Physiol. 2014, 55, 119–135. [Google Scholar] [CrossRef]
  57. Cao, H.; Chen, J.; Yue, M.; Xu, C.; Jian, W.; Liu, Y.; Song, B.; Gao, Y.; Cheng, Y.; Li, Z. Tomato transcriptional repressor MYB70 directly regulates ethylene-dependent fruit ripening. Plant J. 2020, 104, 1568–1581. [Google Scholar] [CrossRef]
Figure 1. The neighbor-joining phylogenetic tree of six gene families (INVs, SPPs, SPSs, SUSs, SUTs, and SWEETs) from four Actinidia species: A. thaliana, S. lycopersicum, and V. vinifera. Purple, red, orange, pink, cyan, and green lines indicate genes from INVs, SPPs, SPSs, SUSs, SUTs, and SWEETs, respectively.
Horticulturae 10 00772 g001
Figure 2. Phylogenetic relationships, conserved protein motifs, and gene structures of sucrose metabolism-related gene families. (A) The neighbor-joining phylogenetic tree of sucrose metabolism-related proteins from A. rufu. Colored boxes indicate different gene families. (B) The conserved motifs and (C) functional domain of proteins. Identified motifs and conserved domains are displayed with colored boxes. (D) The gene structure of these gene families and green boxes represents CDS.
Horticulturae 10 00772 g002
Figure 3. Predicted cis-elements in sucrose metabolism-related gene families promoters. The cis-acting elements are annotated as (AG) flavonoid biosynthetic, growth and biological process, hormone responsive, light responsive, metabolic responsive, MYB binding, and stress responsive, respectively. The distribution of cis-acting elements in the promoter region of the sucrose metabolism-related gene families is illustrated on the right, with different colors representing various types of cis-acting elements. The number of cis-acting elements is shown in the colored box.
Horticulturae 10 00772 g003
Figure 4. Expression pattern of structure genes involved in sucrose metabolism during kiwifruit development and ripening. INV, invertase; HK, hexokinase; SPP, sucrose–phosphatase; SPS, sucrose–phosphate synthase; SUS, sucrosesynthase, SWEETs, sugars will eventually be exported transporters.
Horticulturae 10 00772 g004
Figure 5. GO (A) and KEGG (B) enrichment analysis of the sixty-two members among the six gene families.
Horticulturae 10 00772 g005
Figure 6. The clustering of (A) six gene families and (B) co−expressed TFs. Orange and green lines indicate genes and TFs, respectively. The number of six types of genes and the top ten TFs are shown on the right, respectively.
Horticulturae 10 00772 g006
Figure 7. Putative transcriptional regulatory networks of genes in (A) Cluster 1 and (B) Cluster 2, respectively. Connected lines represent potential co-expression relationships between TFs and genes.
Horticulturae 10 00772 g007
Table 1. The number of sucrose metabolism-related gene families in the seven completely sequenced plant genomes.
Gene FamilyINVSPPSPSSUSSUC/SUTSWEETTotal
Arabidopsis thaliana3326691773
Actinidia chinensis313610102989
Actinidia eriantha2826992882
Actinidia hemsleyana2926771970
Actinidia rufa3124961062
Solanum lycopersicum1924622558
Vitis vinifera2157752065
Abbreviations: INV, invertase; SPP, sucrose phosphate phosphatase; SPS, sucrose phosphate synthase; SUS, sucrose synthase; SUT, sucrose transporter; SWEETs, sugars will eventually be exported transporters.
Table 2. Characteristics of sucrose metabolism-related gene families in A. rufa.
Gene NameGene IDProtein Length (aa)Molecular Weight (kDa)Isoelectric Point
ArINV1GFY84308.144349.104.53
ArINV2GFY97846.153359.946.35
ArINV3GFZ01189.186796.975.23
ArINV4GFZ04274.145250.426.56
ArINV5GFZ04278.145651.599.22
ArINV6GFZ08509.150757.586.37
ArINV7GFS29709.129634.366.96
ArINV8GFS29713.137942.655.4
ArINV9GFS39341.159867.296.51
ArINV10GFS42808.157064.965.88
ArINV11GFY85269.156663.756.08
ArINV12GFY86245.157065.276.24
ArINV13GFY89074.159767.796.18
ArINV14GFY89880.157465.606.02
ArINV15GFY90201.150857.778.72
ArINV16GFY95297.155263.076.31
ArINV17GFZ00601.157665.736.08
ArINV18GFZ00609.161570.026.24
ArINV19GFZ03044.119121.675.24
ArINV20GFZ03045.110611.805.57
ArINV21GFZ07245.164573.375.53
ArINV22GFZ07303.157164.005.35
ArINV23GFZ09104.146652.635.74
ArINV24GFZ09106.154061.006.55
ArINV25GFZ09762.110512.049.36
ArINV26GFZ09763.138243.825.71
ArINV27GFZ11195.165473.465.88
ArINV28GFZ12668.161868.826.09
ArINV29GFZ21641.166875.086.31
ArINV30GFZ06978.165273.024.99
ArINV31GFZ15206.151458.106.64
ArSPP1GFY98003.139544.705.6
ArSPP2GFZ09269.143348.915.56
ArSPS1GFS40808.171680.766.05
ArSPS2GFY88805.156663.595.95
ArSPS3GFY95144.1983112.328.64
ArSPS4GFY99702.181190.896.13
ArSUS1GFS35293.155963.666.51
ArSUS2GFS35295.171780.505.76
ArSUS3GFS35628.181593.075.7
ArSUS4GFS35631.171480.917.67
ArSUS5GFS37905.183894.508.13
ArSUS6GFS38485.180692.635.97
ArSUS7GFY98571.177288.846.13
ArSUS8GFZ09599.11240140.469.09
ArSUS9GFZ17994.181993.168.07
ArSUT1GFS44113.145249.429.48
ArSUT2GFY85479.149353.539.28
ArSUT3GFY85509.151854.689.17
ArSUT4GFY85510.149953.009
ArSUT5GFY88434.159163.846.8
ArSUT6GFY96916.150453.618.94
ArSWEET1GFS37554.121023.009.41
ArSWEET2GFS38071.128030.707.76
ArSWEET3GFS38076.116918.339.55
ArSWEET4GFS45098.1697.688.01
ArSWEET5GFY89003.121023.256.5
ArSWEET6GFY99936.123125.826.95
ArSWEET7GFZ03923.124727.409.37
ArSWEET8GFZ03924.122025.078.58
ArSWEET9GFZ04631.119522.065.6
ArSWEET10GFZ09897.125227.569.71
Disclaimer/Publisher’s Note: The statements, opinions and data contained in all publications are solely those of the individual author(s) and contributor(s) and not of MDPI and/or the editor(s). MDPI and/or the editor(s) disclaim responsibility for any injury to people or property resulting from any ideas, methods, instructions or products referred to in the content.

