Article

Metabolomic and Transcriptomic Analysis of Unique Floral Coloration in Osmanthus fragrans Cultivars

1
National Forestry and Grassland Administration Engineering Research Center for Osmanthus Fragrans, Hubei University of Science and Technology, Xianning 437100, China
2
Public Inspection and Testing Center, Xianning 437100, China
3
School of Pharmacy, Xianning Medical College, Hubei University of Science and Technology, Xianning 437100, China
4
Research Center for Osmanthus Fragrans, Xianning Research Academy of Industrial Technology of Osmanthus Fragrans, Xianning 437100, China
*
Author to whom correspondence should be addressed.
Horticulturae 2024, 10(8), 801; https://doi.org/10.3390/horticulturae10080801
Submission received: 3 July 2024 / Revised: 19 July 2024 / Accepted: 22 July 2024 / Published: 29 July 2024

Abstract

:
The floral color phenotypes of Osmanthus fragrans cultivars range from light yellow to orange yellow, with ‘Yanzhi Hong’ being the only reported cultivar with a red color. However, the underlying reason for this unique floral coloration remains unclear. The study conducted targeted metabolomics and transcriptomics analyses on the petals of ‘Yanzhi Hong’ at both initial and peak flowering stages. Candidate gene expression was validated, and expression levels of the petals of three cultivars were compared using RT-qPCR. The results revealed the presence of 27 components in the petals of ‘Yanzhi Hong’, including 5 carotenoids, 8 xanthophylls, and 14 xanthophyll esters. Notably, lycopene was detected in abundance for the first time in O. fragrans cultivars. Carotenes accounted for 78.82 ± 3.17% and 91.19 ± 1.69% of the total carotenoid content in petals during the initial and peak flowering stages, respectively, with all carotene contents increasing during the peak flowering period. β-carotene, lycopene, and γ-carotene were identified as the top three carotene components in petals during both initial and full flowering stages. The unique blush red color of ‘Yanzhi Hong’ petals could be attributed to the low content of α-carotene and the rich accumulation of lycopene. Furthermore, a total of 1550 differentially expressed genes (DEGs) were identified in petals at the peak flowering stage relative to the initial flowering stage, with 1003 genes being downregulated and 547 genes being upregulated during the full flowering stage. There are 926 differentially expressed genes (DEGs) annotated in the Gene Ontology (GO) database. Among these DEGs, those that were downregulated and upregulated during the peak flowering period showed significant enrichment in carbohydrate metabolism and oxidation–reduction processes, respectively. The Kyoto Encyclopedia of Genes and Genomes (KEGG) analysis identified 14 structural genes associated with phenylpropanoid biosynthesis and 7 structural genes linked to carotenoid biosynthesis. Expression levels of candidate genes involved in carotenoid biosynthesis were examined in the petals of three cultivars (‘Yanzhi Hong’, ‘Liuye Jingui’, and ‘Gecheng Dangui’) at both the initial and peak flowering stages. The results indicated that the decreased expression of LYG009054 (LYCE) and LYG018651 (LYCB) in ‘Yanzhi Hong’ resulted in higher lycopene accumulation and lower α-carotene content in the petals. This study offers valuable insights into the mechanisms underlying the unique flower color phenotype of O. fragrans, proving a basis for further research on carotenoid metabolism pathways and the breeding of new cultivars with a variety of flower colors in O. fragrans.

1. Introduction

Osmanthus fragrans Lour, a traditional Chinese flower renowned for its fragrance, belongs to the Oleaceae family and Osmanthus genus. Originating in southwest China, it boasts a cultivation history spanning over 2500 years. Widely grown in the southern region of the Yellow River Basin in China, it stands out as a superior tree species for landscaping purposes. Moreover, O. fragrans holds significant economic value in China, finding application in essential oils, beverages, and various food products. Key production areas for O. fragrans include Xianning in Hubei, Chengdu in Sichuan, Guilin in Guangxi, Suzhou in Jiangsu, and Hangzhou in Zhejiang [1]. Cultivars of O. fragrans are classified into four groups—Semperflorens, Albus, Luteus, and Aurantiacus—based on their flowering season and color. The Albus group is characterized by pale yellow blooms, the Luteus group flaunts yellow flowers, and the Aurantiacus group presents orange-yellow blossoms [2,3]. The limited color spectrum of O. fragrans cultivars is due to the absence of hues other than yellow.
The formation of plant flower color is determined by three major pigments: anthocyanins, carotenoids, and betaine [4,5]. Anthocyanins, a type of flavonoid compound, are synthesized in the cytoplasm through the phenylpropanoid metabolism pathway and stored in vacuoles, resulting in a broad spectrum of colors ranging yellow, red, or blue. Carotenoids, lipophilic C40 terpenoids, are synthesized and stored in plastids through the isoprene metabolic pathway, leading to a color range from yellow to red. Betaine, a nitrogen-containing compound, is found only in a few plants. In certain plants like chrysanthemums and roses, anthocyanins and carotenoids can coexist in the same tissue, producing a variety of flower colors [6,7]. Studies have shown that O. fragrans, while abundant in flavonoids, primarily contains light yellow compounds such as quercetin, naringenin, and apigenin, with no anthocyanin components detected [8,9,10]. The main pigments responsible for color changes in different O. fragrans cultivars are carotenoids, particularly α-carotene and β-carotene [10,11,12]. Consequently, owing to its high concentration of orange-yellow carotenoids and absence of anthocyanins, O. fragrans flowers display a color transition from yellow-white to orange-yellow, with limited variation in color cultivars.
‘Yanzhi Hong’ is a recently registered cultivar of O. fragrans, distinguished as the sole red cultivar known to date. Its flowers transition from light yellow to pink and ultimately to blush red during different flowering stages [13,14]. The specific mechanism behind this color transformation remains unknown. In a study by Chai et al. [14], a metabolomics analysis on ‘Yanzhi Hong’ petals identified 304 metabolites including iridoids and flavonoids, but not anthocyanins. This study focused on the initial and peak flowering stages to explore the carotenoid composition, gene expression patterns, and mechanisms underlying the red floral color of ‘Yanzhi Hong’, aiming to provide insights for breeding O. fragrans cultivars with diverse flower colors.

2. Materials and Methods

2.1. Plant Materials

Samples of the ‘Yanzhi Hong’ (YZH) cultivar were collected from Huaan Garden Nursery Base in Jinhua City, Zhejiang Province (119°38′43″ E, 28°58′16″ N), specifically focusing on two developmental stages with distinct flower colors: the initial flowering stage (S1) and the peak flowering stage (S2) (refer to Figure 1). Two other cultivars, ‘Liuye Jingui’ (LYJG) and ‘Gecheng Dangui’ (GCDG), previous studied [15], were used for RT-qPCR analysis of genes for lycopene cyclase and carotene hydroxylase and were obtained from the nursery at Huazhong Agricultural University campus (114°21′3″ E, 30°28′43″ N). Petals weighing 2 g were collected from each stage, with three biological replicates per experiment. The samples were immediately frozen in liquid nitrogen and stored at −80 °C.

2.2. Extraction of Carotenoids

Freeze-dried samples were ground into powder at 30 Hz for 1 min. Subsequently, 50 mg of the ground sample was accurately weighed and extracted with a 0.5 mL mixture of n-hexane/acetone/ethanol (1:1:1, v/v/v) containing 0.01% butylated hydroxytoluene (BHT) (g/mL). After swirling at room temperature for 20 min, the solutions were centrifuged at 4 °C at 13,400× g for 5 min to obtain the supernatant. The residue was re-extracted by repeating the above steps again under the same conditions and the supernatants were merged. Following the concentration of the extraction solution using evaporation under vacuum, the samples were redissolved in a 100 μL methanol/methyl tert-butyl ether (MTBE) mixed solution (1:1, v/v), filtered through a 0.22 μm membrane filter, and stored in a brown injection bottle for LC-MS/MS analysis (QTRAP6500+, SCIEX, Framingham, MA, USA, https://sciex.com.cn/ (accessed on 13 March 2024)).

2.3. Detection Conditions of Carotenoids

Sample separation and mass spectrometry data acquisition were carried out using ultra performance liquid chromatography (UPLC) system and Tandem Mass Spectrometry (MS/MS) with the QTRAP® 6500+ instrument (https://sciex.com.cn/ (accessed on 13 March 2024)). The separation utilized a C30 chromatographic column (100 mm × 2.0 mm, 3 μm; YMC, Kyoto, Japan). The mobile phase for phase A consisted of methanol/acetonitrile in a 1:3 volumetric ratio, supplemented with 0.01% BHT and 0.1% formic acid, while phase B contained MTBE with 0.01% BHT. The gradient elution method followed these time points: initial 0 min (A/B 100:0), 3 min (100:0), 5 min (30:70), 9 min (5:95), 10 min (100:0), and final 11 min (100:0). The flow rate was maintained at 0.8 mL/min, column temperature set at 28 °C, and injection volume fixed at 2 μL. Linear ion trap (LIT) and triple quadrupole (QQQ) scans were performed on a QTRAP mass spectrometer (QTRAP® 6500+ LC-MS/MS System) (https://sciex.com.cn/ (accessed on 13 March 2024)) using an APCI Heated Nebulizer in positive ion mode. Instrument control was handled with Analyst 1.6.3 software (https://sciex.com.cn/ (accessed on 13 March 2024)). The APCI source settings included an APCI+ ion source, a source temperature of 350 °C, and a curtain gas (CUR) pressure of 25.0 psi.

2.4. Qualitative and Quantitative Analysis of Carotenoids

Carotenoids underwent analysis utilizing scheduled multiple reaction monitoring (MRM), while metabolite quantities were evaluated via data acquisition and analysis with Analyst 1.6.3 and Multi-quant 3.0.3 software. The results of hierarchical cluster analysis (HCA) were displayed as heatmaps accompanied by dendrograms, and Pearson correlation coefficients (PCC) among samples were determined using the cor function in R (v3.5.1) and visualized in heatmaps. Both HCA and PCC analyses were conducted using the pheatmap R package (2.7.1.1009). The HCA visualization showcased the normalized signal intensities of metabolites (normalized by unit variance) using a diverse color spectrum. Identification of significantly regulated metabolites between groups was based on absolute Log2 fold changes (Log2FC). Metabolites were annotated with the KEGG compound database http://www.kegg.jp/kegg/compound/ (accessed on 13 March 2024) and aligned with the KEGG Pathway database http://www.kegg.jp/kegg/pathway.html (accessed on 13 March 2024). Pathways containing significantly regulated metabolites were subjected to metabolite sets enrichment analysis (MSEA), with statistical significance assessed using p-values obtained from the hypergeometric test.

2.5. Transcriptome Sequencing and Differential Expression Gene Screening

RNA isolation of ‘Yanzhi Hong’ flower petal specimens was performed with the Trizol method, followed by Qsep400 system evaluation for quality (AutoQ Biosciences, San Diego, CA, USA). Utilizing the VAHTS mRNA seq V8 Library Prep Kit from Vazyme (Nanjing, China), the Illumina sequencing library (Illumina, San Diego, CA, USA) was prepared, starting with 1 μg of total RNA. Library preparation included polyA RNA selection, RNA fragmentation, reverse transcription using random hexamers, and sequencing on the Illumina Novaseq 6000 platform with 150 nt paired-ends. Adapters were removed and low-quality reads filtered using cutadapt (v1.11). The clean reads were aligned to the ‘Liuye Jingui’ reference genome [15] using Hisat2 (v2.1.0), allowing for up to two mismatches. And the raw sequencing data had been uploaded to NCBI (accession number XXXX). Identified genes were compared against public protein databases like NR (RefSeq non-redundant proteins). Transcript levels were estimated and gene expression normalized as FPKM (Fragments per kilobase of transcript per million fragments mapped) with Feature-count (v1.6.0). Differential expression analysis was carried out with edgeR, applying a threshold of FDR < 0.05 and |log2FoldChange| > 1. Gene Ontology (GO) and Kyoto Encyclopedia of Genes and Genomes (KEGG) enrichment analyses were performed using the Cluster Profiler in the R package, with enrichment analysis based on hypergeometric distribution and a q value cutoff of 0.05.

2.6. RT-qPCR Analysis of Genes Related to Carotenoid Synthesis

The Trizol method was utilized to extract total RNA from O. fragrans petals, followed by cDNA synthesis using the StarScript III All-in-one RT Mix with gDNA Remover kit (TransGen Biotech, Beijing, China). RT-qPCR was then performed with OfRANI as an internal reference gene (Supplementary Table S1) using 2x RealStar Fast SYBR qPCR Mix (GenStar, Beijing, China). The reaction system comprised 5 µL of 2x RealStar Fast SYBR qPCR Mix, 0.25 µL each of forward and reverse primers, 0.5 µL of cDNA, and water added to reach a final volume of 10 µL. The reaction procedure included a 4 min pre-denaturation at 94 °C, followed by denaturation at 94 °C for 10 s, annealing and extension at 60 °C for 30 s, repeated for a total of 40 cycles. PCR amplification was conducted on the Gentier 96R instrument (Tianlong, Xi’an, China), and the data were analyzed using the 2−∆∆ Ct algorithm.

2.7. Data Analysis

Metabolite clustering heatmap, co-expression correlation, linear regression analysis, and analysis of variance were conducted using the Omicshare Cloud tool https://www.omicshare.com/tools/ (accessed on 22 May 2024). The data was shown as mean ± SD, with three biological replicates for each sample.

3. Results

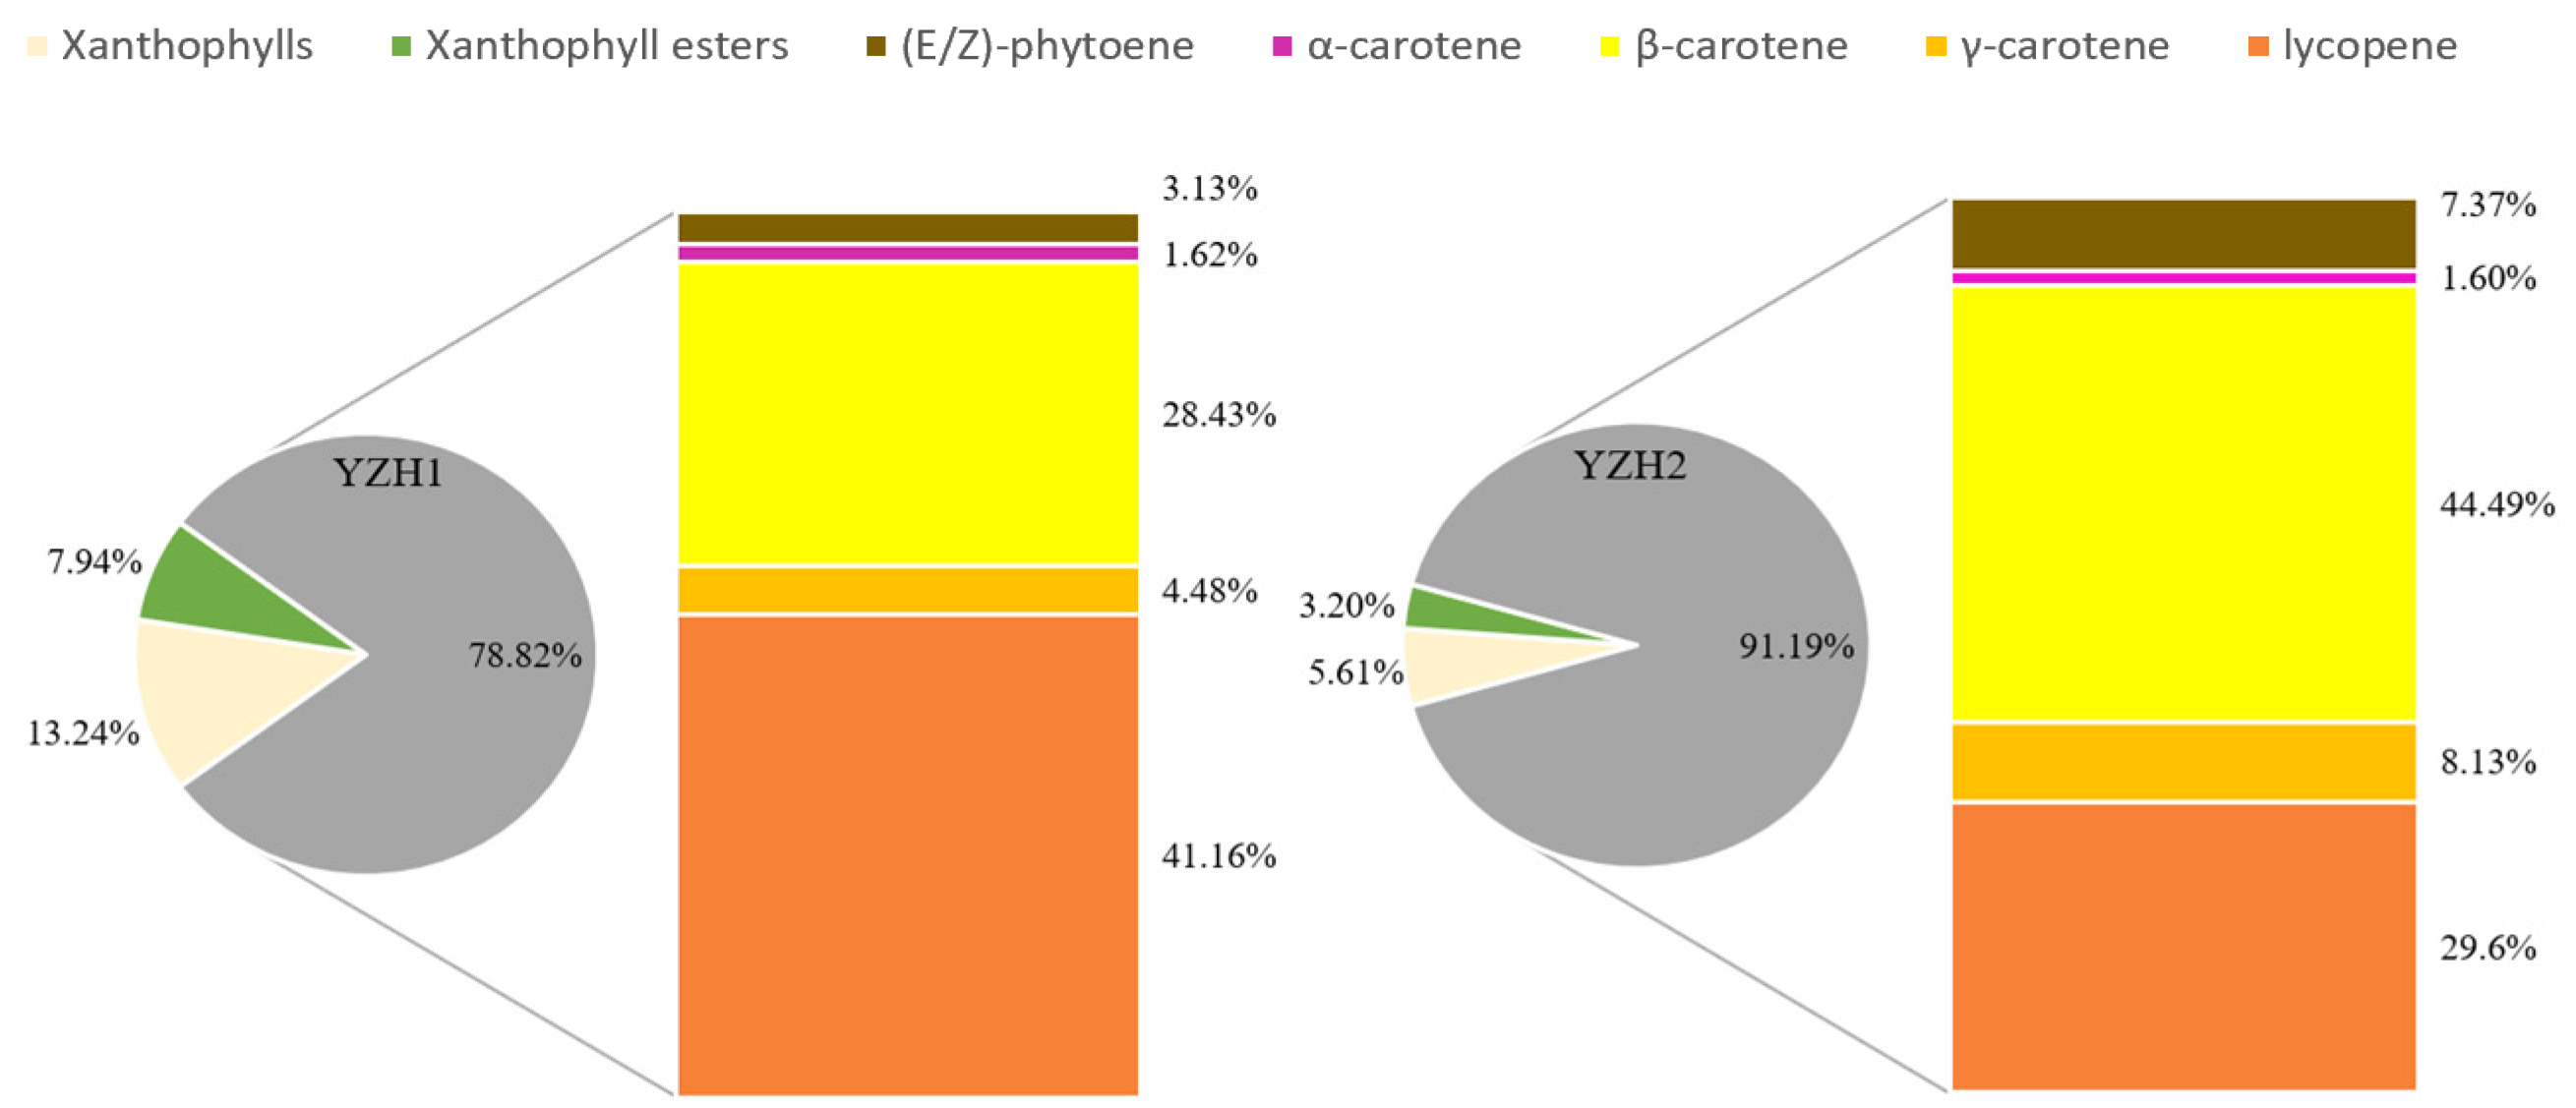
3.1. Difference in Carotenoids in ‘Yanzhi Hong’ Petals at the Initial and Peak Flowering Stages

The petal phenotypes of ‘Yanzhi Hong’ exhibited a noticeable color transition from the initial to peak flowering periods, as illustrated in Figure 1A,B. Different from the typical white, yellow, and orange hues of O. fragrans cultivars, ‘Yanzhi Hong’ displayed a reddish tone during the peak flowering stage, as depicted in Figure 1C. The UPLC-MS/MS analysis revealed the presence of 27 carotenoid components in ‘Yanzhi Hong’, including five carotenes (such as (E/Z)-phytoene, α-carotene, β-carotene, γ-carotene, and lycopene), eight xanthophylls (such as zeaxanthin, lutein, β-cryptoxanthin, etc.), and 14 xanthophyll esters (Table 1). Carotenes were the most abundant, making up 78.82% and 91.19% of total carotenoids during the initial and peak flowering stages, with higher levels of β-carotene and lycopene. Xanthophylls accounted for 13.24% and 5.61%, with zeaxanthin and lutein being the predominant. Xanthophyll esters comprised 7.94% and 3.20% of total carotenoids, with relatively high levels of β-cryptoxanthin palmate and rubixanthin palmate (Figure 2).
Table 1 and Figure 3 illustrate the presence of identical carotenoid components in the petals of ‘Yanzhi Hong’ during both the initial and peak flowering stages. However, notable differences exist in the content of these components between the two stages. Specifically, the carotene content in the petals is significantly higher at the peak flowering stage compared to the initial stage. At the peak flowering stage, the levels of β-carotene, γ-carotene, and (E/Z)-phytoene are 95.02 ± 4.37 µg/g DW, 17.35 ± 0.27 µg/g DW, and 15.72 ± 0.42 µg/g DW, respectively, representing a threefold increase from the initial flowering stage. The highest lycopene content of 48.84 ± 2.59 µg/g DW is observed at the initial flowering stage, while during peak flowering, it is 63.23 ± 3.31 µg/g DW, ranking second only to β-carotene. Among xanthophylls, only the levels of β-cryptoxanthin, 8′-apo-β-carotenal, and echinenone increase during peak flowering, whereas zeaxanthin, lutein, neoxanthin, and violaxanthin decrease significantly. Additionally, most xanthophyll esters also decrease during peak flowering. These results suggest that the color transformation in ‘Yanzhi Hong’ during peak flowering is primarily due to an elevation in carotene content, particularly the three pigments β-carotene, lycopene, and γ-carotene.

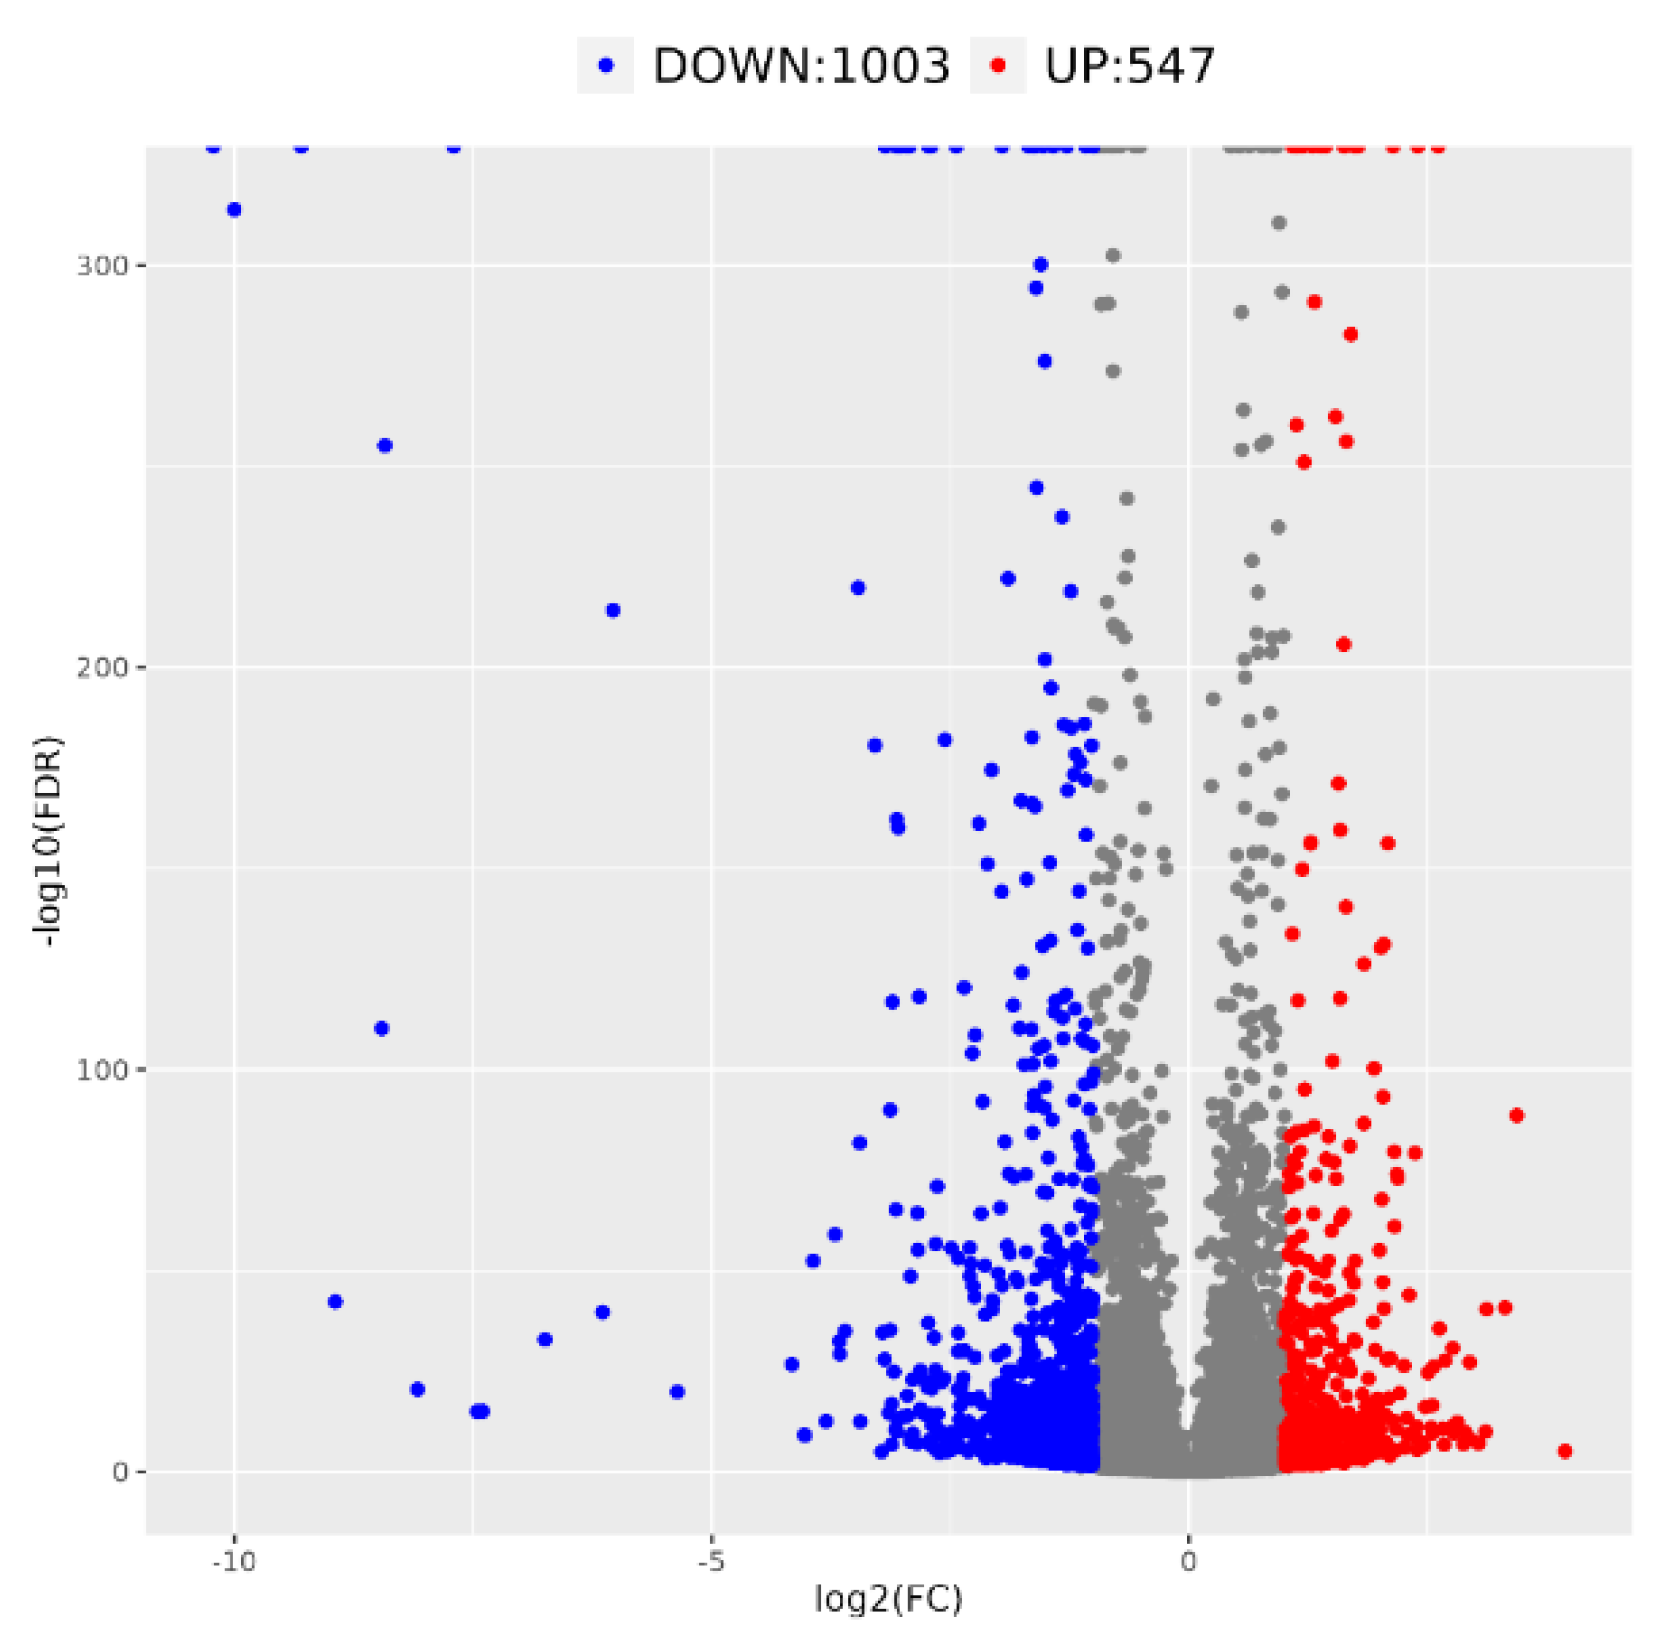
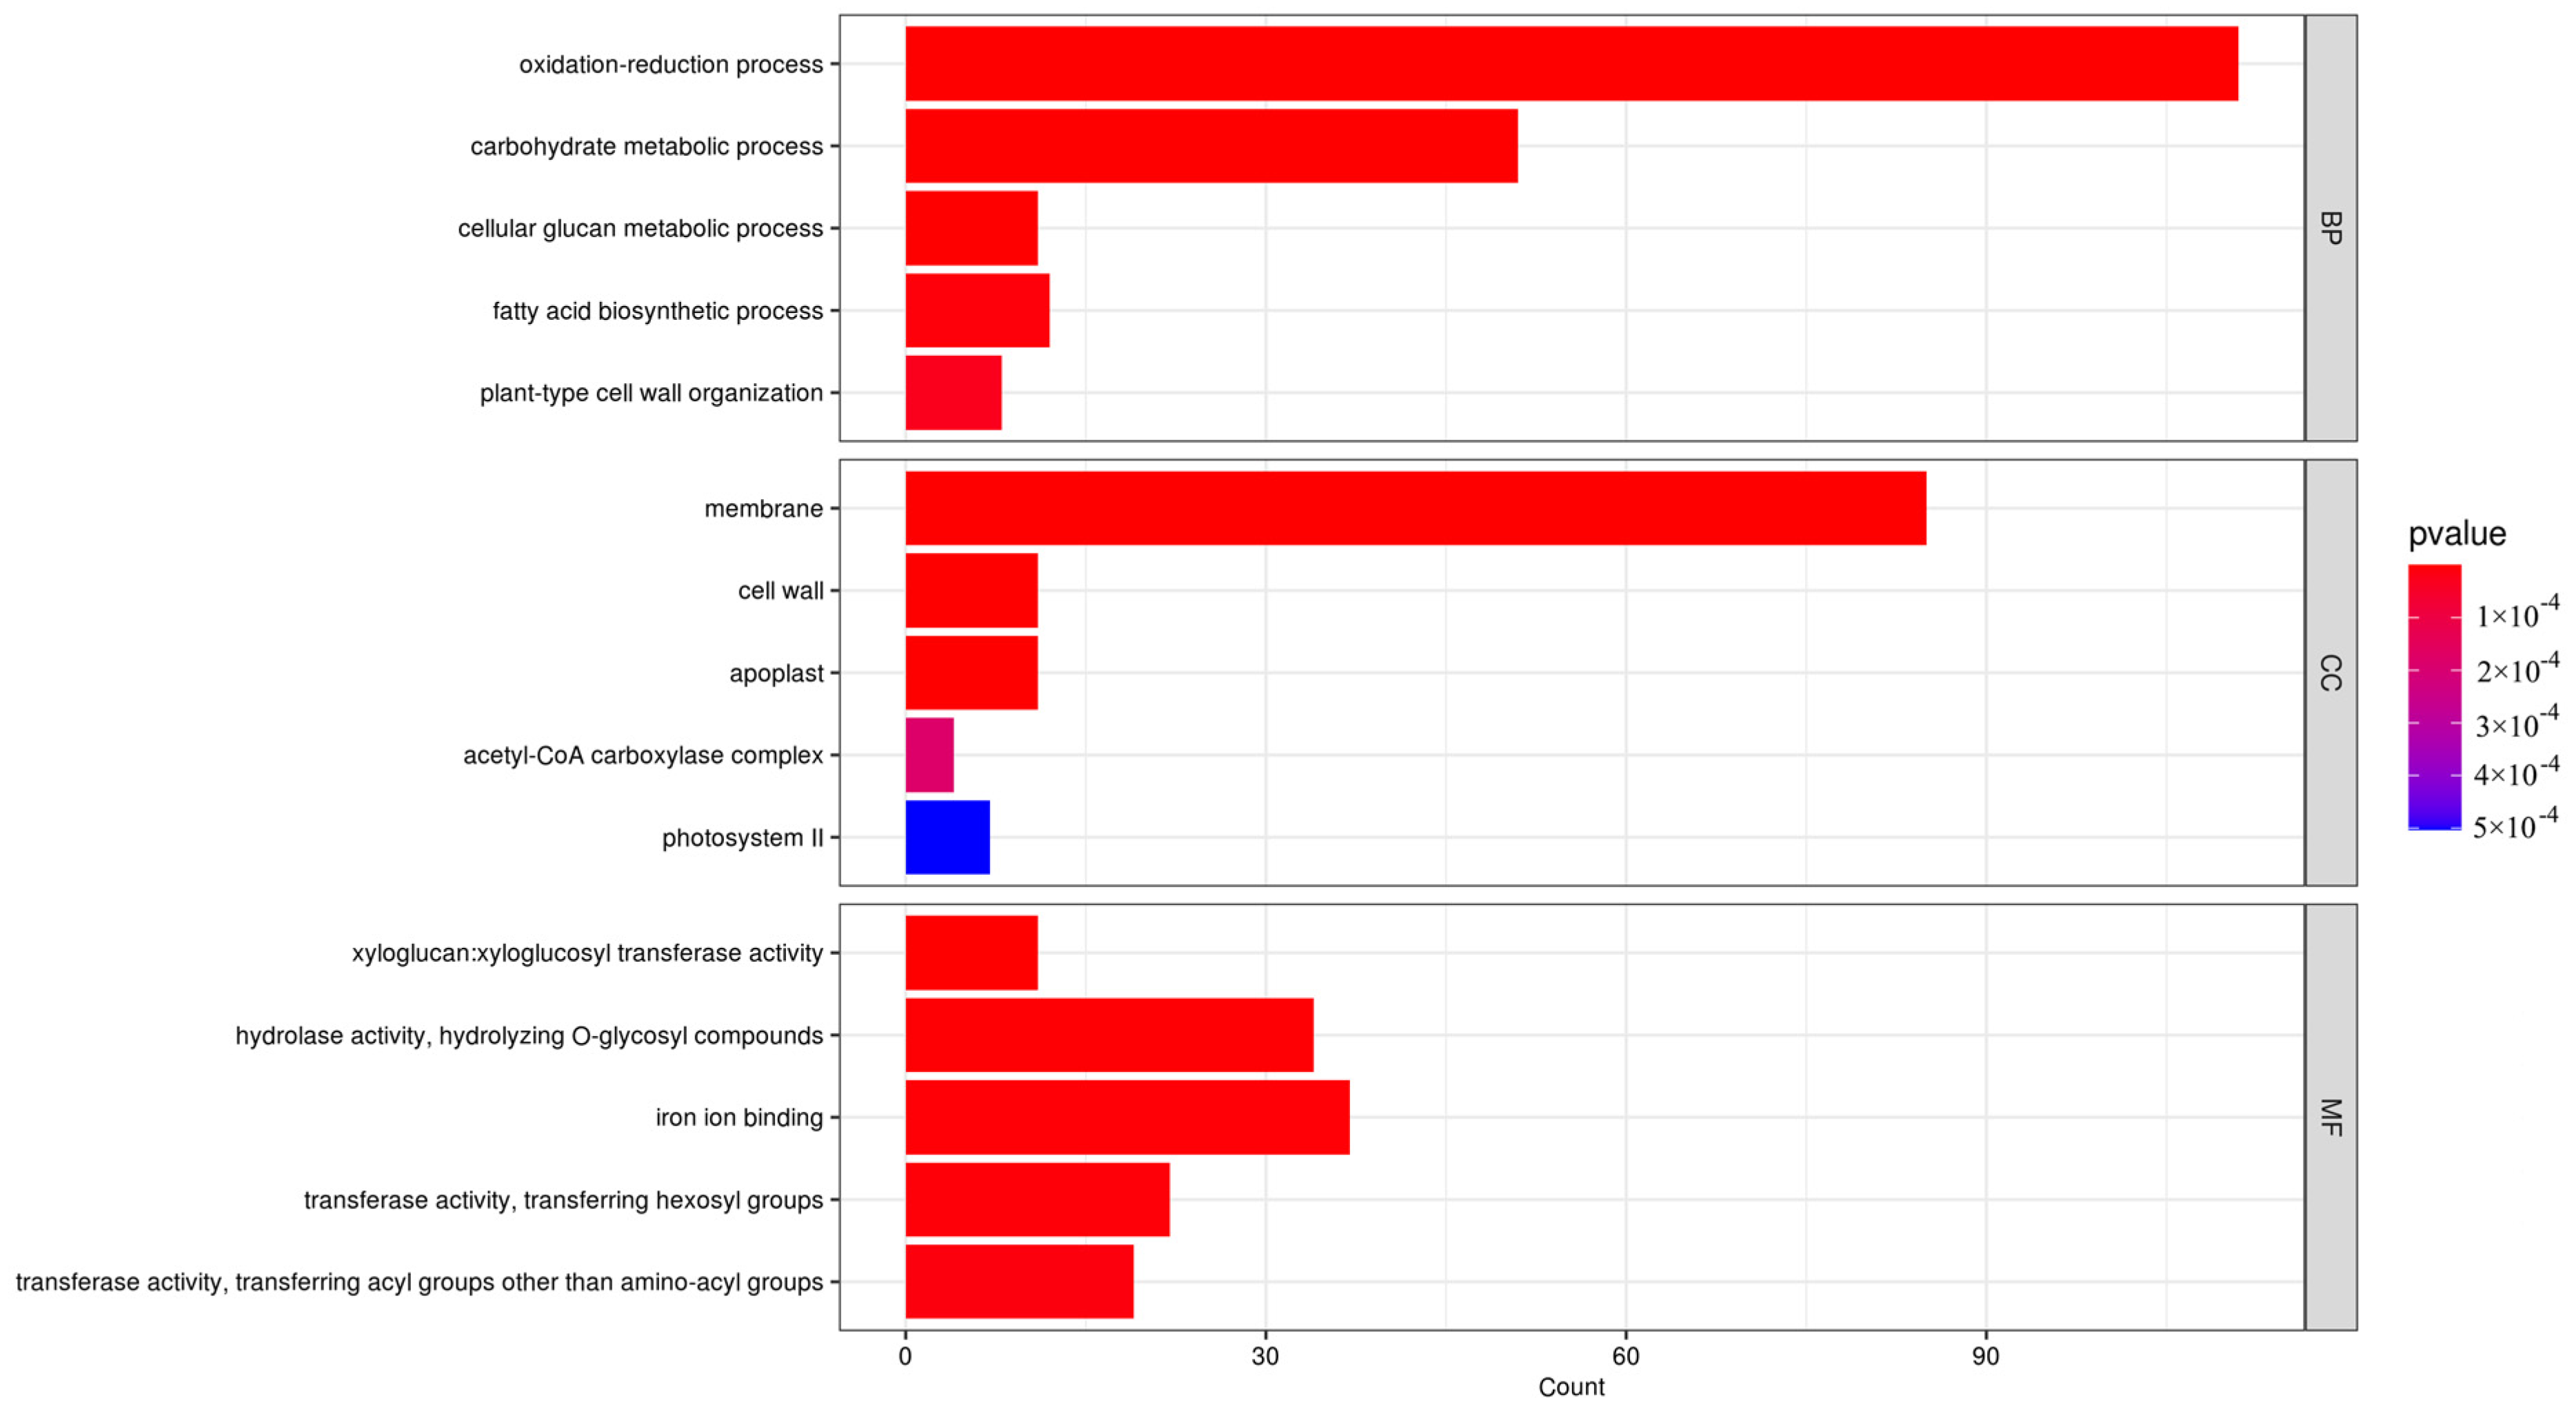
3.2. Transcriptome Sequencing and DEGs Analysis of ‘Yanzhi Hong’ Petals at the Initial and Peak Flowering Stages

The transcriptome sequencing data of ‘Yanzhi Hong’ petals was analyzed at the initial and peak flowering stages, as detailed in Table 2. A total of 39.94 Gb of valid data was collected, with each sample yielding effective readings ranging from 35,777,926 to 52,210,754. The quality metrics, Q20 and Q30, were found to be high at 96.84% and 97.24%, and 91.53% and 92.34%, respectively, indicating the reliability of the sequencing data for further analysis. Differential gene expression analysis was conducted using FDR < 0.05 and|log2FoldChange| > 1 as selection criteria for genes expressed at different developmental stages. A total of 1550 DEGs were identified, with 1003 downregulated and 547 upregulated at the peak flowering stage (refer to Figure 4).
GO enrichment analysis was conducted on 1550 identified DEGs, which were categorized into three groups by GO: biological processes, cellular components, and molecular functions (see Figure 5). The most notable enrichments in biological processes were observed in oxidation–reduction and carbohydrate metabolism processes, with 111 and 51 DEGs, respectively. Additionally, 85 DEGs related to membrane components showed significant enrichment in cellular composition. In terms of molecular function, genes associated with hydrolase activity and iron ion binding exhibited the highest abundances. Among the DEGs downregulated during the flowering period, significant enrichments were observed in carbohydrate metabolism, cell membrane composition, and hydrolytic enzyme activity. Conversely, upregulated DEGs during the flowering period showed significant enrichment in oxidation–reduction processes.
KEGG enrichment analysis revealed that a total of 259 DEGs were annotated in the KEGG database, with significant enrichment in pathways related to plant pathogen interactions, phenylpropanoid biosynthesis, photosynthesis, and fatty acid biosynthesis (Figure 6). Downregulated DEGs during the peak flowering period were primarily associated with photosynthesis and fatty acid synthesis, while upregulated DEGs were linked to MAPK signaling, indole alkaloids, and terpenoid metabolism. Within the enriched DEGs, 14 structural genes were identified in phenylpropanoid biosynthesis (Table S2), including key enzymes such as peroxidase, HCT, CAD, COMT, F5H, 4CL, and PAL. Additionally, seven DEGs were involved in carotenoid biosynthesis, encompassing NCED, LCYE, VDE, PSY, CYP707A, and AAO3 (Table S2).

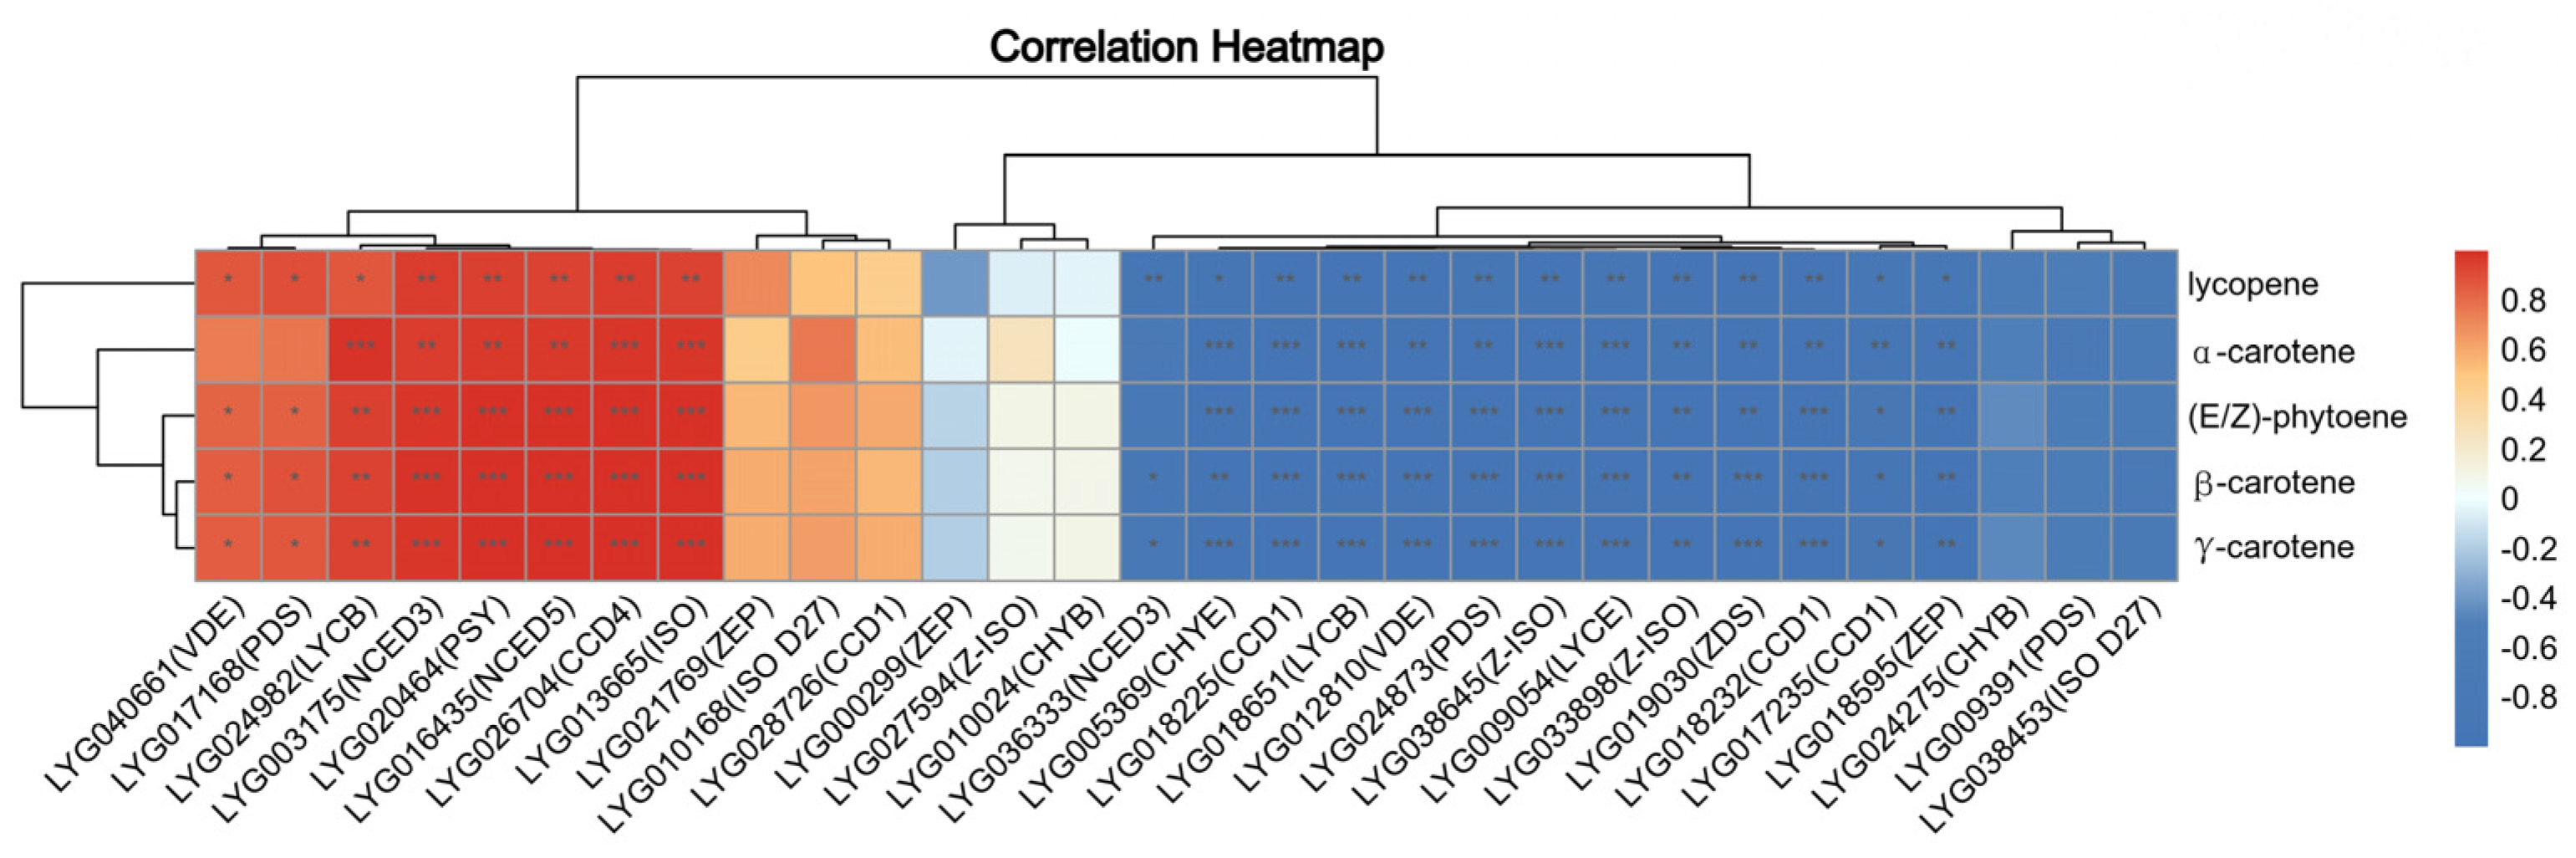
3.3. Association Analysis of Metabolic and Transcriptomic Date of Carotenoid Metabolism Pathway Genes

We identified 62 genes involved in carotenoid metabolism based on the functional annotation results from ‘Liuye Jingui’ (Table S3). These genes include four phytoene synthase (PSY), four 15-cis-phytoene desaturase (PDS), three 15-cis-zeta-carotene isomerase (Z-ISO), two prolycopene isomerase (ISO), four beta-carotene isomerase D27 (ISO D27), one zeta-carotene desaturase (ZDS), and one lycopene epsilon cyclase (LYCE), among others. The significant accumulation of carotenoid components like β-carotene, lycopene, γ-carotene, (E/Z)-phytoene, α-carotene, and β-cryptoxanthin is the main factor driving the floral color change during peak flowering (Table 1 and Figure 3). Pearson’s method was employed to assess the correlation between these carotenoid components and metabolic pathway genes, illustrated in Figure 7. Notably, these components exhibit significant positive correlations with certain genes such as LYG020464 (PSY), LYG013665 (ISO), LYG024982 (LYCB), LYG026704 (CCD4), LYG003175 (NCED3), and LYG016435 (NCED5), while showing significant negative correlations with genes like LYG030098 (PSY), LYG024873 (PDS), LYG033898 (Z-ISO), and several others.

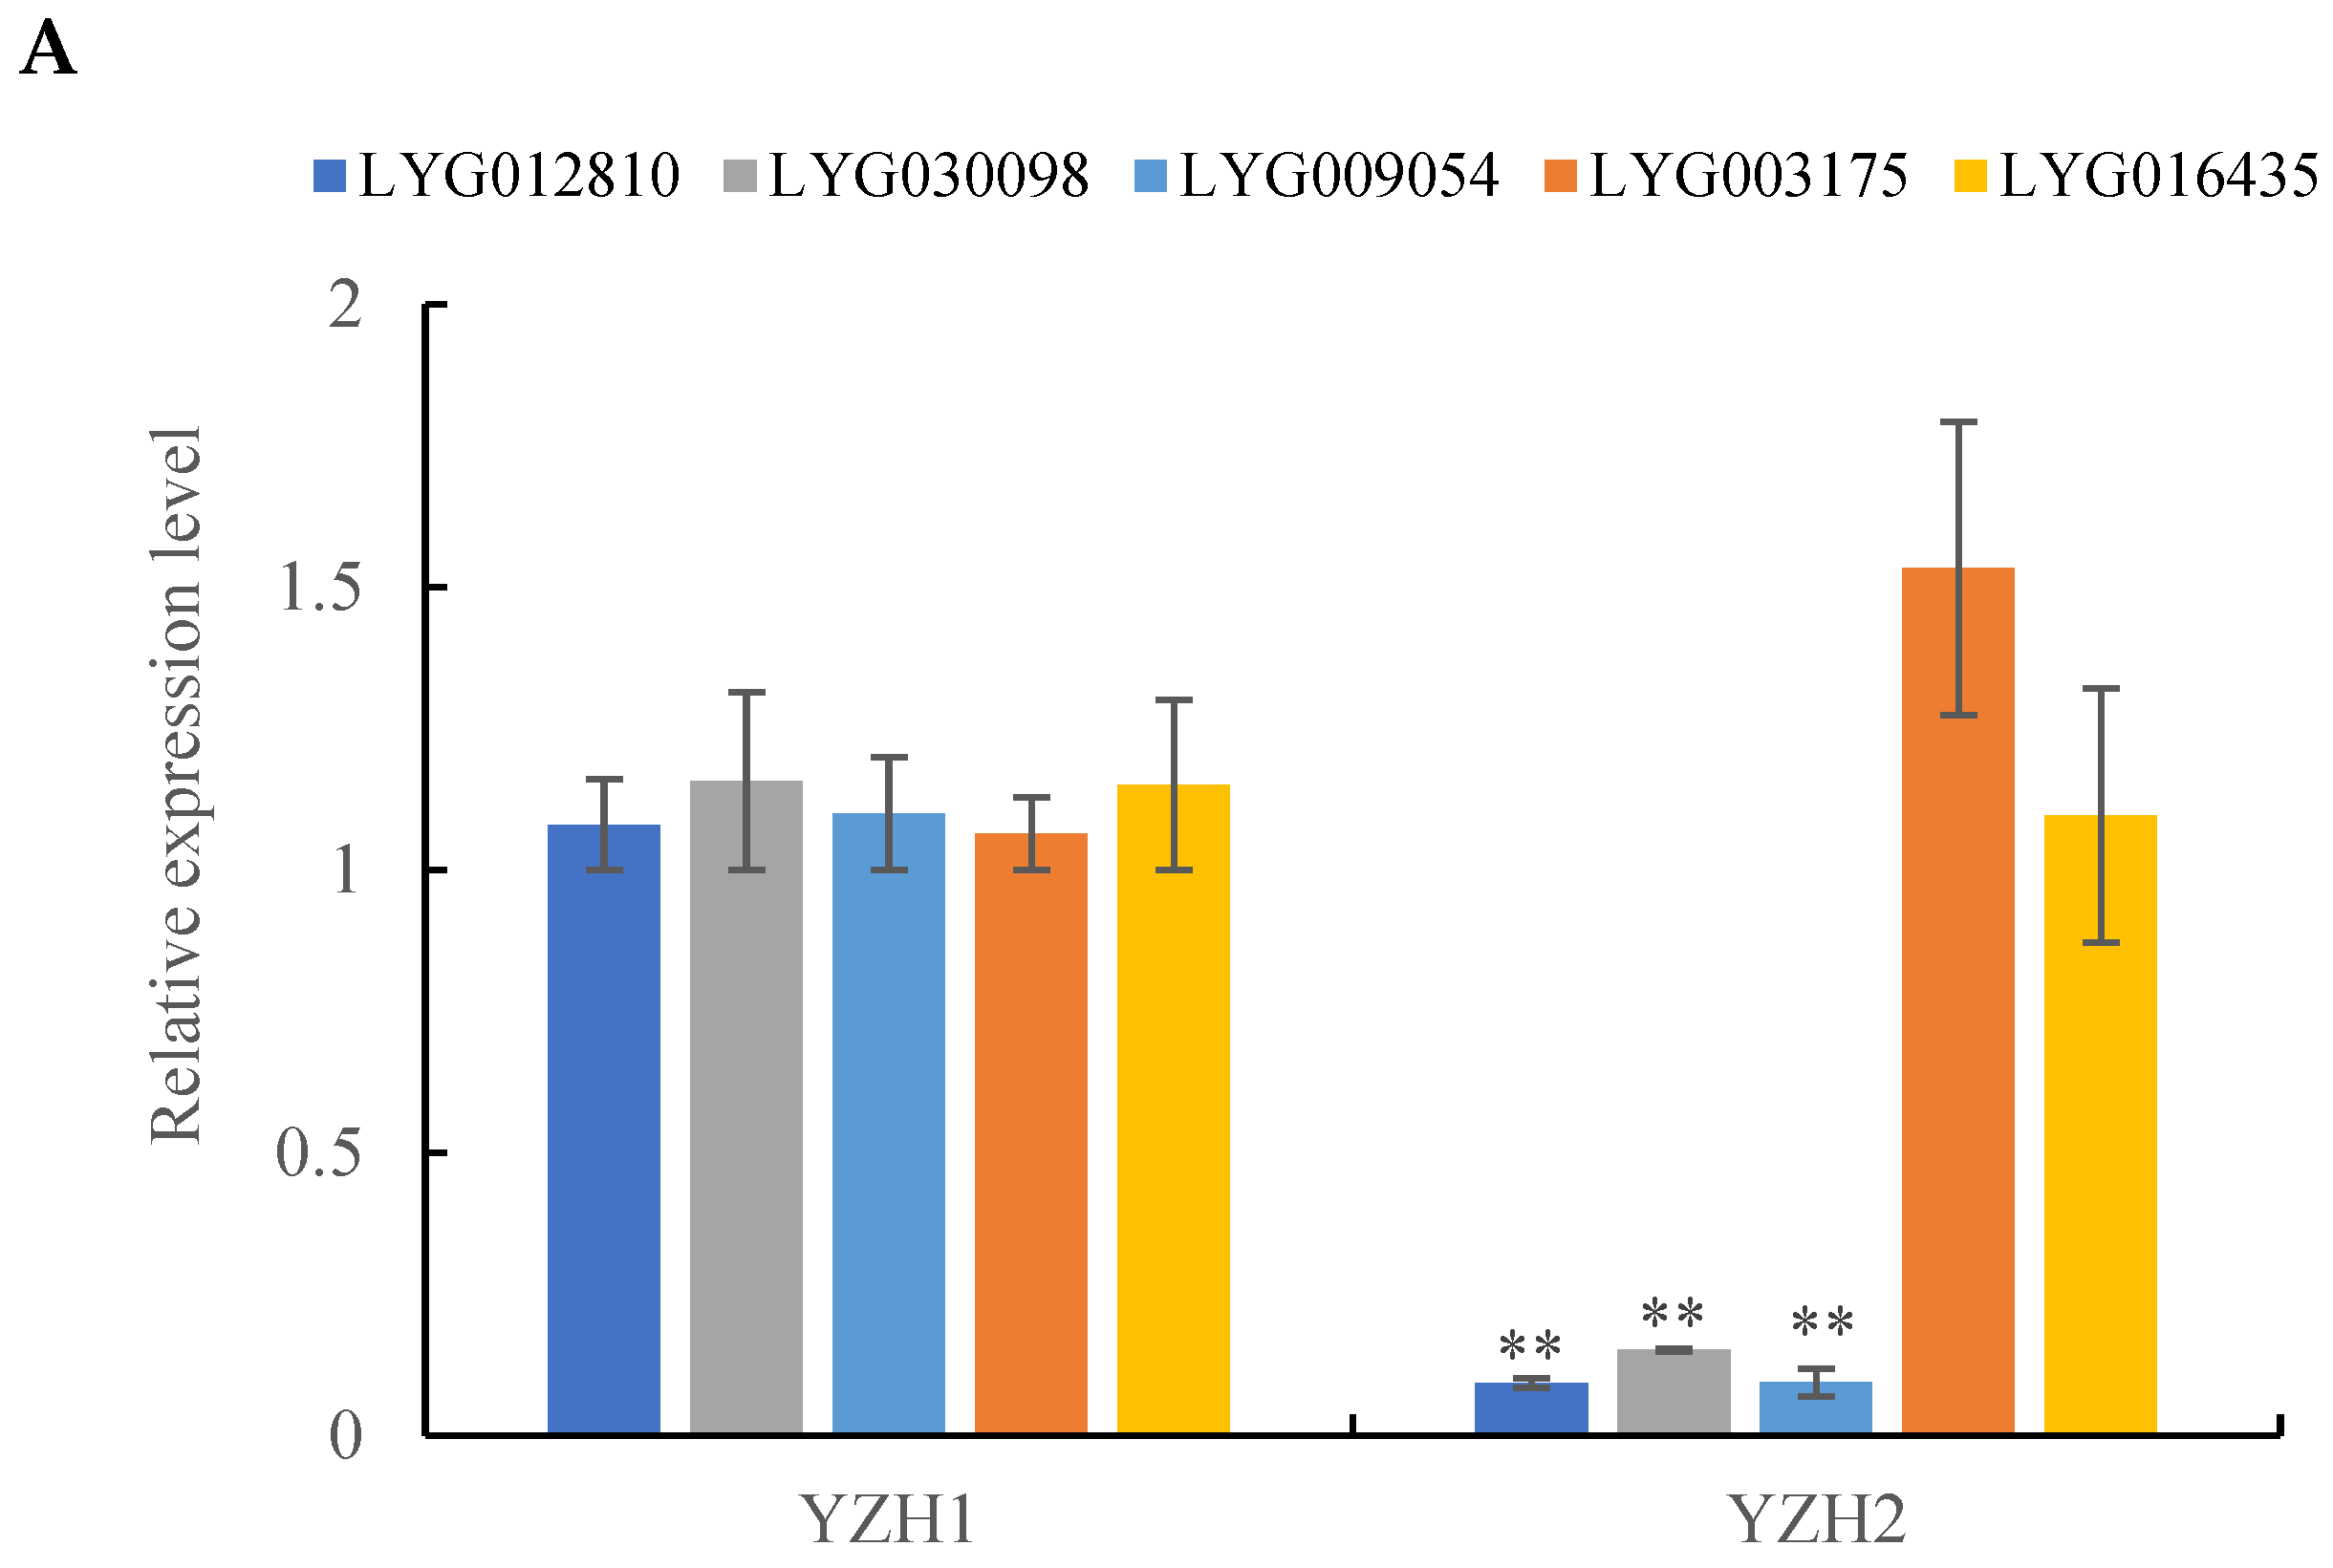
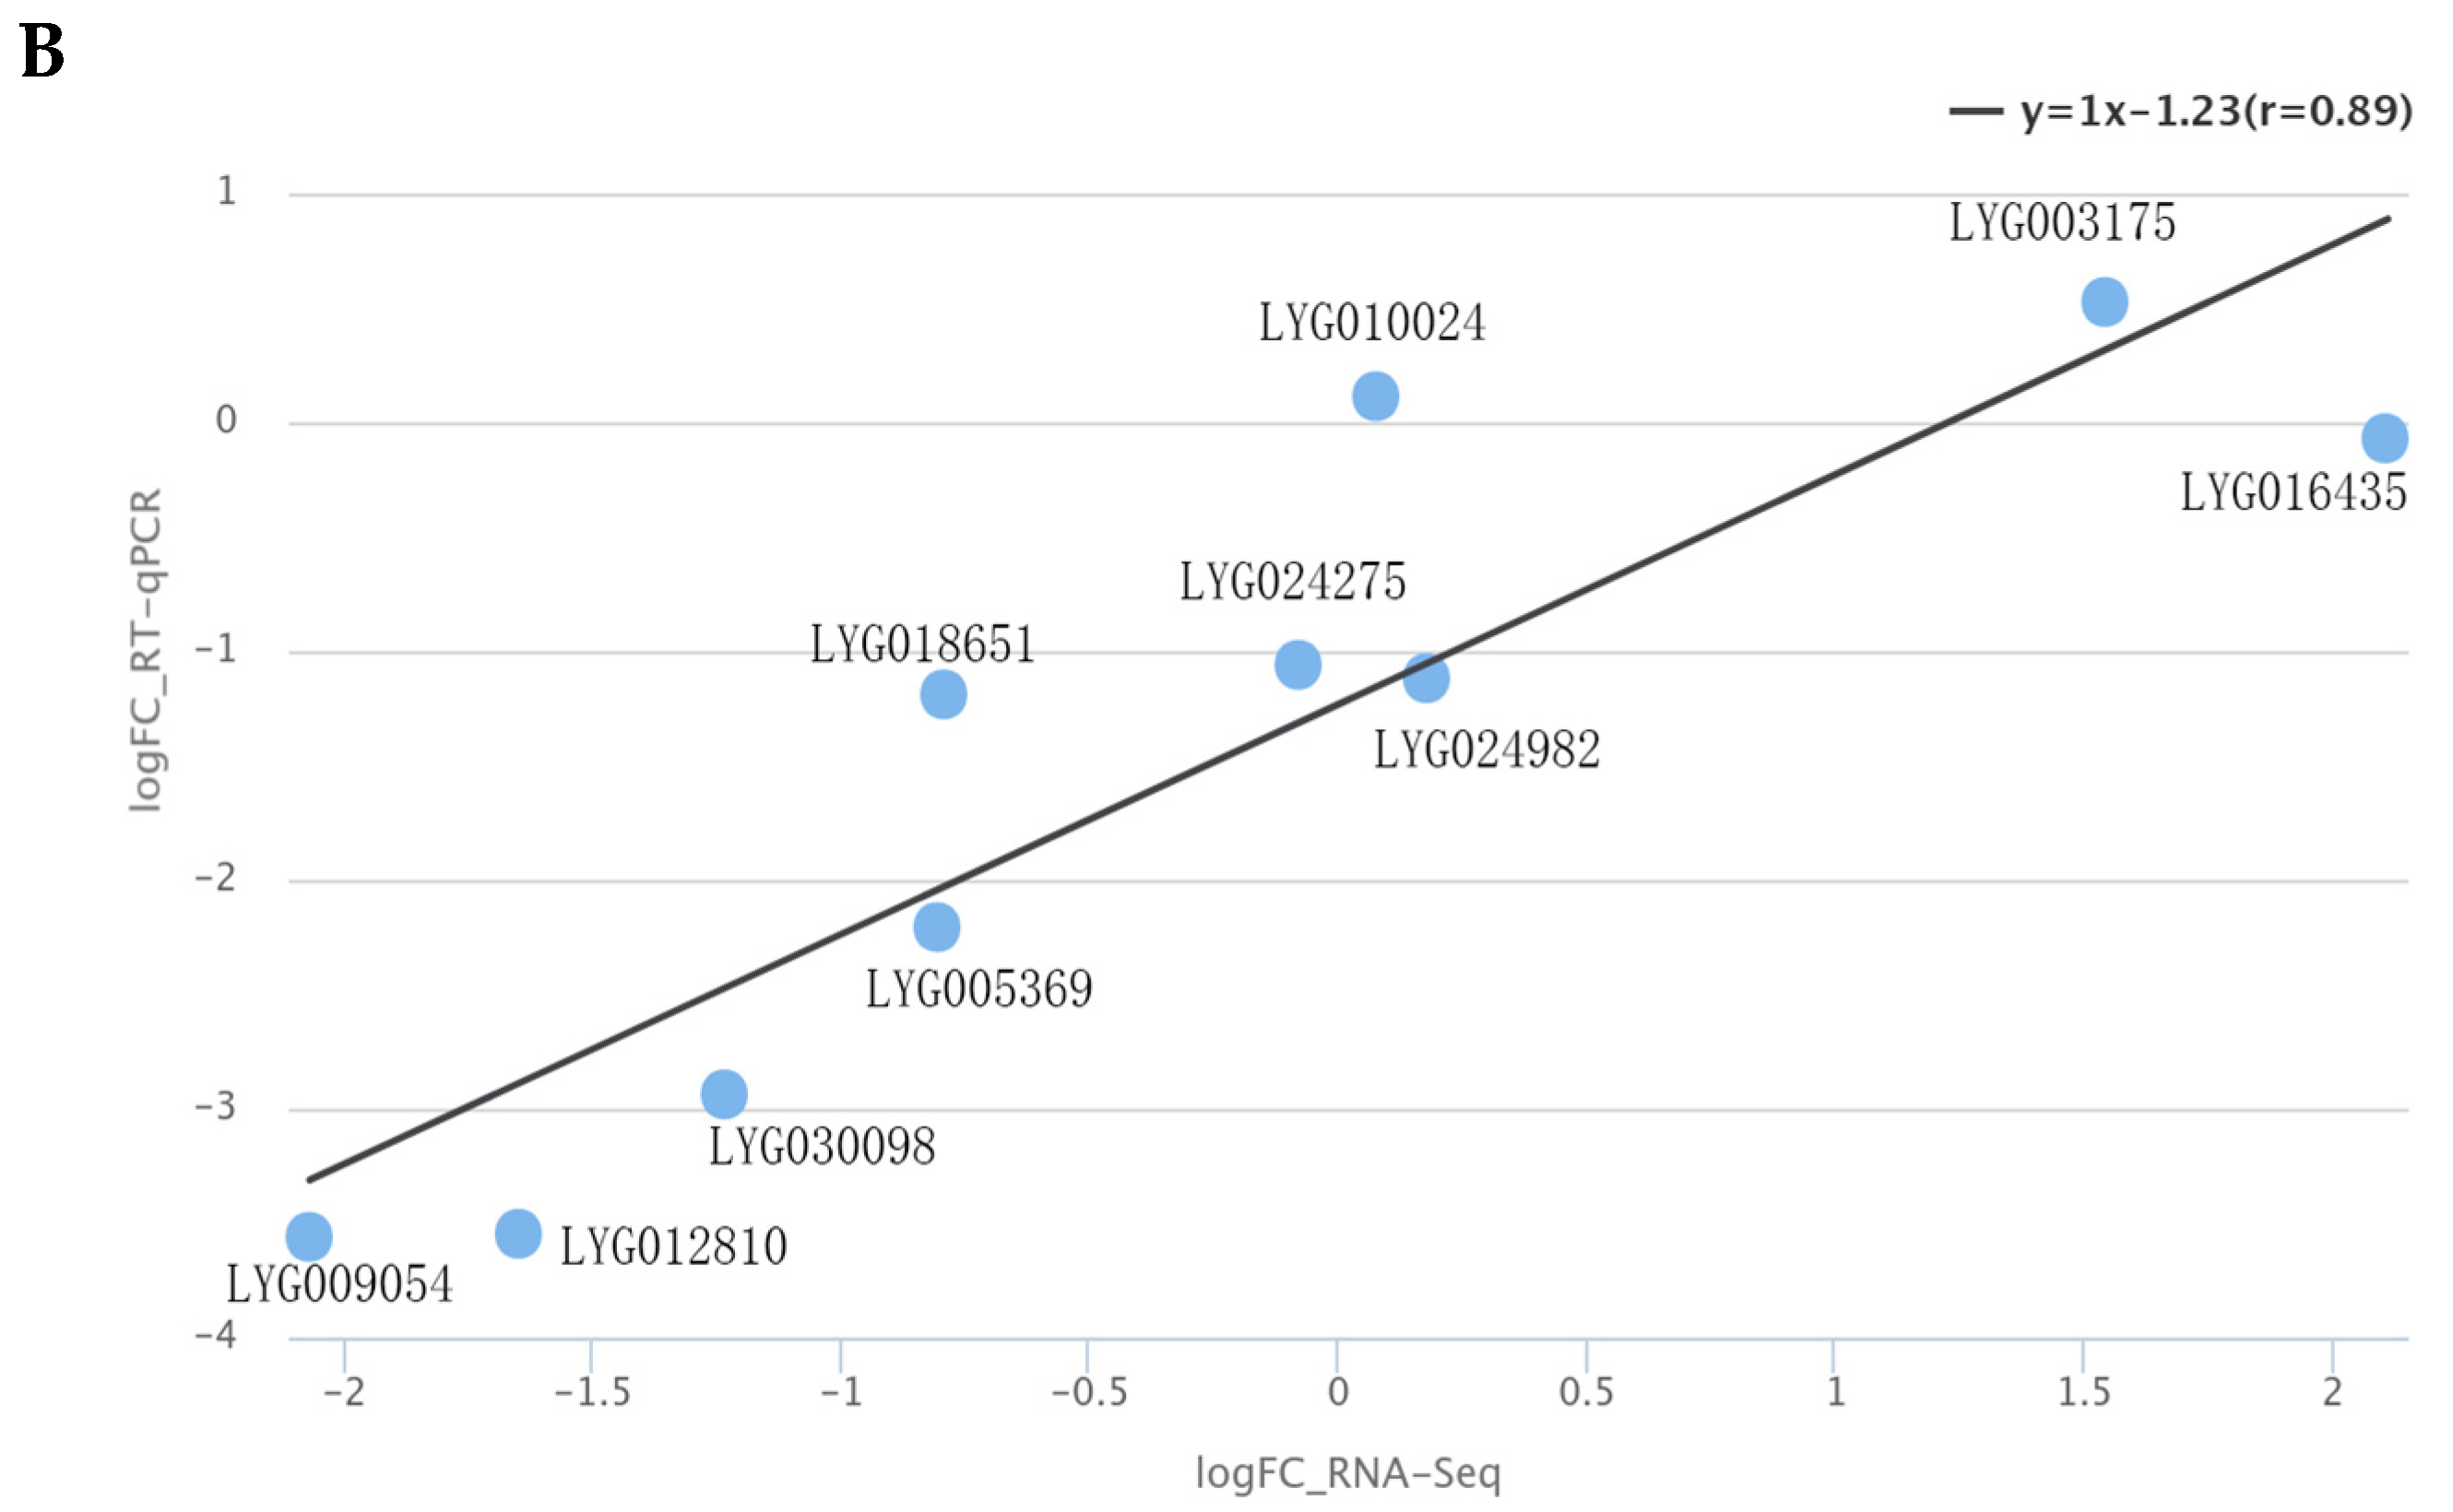
3.4. RT-qPCR Validation of Carotenoid Metabolism Pathway Genes

To ensure the accuracy of transcriptome data, RT-qPCR was conducted on five differentially expressed genes (DEGs) involved in carotenoid metabolism pathways. These genes included LYG030098 (PSY), LYG016435 (NCED5), LYG003175 (NCED3), LYG012810 (VDE), and LYG009054 (LYCE) (Figure 8A). The expression levels of LYG030098, LYG09054, and LYG012810 were notably higher during the initial flowering stage compared to the peak flowering stage. No significant difference was observed in the expression level of LYG003175 and LYG016435 between the two stages. ‘Yanzhi Hong’ and other common O. fragrans cultivars displayed variations in carotenoid composition, leading to increased lycopene accumulation and decreased α-carotene accumulation in petals. Consequently, two LYCB genes (LYG018651 and LYG024982), two CHYB genes (LYG024275 and LYG010024), and one CHYE gene (LYG005369) were also analyzed using RT-qPCR. A strong correlation with an R2 value of 0.89 was observed between the RT-qPCR and FPKM data (Figure 8B), indicating a high level of reliability in the expression profiles of the 10 genes.
Previous studies emphasized the abundance of α-carotene and β-carotene in various cultivars, particularly in the Luteus and Aurantiacus groups of O. fragrans [11,16]. So, this research focused on comparing the gene expression levels of LYG009054 (LYCE), LYG005369 (CHYE), LYG018651 (LYCB), LYG024982 (LYCB), LYG024275 (CHYB), and LYG010024 (CHYB) in the petals of ‘Yanzhi Hong’, ‘Liuye Jingui’, and ‘Gecheng Dangui’ at the initial and peak flowering stages (Figure 9). The results revealed that LYG009054 (LYCE) expression was significantly lower in ‘Yanzhi Hong’ at both flowering stages compared to the other cultivars, showing higher expression during the initial flowering stage across all three. LYG018651 (LYCB) expression was highest in ‘Gecheng Dangui’, followed by ‘Liuye Jingui’, and lowest in ‘Yanzhi Hong’, with higher levels at the peak flowering stage in all three. LYG005369 (CHYE) expression was higher in ‘Liuye Jingui’ compared to ‘Yanzhi Hong’ and ‘Gecheng Dangui’, although there was no significant difference between ‘Yanzhi Hong’ and ‘Gecheng Dangui’ at the initial flowering stage, but higher in ‘Gecheng Dangui’ at the peak flowering stage. LYG024982 (LYCB) expression showed minimal differences among the three cultivars at the peak flowering stage. LYG010024 (CHYB) expression in ‘Liuye Jingui’ and ‘Gecheng Dangui’ was higher than in ‘Yanzhi Hong’, with no substantial difference among the three during this period. LYG024257 (CHYB) gene expression was significantly higher in ‘Yanzhi Hong’ and ‘Liuye Jingui’ compared to ‘Gecheng Dangui’, although the difference between ‘Yanzhi Hong’ and ‘Liuye Jingui’ at the peak flowering stage was not significant. The decline in expression levels of LYG009054 and LYG018651 could potentially impact the increased lycopene accumulation and decreased α-carotene content in the petals of ‘Yanzhi Hong’.

4. Discussion

This study conducted a comprehensive analysis of carotenoid components in the petals of ‘Yanzhi Hong’ during initial and peak flowering stages using targeted metabolomics. A total of 27 carotenoid components were identified, including 5 carotenes, 8 xanthophylls, and 14 xanthophyll esters. Particularly noteworthy was the detection of xanthophyll esters, resulting from the fusion of xanthophylls and fatty acids, in O. fragrans cultivars for the first time, with zeaxanthin esters being the most prevalent among them. While the carotenoid components remained consistent between the initial and peak flowering stages, there was a significant difference in their content. Notably, the content of five carotene components exhibited a substantial increase at the peak flowering stage compared to the initial flowering stage. Carotenes constituted the majority of the carotenoids, representing 78.82% in the initial flowering stage and 91.19% in the peak flowering stage, highlighting their crucial role in influencing the color of O. fragrans flowers as previously reported [10,11,16,17]. Conversely, most xanthophylls and xanthophyll esters either decreased or remained stable during the peak flowering period. Given that the petals of ‘Yanzhi Hong’ transition to rouge-red at the peak flowering stage, the results suggest that the increase in carotene content is the primary factor contributing to the floral color change at this stage.
Lycopene is the most abundant component in the petals of ‘Yanzhi Hong’ at the initial flowering stage, followed by β-carotene and γ-carotene. However, at the peak flowering stage, β-carotene becomes the most abundant, followed by lycopene and γ-carotene. This indicates that β-carotene, lycopene, and γ-carotene are the top three components in the petals at both stages. Previous studies [10,11,16,17] have not highlighted the presence of lycopene in O. fragrans cultivars, making ‘Yanzhi Hong’ the first cultivar identified to be rich in lycopene, a red pigment commonly found in mature red tomato fruits. Previous research indicates that β-carotene and α-carotene, orange-yellow pigments, play a significant role in influencing flower color in O. fragrans cultivars [11]. However, ‘Yanzhi Hong’ exhibits relatively low levels of α-carotene in its petals, at 1.62% and 1.60% during the initial and full flowering stages, respectively. This suggests that the red hue of ‘Yanzhi Hong’ is likely due to its lower α-carotene content and higher lycopene accumulation in the petals. Despite the presence of abundant orange-yellow β-carotene in the petals, the combination of β-carotene and lycopene results in the appearance of a rouge-red color.
The cyclization of lycopene, catalyzed by lycopene cyclase, is a crucial step in the carotenoid biosynthesis pathway [18,19]. This process results in the formation of β-carotene from two β rings, and α-carotene from one α ring and one β ring. Further conversion of β-carotene and α-carotene leads to the production of zeaxanthin and lutein through the action of carotenoid hydroxylase. In the petals of ‘Yanzhi Hong’, there is a significant accumulation of lycopene and β-carotene, while the levels of α-carotene, which contains the α ring, are relatively low. This suggests a possible blockage in the synthesis of the α-carotene branch. Transcriptome analysis revealed the presence of one LYCE, one CHYE, two LYCB, and two CHYB genes. A comparison of gene expression levels in the petals of ‘Yanzhi Hong’, ‘Liuye Jingu’, and ‘Gecheng Dangui’ at different flowering stages indicated that the reduced expression of the LYCE gene (LYG009054) and LYCB gene (LYG018651) in ‘Yanzhi Hong’ might be responsible for the accumulation of lycopene and the low content of α-carotene. Functional validation studies on the LYCE and LYCB genes of O. fragrans showed that LYCE can convert lycopene into ε-carotene with two α rings, while LYCB can convert lycopene into β-carotene with two β rings [20]. The lower transcription levels of LYCE and LYCB in the petals of ‘Yanzhi Hong’ compared to other O. fragrans cultivars contribute to its unique flower color phenotype. However, further investigation is needed to understand the mechanism behind the decreased transcription levels of these genes.
The diverse pigment components in plants are crucial for creating a variety of flower colors. Carotenoids play a significant role in both color formation and the development of the characteristic aroma in O. fragrans [11,21]. In common cultivars ranging from light yellow to orange, the levels of α-carotene and β-carotene determine the intensity of the flower color. However, due to minimal variation in the main pigment components, the color appears uniform. Since O. fragrans germplasm resources have limited anthocyanins, diversifying carotenoid types is suggested as a breeding method to enhance flower color. Nevertheless, as O. fragrans is well-known for its distinct aroma, α-carotene and β-carotene act as direct precursors for key aroma components such as α-ionone and β-ionone [22,23]. Modifying the carotenoid composition could potentially decrease the production of these important aroma compounds, resulting in a loss of fragrance. In a study conducted by Chai et al., an analysis of aroma components in ‘Yanzhi Hong’ at different developmental stages revealed a deficiency in essential aroma compounds like linalool, linalool oxides, α-ionone, β-ionone, and dihydro-β-ionone [14,24,25,26]. Consequently, the petals of ‘Yanzhi Hong’ lack the typical aroma associated with O. fragrans. To create new O. fragrans cultivars with vivid flower colors and characteristic scents, investigating the key factors that hinder anthocyanin synthesis is a crucial area for future research.

Supplementary Materials

The following supporting information can be downloaded at: https://www.mdpi.com/article/10.3390/horticulturae10080801/s1, Figure S1: RT-qPCR primers; Table S1: RT-qPCR primers; Table S2: Annotated results of DEGs related to carotenoid and flavonoid metabolism; Table S3: Gene information of carotenoid metabolism pathway.

Author Contributions

Conceptualization, X.Z.; methodology, S.W., J.W. and P.Y.; software, J.Y.; validation, X.C.; formal analysis, Q.H.; investigation, J.Z.; resources, H.C.; data curation, Y.T.; writing—original draft, S.W.; writing—review and editing, X.Z.; visualization, P.Y.; supervision, J.W.; project administration, J.Z. and H.C.; funding acquisition, X.Z., X.C. and J.Y. All authors have read and agreed to the published version of the manuscript.

Funding

This research was funded by the National Natural Science Foundation of China (32101581) and Hubei Province Natural Science Foundation (2023AFB1063 and 2024AFB1057).

Data Availability Statement

Data are contained within the article and Supplementary Materials.

Acknowledgments

The authors express their sincere gratitude to Baichun Shen from Department of Forestry of Zhejiang Province, China, for his invaluable assistance in sampling the Osmanthus fragrans ‘Yanzhi Hong’.

Conflicts of Interest

The authors declare no conflicts of interest.

References

  1. Liu, Y. Cultivar classification of Osmanthus fragrans Lour. and the development of germplasm resources of Osmanthus Lour. J. Plant Resour. Environ. 1993, 2, 44–48. [Google Scholar]
  2. Xiang, Q.; Liu, Y. An Illustrated Monograph of the Sweet Osmanthus Cultivars in China. Chin. Landsc. Archit. 2008, 9, 96. [Google Scholar]
  3. Yang, K. Chinese Osmanthus; China Forestry Publishing House: Beijing, China, 2020. [Google Scholar]
  4. Tanaka, Y.; Sasaki, N.; Ohmiya, A. Biosynthesis of plant pigments: Anthocyanins, betalains and carotenoids. Plant J. 2008, 54, 733–749. [Google Scholar] [CrossRef] [PubMed]
  5. Zhang, H.; Yuan, X.; Gao, J.; Wang, X.; Wang, H.; Li, Y.; Wang, L.; Fu, Z.; Li, B. Mechanism of Flower Petal Coloration and Molecular Breeding. Biotechnol. Bull. 2023, 39, 23–31. [Google Scholar]
  6. Song, X.; Tian, Y.; Gao, K.; Li, J.; Li, Y.; Wang, J.; Deng, C.; Zhang, F.; Kong, D.; Fan, G.; et al. Genetic and QTL analysis of flower color and pigments in small-flowered chrysanthemum based on high-density genetic map. Ornam. Plant Res. 2023, 3, 17. [Google Scholar] [CrossRef]
  7. Wen, J.; Wang, C.; Feng, H.; Li, S.; Wang, L.; Wu, R.; Zhao, S. Research Progress on Flower Color of Rose. Acta Hortic. Sinica 2021, 48, 2044–2056. [Google Scholar]
  8. Cai, X.; Su, F.; Jin, H.; Yao, C.; Wang, C. Components and extraction methods for petal pigments of Osmanthus fragrans ‘Siji Gui’. J. Zhejiang For. Coll. 2010, 27, 559–564. [Google Scholar]
  9. Zou, J.; Zeng, X.; Chen, H.; Cai, X.; Wang, C. Analysis on characteristic color compounds in different varieties of Osmanthus fragrans Lour. during flowering and senescence. J. South. Agric. 2017, 48, 1683–1690. [Google Scholar]
  10. Wang, Y.; Luo, Y.; Zhang, C.; Fu, J.; Hu, S.; Zhao, H. Flower Color and Pigment Composition in the Petals of Bud Mutation and its Stock Plant of Osmanthus fragrans‘Jingui’. Acta Hortic. Sinica 2017, 44, 528–536. [Google Scholar]
  11. Wang, Y.; Zhang, C.; Dong, B.; Fu, J.; Hu, S.; Zhao, H. Carotenoid Accumulation and Its Contribution to Flower Coloration of Osmanthus fragrans. Front. Plant Sci. 2018, 9, 1499. [Google Scholar] [CrossRef]
  12. Gu, H.; Yang, X.; Wang, L. Progress in Molecular Biological Studies of Osmanthus fragrans. J. Trop. Subtrop. Bot. 2024, in press. [Google Scholar]
  13. Xiang, Q.; Wang, X.; Liu, Y. Annual Report ICRCO 2014(2) Three new cultivars of Osmanthus fragrans. J. Nanjing For. Univ. 2014, 38, 2+181. [Google Scholar]
  14. Chai, Z.; Zhang, M.; Li, L.; Zhang, C.; Duan, Y. Non-Targeted Metabolomics Analysis of the Petals of Osmanthus fragrans ‘Yanzhi Hong’ in Different Developmental Phases. J. Northwest For. Univ. 2022, 37, 107–113. [Google Scholar]
  15. Chen, H.; Zeng, X.; Yang, J.; Cai, X.; Shi, Y.; Zheng, R.; Wang, Z.; Liu, J.; Yi, X.; Xiao, S.; et al. Whole-genome resequencing of Osmanthus fragrans provides insights into flower color evolution. Hortic. Res. 2021, 8, 98. [Google Scholar] [CrossRef]
  16. Zeng, X. Research of TPS and CCD Function Analysis and Their Influence on Petal Color and Scent in Osmanthus fragrans Lour. Ph.D. Dissertation, Huazhong Agricultural University, Wuhan, China, 2020. [Google Scholar]
  17. Wang, Y.; Zhang, C.; Xu, B.; Fu, J.; Du, Y.; Fang, Q.; Dong, B.; Zhao, H. Temperature regulation of carotenoid accumulation in the petals of sweet osmanthus via modulating expression of carotenoid biosynthesis and degradation genes. BMC Genom. 2022, 23, 418. [Google Scholar] [CrossRef] [PubMed]
  18. Lu, C.; Gao, Y.; Huang, H.; Dai, S. Carotenoid Metabolism and Regulation in Plants. Acta Hortic. Sinica 2022, 49, 2559–2578. [Google Scholar]
  19. He, J.; Fan, Y. Progress in Composition and Metabolic Regulation of Carotenoids Related to Floral Color. Acta Hortic. Sinica 2022, 49, 1162–1172. [Google Scholar]
  20. Qing, H.; Chen, J.; Jiang, L.; Qian, J.; Fu, J.; Zhang, C. Functional Characterization of Two Lycopene Cyclases from Sweet Osmanthus (Osmanthus fragrans). Sci. Hortic. 2022, 299, 111062. [Google Scholar] [CrossRef]
  21. Cai, X.; Mai, R.; Zou, J.; Zhang, H.; Zeng, X.; Zheng, R.; Wang, C. Analysis of aroma-active compounds in three sweet osmanthus (Osmanthus fragrans) cultivars by GC-olfactometry and GC-MS. J. Zhejiang Univ.-Sci. B 2014, 15, 638–648. [Google Scholar] [CrossRef]
  22. Huang, F.C.; Molnár, P.; Schwab, W. Cloning and functional characterization of carotenoid cleavage dioxygenase 4 genes. J. Exp. Bot. 2009, 60, 3011–3022. [Google Scholar] [CrossRef]
  23. Baldermann, S.; Kato, M.; Kurosawa, M.; Kurobayashi, Y.; Fujita, A.; Fleischmann, P.; Watanabe, N. Functional characterization of a carotenoid cleavage dioxygenase 1 and its relation to the carotenoid accumulation and volatile emission during the floral development of Osmanthus fragrans Lour. J. Exp. Bot. 2010, 61, 2967–2977. [Google Scholar] [CrossRef] [PubMed]
  24. Xin, H.; Wu, B.; Zhang, H.; Wang, C.; Li, J.; Yang, B.; Li, S. Characterization of volatile compounds in flowers from four groups of sweet osmanthus (Osmanthus fragrans) cultivars. Can. J. Plant Sci. 2013, 93, 923–931. [Google Scholar] [CrossRef]
  25. Zou, J.; Cai, X.; Zeng, X.; Zheng, R.; Wang, C. Changes of Aroma-active Compounds in Different Cultivars of Osmanthus fragrans during Flowering. Acta Hortic. Sin. 2017, 44, 1517–1534. [Google Scholar]
  26. Xia, K.; Jiang, B.; Zhao, Z.; Fan, J.; Wen, G.; Li, F.; Gao, L.; Jiang, Q.; Qiu, S. Comparative analysis of aromatic components from different cultivars of Osmanthus fragrans in Guilin. Guihaia 2018, 38, 1493–1504. [Google Scholar]
Figure 1. Comparison of petal colors between ‘Yanzhi Hong’ and Albus, Luteus, and Aurantiacus cultivars. (A) The initial flowering stage of ‘Yanzhi Hong’ (YZH1); (B) The peak flowering stage of ‘Yanzhi Hong’ (YZH2); (C) The comparison of different cultivars, from left to right, is Albus cultivar, Luteus cultivar, ‘Yanzhi Hong’ cultivar and Aurantiacus cultivar.
Horticulturae 10 00801 g001
Figure 2. Proportion of carotenoid components in petals of ‘Yanzhi Hong’ at the initial and peak flowering stages.
Horticulturae 10 00801 g002
Figure 3. Carotenoid metabolite clustering heat map at the initial and peak flowering stages in ‘Yanzhi Hong’ petals. Color scales in heatmap represent log2(YZH2/YZH1) values.
Horticulturae 10 00801 g003
Figure 4. Volcano map of differential expression genes at the peak vs. initial flowering stage of O. fragrans ‘Yanzhi Hong’.
Horticulturae 10 00801 g004
Figure 5. Bar chart of DEGs GO enrichment in O. fragrans ‘Yanzhi Hong’ at the peak vs. initial flowering stage.
Horticulturae 10 00801 g005
Figure 6. KEGG enrichment bar chart of DEGs in O. fragrans ‘Yanzhi Hong’ at the peak vs. initial flowering stage.
Horticulturae 10 00801 g006
Figure 7. Cluster heatmap of co-expression correlation between carotenoid metabolic and metabolism pathway genes at the initial and peak flowering stages in ‘Yanzhi Hong’ petals. The correlation analysis was conducted using Pearson’s correlation method (* p ≤ 0.05, ** p ≤ 0.01, *** p ≤ 0.001).
Horticulturae 10 00801 g007
Figure 8. RT-qPCR analysis of carotenoid metabolism pathway genes in the initial and peak flowering stages of ‘Yanzhi Hong’. (A) The expression levels of DEGs. Asterisks indicate the significant difference between the initial and peak flowering stages revealed by t-test: ** p < 0.01. (B) A linear fitting analysis was performed on the FPKM and RT-qPCR data.
Horticulturae 10 00801 g008aHorticulturae 10 00801 g008b
Figure 9. RT-qPCR analysis of lycopene cyclase and carotene hydroxylase genes in the petals of three O. fragrans cultivars at the initial (S1) and peak flowering (S2) stages. Different letters represent significant differences (p < 0.05) based on Tukey’s test using one-way ANOVA. The blue arrow represents the gene expression change in the ‘YZH’ cultivar. The red arrow represents the metabolite content change in the ‘YZH’ cultivar.
Horticulturae 10 00801 g009
Table 1. Components and contents of carotenoid in petals of ‘Yanzhi Hong’ at initial and peak flowering stages.
NoRTCompound NameYZH1YZH2
Mean
µg/g DW
Mean
µg/g DW
Carotenes
15.00(E/Z)-phytoene3.72 ± 0.07 b15.72 ± 0.42 a
25.92α-carotene1.93 ± 0.15 b3.40 ± 0.21 a
36.28β-carotene33.73 ± 1.33 b95.02 ± 4.37 a
47.38γ-carotene5.31 ± 0.11 b17.35 ± 0.27 a
58.33lycopene48.84 ± 2.59 b63.23 ± 3.31 a
93.53 ± 4.25 b194.72 ± 8.58 a
Xanthophylls
61.58violaxanthin0.12 ± 0.00 a0.09 ± 0.01 b
71.93neoxanthin0.21 ± 0.01 a0.10 ± 0.01 b
84.04lutein3.48 ± 0.20 a2.51 ± 0.05 b
94.518′-apo-β-carotenal0.01 ± 0.00 b0.08 ± 0.01 a
104.63zeaxanthin10.66 ± 0.40 a5.77 ± 0.14 b
115.08α-cryptoxanthin0.41 ± 0.010.42 ± 0.02
125.52β-cryptoxanthin0.80 ± 0.06 b2.96 ± 0.13 a
135.54echinenone0.01 ± 0.00 b0.04 ± 0.00 a
15.71 ± 0.69 a11.97 ± 0.36 b
Xanthophyll esters
146.46lutein oleate0.05 ± 0.000.05 ± 0.00
156.87lutein palmitate0.36 ± 0.030.36 ± 0.03
167.18zeaxanthin palmitate1.09 ± 0.07 a0.73 ± 0.07 b
177.38zeaxanthin dilaurate0.04 ± 0.010.03 ± 0.01
187.48zeaxanthin-laurate-myristate0.03 ± 0.000.02 ± 0.00
197.63zeaxanthin dimyristate0.31 ± 0.01 a0.24 ± 0.00 b
207.96zeaxanthin dipalmitate0.43 ± 0.02 a0.26 ± 0.03 b
217.77zeaxanthin-oleate-palmitate0.20 ± 0.01 a0.14 ± 0.01 b
226.95β-cryptoxanthin laurate0.09 ± 0.020.07 ± 0.01
237.18β-cryptoxanthin myristate0.16 ± 0.00 a0.10 ± 0.01 b
247.32β-cryptoxanthin palmitate3.06 ± 0.09 a2.25 ± 0.08 b
256.54rubixanthin caprate0.05 ± 0.000.04 ± 0.01
266.79rubixanthin laurate0.64 ± 0.03 a0.50 ± 0.01 b
277.33rubixanthin palmitate2.92 ± 0.13 a2.05 ± 0.10 b
9.42 ± 0.43 a6.82 ± 0.35 b
Different letters represent significant differences (p < 0.05) based on Tukey’s multiple-range test using one-way ANOVA.
Table 2. Transcriptome sequencing data statistics in petals of ‘Yanzhi Hong’ at the initial and peak flowering stages.
SampleRawReadsRawBasesCleanReadsCleanBasesCleanRatioQ20Q30GC
YZH1_136,021,7825.4035,777,9265.3099.32%96.86%91.54%42.72%
YZH1_250,681,3027.6050,373,0467.4899.39%97.19%92.17%42.80%
YZH1_342,561,2246.3842,258,7286.2899.29%96.95%91.75%42.77%
YZH2_143,146,8766.4742,876,0126.3699.37%97.24%92.34%42.53%
YZH2_246,010,6346.9045,692,5366.7799.31%96.99%91.81%42.53%
YZH2_352,623,9107.8952,210,7547.7599.21%96.84%91.53%42.48%
Disclaimer/Publisher’s Note: The statements, opinions and data contained in all publications are solely those of the individual author(s) and contributor(s) and not of MDPI and/or the editor(s). MDPI and/or the editor(s) disclaim responsibility for any injury to people or property resulting from any ideas, methods, instructions or products referred to in the content.

