Article

Changes in Spectral Reflectance, Photosynthetic Performance, Chlorophyll Fluorescence, and Growth of Mini Green Romaine Lettuce According to Various Light Qualities in Indoor Cultivation

1
Interdisciplinary Program in Smart Agriculture, Kangwon National University, Chuncheon 24341, Republic of Korea
2
Agricultural and Life Science Research Institute, Kangwon National University, Chuncheon 24341, Republic of Korea
3
Waksman Institute of Microbiology, Rutgers, The State University of New Jersey, Piscataway, NJ 08854, USA
4
FutureGreen Co., Ltd., Yongin 17095, Republic of Korea
5
Cheorwon Plasma Research Institute, Cheorwon 24062, Republic of Korea
*
Author to whom correspondence should be addressed.
Horticulturae 2024, 10(8), 860; https://doi.org/10.3390/horticulturae10080860
Submission received: 20 July 2024 / Revised: 7 August 2024 / Accepted: 9 August 2024 / Published: 14 August 2024
(This article belongs to the Special Issue Use and Management of Artificial Light in Horticultural Plants)

Abstract

:
Light quality can be stated to be the identity of an artificial light source, and although the response of light quality may vary depending on the crop, the effect is clearly visible and can produce various results depending on the combination of an artificial light source. This study investigated the spectral reflectance, photosynthetic performance, and chlorophyll fluorescence of mini green romaine lettuce based on light quality. Most parameters related to spectral reflectance showed the best results under blue light, and photosynthetic performance was more effective with mixed light than with single-colored light, among which blue + red (BR)-LED was the most suitable. Red light was ineffective, showing mostly low results in parameters of spectral reflectance and photosynthetic performance. In the case of chlorophyll fluorescence, the light quality influenced photomorphogenesis, resulting in increased leaf length and width with R- and quantum dot (QD)-LED, which expanded the leaf area and allowed for more external light to be captured (ABS/RC and TRo/RC). However, the ratio of electronized energy (ETo/RC) was low, and the amount of energy dissipated as heat (DIo/RC) was high. Consequently, the degree of electron acceptor reduction and overall photosynthetic performance (PIABS and PItotal) were lower compared to other light qualities. Additionally, the contrasting results of QD-LED and BR-LED were attributed to the form of red light and the presence or absence of far-red light when comparing spectra. Principal component analysis also clearly distinguished light qualities for photosynthesis and growth. Growth was increased by red (R)- and QD-LED, while photosynthetic performance was increased by BR- and blue (B)-LED.

1. Introduction

Light is very important for plant growth and is a key element that forms the basis of photosynthesis; it also acts as a regulator of physiological processes, but it can sometimes cause damage to plants [1]. This light can affect plants differently depending on changes in intensity, cycle, spectrum, and illuminance [2,3,4].
Among these factors, light quality can elicit different responses in plants depending on the spectral range. Additionally, compared to other light-related parameters, various combinations of spectra can produce more diverse outcomes and can significantly impact photosynthesis, which is crucial for plants’ growth and development processes [5]. Blue light was found to reduce plant size but increase chloroplast abundance, while red light increased shoot biomass, hypocotyl and cotyledon elongation, and leaf area. However, it was also noted that a deficiency of specific wavelengths, such as under monochromatic blue or red light, can severely impair plant development in terms of morphology and physiology [6,7]. Furthermore, previous studies have shown that when comparing white light enhanced with red light to white light enhanced with blue light, lettuce exhibited opposite trends in chlorophyll content measured based on productivity, electron flow, dark respiration, and reflectance index [1]. Recently, not only combinations of light quality but also artificial light sources with enhanced technological capabilities have been developed for crop cultivation. One such development is the QD-LED, which utilizes quantum dot (QD) technology. This technology involves reducing semiconductors to nanometer sizes, and altering their optical and electrical properties [8]. These QD-LEDs exhibit the Emerson enhancement effect, whereby they can achieve higher photosynthetic efficiency compared to the sum of the individual photosynthetic rates obtained when red light and far-red light are investigated independently. Furthermore, compared to traditional LEDs, QD-LEDs have the advantage of a wider light distribution angle, which enhances the uniformity of light across the cultivation area per unit area [9]. According to previous studies, when QD-LEDs were applied to illuminating cherry tomato plants, they accelerated the progression of fruit ripening. Additionally, the fruits showed larger sizes, greater numbers, and higher weights compared to those under white LEDs and untreated control groups. Moreover, QD-LEDs minimized deformities and incidence rates in cherry tomatoes; they were also noted to consume relatively less power and were cost-effective compared to white LEDs, resulting in significantly higher energy efficiency [10].
These various combinations of light quality are typically achieved through LED (light-emitting diode) technology. LEDs, which have been continuously researched and developed among existing artificial light sources, are particularly known to be suitable for indoor agriculture. Accordingly, there have also been attempts to mimic natural light tailored to higher plants optimized for natural light conditions [4,11]. Furthermore, the indoor vertical farming industry, where artificial lighting systems such as LEDs are key components, is expected to exceed a total market size of USD 17 billion by 2027 [12]. Consequently, many lighting companies are applying various commercial products in the horticulture sector [13]. Research continues to be conducted to identify optimal light conditions, including specific light qualities that can achieve higher photosynthetic efficiency for different crops [4,14].
In order to find out changes in plants through various light qualities as above, it is often completed through destructive investigation (chemical monitoring method), which generally requires several steps and a lot of time. However, spectral reflectance (380–1300 nm) offers a non-destructive method whereby suitable spectra of light for the plant species and parameters of interest can be quickly assessed. This method allows for the rapid evaluation of plant health indicators such as pigments, nitrogen content, and moisture levels, without the need for multiple stages, making it advantageous [15,16]. Recently, the chlorophyll content in the leaves of maize inoculated with specific fungi has been estimated using spectral reflectance. This was achieved through correlation analysis with primary spectral derivatives and the development and validation of a hyperspectral estimation model [16]. Furthermore, variations in the growth, respiration, photosynthetic responses, and spectral reflectance indices of lettuce have been observed depending on the ratio of blue-to-red intensity. Lettuce grown under different intensity ratios of red and blue light within the light source showed different spectral reflectance indices, with significant variations in these indices observed particularly according to the number of days of cultivation [1]. Additionally, it was suggested that the changes in the reflectance indices of lettuce according to the intensity ratios of red and blue light are also associated with differences found in photosynthetic parameters [1].
Photosynthesis in plants utilizes light as a signal to activate and regulate numerous key processes associated with plant growth, carbon fixation, and energy sources [17]. To maintain and maximize photosynthetic efficiency in plants, light control through artificial lighting (intensity, quality, photoperiod, etc.), has become essential, and research on the relationship between light and photosynthesis continues from the past to recent times [18,19].
When soybean seedlings were grown under BR-LED (B:R = 80:20) lighting, it was reported that the light-saturated CO2 assimilation rate (Asat) and the light-saturated stomatal conductance (gssat) were 64.85% and 203.23% higher, respectively, compared to grown under 100% red light alone, and it was suggested that appropriately combining red and blue light spectra in BR-LED lighting is more conducive to enhancing photosynthetic performance in soybeans than using red or blue light alone [20]. Far-red light, which has been extensively studied primarily for its effects on morphological changes in crops, has been reported to reduce non-photochemical quenching (NPQ) and the dissipation of heat from absorbed light energy, and to increase the proportion of light energy utilized for photosynthesis, thereby enhancing photosynthetic efficiency. Furthermore, high proportions of far-red light contribute to enhancing overall photosynthetic efficiency in plants by influencing their light capture capacity, photophosphorylation activity, and photosynthetic electron transfer rate [21].
Plants must dissipate excess light that exceeds their photosynthetic capacity, in order to avoid damage to the photosynthetic machinery due to overexcitation [22]. Chlorophyll fluorescence can be utilized as a non-destructive and efficient indicator that represents photosynthetic performance and plant activity, measured through parameters reflecting the utilization of light energy in photosynthesis and the dissipation of excess energy as heat or fluorescence [23,24]. Chlorophyll fluorescence can be divided into several stages, with the widely used chlorophyll fluorescence induction kinetics (O-J-I-P) consisting of four phases. These are associated with the redox states of the PSII and PSI photosynthetic systems [25,26]. In O-J-I-P, the “O” stage (origin) refers to the point of fluorescence induction when chlorophyll returns to its original state after a dark period of approximately 15 min to 1 h, and the “J” stage (jump) denotes the first minimal fluorescence variation following the “O” stage. Next, the intermediate fluorescence level is referred to as the “I” stage (intermediate), and finally, the fluorescence induction amount at the maximum fluorescence level is called the “P” stage (peak) [27].
Additionally, the O-J-I-P phases can indicate the efficiency of electron transfer through the chains between systems [25,26]. Gao et al. [28] reported that, during spinach cultivation, adding blue LEDs to white LEDs significantly increased the electron transport rate (ETR) compared to other treatments and promoted the opening of PSII reaction centers. On the other hand, adding red, green, and yellow LEDs actually inhibited the opening of PSII reaction centers, thereby reducing the electron transfer rate. According to the fluorescence of lettuce chlorophyll under different light intensities, it was observed that the development of the photosynthetic system occurred more rapidly at higher light intensities compared to lower light intensities, in terms of the maximum quantum efficiency of PSII and non-photochemical quenching improvements [29]. Additionally, ongoing research is focusing on chlorophyll fluorescence, which varies based on factors like environmental conditions, stress, and nutrient solutions for various crops [30,31,32].
To date, extensive research has been conducted on the growth changes in crops according to various light qualities. Furthermore, research is being conducted on the responses of crops to various internal and external treatments through spectroscopic reflectance, photosynthetic performance, and chlorophyll fluorescence. However, research on different light qualities using these parameters and studies that compare them comprehensively are currently lacking, especially regarding the QD-LEDs used in this study. Therefore, in this study, we conducted an investigation into the spectral reflectance, photosynthetic performance, and chlorophyll fluorescence changes in mini green romaine lettuce under different light spectra.

2. Materials and Methods

2.1. Plant Material and Cultivation Environment

We selected mini green romaine lettuce (Lactuca sativa cv. Minicup, ASIA SEED KOREA), which is suitable for indoor cultivation, where cultivation space may be limited. On day 0, 30 plants were initially planted for each light quality; the number of plants was gradually reduced, and the planting interval was adjusted, until 16 plants remained. The indoor temperature and humidity for lettuce cultivation were maintained at 22 ± 7 °C and 35 ± 8%, respectively, while the CO2 concentration was kept at an average of 550 ± 70 ppm. Additionally, the plants were cultivated for a total of 30 days using a deep-water culture method within a three-tiered shelf structure (Figure 1).

2.2. Nutrient Solution

Mini green romaine lettuce was cultivated using a dedicated nutrient solution for Yamazaki lettuce. The nutrient solution was prepared in two parts, A and B, at a concentration of 200x. When used, parts A and B were diluted at a 1:1 ratio. The formulated nutrient solution A contained 236 mg·L−1 Ca(NO3)2·4H2O, 202 mg·L−1 KNO3, and 24 mg·L−1 EDTA-NaFe(III), while nutrient solution B was composed of 202 mg L−1 KNO3, 57.5 mg L−1 NH4H2PO4, 123 mg L−1 MgSO4·7H2O, 3 mg L−1 H3BO3, 2 mg L−1 MnSO4·5H2O, 0.2 mg L−1 ZnSO4·7H2O, 0.05 mg·L−1 CuSO4·5H2O, and 0.02 mg·L−1 Na2MoO4·2H2O. The EC of the nutrient solution was set at 0.3 dS·cm−1 at the beginning of cultivation and 1.5 dS·cm−1 at the end date, while the pH was maintained at 6.5 ± 0.5 (Figure 1).

2.3. Light Qualities and Conditions within the Cultivation Environment

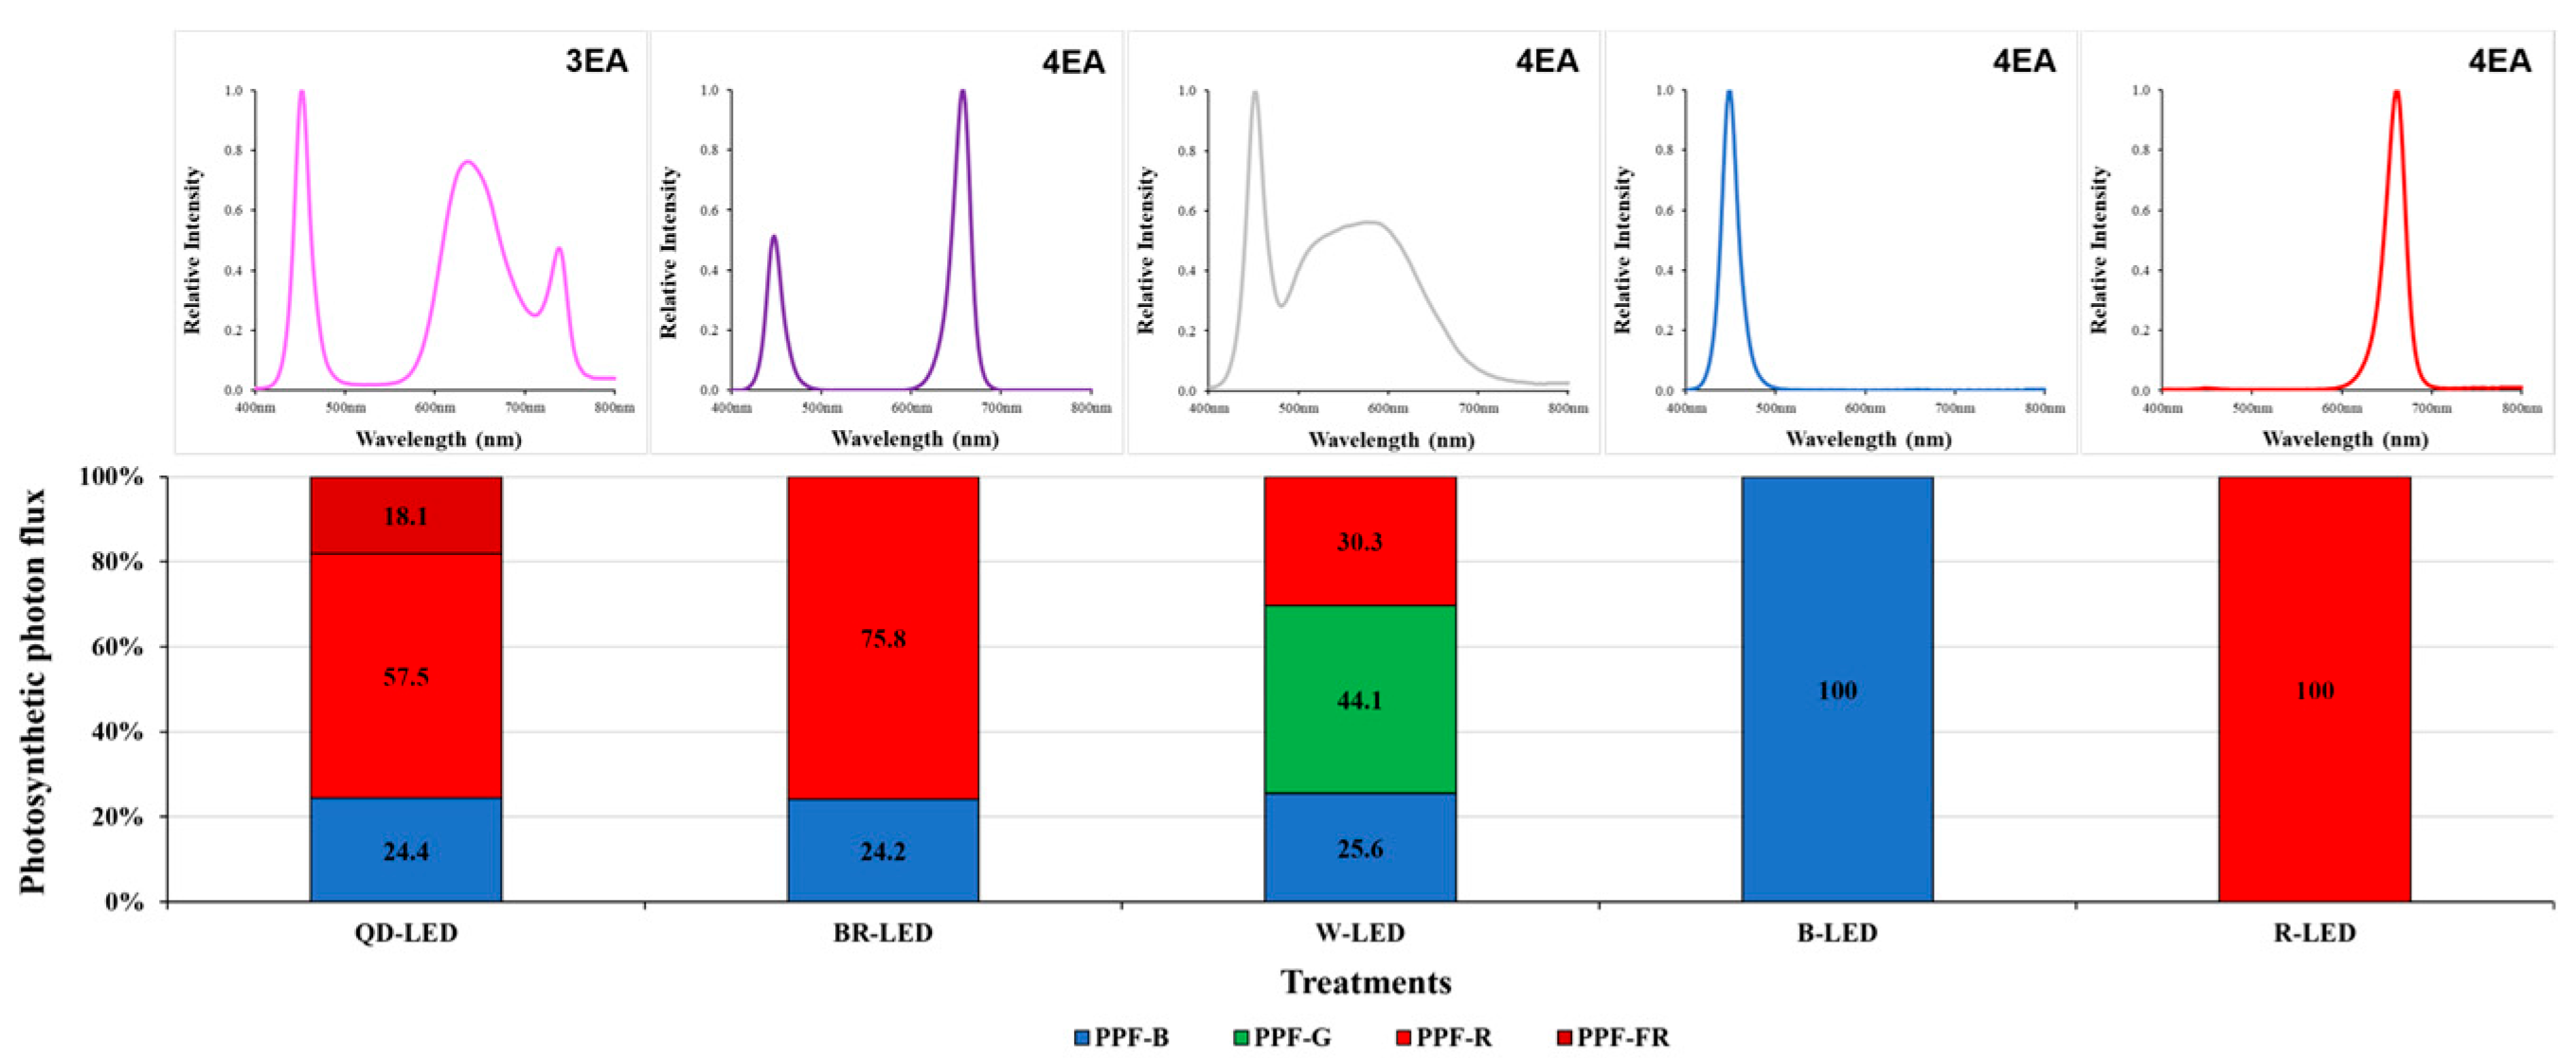
The artificial lighting consisted entirely of bar-type (20 × 30 × 1200) light-emitting diodes (LEDs). The various mixed-light conditions included quantum dot (QD)-LEDs (400–800 nm) (Cheorwon Plasma Research Institute, Cheorwon-gun, Republic of Korea), blue + red (BR)-LEDs (400–500 nm + 600–700 nm) (HT402-1; BISSOL LED, Seoul, Republic of Korea), and white (W)-LEDs (400–700 nm) (HT400-5700; BISSOL LED, Seoul, Republic of Korea). The single-color lights consisted of blue (B)-LEDs (400–500 nm) (HT400-Blue; BISSOL LED, Seoul, Republic of Korea) and red (R)-LEDs (600–700 nm) (HT400-Red; BISSOL LED, Seoul, Republic of Korea). The detailed spectral ranges of the artificial light sources used are given in Figure 2.
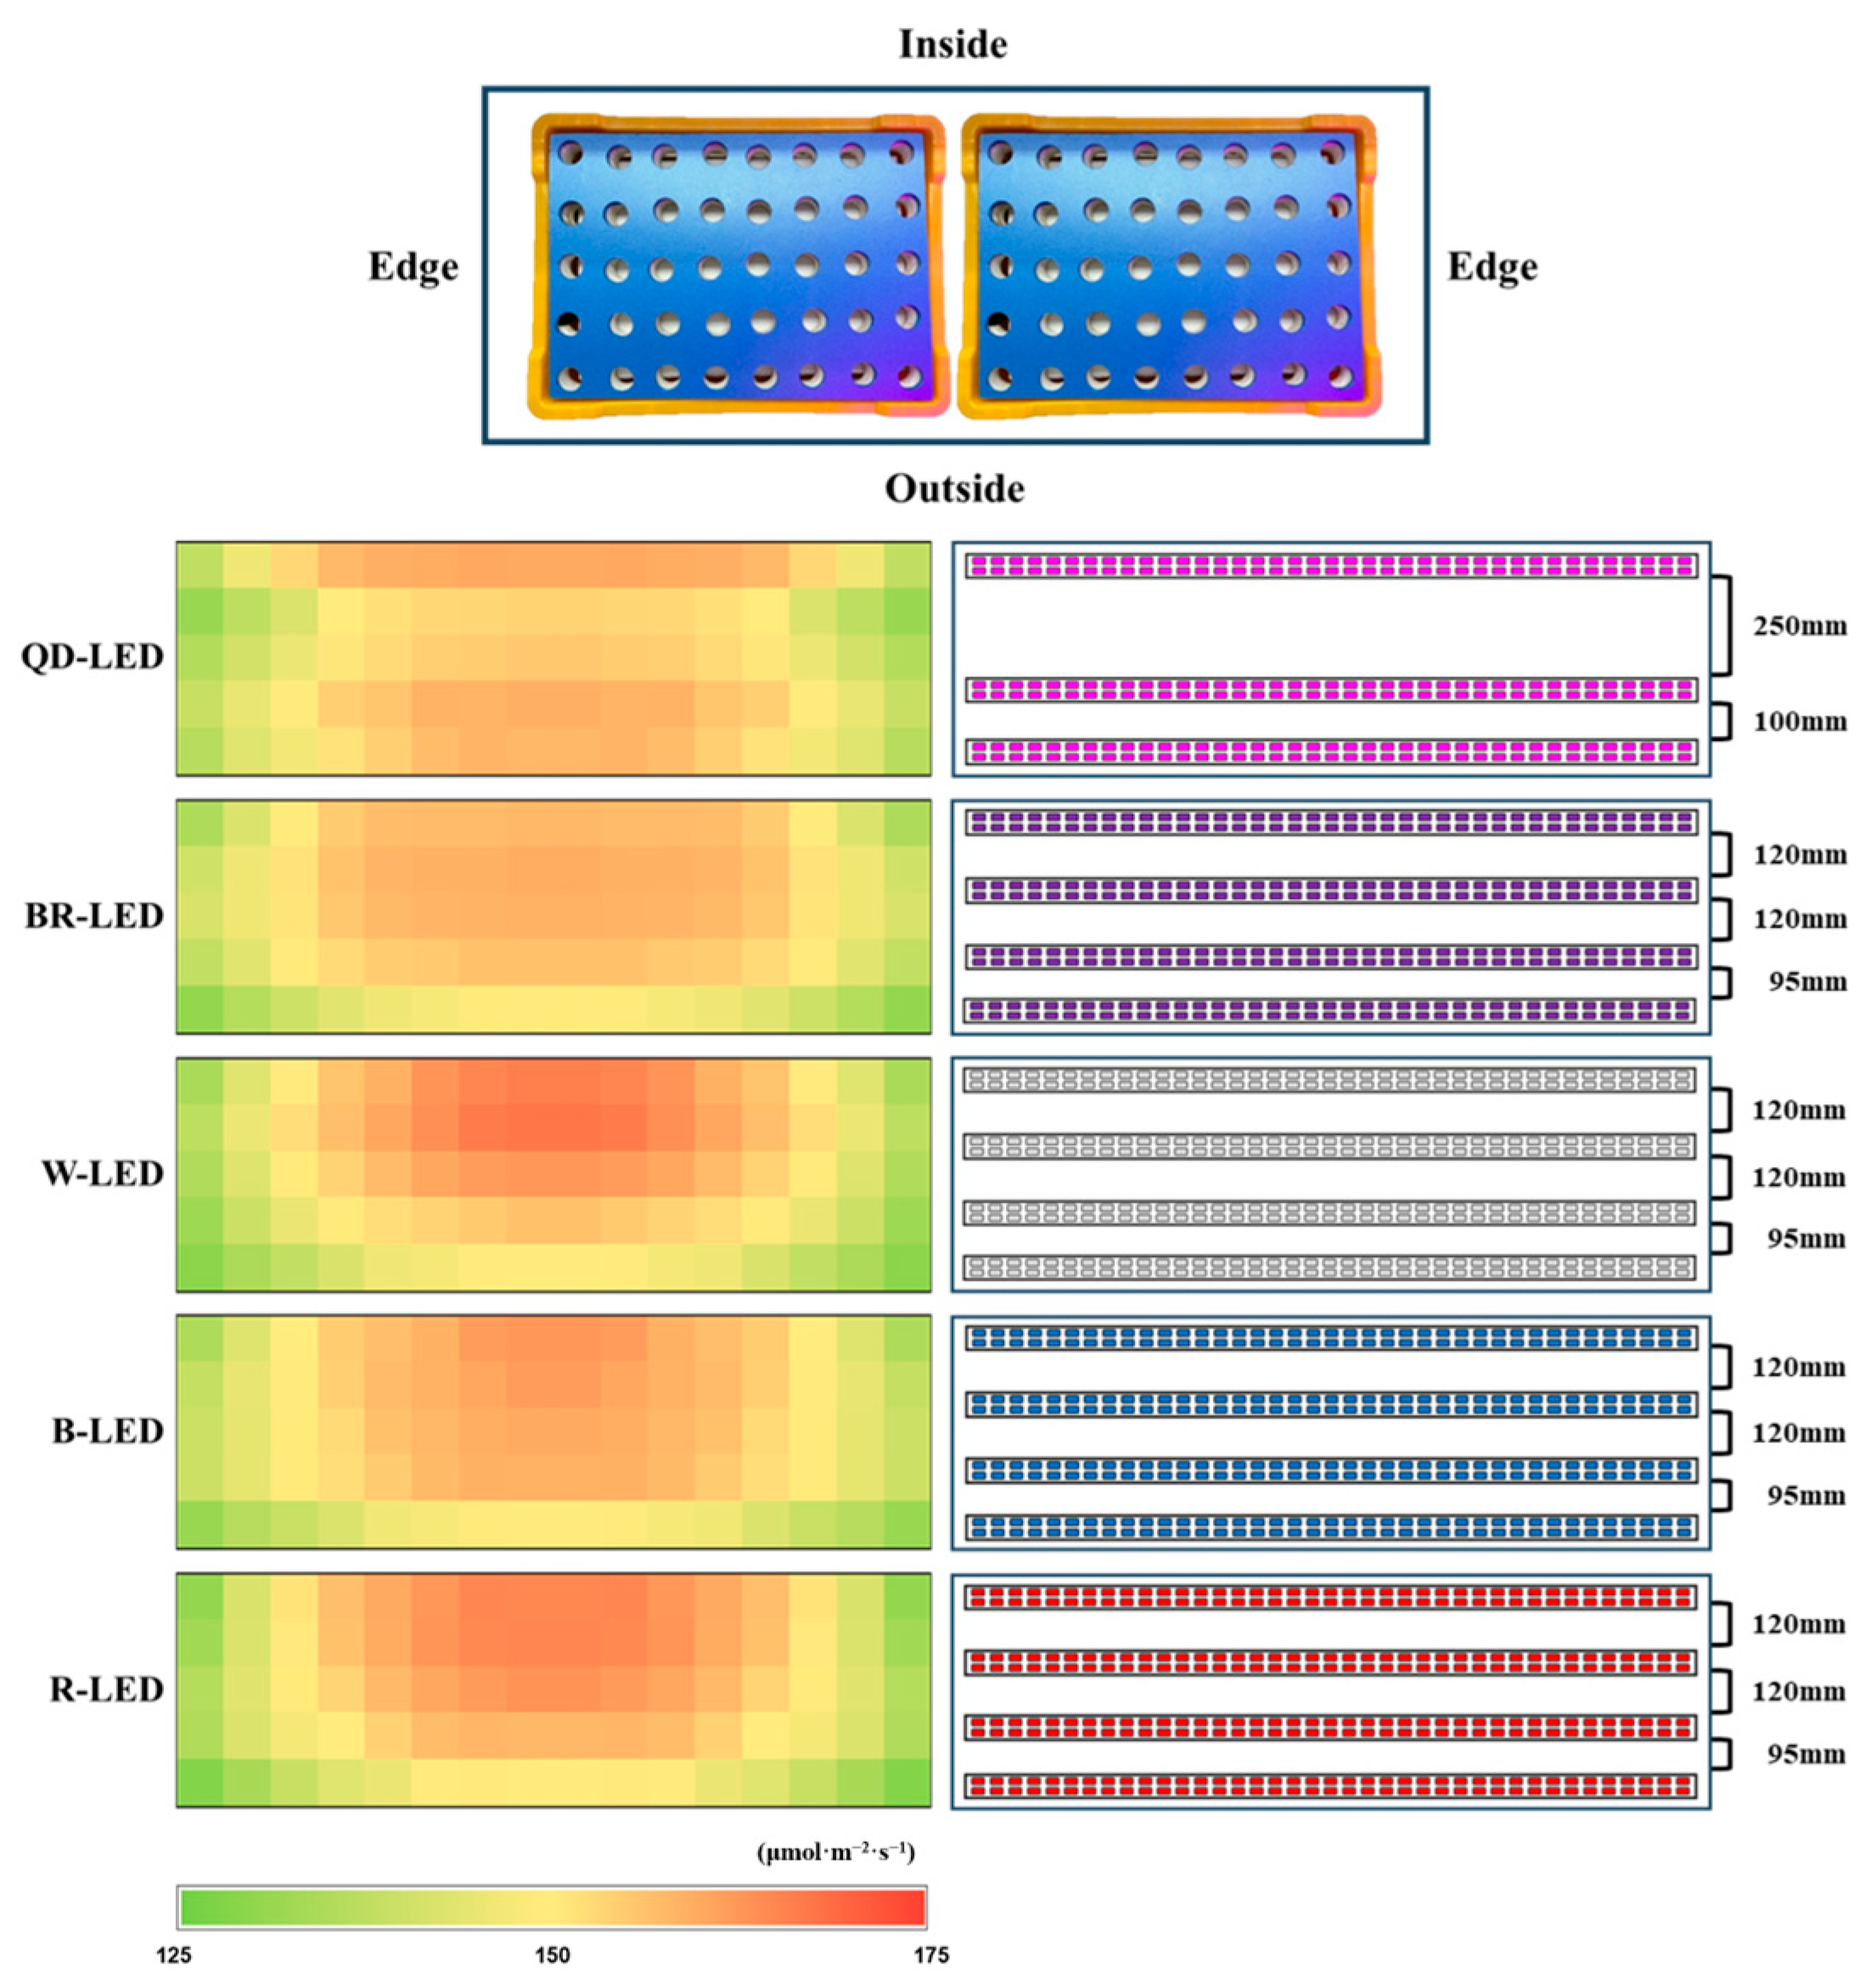
Four LEDs were installed per layer of each shelf, and only the QD-LEDs had a wide light distribution angle, so three were installed. The installation interval of LEDs per floor was set as shown in Figure 3, and the distance between the LEDs and floating platforms was maintained at 320 mm (QD-, BR-, W-, and B-LED) and 240 mm (R-LED). Light intensity was measured with a quantum radiometric probe (LP471PAR, Delta OHM, Veneto, Italy); the average light intensity of each light quality was 150 ± 9.4 μmol·m−1·s−2, and the light intensity by location was expressed as a heatmap (Figure 3). The light intensity was controlled according to lettuce growth using a light intensity controller (LED dimmer 20A; ZERO, Daejeon, Republic of Korea), and the light/dark cycle was set to 16/8 h.

2.4. Spectral Reflectance Measurement

Indices related to vegetation, leaf pigmentation, and stress were measured using a portable spectrophotometer (PolyPen RP 410 UVIS and PolyPen RP 410 NIR; Photon System Instruments, Drásov, Czech Republic) for the spectral reflectance at the end of cultivation. The vegetation indices investigated were the normalized difference vegetation index (NDVI), optimized soil-adjusted vegetation index (OSAVI), and modified chlorophyll absorption in reflectance index (MCARI), while those related to leaf pigmentation and stress were the carotenoid reflectance index 1 (CRI1), carotenoid reflectance index 2 (CRI2), structure insensitive pigment index (SIPI), and photochemical reflectance index (PRI). Each spectral reflectance index was calculated and exponentiated using the equations shown in Table 1.

2.5. Photosynthesis Performance Measurement

Photosynthetic performance was measured using a portable photosynthesis system (LCpro T; ACD BioScientific Ltd, UK) to measure the sub-stomatal CO2 concentration (Ci, vpm), transpiration rate (E, mmol·m−2·s−1), stomatal conductance of CO2 (gs, mol·m−2·s−1), and photosynthetic rate (A, μmol·m−2·s−1). Measurements were conducted in a dark room in the lettuce cultivation room, and the light required for irradiation was applied to the leaves at a constant level using a leaf chamber fluorometer (ACD BioScientific Ltd, UK), with an irradiation area of 6.25 cm2. The temperature within the leaf chamber fluorometer was set to 20 °C, and the light quality was set to white light (400–700 nm) mixed with blue (33%), green (34%), and red (33%), and the total light intensity was set to 200 μmol·m−1·s−2. The CO2 and H2O concentrations in the leaf chamber fluorometer were not artificially set and were the same as the environment in which the lettuce was grown. During the measurements, lettuce leaves were placed into the leaf chamber fluorometer after confirming that the difference in CO2 concentration (∆C) inside and outside the leaf chamber fluorometer was 0.0 ± 2. Afterward, to stabilize the change in CO2 concentration (∆C) inside and outside the lettuce leaves, after waiting for 5 min, measurements were taken at 1-min intervals per sample for a total of 8–10 min.

2.6. Chlorophyll Fluorescence Measurement

Chlorophyll fluorescence was measured after dark treatment for 20 min with a dark-adapted clip using a portable fluorometer (Fluorpen FP 100; Photon Systems Instruments; Drásov, Czech Republic) in eight specimens per light quality. The investigated parameters included maximum quantum yield (Fv/Fm) according to mineral quality, change pattern by OJIP stage, absorption of light energy per RC (ABS/RC), tapping of excitation energy per RC (TRo/RC), conversion of excitation energy to electron transport per RC (ETo/RC), heat dissipation at time zero per RC (DIo/RC), performance index on the absorption basis (PIABS), total fluorescence basis (PItotal), and non-photochemical fluorescence quenching (NPQ). The definitions and calculated formulae for the chlorophyll fluorescence parameters are shown in Table 2, and the measurement results related to OJIP were JIP tested according to the method of Stirbet and Govindjee [33].

2.7. Changes in Growth According to Various Light Qualities

The growth changes in lettuce under various light qualities were measured at the end of cultivation, and the results were derived from a total of 8 individuals. The aboveground and root fresh weight and leaf weight were measured using an electronic scale (PB602-S, Mettler Toledo, Greifensee, Switzerland). The dry matter rate of aboveground and root parts was determined by measuring their live weight with an electronic scale, drying them in a hot-air dryer set at 70 °C for 72 h, and then measuring it again with an electronic scale. Afterward, it was calculated using the formula below and expressed as a percentage.
Dry matter ratio (%) = (Dry weight/Fresh weight) × 100
The length and width of the leaves, as well as the hypocotyl thickness (HT), were measured using an electronic Vernier caliper. The number of leaves was counted directly, considering only leaves that were 10 mm or longer.

2.8. Statistical Analysis

The statistical analysis of the data was conducted using IBM SPSS statistics, version 26.0 (IBM Corp., Chicago, IL, USA). Data were evaluated using analysis of variance (ANOVA), and the comparison of differences between the averages of the investigation items of the treatment groups was analyzed at the p < 0.05 level using DMRT (Duncan’s multiple range test). The standard deviation (SD) of each mean is indicated. Principal component analysis (PCA) was carried out using XLSTAT version 2022 (Addinsoft Inc., 244 Fifth Avenue, Suite E100, New York, NY, USA). Heatmap analysis of correlations and overall changes in lettuce under various light qualities was used to visualize the differences in the collected parameters between the treatments. Descriptive data were tested in IBM SPSS statistics, version 26.0 (IBM Corp., Chicago, IL, USA).

3. Results

3.1. Spectral Reflectance Measurement

The spectral reflectance was analyzed for parameters related to vegetation (NDVI, OSAVI, and MCARI) as well as stress and pigments (CRI1, CRI2, SIPI, and PRI). The results of the vegetation indices NDVI and OSAVI showed the same trend under various light qualities. The NDVI and OSAVI showed the highest statistical values when cultivated under B-LED. These B-LED results were, on average, 11.0% (NDVI) and 6.5% (OSAVI) higher than those under QD- and R-LED, which had the lowest results. However, MCARI, the chlorophyll absorption index, showed different results from NDVI and OSAVI: QD-LED, which showed significantly lower results compared to other light qualities in NDVI and OSAVI, exhibited the highest results (Figure 4).
Among the stress- and pigment-related indicators closely associated with changes in carotenoids, CRI1, CRI2, and SIPI showed higher values in the order of B- → BR- → W- → QD- → R-LED. In particular, significant differences in CRI1 and CRI2 were observed depending on the light quality. Blue light, which had the highest results, was approximately 28.0% (CRI1) and 27.6% (CRI2) higher than red light, which had the lowest results. Based on these spectral reflectance results, higher levels of blue light in artificial light sources may cause crops to experience higher levels of stress. However, the contents of carotenoids, which are defensive compounds against light, can also increase. Conversely, red light exhibits properties opposite to those of blue light. In particular, PRI, which is used to measure plants’ productivity, is closely related to light-use efficiency and CO2 absorption rate, along with carotenoid changes, showing the highest results in B-LED, which indicates that blue light is closely related to photosynthesis (Figure 5).

3.2. Photosynthesis Performance Measurement

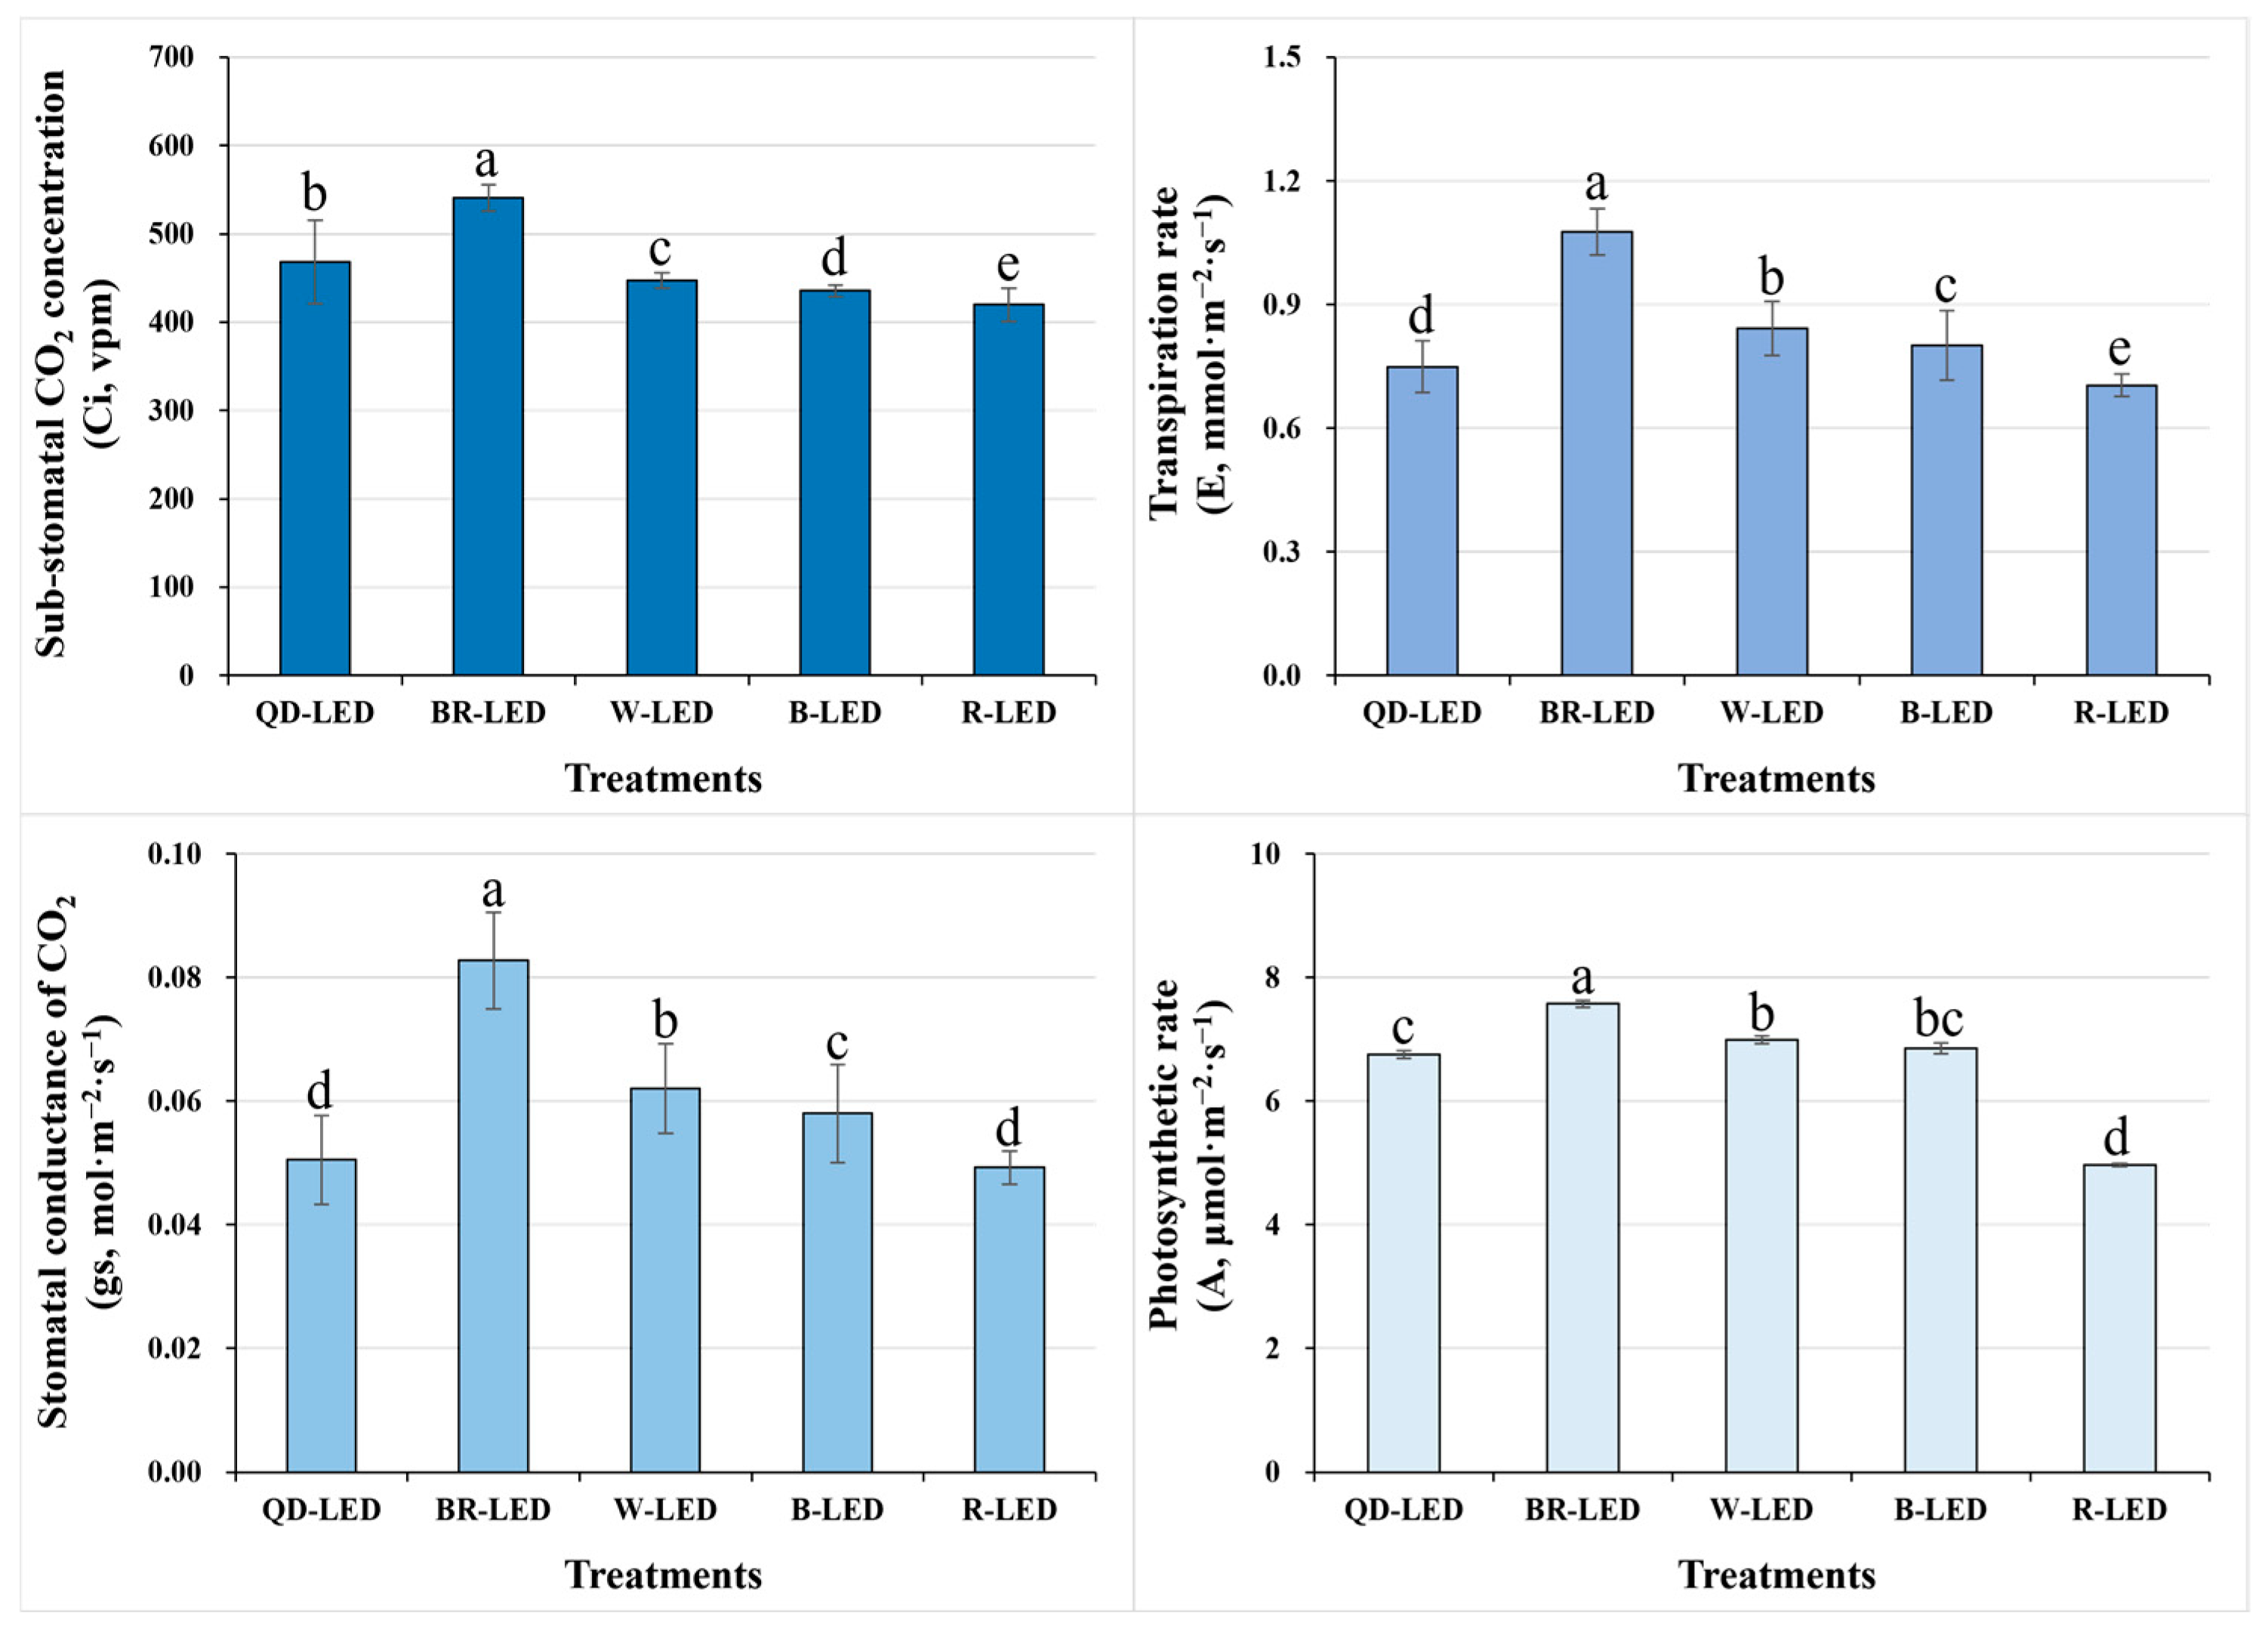
To investigate the photosynthetic performance of Minicup romaine lettuce under different light qualities, we examined the sub-stomatal CO2 concentration (Ci), transpiration rate (E), stomatal conductance (gs), and photosynthetic rate (A). Among all of the LEDs used in this study, BR-LED showed the best results compared to the other treatments in all parameters related to photosynthetic performance. Conversely, when cultivated under R-LED, the photosynthetic performance showed statistically significantly lower results compared to all other treatments. Ultimately, regarding the most crucial parameter of photosynthetic performance, which is A, BR-LED showed results approximately 34.4% higher than those under R-LED, which had the lowest results. Furthermore, A showed similar trends to the Ci, E, and gs results, suggesting that they are closely related. Overall, given the higher results in all parameters for BR-LED and W-LED, manipulating the light quality during romaine lettuce cultivation to achieve maximum photosynthetic rates would likely benefit more from mixed light spectra rather than single spectra (Figure 6).

3.3. Chlorophyll Fluorescence Measurement

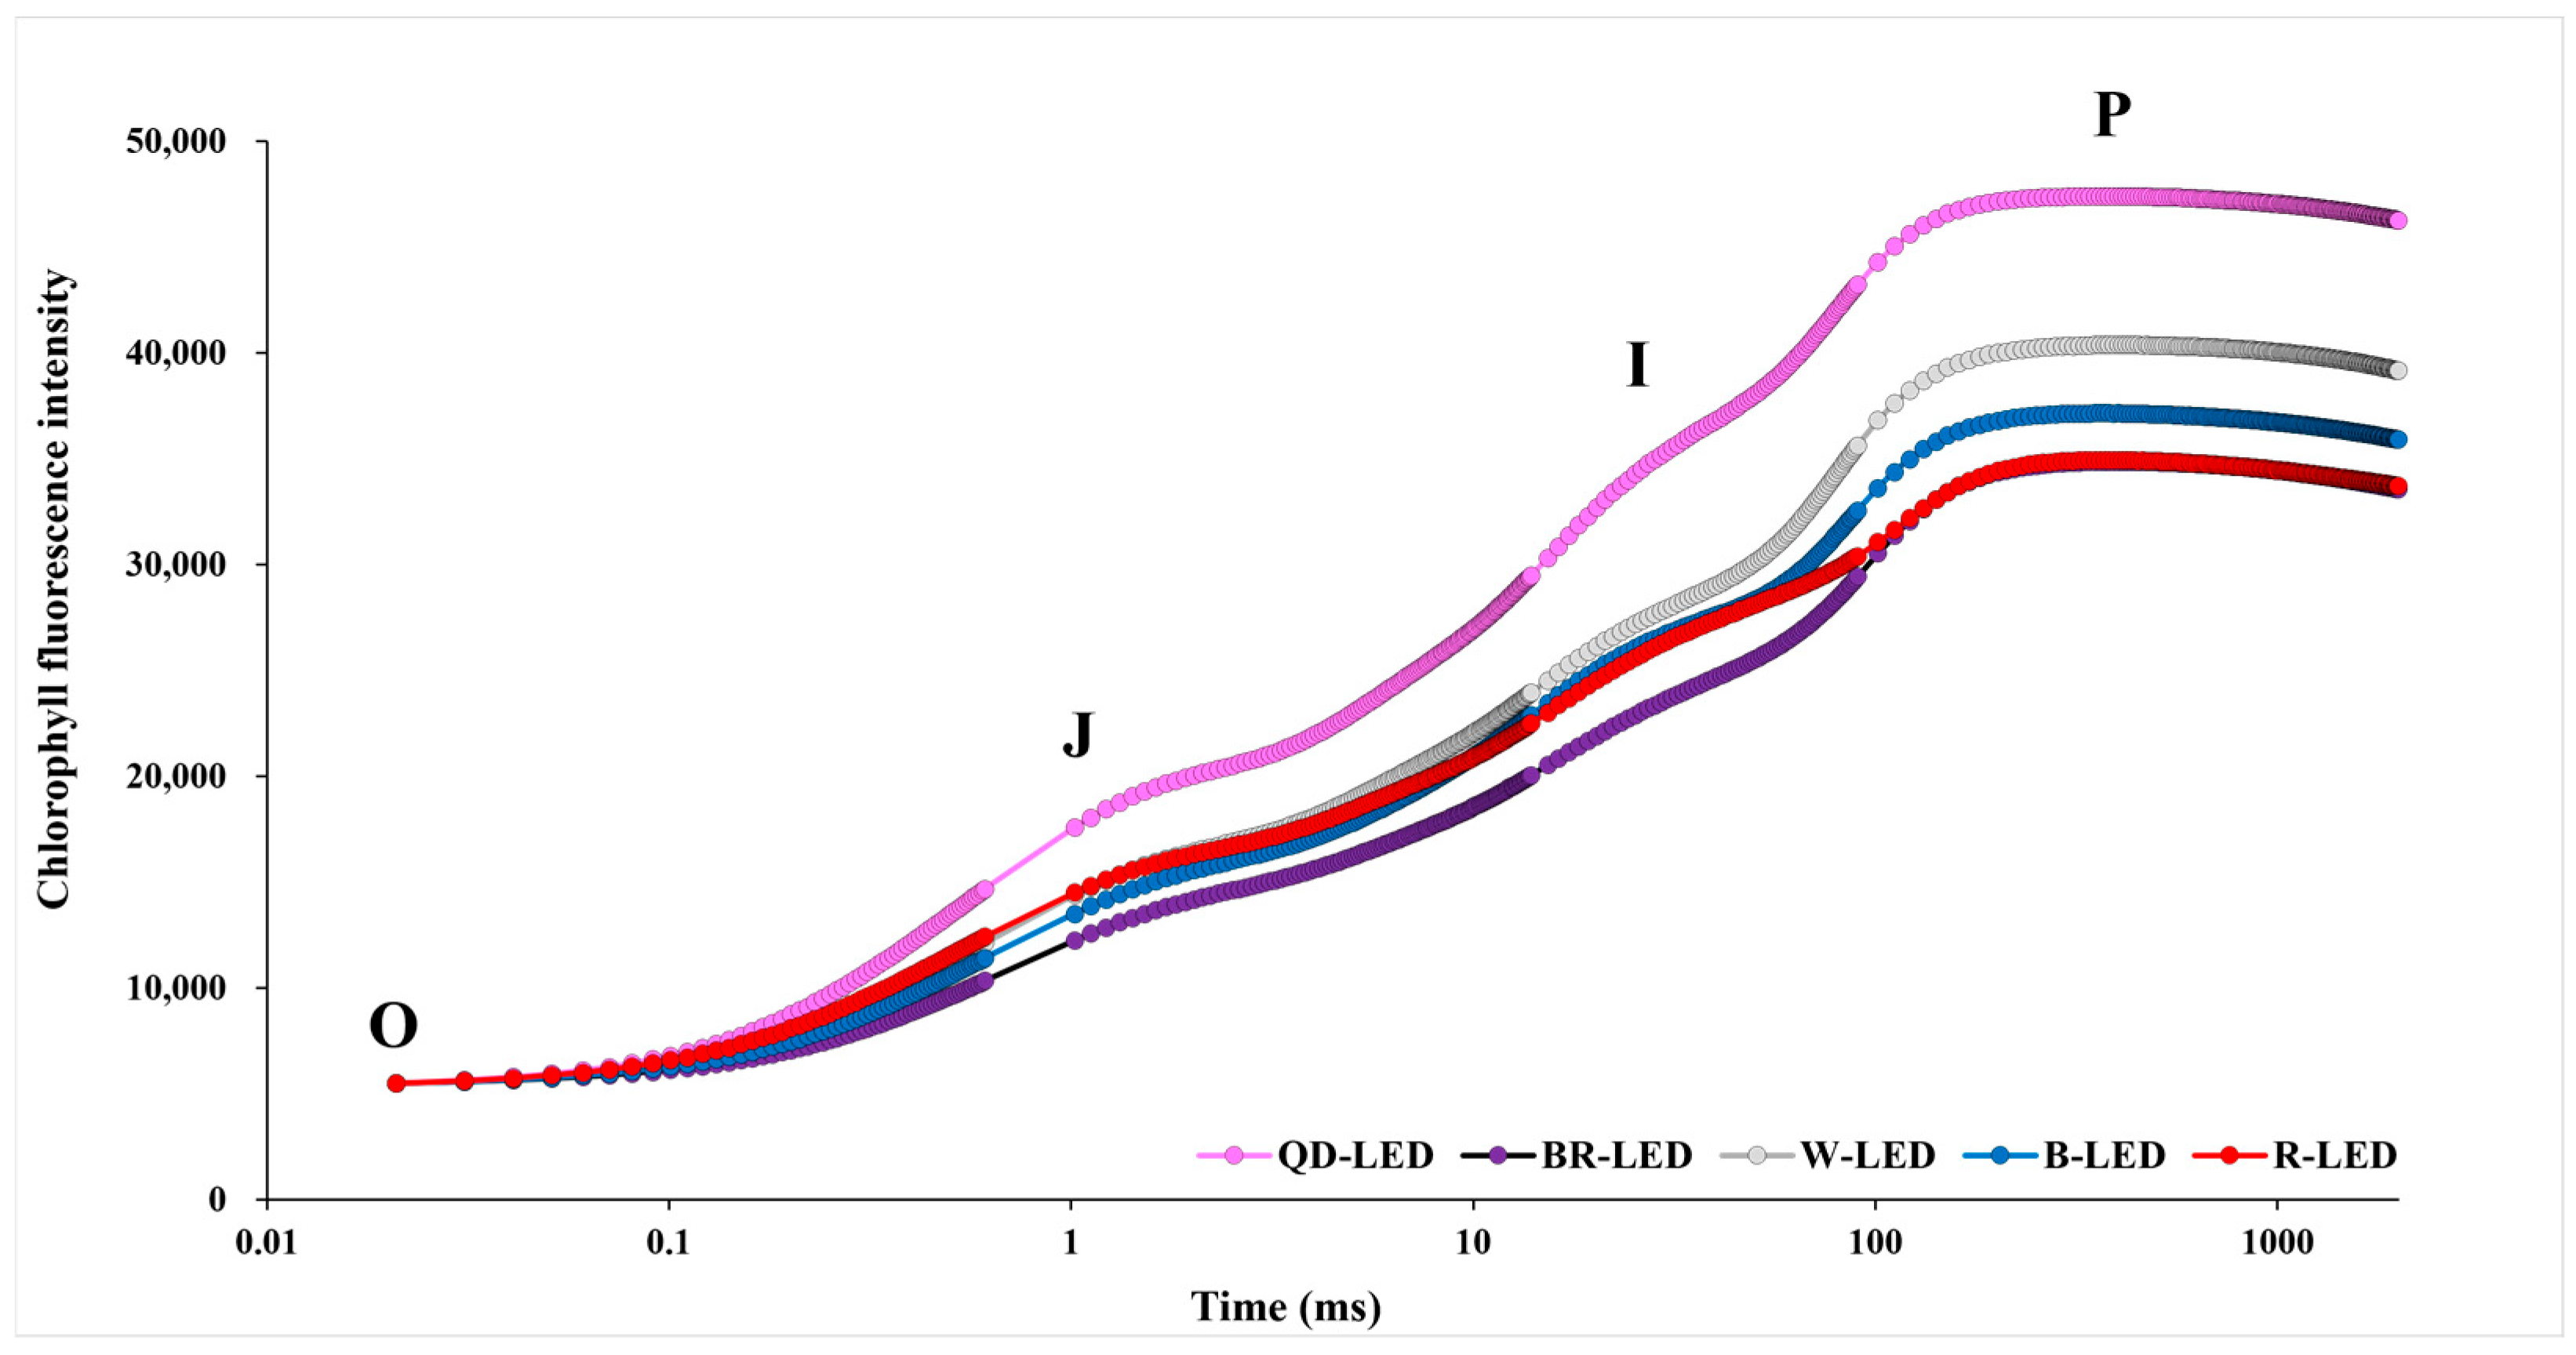
OJIP is a chlorophyll fluorescence induction curve that measures induced fluorescence values during photosynthetic processes over approximately 1000 ms; it can be used to calculate various physiological variables in plants. OJIP is investigated in four stages, with the intensity of light investigated at each stage increasing as it progresses from the initial O stage to the final P stage. In this study, the OJIP transition, excluding R-LED, showed that as the light intensity increased, the results of chlorophyll fluorescence values at all stages followed the sequence QD- → W- → B- → BR-LED. In particular, in the case of romaine lettuce grown with QD-LED, the OJIP transition results showed that the chlorophyll fluorescence value increased further as the light intensity increased compared to the other LED treatments. In the case of R-LED, up to the O–J phases, it exhibited the highest fluorescence values after QD-LED. However, from the I–P phases onwards, these values gradually decreased. Ultimately, in the final P phase, R-LED showed the lowest results after BR-LED, which had the lowest fluorescence values overall. Furthermore, excluding BR-LED, the chlorophyll fluorescence values were higher in mixed light spectra consisting of three or more spectra than in single-spectrum LEDs (Figure 7).
Chlorophyll fluorescence analysis, along with the photosynthetic performance parameters investigated in this study, can ultimately provide parameters that can characterize the overall efficiency of photosynthesis. However, Ci, E, gs, and A are measured based on CO2 and reflect parameters directly related to the photosynthetic process. On the other hand, chlorophyll fluorescence is not used in photosynthesis and is measured based on fluorescence emitted from reflected light, so there is a difference in the measurement method. Fv/Fm was lowest under R-LED, with no significant differences observed among the other treatments. In Photosystem II, the light energy absorption (ABS/RC), trapping of electrons (TRo/RC), and electron transport rate (ETo/RC) were highest under R-LED and lowest under BR-LED. However, the PIABS results, which indicate the final electron acceptor reduction level of PSII and PSI, showed higher values in the order of BR- → W- → B- → QD- → R-LED. This appears to be due to the fact that DIo/RC showed the highest results under R-LED and the lowest under BR-LED. Furthermore, the results of PIABS were quite similar to those of A in Figure 6. PItotal represents an overall photochemical performance index.
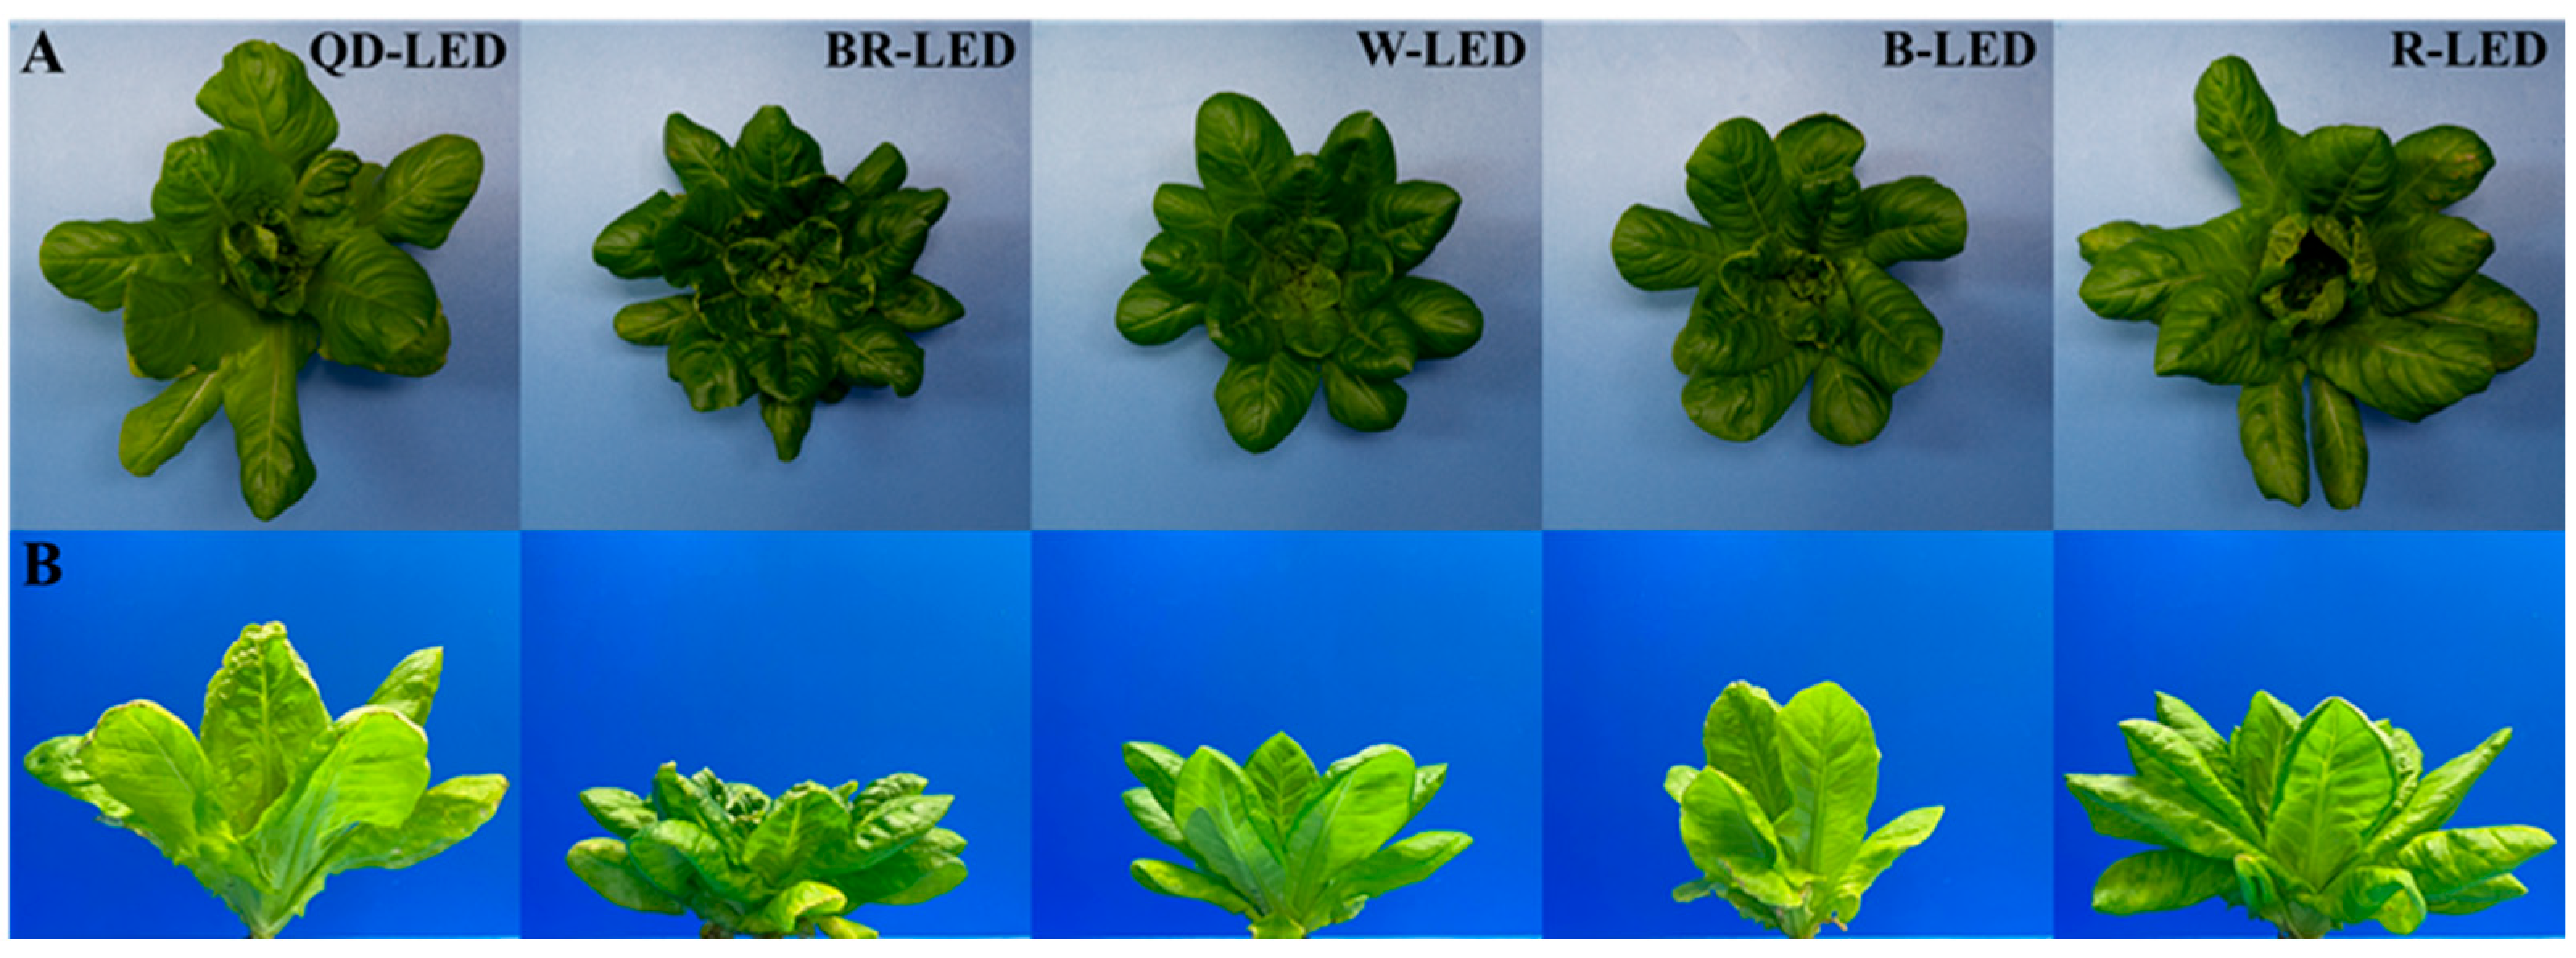
Although there were no statistically significant differences between B-, BR-, and W-LED, significant differences were observed compared to QD- and R-LED, showing higher results. ABS/RC was particularly high in the R-LED and QD-LED treatments (Table 3). This was attributed to the photomorphogenic effects of light quality, where the leaves of romaine lettuce grown under R-LED and QD-LED grew longer and wider compared to the other treatments, enabling them to receive more light effectively (Figure 8). NPQ is non-photochemical quenching where, like DIo/RC, absorbed light energy that cannot be used for photosynthesis is released as heat. However, NPQ and DIo/RC are calculated using different formulae, so while they may exhibit similar overall trends, their results may not be perfectly identical. In fact, the results of this study showed a significant difference between R and QD-LED in DIo/RC, but no difference in NPQ. There were no statistically significant differences in DIo/RC and NPQ between the BR-, W-, and B-LED treatments. Summarizing the results regarding chlorophyll fluorescence, it is evident that the presence of blue light in LED spectra plays a crucial role in photosynthetic performance. However, despite QD-LED having the same percentage of blue light as BR-LED (24%), and similar proportions in the red light range, it exhibited lower photosynthetic performance compared to R-LED (Table 3). This was likely influenced by the far-red light present in QD-LEDs.

3.4. Changes in Growth According to Various Light Qualities

The fresh weight and dry matter ratio of both the aboveground and root parts were investigated at the end of cultivation under various light spectra. The trends in fresh weight between the aboveground and root parts were very similar, indicating that the development of the root parts could affect the growth of the aboveground parts. In this study, mini romaine lettuce showed the best results when grown under R-LED lighting, which exhibited the highest aboveground fresh weight, 31.6% heavier than the second-highest (BR-LED). Compared to W- and B-LED, which showed the lowest growth, R-LED had an average difference of approximately 60.0% (Figure 9).
Lettuce’s aboveground part is directly utilized and consumed by consumers, making internal quality crucial. However, to complete the purchase decision, external qualities such as shape, leaf color, freshness, and other appearance factors that can vary by lettuce variety are also very important. However, lettuce grown under 100% red light exhibited severe leaf curling, making it difficult to discern the original variety’s leaf shape; furthermore, it induced tip burning in the growth points of most individuals (Figure 8). Therefore, for these reasons, using 100% red light for indoor lettuce cultivation was deemed unsuitable, despite potentially higher aboveground biomass compared to other light spectra, due to severely compromised marketability.
Based on aboveground fresh weight, lettuce grown under QD- and BR-LED had different overall shapes due to differences in leaf length and width, but both spectra showed marketable quality and yielded high weight per planting day. Therefore, these two light spectra are considered to be the most suitable for growing mini green romaine lettuce. For the aboveground and root dry matter ratios, the trend was not similar to that for fresh weight. The aboveground dry matter ratio was highest under BR-LED, and there were no significant differences among the remaining treatments (Figure 9). In this study, graphs depicting the relationship between aboveground dry weight and body water content are not provided; however, this indicates that the average dry weight of lettuce grown under R-LED, which had the highest aboveground fresh weight of 149.28 g, was 7.19 g. Moreover, the body water content relative to the average aboveground fresh weight was higher (96.78%) compared to other treatments. These results are stated to be due to the lower transpiration rate of lettuce grown under red light compared to the other treatments, as shown in the transpiration rate results in Figure 6. Following R-LED, BR- (75.8%) and QD-LED (57.5%), which contained more than half of the red light within the total spectrum of light qualities, had body water contents of 94.95% and 95.08% relative to their average aboveground fresh weight, respectively. Furthermore, in contrast, W-LED and B-LED, which had higher amounts of green or blue light relative to red light in the total spectrum, showed lower body water contents relative to their average body mass. Specifically, W-LED had a body water content of 92.18%, and B-LED had 91.95%, which were lower compared to R-, BR-, and QD-LED.
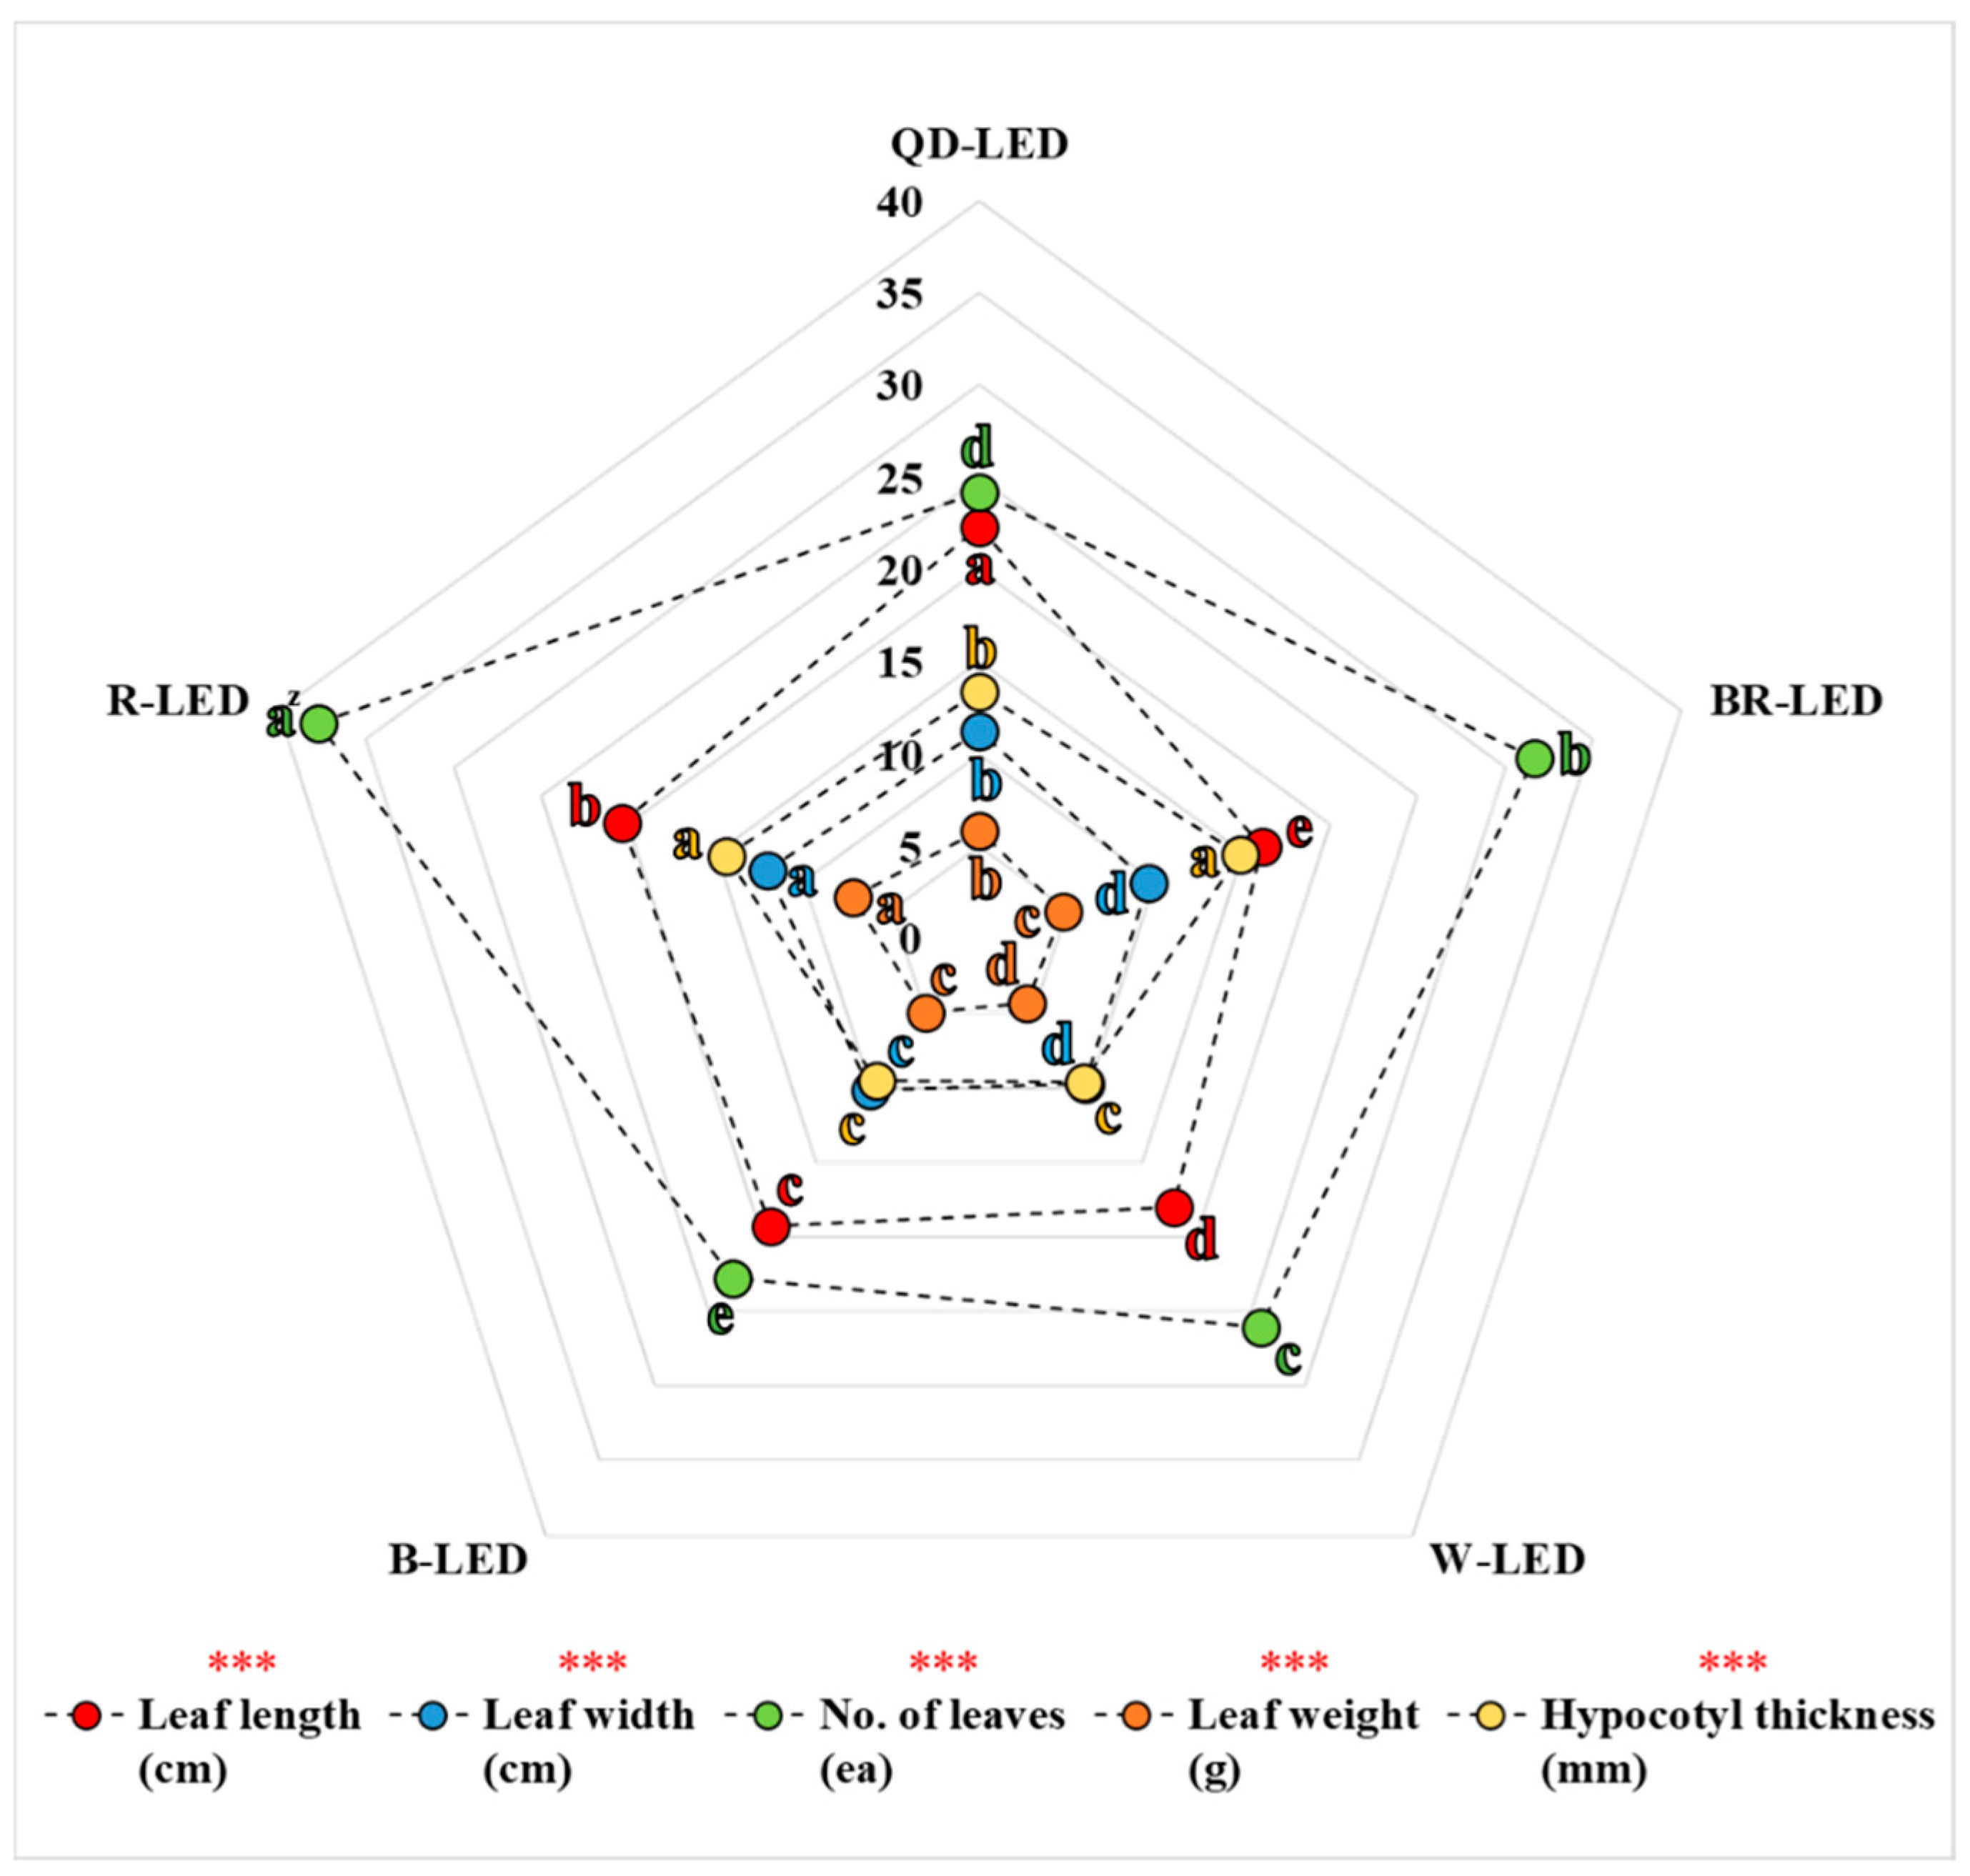
When examining the parameters of chlorophyll fluorescence, ultimately, the results of A, PIABS, and PItotal were significantly lower under QD- and R-LED compared to BR-, W-, and B-LED (Figure 6 and Table 3). However, the results regarding aboveground fresh weight did not resemble this pattern. In the treatment where the aboveground fresh weight was highest, R-LED, the results for A, PIABS, and PItotal were the lowest. Conversely, in treatments where aboveground fresh weight results were lower than those of R-LED, the results for A, PIABS, and PItotal were higher. This is because the energy generated through photosynthesis is not only utilized for growth but also significantly influences the photomorphogenesis of lettuce parts depending on the light quality. In fact, in this study, leaf length, leaf width, number of leaves, leaf weight, and hypocotyl thickness were measured to investigate parameters that can affect the aboveground fresh weight of lettuce. The parameters constituting the aboveground fresh weight were slightly different for each light quality, but when viewed from the growth pattern according to the cultivation period, the results of the number of leaves and hypocotyl thickness were very similar to the results of aboveground fresh weight. Lettuce leaves have a thick central midrib, and the hypocotyl supports all of the leaves, contributing significantly to the aboveground fresh weight (Figure 10). Therefore, differences in the number of leaves and hypocotyl thickness due to light quality are likely to be much more pronounced than the differences that may arise in leaf length, leaf width, and leaf weight. In this study, although specific values for the standard deviation (SD) of each parameter across different light qualities were not provided, calculations showed that the number of leaves had an SD of 6.18, which was 70.8% greater than that of the other growth-related parameters, while the hypocotyl thickness had the second-highest SD, at 2.63. From the perspective of crop growth, photosynthesis is merely a process that converts external light energy into usable energy for the plant. Ultimately, how this converted energy is utilized—whether for growth or photomorphogenesis—can vary depending on the light quality.
During crop cultivation, photosynthesis and photomorphogenesis occur simultaneously in response to light quality. As seen in Figure 8, lettuce showed significant photomorphogenesis depending on the light quality. These differences became more pronounced as the growth progressed, and such morphological changes are likely to significantly impact the photosynthetic performance and chlorophyll fluorescence parameters of lettuce under the same light intensity.

3.5. Heatmap and Principal Component Analysis (PCA)

Through the parameters related to spectral reflectance, photosynthetic performance, chlorophyll fluorescence, and growth, the correlation between them and the overall changes in each light quality and parameter were displayed as a heatmap (Figure 10). The NDVI, which is included in the vegetation indices among spectral reflectance and is proportional to the change in chlorophyll, showed a high positive correlation with CRI1, which indicates the amount of carotenoid compared to chlorophyll at the p < 0.01 level. Additionally, it was confirmed that the NDVI, CRI1, CRI2, and PRI showed statistically opposite trends to NPQ. In addition, the PRI, like CRI1 and CRI2, is an index that reflects stress and changes in carotenoids and is also related to light efficiency and CO2 absorption rate in photosynthesis, showing a strong inverse relationship to NPQ. However, the parameters related to spectral reflectance had no noticeable correlation with other photosynthetic performance, chlorophyll fluorescence, and growth parameters, except for NPQ. It was found that as the concentration of Ci—one of the parameters of photosynthetic performance—increases, ETo/RC may decrease. E and gs showed a 95% negative correlation between ABS/RC and TRo/RC during the photosynthetic process, and although there was no statistical significance, they also showed an inverse relationship with ETo/RC and DIo/RC (Figure 11). This means that as E and gs increase, light absorption can be hindered. When the stomata of the guard cells open due to transpiration, the area where the chloroplasts of the guard cells can receive light energy decreases, so the quantity and amount of light energy absorbed may decrease. As a result, it is considered that the amount of absorbed light energy and the electron excitation energy absorbed from light can decrease. Ultimately, A showed a significant proportional relationship with PIABS and PItotal, especially the latter. It was confirmed that changes in the appearance of mini green romaine lettuce can significantly affect its photosynthetic performance. It was also found that an increase in leaf length can reduce stomatal conductance, and as leaf width and leaf weight increase, the photosynthetic rate can decrease (Figure 11). Fv/Fm is a measure of quantum efficiency that quantifies the plant’s light absorption capacity at the time of measurement. Unlike DIo/RC and NPQ, which represent the amount of light energy dissipated as heat that is not utilized in photosynthesis, Fv/Fm indicates the light energy that is dissipated as fluorescence and not utilized in photosynthesis. This increase in fluorescence dissipation (Fv/Fm) can reduce DIo/RC, because the amount that can be dissipated in addition to the light energy used for photosynthesis is limited. Additionally, excessive aboveground and root growth and an increase in leaf numbers were found to decrease quantum efficiency rather than enhance it. Increasing leaf length and width was noted to decrease photosynthetic efficiency, and this effect was similarly observed for PIABS and PItotal (Figure 11). Interpreting this correlation suggests that increasing leaf length and width can increase the amount of light energy absorbed per unit area (ABS/RC), as well as the number of trapped electrons (TRo/RC). However, due to the increased leaf area, the amount of energy dissipated as heat (DIo/RC) may also increase. Ultimately, this may lead to a decrease in energy conservation efficiency from photons absorbed by the PSII antenna until PSII and its electron acceptors decrease. In particular, PItotal showed a negative correlation with DIo/RC at a very high level (−0.994 **), with the same trend as the aboveground fresh weight and leaf weight (Figure 11). Thus, the inverse relationship of A, PIABS, and PItotal with growth-related parameters implies that excessive growth of mini green romaine lettuce can actually reduce its photosynthetic performance. This could be due to the light quality, but it is also likely related to the planting distance during lettuce cultivation. Although not mentioned in this study, the cultivation area for actual lettuce growth was limited, so a sufficient planting distance for lettuce could not be maintained until the end date of cultivation. Interference between individuals can lead to inefficient CO2 assimilation, uneven light absorption and, consequently, stress on growth. The aboveground fresh weight and hypocotyl thickness increased with the development of the root part, and the increase in aboveground fresh weight appeared to be due to an increase in the number of leaves rather than their length and width. Additionally, leaf weight showed a positive correlation with leaf width (0.975 **), indicating that the increase in leaf width of mini green romaine lettuce had an effect on the increase in leaf weight (Figure 11).
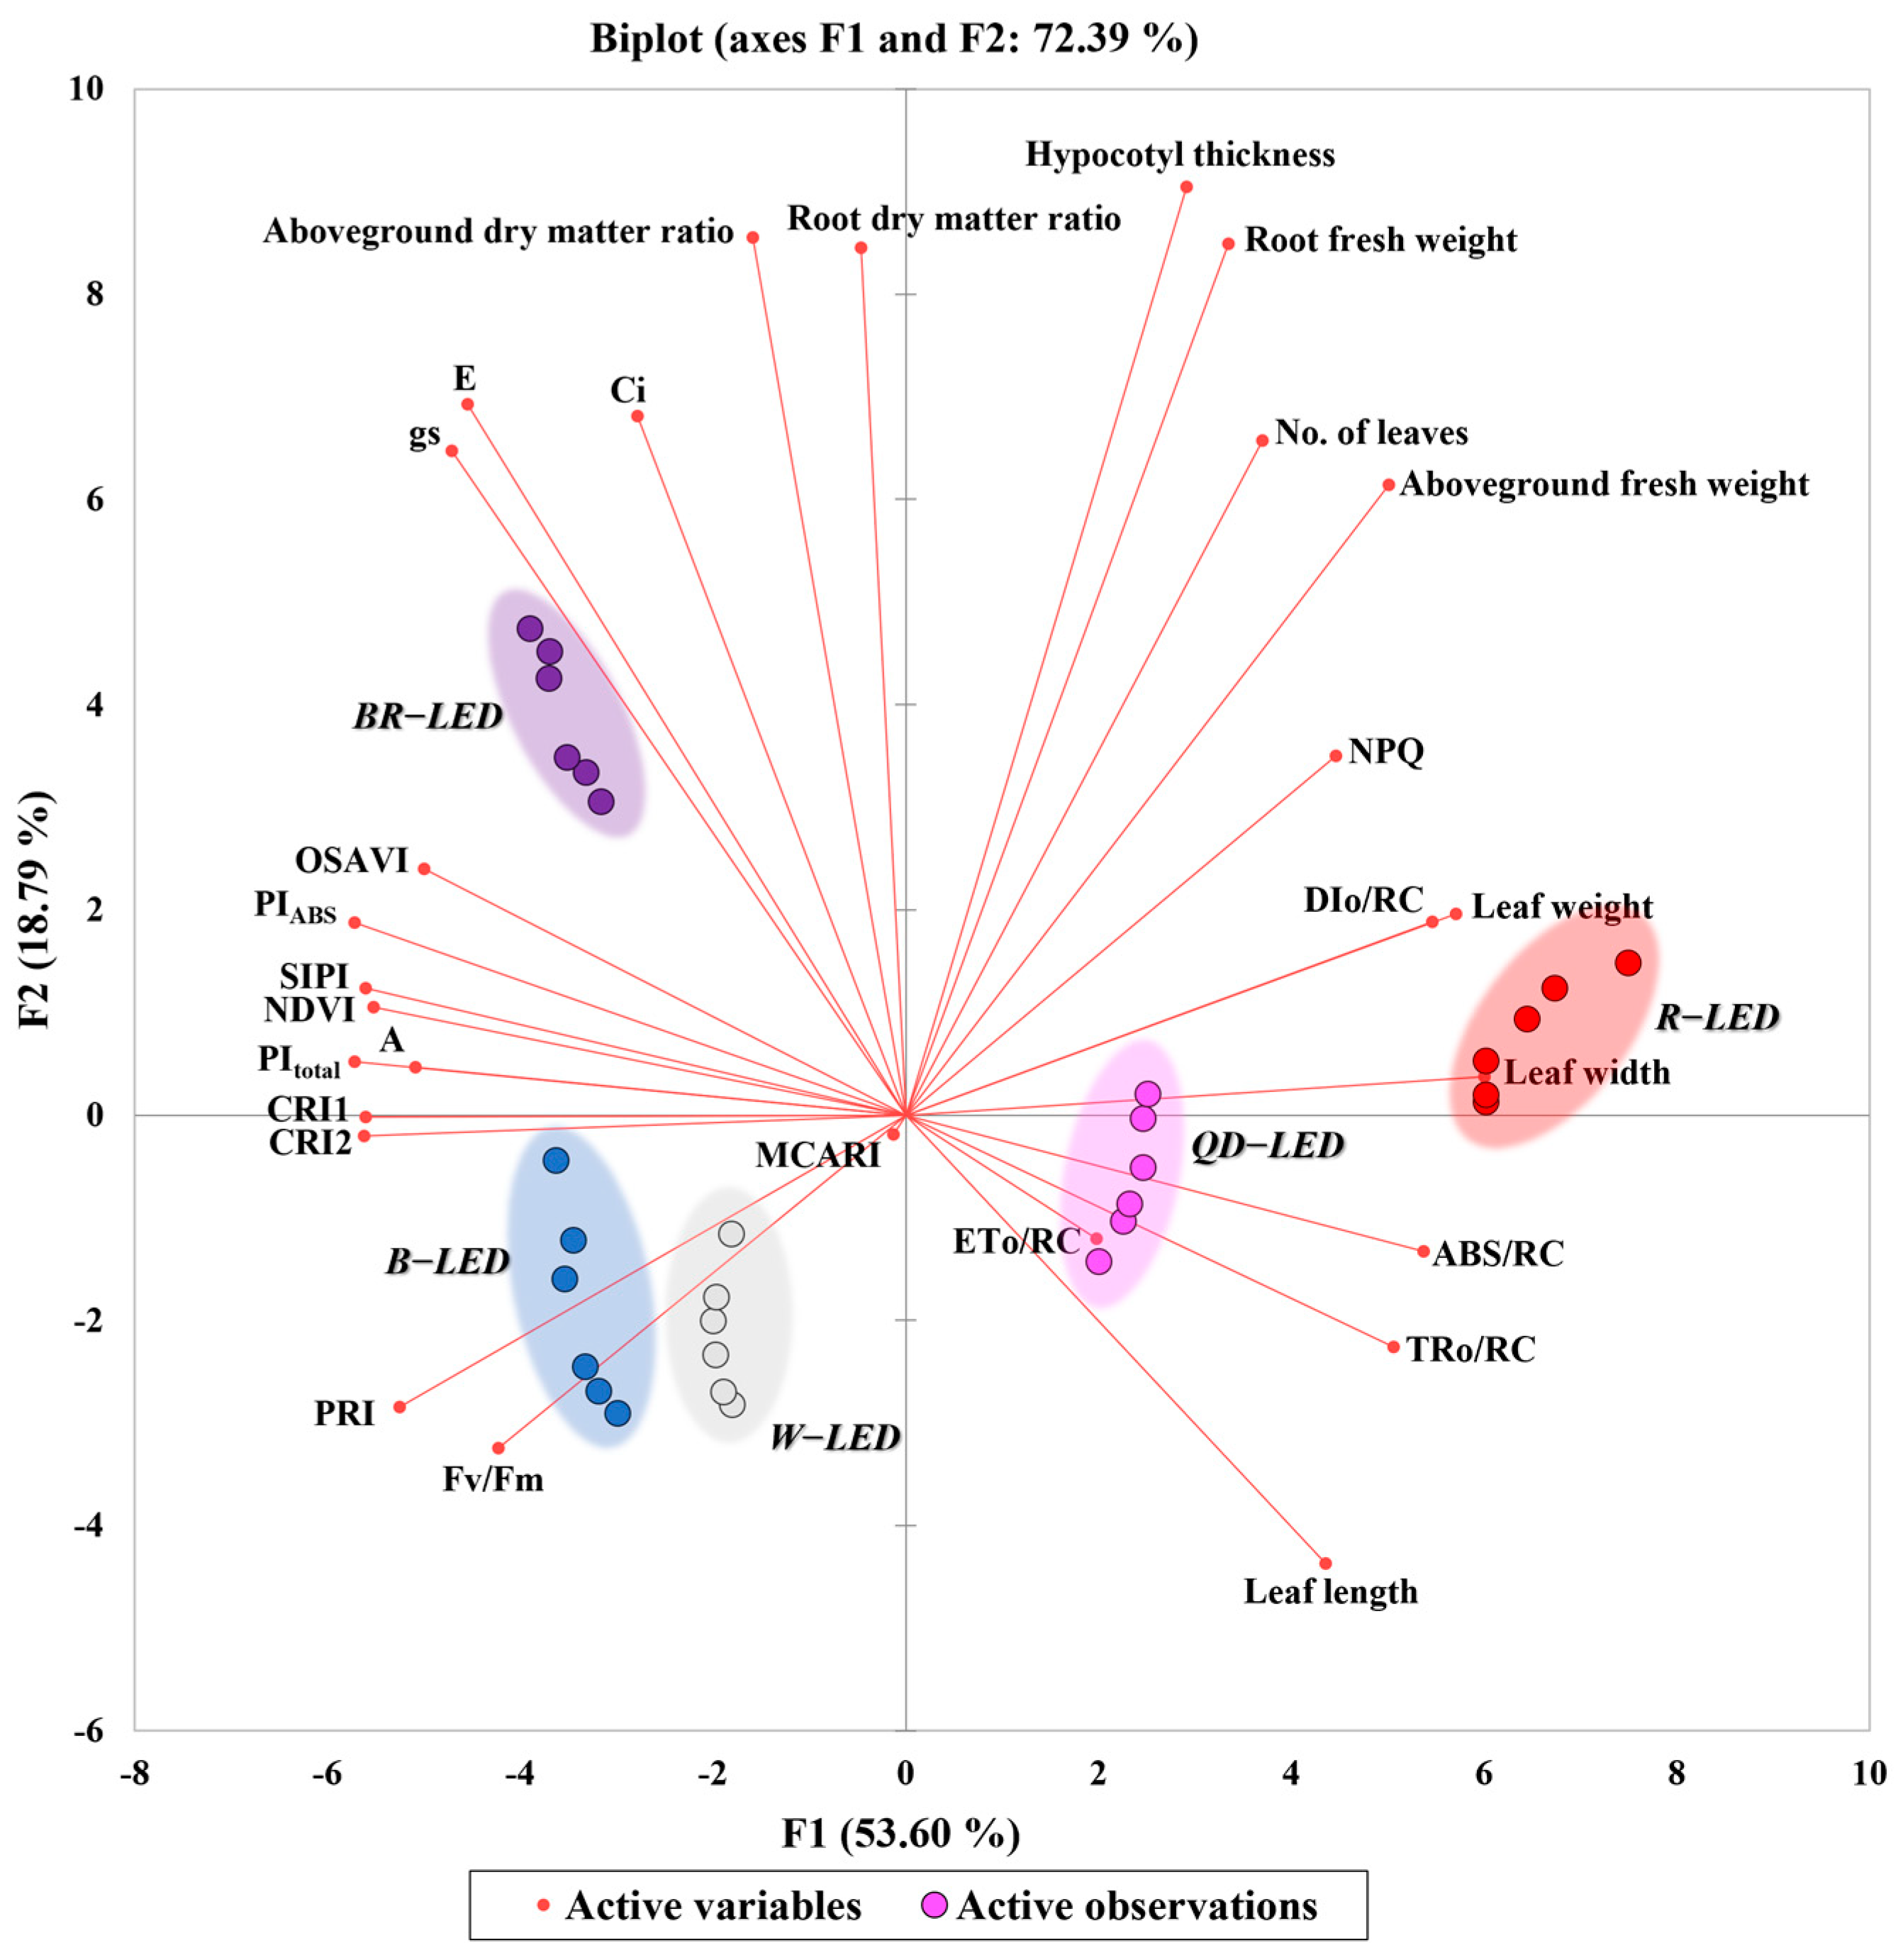
Principal component analysis is the most widely used multivariate technique in all scientific fields and is known to extract key information, express it as a new set of orthogonal variables called principal components, and display the similarity patterns of observations and variables as points on a map [34]. PCA can also explain correlations between investigated parameters and relationships between treatments [35]. In this study, principal component analysis was performed using spectral reflectance, photosynthetic performance, chlorophyll fluorescence, and growth parameters according to light quality, in order to determine which light quality influenced changes in each parameter (Figure 12). Factor 1 (F1) and Factor 2 (F2) together accounted for approximately 72.39% of the total variance, with F1 contributing ~53.60% and F2 ~18.79%. F1 was positively correlated with all growth parameters except for the aboveground and root dry matter ratios. In particular, the leaf width and leaf weight increased due to the effect of red light compared to other light qualities. ABS/RC, TRo/RC, and ETo/RC were increased by QD-LED, while DIo/RC was increased by R-LED. In the above correlation, ABS/RC and TRo/RC, which are associated with leaf morphology, exhibited strong positive correlations with leaf length and width (Figure 11). The measured values of these parameters were higher under QD-LEDs and R-LEDs (Table 3 and Figure 10). From visual inspection of lettuce morphologies photographed from the ground, it was clear that lettuce grown under QD-LED and R-LED had larger leaf areas compared to specimens grown under other treatments. This suggests that these plants could receive more light per unit area (Figure 8). Additionally, the PCA results showed that leaf length, leaf width, ABS/RC, and TRo/RC were increased under the influence of QD- and R-LED. Taking these results together, it can be proven once again that external changes in the photomorphogenesis of lettuce depending on light quality can cause differences in the degree of light energy absorption. Parameters related to photosynthetic performance (Ci, E, gs, A) showed a negative correlation with R- and QD-LED, while they appeared to be increased by BR- and B-LED. In addition to ABS/RC, TRo/RC, ETo/RC, and DIo/RC, the chlorophyll fluorescence, spectral reflectance, and photosynthetic performance were decreased by R- and QD-LED and increased by BR- and B-LED. CRI1 and CRI2, which are closely related to stress and carotenoid changes, were also affected by B-LED and showed their highest values, while the PRI was also increased by W- and B-LED (Figure 12).

4. Discussion

The NDVI, OSAVI, and MCARI, which are vegetation indices that can determine the vitality of crops in a non-destructive way, showed the highest vitality under B-LED except for MCARI (Figure 4). Vaštakaitė-Kairienė et al. [36] studied lettuce grown under LEDs composed of 5% blue (B, peak = 450 nm), 10% green (G, peak = 530 nm), and 85% red light (R, peak = 660 nm), and treated with additional blue light before the end of the day at various developmental stages to investigate the effects of blue light. The additional blue light had a negative effect on the PRI and NDVI during the lettuce seedling stage (day 8), while no significant changes were reported during the young leaf stages (day 15, day 25) [36]. These differing results from our study were likely due to differences in the growth stages of lettuce used in the light treatments, the duration of blue light exposure, and the intensity of the light. Conversely, even when mini red romaine lettuce was grown for 49 days under LEDs of various light qualities, the NDVI under 100% blue light was statistically significantly higher than that under 100% red light, BR-LED, W-LED, and wide red spectrum-LED [8]. Additionally, when growing pakchoi, adding blue and red light to 100% W-LEDs significantly increased the NDVI, OSAVI, and MCARI1 [37]. Under BR-LEDs with different intensity ratios of blue light and red light, the daily (18, 25, and 32 days) NDVI results were high even under BR-LEDs with enhanced blue light, and the OSAVI showed the same results even after 25 days. However, the MCARI was found to be more positively affected by red-enhanced BR-LEDs than by blue-enhanced BR-LEDs [1]. Unlike the NDVI and OSAVI, the MCARI, which is a chlorophyll absorption index and is closely related to chlorophyll changes, showed the highest results under QD-LED (Figure 4). This is because the MCARI is highly sensitive to changes in chlorophyll concentration and leaf area index (LAI). In fact, in this study, lettuce grown under QD-LED, as observed from ground-level photographs, had wider leaves compared to those in other treatment groups (Figure 8). The CRI1, CRI2, SIPI, and PRI are indices that are commonly related to stress. In particular, the CRI1, CRI2, and SIPI are closely related to changes in carotenoids, which are pigments, while the PRI is an index related to changes in photosynthetic quantum efficiency or changes in CO2 absorption ability. In this study, the CRI1, CRI2, SIPI, and PRI were highest under B-LED and lowest under R-LED (Figure 5). Previous research has also shown that blue light has an opposite effect to red light on crop color expression [8,38]—a well-known fact that aligns with the results of this study. However, unlike this study, previous studies reported that the CRI and PRI decreased when blue light was added before the end of the day compared to when blue light was not added [36]. Yudina et al. [1] also found that for lettuce grown on day 18, BR-LEDs enhanced with red light had higher carotenoid contents compared to BR-LEDs enhanced with blue light; however, after 25 days, the carotenoid contents increased significantly in the blue light-enhanced BR-LED treatment [1]. Given these results, it appears that an accumulation of blue light over a period of time is required to see its effect on the spectral reflectance associated with the pigment. In Brassica microgreens, when treated with different ratios of BR-LEDs, most spectral reflectance parameters, including the NDVI and CRI2, showed significantly lower values as the blue light ratio decreased to 50% or less. However, the PRI was highest under 100% blue light [39]. Taken together, it can be seen that spectral reflectance parameters can result in different results for various conditions, such as light quality, crop, variety, development stage, and number of days of treatment.
Photosynthesis is an essential biological process for plants to live, and improving the photosynthetic rate is known to be very important, as it is closely related to crop yield [40]. In this study, Ci, E, gs, and A were investigated as indicators related to photosynthetic performance, and among the various light qualities, lettuce grown under BR-LED showed the best results (Figure 6). The A results for W-LED were higher than those for the monochromatic B- and R-LED (Figure 6), showing similar results in Allium fistulosum L. Additionally, 100% blue light was more dominant in photosynthetic performance parameters such as Ci, E, gs, and A compared to 100% red light [41]. Gao et al. [41] reported that monochromatic light damages photosynthetic pigments, resulting in a decrease in total chlorophyll content compared to mixed light. This suggests that mixed light can be more effective for photosynthesis by maintaining photosynthetic pigments better than monochromatic light. When growing mini green romaine lettuce, the A of BR-LED was high, with a significant difference from W-LED in mixed light (Figure 6). Red basil in the vegetative growth stage also showed the same results as this study, but green basil did not. In addition, the Ci, E, and gs of both red and blue basil showed results that were contradictory to those of this study [42]. This was attributed to the ratio of blue, red, and green light within the W-LED. The ratio of blue light to red light under the BR-LED, which had the highest A in this study, was approximately B:R = 1:3 (Figure 6). Coriander also showed the highest net photosynthesis rate at the same ratio as the BR-LED used in this study, which was statistically significantly higher than that under monochromatic blue and red light [43]. Far-red light, which comprises ~18.1% of QD-LED, is known to mainly regulate the morphology, physiology, and biochemistry of plants in shady environments [44]. However, while QD-LED has various advantages, such as high photosynthesis efficiency and a wide light distribution angle compared to general LEDs, it did not show good results in photosynthesis parameters (Figure 6). Talbott et al. [45] reported that blue light and red light promote stomatal opening, with blue light particularly enhancing K+ accumulation in guard cells to increase the water potential and facilitate water’s influx into guard cells, thereby inducing stomatal opening. However, far-red light can reverse the stomatal opening induced by blue light [45]. This is likely associated with the statistically significantly lower stomatal conductance, assimilation rate, and photosynthetic rate observed under QD-LED compared to BR-LED in this study.
OJIP is an indicator that reveals the state of electron transfer processes during photosynthesis [46]. The O–J, J–I, and I–P phases represent the reduction states of PSII reaction centers, the plastoquinone (PQ) pool, and the electron acceptors on the PSI side, respectively [47]. As mentioned in the above results, R-LED showed the second-highest fluorescence intensity after QD-LED in the O–J phase, but it began to decrease from the J–I phase and showed a lower level than W-LED and B-LED. The last stage (I–P) was the lowest, along with BR-LED (Figure 7). This can be interpreted to mean that, unlike other light sources, when the intensity of monochromatic red light increases above a certain level, electron movement is suppressed and photosynthetic efficiency decreases. These results were the same in growth reaction experiments for Cyclocarya paliurus and Carpesium triste Maxim in vitro [48,49]. Fv/Fm is considered to be an indicator of photosynthetic efficiency and electron transport activity in plants [50]. The lowest Fv/Fm result of R-LED in this study may indicate that the transfer of more electrons from quinone A- (QA-) to the electron transport chain was inhibited by red light, thereby reducing the photochemical efficiency of PSII (Table 3). DIo/RC and NPQ were both highest under R-LED, showing significant differences from the other treatments (Table 3). Aliniaeifard et al. [51] reported that, in Calendula officinalis. L, the performance index for PSII per absorbed light and Fv/Fm decreased under red light, while the quantum yield of energy dissipation increased. They also noted that most of the absorbed light energy in the photosystem was dissipated as heat. ABS/RC, TRo/RC, and ETo/RC also showed the highest results under R-LED (Table 3). Zhao et al. [49] reported that this may be because photons absorbed by the inactive reaction center under red light moved to the active reaction center, and that the NPQ further increased because photons could not be effectively captured by the active center. B-LED’s PIABS was statistically the second-highest after BR-LED’s, which showed the highest results, and PItotal showed the highest results among all treatments. Additionally, DIo/RC and NPQ showed the lowest results statistically (Table 3). In cucumber leaves, electron transfer from the PSII donor side to PSI was inhibited by red light, and the non-optimization of photosystem activity was effectively alleviated by the addition of blue light [52]. In the study by MIAO et al. [52] and this study, the degree of difference in rankings and result values for PIABS and PItotal results between B- and BR-LED were different. This may have been due to differences in the crop or to a higher content of red light than in the BR-LED used in this study. In the green alga Haematococcus pluvialis, when monochromatic blue or red light is combined with a high proportion of blue light, electron transfer from quinone A (QA) to quinone B (QB) and from the PQ pool to the electron acceptors of PSI is enhanced. It has been reported that this enhances PIABS and PItotal. Conversely, it was reported that the quantum yield of thermal dissipation (φDo) and NPQ decreased [53].
In a previous study, it was reported that BR-LED had higher fluorescence intensity than red light at the I–P phase [49]. However, in this study, BR-LED was lower than other light qualities in all OJIP phases (Figure 7). In Brasenia schreberi seedlings, similar to the results of this study, the quantum yield of PSII and photochemical quenching results were lowest under BR-LED [54]. This is thought to be due to the difference in the mixing ratio of blue light and red light between the BR-LEDs used in the study by Zhao et al. [49] and in this study. The energy-flux-related parameters (ABS/RC, TRo/RC, ETo/RC, and DIo/RC) of lettuce grown under BR-LED were the lowest. However, BR-LED ultimately showed the highest results compared to other treatments in terms of PIABS and PItotal, which indicate the degree of electron acceptor reduction of PSII and PSI, as well as energy conservation performance (Table 3). Zhao et al. [49] reported that BR-LED was effective in the electron transfer process from quinone A (QA) to quinone B (QB) and showed higher activity in the photosynthetic apparatus. Furthermore, in a previous study on cucumber cultivation, it was reported that BR-LED (B:R = 1:8) promoted photosynthetic activity more effectively than R-LED (660 nm), increasing the electron transfer rates of PSII and PSI by 176.9% and 127.0%, respectively; it was also noted to enhance linear electron transfer by increasing electron transfer from QA to PSI [52]. W-LED, which showed the second-highest fluorescence intensity, is different from other light qualities used in this study and consists of the entire spectrum of 400–700 nm rather than a combination of only specific wavelengths. In particular, the W-LED used in this study contained a higher proportion of green light than of blue and red light (Figure 2). It has been reported that when this green light was used alone, the photosynthetic rate of leaves was more than twice as low as that of blue and red light in lettuce [55]. However, when mixed red and blue light was used in this study, Fv/Fm was the highest, and PIABS and PItotal showed high results together with no statistical difference from BR-LED and B-LED (Table 3). This indicates that full-spectrum rather than specific single wavelengths of light may be more effective in enhancing the photosynthetic performance of crops [56]; alternatively, similar to other previous studies, it suggests that results comparable to or better than those of BR-LED can be achieved even when green light, such as that used in the W-LED in this study, is mixed alongside blue and red light combinations [49,57]. The OJIP curve of QD-LED had the highest fluorescence intensity compared to the other light qualities, from start to finish (Figure 7). QD-LED showed the highest results after R-LED in parameters related to energy flux (ABS/RC, TRo/RC, ETo/RC, and DIo/RC) and NPQ. PIABS and PItotal were also lowest after R-LED (Table 3). From the perspective of the chlorophyll fluorescence results in this study, QD-LED was not as suitable for lettuce cultivation compared to other light qualities, similar to when using only red light. QD-LED has a mixed wavelength range of far-red light (738 nm) (Figure 2). It is known that the efficiency of monochromatic light for photosynthetic enhancement sharply declines beyond a wavelength of 685 nm, and wavelengths in the far-red region (λ > 700 nm) are also poorly absorbed by leaves, thereby minimally affecting the photosynthetic quantum yield [58]. Therefore, this study expected the Emerson synergistic effect of increasing the photosynthetic rate when long-wavelength (λ > 685 nm) and short-wavelength light were applied simultaneously rather than individually [9]. Zhen and van Iersel [58] reported that adding far-red light to warm W-LED and BR-LED increased the quantum yield of PSII (ΦPSII) by an average of 6.5% and 3.6%, respectively. It was also said that the loss of absorbed light as heat was reduced by reducing NPQ, and this was presumed to be because far-red light preferentially excites PSI. In addition, as the amount of far-red light increased, its effect increased asymptotically, and the increase in ΦPSII was related to the increase in net photosynthesis [58]. However, in the case of QD-LED, the blue light was the same as BR-LED at 24%, and the red light ratio was also the same, but it showed the lowest photosynthesis performance after R-LED (Table 3). This suggests that ~18% far-red light had an antagonistic effect with blue light, or that the ratio of far-red light, which had a complementary effect with red light, was not appropriate compared to red light. Zhen and van Iersel [58] stated that in order for photosynthesis to improve when two types of light (red light and far-red light) are combined, the two lights must complement one another, and PSII and PSI must be excessively excited. However, it is believed that the ratio of far-red light from the QD-LED used in this study was insufficient to excessively excite PSI. In a previous study, it was found that adding far-red light (735 nm) to BR-LED (B:R = 1:9) did not have a direct effect on biomass and only increased the light-use efficiency. Since this is related to the increase in light energy capture through the expansion of leaf area due to photomorphogenesis, far-red light does not necessarily have a direct effect on photosynthesis [59].
The aboveground fresh weight of lettuce grown under R-LED showed significantly higher results compared to the other treatments, being 31.6% heavier than lettuce grown under BR-LED, which had the second-highest results (Figure 9). In a previous study, the aboveground fresh weight of mini red romaine lettuce grown under monochromatic red light showed the highest result, with a statistically significant difference from the other treatments at the end of cultivation [8]. Izzo et al. [7] also reported that the leaf area and aboveground fresh weight of green and red lettuce were the best under 100% red light. Red light (600–680 nm) is stated to have greater efficiency in driving the photosynthesis of photons, measured as the amount of fixed CO2 or generated O2 per mole of absorbed photons, compared with blue and green light [58]. In this way, red light is considered to be the optimal light quality for improving aboveground fresh weight, but it has problems in terms of photomorphogenesis compared to other light qualities. Photomorphogenesis is an important plant process that is greatly influenced by the quality of light, and it is known that red light (600–700 nm) tends to promote the expansion of leaf area [7]. In this study, R-LED showed a significant difference from the other treatments and tended to produce higher leaf length and leaf width (Figure 10). However, cultivation under 100% red light often resulted in excessive elongation of the hypocotyl, leaf curling, and abnormal characteristics such as photosynthetic speed [8,60], which were also referred to as “red light syndrome” [61]. BR-LED was created by adding blue to compensate for the above shortcomings of red light. BR-LED is a light source that combines red light, which is excellent for growth but inefficient in terms of photosynthetic performance and photomorphogenesis, and blue light, which is effective in photosynthetic performance but disappointing in terms of growth, and can act differently on crops depending on various mixing ratios. In this study, the aboveground live weight of BR-LED was the second-highest after red light (Figure 9). This finding is consistent with those of Lee et al. [8], and it has also been reported that each leaf’s photosynthetic efficiency increased when blue light was increased by up to 66% along with red light [7]. Although the ratio of blue to red light in the BR-LED in this study was different (B:R = 1:3), Zhao et al. [49] also reported that the shoot diameter, biomass, and root system development of Carpesium triste Maxim were promoted under BR-LED (B:R = 1:1) compared to monochromatic blue, red, and white lights. They explained that this could be due to the spectral energy distribution of red and blue light aligning with chlorophyll absorption, thereby increasing the stomatal conductance and net photosynthetic rate. As a result, they observed that the plants became sturdier and more compact in form. Overall, in this study, BR-LED was considered to be the most suitable light source for lettuce cultivation. This is because BR-LED achieved the highest shoot biomass and excellent photosynthetic performance (A, PIABS, and PItotal) compared to other light sources, while effectively maintaining the natural shape of the crop. In this study, the aboveground fresh weight of lettuce grown under B-LED showed the lowest results (Figure 9), and the results were the same in the study by Lee et al. [8]. Blue light (400–500 nm) is generally known to inhibit cell division and expansion, thereby reducing leaf area [62]. It has been stated that the reduction in plant growth caused by strong blue light mainly arises from developmental limitations in radiation capture through photomorphogenesis [7]. As shown above, unlike red light, blue light is not very effective in terms of growth, but previous studies have shown positive results in the stomata and chloroplast development, stomatal conductance, and water-use efficiency of indoor plants [7,63]. Therefore, blue light can increase photosynthetic efficiency per unit leaf area [64] and help maintain productivity in young leaves and cultivation [65]. Hypocotyl thickness showed the lowest results under blue light (Figure 10) but showed a statistically high positive correlation with root fresh weight (Figure 11). However, in Arabidopsis thaliana and Solanum lycopersicum seedlings grown in blue light, they were thicker than in white and red light, and this difference appeared to depend on cell size rather than cell number [66]. The contrasting results observed in this study could be due to variations in how the crops themselves or different growth stages respond to different light qualities, particularly in terms of stem diameter. Alternatively, it can be inferred that, as growth progresses, underground development influenced by light qualities may have a greater impact than the direct effect of the light qualities themselves, as seen in the findings of this study. The results regarding growth, photosynthetic performance, and chlorophyll fluorescence parameters, excluding leaf number, were very similar between W-LED and B-LED (Figure 6, Table 3, and Figure 9). The W-LED used in this study contained 44.1% green light (500–599 nm) (Figure 2), and this range is known to be less absorbed by plant pigments and, thus, has less effect on vegetative growth and photosynthesis [67]. For this reason, green light is often used in combination with other light properties, rather than alone, in order to enhance plants’ growth and development. In fact, it has been reported that adding green light to BR-LED had a positive and significant effect on the leaf growth and photosynthetic activity of lettuce [68]. Furthermore, green light, similar to far-red light, has the advantage of being able to penetrate beneath the canopy, where light is less accessible, and reach overlapping areas between plants. This capability allows for energy transfer that can contribute to enhanced growth and photosynthesis [69]. However, in this study, the conditions did not provide enough shading within the canopy to achieve such effects, and there was minimal interference between individuals, making it difficult to obtain better results than under BR-LED. Furthermore, another reason could be that green light antagonizes the promotion of stomatal opening by blue light [70]. Recent studies have shown that far-red light not only increases photosynthetic efficiency but also improves the biomass of lettuce by increasing the capture of light energy through the expansion of leaf area via photomorphogenesis, rather than through direct photosynthesis [59]. An example of the above results is that stems within the canopy were elongated, leaves were expanded, and dry weight increased through an increase in far-infrared rays in the light [71]. However, in this study, both the aboveground fresh weight and dry matter ratio of QD-LED were lower, with significant differences compared to BR-LED. The leaf length under QD-LED was the longest compared to the other treatments, and the leaf width and leaf weight were approximately 16.5% and 23.2% higher than under BR-LED, respectively. However, in terms of the number of leaves, BR-LED exceeded QD-LED by more than 30.4%. In fact, in the correlation analysis, the number of leaves and aboveground fresh weight showed a statistically significant positive correlation, but this was not the case with leaf length, leaf width, and leaf weight (Figure 11). Based on the results of this study, it was determined that in order to properly see the effects of far-infrared rays, leaves must undergo morphological changes over a certain period of time through sufficient shade provided by overlapping crops during cultivation.
Spectral reflectance, photosynthetic performance, chlorophyll fluorescence, and growth-related parameters were analyzed for their correlations and PCA results (Figure 11 and Figure 12). Most of the spectral reflectance parameters showed negative correlations with DIo/RC and NPQ (Figure 11). These results were also shown in the PCA results, and the parameters related to spectral reflectance were increased by B- and BR-LED, while DIo/RC and NPQ were found to be greatly influenced by R-LED and QD-LED (Figure 12). Shin et al. [72] showed that the lower the NDVI result, the less the DIo/RC result tended to increase under various light sources for Cichorium intybus L. cultivars. In pakchoi (Brassica rapa subsp. chinensis), when blue light was added to white light, the NDVI, OSAVI, MCARI1, and SIPI all increased significantly compared to general white light, and the same increase was observed when red light was added [37]. In addition, a previous study showed that when W-LED was combined with blue light, carotenoids increased by ~15%, while when it was combined with red light, they decreased [73]. What is interesting about the PCA results is the clear distinction of the light quality that influenced key parameters related to photosynthetic performance (A, PIABS, and PItotal) and leaf growth (aboveground fresh weight, leaf length, leaf width). Although the measurement methods differed, parameters related to final photosynthetic performance (such as A, PIABS, and PItotal) appeared to increase under the influence of BR- or B-LED. Strong statistically significant correlations were observed among these parameters (Figure 11 and Figure 12). Izzo et al. [7] also reported that when cultivating red and green lettuce, the photosynthetic rate was significantly higher when 100% blue light or a mixture of red and blue light was used than when 100% red light was used, and the results of stomatal conductance and transpiration were the same. In raspberries, the photosynthesis rate was also highest under B-LED, followed by BR-LED [74]. In cucumber leaves, the results of PIABS and PItotal were increased more for B- and BR-LED than for R-LED [52]. In this study, ABS/RC and TRo/RC were increased by R-LED and QD-LED. This was believed to be due to the photomorphogenic effects of R-LED and QD-LED influencing leaf length and width. Correlation analysis showed a proportional relationship of ABS/RC and TRo/RC with leaf length and width (Figure 11 and Figure 12). This was the same as that in Carpesium triste Maxim, where the results of ABS/RC, TRo/RC, and leaf length were higher for R-LED than for B-, BR-, and W-LED [49]. Growth parameters related to leaf shape, which are most important for photosynthesis, were found to be increased under the influence of R-LED and QD-LED (Figure 12). In a previous study, the leaf area of red and green lettuce grown under a monochromatic red light was statistically significantly larger than when grown under various ratios of BR-LED, and the leaf shape index also showed the highest results in lettuce grown under red light [75]. Tan et al. [76] stated that when the R/Fr ratio is low, it increases the expansiveness of cell walls within plant cells, leading to an increase in leaf area and control over leaf orientation towards incident light; they further suggested that an increase in far-red light reduces the overlapping area between leaves, optimizing light interception [77]. Through this, far-red light changes the shape of the plant’s leaves, allowing them to better absorb light energy, and it is believed that this can affect the increases in ABS/RC and TRo/RC.

5. Conclusions

This study compared and analyzed spectral reflectance, photosynthetic performance, chlorophyll fluorescence, and growth changes when mini green romaine lettuce was grown indoors hydroponically under various light conditions. Overall, the results indicate that the lettuce underwent significant variations depending on the different artificial lighting conditions under which it was cultivated. The R- and QD-LED treatments were generally beneficial in promoting increases in growth parameters, significantly enhancing the aboveground fresh weight of lettuce. Moreover, they expanded the individual leaf size (i.e., leaf length and width) compared to the other treatments, facilitating easier absorption of external light energy. However, the results of most parameters related to spectral reflectance, photosynthetic performance, and chlorophyll fluorescence indicated poorer outcomes compared to other light treatments, despite the positive effects on external changes due to lettuce photomorphogenesis. A, PIABS, and PItotal, which are the most important parameters in photosynthetic performance and chlorophyll fluorescence parameters, increased the most under BR-LED, followed by W- and B-LED. In the case of BR-LED, as reported in many studies, this was believed to be a result of the interaction of blue light and red light, and the selection of the ratio is important because the results vary. Following BR-LED, the high photosynthetic performance results under W-LED were attributed to the influence of low levels of red light and high levels of green light within the light source. B-LED clearly demonstrated positive effects on various photosynthesis-related parameters associated with blue light compared to red light. The ratio of blue to red light in BR-LED and QD-LED was similar, but their outcomes showed opposite trends. This was attributed to the far-red light contained in QD-LEDs. In summary, the results showed that effective light quality can vary depending on the purpose of growing crops (external/internal), and that appropriate mixing through analysis of the characteristics of each light quality can be more positive than monochromatic light. In addition, in indoor cultivation of lettuce, the increase in the aboveground fresh weight of lettuce was found to be largely influenced by changes in photomorphogenesis rather than photosynthetic performance. This means that when growing indoors using artificial light sources, it is important to improve photosynthetic performance, but structural changes in crops due to photomorphogenesis depending on light quality also need to be taken into consideration. These results can be used as basic data for actual crop growers to select the right quality of artificial light sources.

Author Contributions

Conceptualization, J.H.L. and H.-M.K.; methodology, J.H.L., Y.B.K. and H.-M.K.; software, Y.B.K.; validation, I.-L.C., H.S.Y. and H.-M.K.; formal analysis, J.H.L. and Y.B.K.; investigation, J.H.L. and Y.B.K.; resources, J.K., Y.K. and H.-M.K.; data curation, J.H.L. and Y.B.K.; writing—original draft preparation, J.H.L.; writing—review and editing, H.S.Y. and H.-M.K.; visualization, J.H.L. and Y.B.K.; supervision, H.-M.K.; project administration, J.K., Y.K. and H.-M.K.; funding acquisition, H.-M.K. All authors have read and agreed to the published version of the manuscript.

Funding

This work was supported by the Korea Institute of Planning and Evaluation for Technology in Food, Agriculture and Forestry (IPET) through the Technology Commercialization Support Program, which was funded by the Ministry of Agriculture, Food and Rural Affairs (MAFRA) (122056-3), and the Republic of Korea and the Basic Science Research Program through the National Research Foundation of Korea (NRF) funded by the Ministry of Education (NRF-2021R1A6A1A03044242).

Data Availability Statement

The original contributions presented in the study are included in the article, further inquiries can be directed to the corresponding author.

Acknowledgments

The authors express special thanks to the professor and laboratory personnel for their aid during this experiment.

Conflicts of Interest

Author Jidong Kim was employed by the company FutureGreen Co., Ltd. The remaining authors declare that the research was conducted in the absence of any commercial or financial relationships that could be construed as a potential conflict of interest.

References

  1. Yudina, L.; Sukhova, E.; Mudrilov, M.; Nerush, V.; Pecherina, A.; Smirnov, A.A.; Dorokhov, A.S.; Chilingaryan, N.O.; Vodeneev, V.; Sukhov, V. Ratio of intensities of blue and red light at cultivation influences photosynthetic light reactions, respiration, growth, and reflectance indices in lettuce. Biology 2022, 11, 60. [Google Scholar] [CrossRef] [PubMed]
  2. Kaiser, E.; Morales, A.; Harbinson, J. Fluctuating light takes crop photosynthesis on a rollercoaster ride. Plant Physiol. 2018, 176, 977–989. [Google Scholar] [CrossRef] [PubMed]
  3. Sukhova, E.; Khlopkov, A.; Vodeneev, V.; Sukhov, V. Simulation of a nonphotochemical quenching in plant leaf under different light intensities. Biochim. Biophys. Acta (BBA)-Bioenerg. 2020, 1861, 148138. [Google Scholar] [CrossRef] [PubMed]
  4. Landi, M.; Zivcak, M.; Sytar, O.; Brestic, M.; Allakhverdiev, S.I. Plasticity of photosynthetic processes and the accumulation of secondary metabolites in plants in response to monochromatic light environments: A review. Biochim. Biophys. Acta (BBA)-Bioenerg. 2020, 1861, 148131. [Google Scholar] [CrossRef] [PubMed]
  5. Parys, E.; Krupnik, T.; Kułak, I.; Kania, K.; Romanowska, E. Photosynthesis of the Cyanidioschyzon merolae cells in blue, red, and white light. Photosynth. Res. 2021, 147, 61–73. [Google Scholar] [CrossRef] [PubMed]
  6. Izzo, L.G.; Mele, B.H.; Vitale, L.; Vitale, E.; Arena, C. The role of monochromatic red and blue light in tomato early photomorphogenesis and photosynthetic traits. Environ. Exp. Bot. 2020, 179, 104195. [Google Scholar] [CrossRef]
  7. Izzo, L.G.; Mickens, M.A.; Aronne, G.; Gómez, C. Spectral effects of blue and red light on growth, anatomy, and physiology of lettuce. Physiol. Plant 2021, 172, 2191–2202. [Google Scholar] [CrossRef] [PubMed]
  8. Lee, J.H.; Kwon, Y.B.; Roh, Y.H.; Choi, I.L.; Kim, J.; Kim, Y.; Yoon, H.S.; Kang, H.M. Effect of various LED light qualities, including wide red spectrum-LED, on the growth and quality of mini red romaine lettuce (cv. Breen). Plants 2023, 12, 2056. [Google Scholar] [CrossRef]
  9. Han, S.J.; Choi, I.L.; Kim, J.Y.; Shin, Y.G.; Kang, H.M. Influence of LED and Quantum dot-LED (QD-LED) Irradiation on the Germination and Growth of Cherry Tomato in Plant Factory. Hortic Sci Technol. 2018, 36 (Suppl. I), 78–79. [Google Scholar]
  10. Lee, J.H.; Choi, D.H.; Roh, Y.H.; Kwon, Y.B.; Afolabi, A.S.; Choi, I.L.; Kim, Y.; Shin, J.C.; Kim, M.; Kim, J.; et al. Comparison of Quality, Yield and Economic Feasibility of Cherry Tomato (Solanum lycopersicum var. cerasiforme) Fruit under Quantum Dot LED (QD-LED) and White-LED. J. Agric. Life Environ. Sci. 2022, 34, 181–193. [Google Scholar]
  11. Vitasek, J.; Stratil, T.; Latal, J.; Kolar, J.; Wilcek, Z. Indoor illumination imitating optical parameters of sunny summer daylight. Opt. Laser Technol. 2020, 124, 105965. [Google Scholar] [CrossRef]
  12. Rantanen, M.; Hytönen, T.; Elomaa, P.; Halonen, L.; Pinho, P. Horticultural LED Lighting-After All, Warm Might Be Better. Sähkö Tele. 2010, 8, 31–32. [Google Scholar]
  13. Hayashi, E. Current status of commercial plant factories with LED lighting market in Asia, Europe, and other regions. In LED Lighting for Urban Agriculture; Springer: New York, NY, USA, 2016; pp. 295–308. [Google Scholar]
  14. Semenova, N.A.; Smirnov, A.A.; Dorokhov, A.S.; Proshkin, Y.A.; Ivanitskikh, A.S.; Chilingaryan, N.O.; Dorokhov, A.A.; Yanykin, D.V.; Gudkov, S.V.; Izmailov, A.Y. Evaluation of the Effectiveness of Different LED Irradiators When Growing Red Mustard (Brassica juncea L.) in Indoor Farming. Energies 2022, 15, 8076. [Google Scholar] [CrossRef]
  15. Xue, J.; Su, B. Significant remote sensing vegetation indices: A review of developments and applications. J. Sens. 2017, 1353691. [Google Scholar] [CrossRef]
  16. Sun, J.; Yang, L.; Yang, X.; Wei, J.; Li, L.; Guo, E.; Kong, Y. Using spectral reflectance to estimate the leaf chlorophyll content of maize inoculated with arbuscular mycorrhizal fungi under water stress. Front. Plant Sci. 2021, 12, 646173. [Google Scholar] [CrossRef]
  17. Devlin, P.F.; Christie, J.M.; Terry, M.J. Many hands make light work. J. Exp. Bot. 2007, 58, 3071–3077. [Google Scholar] [CrossRef]
  18. Modarelli, G.C.; Paradiso, R.; Arena, C.; De Pascale, S.; Van Labeke, M.C. High light intensity from blue-red LEDs enhance photosynthetic performance, plant growth, and optical properties of red lettuce in controlled environment. Horticulture 2022, 8, 114. [Google Scholar] [CrossRef]
  19. Elmardy, N.A.; Yousef, A.F.; Lin, K.; Zhang, X.; Ali, M.M.; Lamlom, S.F.; Kalaji, H.M.; Kowalczyk, K.; Xu, Y. Photosynthetic performance of rocket (Eruca sativa. Mill.) grown under different regimes of light intensity, quality, and photoperiod. PLoS ONE 2021, 16, e0257745. [Google Scholar] [CrossRef] [PubMed]
  20. Fang, L.; Ma, Z.; Wang, Q.; Nian, H.; Ma, Q.; Huang, Q.; Mu, Y. Plant growth and photosynthetic characteristics of soybean seedlings under different LED lighting quality conditions. J. Plant Growth Regul. 2021, 40, 668–678. [Google Scholar] [CrossRef]
  21. Zhen, S.; Haidekker, M.; van Iersel, M.W. Far-red light enhances photochemical efficiency in a wavelength-dependent manner. Physiol. Plant 2019, 167, 21–33. [Google Scholar] [CrossRef]
  22. Torres, R.; Romero, J.M.; Lagorio, M.G. Effects of sub-optimal illumination in plants. Comprehensive chlorophyll fluorescence analysis. J. Photochem. Photobiol. B Biol. 2021, 218, 112182. [Google Scholar] [CrossRef] [PubMed]
  23. Adams, W.W., III; Demmig-Adams, B. Chlorophyll fluorescence as a tool to monitor plant response to the environment. In Chlorophyll a Fluorescence: A Signature of Photosynthesis; Springer: Dordrecht, The Netherlands, 2004; pp. 583–604. [Google Scholar]
  24. Baker, N.R. Chlorophyll fluorescence: A probe of photosynthesis in vivo. Annu. Rev. Plant Biol. 2008, 59, 89–113. [Google Scholar] [CrossRef] [PubMed]
  25. Strasser, R.J.; Srivastava, A.; Tsimilli-Michael, M. The fluorescence transient as a tool to characterize and screen photosynthetic samples. Probing Photosynth. Mech. Regul. Adapt. 2000, 25, 445–483. [Google Scholar]
  26. Strasser, R.J.; Tsimilli–Michael, M.; Srivastava, A. Analysis of the chlorophyll fluorescence transient. In Chlorophyll Fluorescence: A Signature of Photosynthesis, Advances in Photosynthesis and Respiration; Papageorgiou, G.C., Ed.; Springer: Dordrecht, The Netherlands, 2004; Volume 19, pp. 321–362. [Google Scholar]
  27. Govindjee, G. Sixty-three years since Kautsky: Chlorophyll a fluorescence. J. Aust. Plant Physiol. 1995, 22, 131–160. [Google Scholar] [CrossRef]
  28. Gao, S.; Liu, X.; Liu, Y.; Cao, B.; Chen, Z.; Xu, K. Response of growth, photosynthetic electron transfer, and chloroplast ultrastructure to different LED light combination in green onion (Allium fistulosum L.). Physiol. Plant 2021, 172, 1662–1672. [Google Scholar] [CrossRef] [PubMed]
  29. Ghorbanzadeh, P.; Aliniaeifard, S.; Esmaeili, M.; Mashal, M.; Azadegan, B.; Seif, M. Dependency of growth, water use efficiency, chlorophyll fluorescence, and stomatal characteristics of lettuce plants to light intensity. J. Plant Growth Regul. 2021, 40, 2191–2207. [Google Scholar] [CrossRef]
  30. Spanic, V.; Mlinaric, S.; Zdunic, Z.; Katanic, Z. Field study of the effects of two different environmental conditions on wheat productivity and chlorophyll fluorescence induction (OJIP) parameters. Agriculture 2021, 11, 1154. [Google Scholar] [CrossRef]
  31. Zhu, L.; Wen, W.; Thorpe, M.R.; Hocart, C.H.; Song, X. Combining heat stress with pre-existing drought exacerbated the effects on chlorophyll fluorescence rise kinetics in four contrasting plant species. Int. J. Mol. Sci. 2021, 22, 10682. [Google Scholar] [CrossRef] [PubMed]
  32. Lima-Moro, A.; Bertoli, S.C.; Braga-Reis, I.; Moro, E.; Ziliani, R.R.; Spolaor, B.O.; de Freitas, Í.R.; dos Santos, B.L. Photosynthetic activity and OJIP fluorescence with the application of a nutritional solution. Acta Physiol. Plant 2022, 44, 67. [Google Scholar] [CrossRef]
  33. Stribet, A.; Govindjee. On the relation between the Kautsky effect (chlorophyll a fluorescence induction) and Photosystem II: Basics and applications of the OJIP fluorescence transient. J. Photochem. Phobiol. B. 2011, 104, 236–257. [Google Scholar] [CrossRef] [PubMed]
  34. Abdi, H.; Williams, L.J. Principal component analysis. Wiley Interdiscip. Rev. Comput. Stat. 2010, 2, 433–459. [Google Scholar] [CrossRef]
  35. Haile, M.; Bae, H.M.; Kang, W.H. Comparison of the antioxidant activities and volatile compounds of coffee beans obtained using digestive bio-processing (elephant dung coffee) and commonly known processing methods. Antioxidants 2020, 9, 408. [Google Scholar] [CrossRef]
  36. Vaštakaitė-Kairienė, V.; Samuolienė, G.; Šveikauskas, V.; Laužikė, K.; Jurkonienė, S. The influence of end-of-day blue light on the growth, photosynthetic, and metabolic parameters of lettuce at different development stages. Plants 2022, 11, 2798. [Google Scholar] [CrossRef]
  37. Tayade, R.; Kim, Y. Effect of Different Red and Blue Light Compositions on the Root and Shoot Growth of Pakchoi (Brassica rapa subsp. chinensis) Using Food Jukebox. J. Korean Soc. Int. Agric. 2022, 34, 49–56. [Google Scholar] [CrossRef]
  38. Xie, B.-X.; Wei, J.-J.; Zhang, Y.-T.; Song, S.-W.; Su, W.; Sun, G.-W.; Hao, Y.-W.; Liu, H.-C. Supplemental blue and red light promote lycopene synthesis in tomato fruits. J. Integr. Agric. 2019, 18, 590–598. [Google Scholar] [CrossRef]
  39. Brazaitytė, A.; Miliauskienė, J.; Vaštakaitė-Kairienė, V.; Sutulienė, R.; Laužikė, K.; Duchovskis, P.; Małek, S. Effect of different ratios of blue and red led light on brassicaceae microgreens under a controlled environment. Plants 2021, 10, 801. [Google Scholar] [CrossRef]
  40. Long, S.P.; Marshall-Colon, A.; Zhu, X.G. Meeting the global food demand of the future by engineering crop photosynthesis and yield potential. Cell 2015, 161, 56–66. [Google Scholar] [CrossRef]
  41. Gao, S.; Liu, X.; Liu, Y.; Cao, B.; Chen, Z.; Xu, K. Photosynthetic characteristics and chloroplast ultrastructure of welsh onion (Allium fistulosum L.) grown under different LED wavelengths. BMC Plant Biol. 2020, 20, 1–12. [Google Scholar]
  42. Chutimanukul, P.; Wanichananan, P.; Janta, S.; Toojinda, T.; Darwell, C.T.; Mosaleeyanon, K. The influence of different light spectra on physiological responses, antioxidant capacity and chemical compositions in two holy basil cultivars. Sci. Rep. 2022, 12, 588. [Google Scholar] [CrossRef] [PubMed]
  43. Gao, Q.; Liao, Q.; Li, Q.; Yang, Q.; Wang, F.; Li, J. Effects of LED red and blue light component on growth and photosynthetic characteristics of coriander in plant factory. Horticulturae 2022, 8, 1165. [Google Scholar] [CrossRef]
  44. Kurepin, L.V.; Walton, L.J.; Reid, D.M.; Pharis, R.P.; Chinnappa, C.C. Growth and ethylene evolution by shade and sun ecotypes of Stellaria longipes in response to varied light quality and irradiance. Plant Cell Environ. 2006, 29, 647–652. [Google Scholar] [CrossRef]
  45. Talbott, L.D.; Shmayevich, I.J.; Chung, Y.; Hammad, J.W.; Zeiger, E. Blue light and phytochrome-mediated stomatal opening in the npq1 and phot1 phot2 mutants of Arabidopsis. Plant Physiol. 2003, 133, 1522–1529. [Google Scholar] [CrossRef] [PubMed]
  46. Tóth, S.Z.; Schansker, G.; Garab, G.; Strasser, R.J. Photosynthetic electron transport activity in heat-treated barley leaves: The role of internal alternative electron donors to photosystem II. Biochim. Biophys. Acta (BBA)-Bioenerg. 2007, 1767, 295–305. [Google Scholar] [CrossRef] [PubMed]
  47. Schansker, G.; Tóth, S.Z.; Holzwarth, A.R.; Garab, G. Chlorophyll a fluorescence: Beyond the limits of the QA model. Photosynth. Res. 2014, 120, 43–58. [Google Scholar] [CrossRef] [PubMed]
  48. Liu, Y.; Wang, T.; Fang, S.; Zhou, M.; Qin, J. Responses of morphology, gas exchange, photochemical activity of photosystem II, and antioxidant balance in Cyclocarya paliurus to light spectra. Front. Plant Sci. 2018, 9, 1704. [Google Scholar] [CrossRef]
  49. Zhao, J.; Thi, L.T.; Park, Y.G.; Jeong, B.R. Light quality affects growth and physiology of Carpesium triste Maxim. cultured in vitro. Agriculture 2020, 10, 258. [Google Scholar] [CrossRef]
  50. Shangguan, Z.; Shao, M.; Dyckmans, J. Effects of nitrogen nutrition and water deficit on net photosynthetic rate and chlorophyll fluorescence in winter wheat. J. Plant Physiol. 2000, 156, 46–51. [Google Scholar] [CrossRef]
  51. Aliniaeifard, S.; Seif, M.; Arab, M.; Zare Mehrjerdi, M.; Li, T.; Lastochkina, O. Growth and photosynthetic performance of Calendula officinalis under monochromatic red light. Int. J. Hortic. Sci. Technol. 2018, 5, 123–132. [Google Scholar]
  52. MIAO, Y.X.; WANG, X.Z.; GAO, L.H.; CHEN, Q.Y.; Mei, Q.U. Blue light is more essential than red light for maintaining the activities of photosystem II and I and photosynthetic electron transport capacity in cucumber leaves. J. Integr. Agric. 2016, 15, 87–100. [Google Scholar] [CrossRef]
  53. Jin, C.; Zhou, Z.; Zhu, Y.; Liu, Q.; Zhou, X. Photosynthetic activity and astaxanthin production of Haematococcus pluvialis regulated by manipulated light quality. Aquac Int. 2023, 32, 3617–3635. [Google Scholar] [CrossRef]
  54. Li, J.; Yi, C.; Zhang, C.; Pan, F.; Xie, C.; Zhou, W.; Zhou, C. Effects of light quality on leaf growth and photosynthetic fluorescence of Brasenia schreberi seedlings. Heliyon 2021, 7, e06082. [Google Scholar] [CrossRef] [PubMed]
  55. Kang, W.H.; Park, J.S.; Park, K.S.; Son, J.E. Leaf photosynthetic rate, growth, and morphology of lettuce under different fractions of red, blue, and green light from light-emitting diodes (LEDs). Hortic. Environ. Biotechnol. 2016, 57, 573–579. [Google Scholar] [CrossRef]
  56. Wang, H.; Gu, M.; Cui, J.; Shi, K.; Zhou, Y.; Yu, J. Effects of light quality on CO2 assimilation, chlorophyll-fluorescence quenching, expression of Calvin cycle genes and carbohydrate accumulation in Cucumis sativus. J. Photochem. Photobiol. B Biol. 2009, 96, 30–37. [Google Scholar] [CrossRef] [PubMed]
  57. Moazzeni, M.; Reezi, S.; Ghehsareh, M.G. Growth and chlorophyll fluorescence characteristics of Sinningia speciosa under red, blue and white light-emitting diodes and sunlight. Adv. Hortic. Sci. 2020, 34, 419–430. [Google Scholar]
  58. Zhen, S.; van Iersel, M.W. Far-red light is needed for efficient photochemistry and photosynthesis. J. Plant Physiol. 2017, 209, 115–122. [Google Scholar] [CrossRef]
  59. Van de Velde, E.; Steppe, K.; Van Labeke, M.C. Leaf morphology, optical characteristics and phytochemical traits of butterhead lettuce affected by increasing the far-red photon flux. Front. Plant Sci. 2023, 14, 1129335. [Google Scholar] [CrossRef]
  60. Matsuda, R.; Ohashi-Kaneko, K.; Fujiwara, K.; Goto, E.; Kurata, K. Photosynthetic characteristics of rice leaves grown under red light with or without supplemental blue light. Plant Cell Physiol. 2004, 45, 1870–1874. [Google Scholar] [CrossRef]
  61. Miao, Y.; Chen, Q.; Qu, M.; Gao, L.; Hou, L. Blue light alleviates ‘red light syndrome’by regulating chloroplast ultrastructure, photosynthetic traits and nutrient accumulation in cucumber plants. Sci. Hortic. 2019, 257, 108680. [Google Scholar] [CrossRef]
  62. Dougher, T.A.; Bugbee, B. Long-term blue light effects on the histology of lettuce and soybean leaves and stems. J. Am. Soc. Hortic. Sci. 2004, 129, 467–472. [Google Scholar] [CrossRef]
  63. Samuolienė, G.; Viršilė, A.; Haimi, P.; Miliauskienė, J. Photoresponse to different lighting strategies during red leaf lettuce growth. J. Photochem. Photobiol. B Biol. 2020, 202, 111726. [Google Scholar] [CrossRef]
  64. Bugbee, B. Toward an optimal spectral quality for plant growth and development: The importance of radiation capture. Acta Hortic. 2016, 1134, 1–12. [Google Scholar] [CrossRef]
  65. Carvalho, S.D.; Folta, K.M. Environmentally modified organisms–expanding genetic potential with light. Crit. Rev. Plant Sci. 2014, 33, 486–508. [Google Scholar] [CrossRef]
  66. Spaninks, K.; Lamers, G.; van Lieshout, J.; Offringa, R. Light quality regulates apical and primary radial growth of Arabidopsis thaliana and Solanum lycopersicum. Sci. Hortic. 2023, 317, 112082. [Google Scholar] [CrossRef]
  67. Singh, D.; Basu, C.; Meinhardt-Wollweber, M.; Roth, B. LEDs for energy efficient greenhouse lighting. Renew. Sustain. Energy Rev. 2015, 49, 139–147. [Google Scholar] [CrossRef]
  68. Kamal, K.Y.; Khodaeiaminjan, M.; El-Tantawy, A.A.; Moneim, D.A.; Salam, A.A.; Ash-shormillesy, S.M.A.I.; Attia, A.; Ali, M.A.S.; Herranz, R.; El-Esawi, M.A.; et al. Evaluation of growth and nutritional value of Brassica microgreens grown under red, blue and green LEDs combinations. Physiol. Plant. 2020, 169, 625–638. [Google Scholar] [CrossRef] [PubMed]
  69. Smith, H.L.; McAusland, L.; Murchie, E.H. Don’t ignore the green light: Exploring diverse roles in plant processes. J. Exp. Bot. 2017, 68, 2099–2110. [Google Scholar] [CrossRef]
  70. Talbott, L.D.; Hammad, J.W.; Harn, L.C.; Nguyen, V.H.; Patel, J.; Zeiger, E. Reversal by green light of blue light-stimulated stomatal opening in intact, attached leaves of Arabidopsis operates only in the potassium-dependent, morning phase of movement. Plant Cell Physiol. 2006, 47, 332–339. [Google Scholar] [CrossRef]
  71. Jin, W.; Urbina, J.L.; Heuvelink, E.; Marcelis, L.F. Adding far-red to red-blue light-emitting diode light promotes yield of lettuce at different planting densities. Front. Plant Sci. 2021, 11, 609977. [Google Scholar] [CrossRef]
  72. Shin, E.J.; Lee, J.H.; Nam, S.Y. Evaluation of Growth, Vegetation Indices, and Photosynthesis of Cichorium intybus L. Seedlings as Affected by LED Light Qualities in a Closed Nursery Facility. Hortic. Sci. Technol. 2024, 42, 350–364. [Google Scholar] [CrossRef]
  73. Frede, K.; Baldermann, S. Accumulation of carotenoids in Brassica rapa ssp. chinensis by a high proportion of blue in the light spectrum. Photochem. Photobiol. Sci. 2022, 21, 1947–1959. [Google Scholar] [CrossRef] [PubMed]
  74. Nacheva, L.; Dimitrova, N.; Koleva-Valkova, L.; Tarakanov, I.; Vassilev, A. Effect of led lighting on the growth of raspberry (Rubus idaeus L.) plants in vitro. Agric. Sci. 2021, 13, 126–140. [Google Scholar] [CrossRef]
  75. Son, K.H.; Oh, M.M. Leaf shape, growth, and antioxidant phenolic compounds of two lettuce cultivars grown under various combinations of blue and red light-emitting diodes. HortScience 2013, 48, 988–995. [Google Scholar] [CrossRef]
  76. Tan, T.; Li, S.; Fan, Y.; Wang, Z.; Raza, M.A.; Shafiq, I.; Wang, B.; Wu, X.; Yong, T.; Wang, X.; et al. Far-red light: A regulator of plant morphology and photosynthetic capacity. Crop J. 2022, 10, 300–309. [Google Scholar] [CrossRef]
  77. Maddonni, G.A.; Otegui, M.E.; Andrieu, B.; Chelle, M.; Casal, J.J. Maize leaves turn away from neighbors. Plant Physiol. 2002, 130, 1181–1189. [Google Scholar] [CrossRef] [PubMed]
Figure 1. Closed hydroponics set for growing mini green romaine lettuce (cv. Minicup) and changes in indoor temperature and humidity, as well as the EC and pH of the nutrient solution during the cultivation period (30 days).
Horticulturae 10 00860 g001
Figure 2. Various light qualities and the spectra of the LEDs and PPF-B (400~499 nm), PPF-G (500~599 nm), PPF-R (600~699 nm), and PPF-NIR (700–780 nm) 100% stacked bar graph for the LED fixtures used in the experiment.
Horticulturae 10 00860 g002
Figure 3. The spacing between LEDs installed per layer within the shelf, and the light intensity by position of the floating platform hole within the growth tray, expressed as a heatmap.
Horticulturae 10 00860 g003
Figure 4. Normalized difference vegetation index (NDVI), optimized soil-adjusted vegetation index (OSAVI), and modified chlorophyll absorption in reflectance index (MCARI) on the final day of cultivation of mini green romaine lettuce (cv. Minicup) under various light qualities. Means with different letters within columns indicate statistically significant differences according to Duncan’s multiple range test at the 5% level. Data are presented as a mean of ten replicates.
Horticulturae 10 00860 g004
Figure 5. Carotenoid reflectance index 1 (CRI1), carotenoid reflectance index 2 (CRI2), structure-insensitive pigment index (SIPI), and photochemical reflectance index (PRI) on the final day of cultivation of mini green romaine lettuce (cv. Minicup) under various light qualities. Means with different letters within columns indicate statistically significant differences according to Duncan’s multiple range test at the 5% level. Data are presented as a mean of ten replicates.
Horticulturae 10 00860 g005
Figure 6. Sub-stomatal CO2 concentration (Ci), transpiration rate (E), stomatal conductance of CO2 (gs), and photosynthetic rate (A) on the final day of cultivation of mini green romaine lettuce (cv. Minicup) under various light qualities. Means with different letters within columns indicate statistically significant differences according to Duncan’s multiple range test at the 5% level. Data are presented as a mean of eight replicates.
Horticulturae 10 00860 g006
Figure 7. The chlorophyll a fluorescence transient (OJIP) of mini green romaine lettuce (cv. Minicup) for 30 days under different light qualities. The value of the X axis is expressed on a logarithmic scale. Mean values were derived from eight measurements taken from eight samples, resulting in six outcome values. Step “O” = Fo, fluorescence intensity at 50 μs; step “J” = Fj, fluorescence intensity at 2 ms; step “I” = Fi, fluorescence intensity at 60 ms; step “P” = Fm, maximal fluorescence intensity. Data are presented as a mean of six replicates.
Horticulturae 10 00860 g007
Figure 8. Upper part (A) and side part (B) of mini green romaine lettuce cultivated for 30 days under LEDs with various light qualities.
Horticulturae 10 00860 g008
Figure 9. Aboveground fresh weight, root fresh weight, aboveground dry matter ratio, and root dry matter ratio on the final day of cultivation of mini green romaine lettuce (cv. Minicup) under various light qualities. Means with different letters within columns indicate statistically significant differences according to Duncan’s multiple range test at the 5% level. Data are presented as a mean of eight replicates.
Horticulturae 10 00860 g009
Figure 10. Leaf length, leaf width, number of leaves, leaf weight, and hypocotyl thickness on the final day of cultivation of mini green romaine lettuce (cv. Minicup) under various light qualities. Z Means with different letters within columns indicate statistically significant differences according to Duncan’s multiple range test at the 5% level. *** indicate significant differences at p < 0.001, respectively. Data are presented as a mean of eight replicates.
Horticulturae 10 00860 g010
Figure 11. Heatmap of correlation of the observed parameters on the final day of cultivation of mini green romaine lettuce (cv. Minicup) under various light qualities: Data are presented as a mean of six replicates. NDVI, OSAVI, MCARI, CRI1, CRI2, SIPI, PRI, Ci, E, gs, A, NPQ, AFW, RFW, ADMR, RDMR, and HT represent the normalized difference vegetation index, optimized soil-adjusted vegetation index, modified chlorophyll absorption in reflectance index, carotenoid reflectance index 1, carotenoid reflectance index 2, structure-insensitive pigment index, photochemical reflectance index, sub-stomatal CO2 concentration, transpiration rate, stomatal conductance of CO2, photosynthetic rate, non-photochemical fluorescence quenching, aboveground fresh weight, root fresh weight, aboveground dry matter ratio, root dry matter ratio, and hypocotyl thickness, respectively. *, and ** indicate significant differences at p < 0.05 and 0.01, respectively.
Horticulturae 10 00860 g011
Figure 12. Biplot of the principal component analysis (PCA) on the final day of cultivation of mini green romaine lettuce (cv. Minicup) under various light qualities. Data are presented as a mean of six replicates. NDVI, OSAVI, MCARI, CRI1, CRI2, SIPI, PRI, Ci, E, gs, A, NPQ represent the normalized difference vegetation index, optimized soil-adjusted vegetation index, modified chlorophyll absorption in reflectance index, carotenoid reflectance index 1, carotenoid reflectance index 2, structure-insensitive pigment index, photochemical reflectance index, sub-stomatal CO2 concentration, transpiration rate, stomatal conductance of CO2, photosynthetic rate, non-photochemical fluorescence quenching, respectively.
Horticulturae 10 00860 g012
Table 1. List of spectral reflectance indices calculated by portable spectrophotometer (PolyPen RP 410/UVIS and PolyPen RP410/NIR) and equations according to the PolyPen user’s manual.
Spectral Reflectance IndexEquation
Normalized Difference Vegetation IndexNDVI = RNIR − RRED/RNIR + RRED
Optimized Soil-Adjusted Vegetation IndexOSAVI = 1.5 × (RNIR − RRED)/(RNIR + RRED + 0.16)
Modified Chlorophyll Absorption Ratio IndexMCARI = [(R700 − R670) − 0.2(R700 − R500)] × (R700/R670)
Structure-Insensitive Pigment IndexSIPI = R800 − R445/R800 + R680
Carotenoid Reflectance Index 1CRI1 = (1/R510) − (1/R550)
Carotenoid Reflectance Index 2CRI2 = (1/R510) − (1/R700)
Photochemical Reflectance IndexPRI = R531 − R570/R531 + R570
Table 2. Equations and definitions of chlorophyll fluorescence parameters.
(Data Necessary for the Calculation of the So-Called JIP Parameters)
ParameterEquationDefinition
Fo F50μs; fluorescence intensity at 50 μs
Fj Fluorescence intensity at step J (at 2 ms)
Fi Fluorescence intensity at step I (at 60 ms)
Fm Maximal fluorescence intensity
Fv/Fm(Fm − Fo)/FmThe maximum quantum efficiency of PSII photochemistry
Vj(Fj − Fo)/(Fm − Fo)Relative variable Chl fluorescence (at 2 ms)
Vi(Fi − Fo)/(Fm − Fo)Relative variable Chl fluorescence (at 30 ms)
MoTRo/RC − ETo/RCNet rate of PSII closure (rate of the primary photochemistry)
ABS/RC(Mo/Vj) × (1/φPO)Average absorbed photon flux per PSII reaction center (or also, apparent antenna size of an active PSII)
TRo/RCMo/VjMaximum trapped exciton flux per PSII
ETo/RC(Mo/Vj) × (1 − Vj)Electron transport flux from QA to QB per PSII
DIo/RCABS/RC − TRo/RCHeat dissipation at time zero per RC
PIABS[rRC2/(1 − rRC2)] × [φPo/(1 − φPo)] × [ψET2o/(1 − ψET2o)]Performance index for energy conservation, from photons absorbed by the PSII antenna to the reduction of QB
PItotalPIABS × {(1 − Vi)/(1 − Vj)}/[1 − {(1 − Vi)/(1 − Vj)}]Performance index for energy conservation from photons absorbed by the PSII antenna, until the reduction of PSI acceptors
NPQ(Fm − Fm′)/Fm′Non-photochemical fluorescence quenching
Source: Strasser et al. [25]; Stribet and Govindjee [33].
Table 3. Fv/Fm, ABS/RC, TRo/RC, ETo/RC, DIo/RC, PIABS, and PItotal on the final day of cultivation of mini green romaine lettuce (cv. Minicup) under various light qualities.
TreatmentsFv/FmABS/RCTRo/RCETo/RCDIo/RCPIABSPItotalNPQ
QD-LED0.851 ab Z1.580 b1.344 a0.851 a0.237 b6.919 c3.855 b0.829 a
BR-LED0.843 b1.306 d1.102 c0.781 b0.205 c10.031 a4.518 a0.719 b
W-LED0.857 a1.439 c1.234 b0.847 a0.205 c9.260 ab4.487 a0.702 b
B-LED0.851 ab1.419 c1.205 b0.822 ab0.210 c8.922 b4.570 a0.651 b
R-LED0.818 c1.687 a1.382 a0.860 a0.304 a5.139 d2.705 c0.845 a
p-Value**********************
Z Means with different letters within columns indicate statistically significant differences according to Duncan’s multiple range test at the 5% level. * and *** indicate significant differences at p < 0.05 and 0.001, respectively. Data are presented as a mean of eight replicates.
Disclaimer/Publisher’s Note: The statements, opinions and data contained in all publications are solely those of the individual author(s) and contributor(s) and not of MDPI and/or the editor(s). MDPI and/or the editor(s) disclaim responsibility for any injury to people or property resulting from any ideas, methods, instructions or products referred to in the content.