Article

Comprehensive Evaluation of Texture Quality of ‘Huizao’ (Ziziphus jujuba Mill. Huizao) and Its Response to Climate Factors in Four Main Production Areas of Southern Xinjiang

1
The National and Local Joint Engineering Laboratory of High Efficiency and High Quality Cultivation and Deep Processing Technology of Characteristic Fruit Trees in Southern Xinjiang, Tarim University, Alaer 843300, China
2
Xinjiang Tianji Mingde Information Technology Co., Ltd., Aral 843300, China
3
Agricultural Sciences Research Institute, Kunyu 848116, China
4
College of Forestry, Northwest A&F University, Yangling, Xianyang 712100, China
*
Authors to whom correspondence should be addressed.
These authors contributed equally to this work.
Horticulturae 2024, 10(8), 864; https://doi.org/10.3390/horticulturae10080864
Submission received: 4 July 2024 / Revised: 8 August 2024 / Accepted: 14 August 2024 / Published: 15 August 2024
(This article belongs to the Section Fruit Production Systems)

Abstract

:
A superior cultivar of dried jujube in China is ‘Huizao’ (HZ) jujube. Nonetheless, detailed evaluations of the texture quality of HZ fruit have been the subject of few studies. Texture is a significant indicator of the sensory and processed quality of a fruit. Here, we differentiate and characterize the texture quality of HZ fruit from the four primary producing regions in southern Xinjiang, as well as develop a system for assessing the texture quality of HZ fruit. Correlation investigation indicated strong relationships between the springiness, chewiness, cohesiveness, gumminess, and hardness of HZ fruit. Furthermore, according to the factor molecules, the texture quality of HZ fruit in the four production areas was evaluated as Bazhou (1.24) > Hotan (0.773) > Kashi (−0.577) > Aksu (−0.852). RDA analysis of six texture quality parameters and 24 climate conditions identified higher mean temperature (TEM) and lower relative humidity (RHU) as the primary factors contributing to the improved texture quality of HZ fruit in Xinjiang. This study identified the variations in the texture of HZ fruit in the four primary producing regions of Southern Xinjiang. The HZ fruit in Hotan and Bazhou exhibit superior springiness and stickiness, while the fruit in Aksu and Kashi exhibit greater hardness. The texture of HZ fruit is significantly influenced by springiness, hardness, and adhesiveness, and a comprehensive evaluation model has been established through this research. This will provide a theoretical foundation for optimizing the dominant producing areas and regional production of HZ varieties in Xinjiang.

1. Introduction

HZ jujube (Ziziphus jujuba Mill. ‘Huizao’) belongs to the Rhamnaceae family and originated in Xinzheng, Henan Province, China [1]. It is a high-quality dry jujube type with an obovate shape, small and thick stones, has a firm texture, delicate flesh, is elastic and sweet, and has a high nutrient content [2]. It contains numerous bioactive components, including ascorbic acid, flavonoids, phenols, nucleosides, triterpene acids, and polysaccharides [3,4,5,6]. As a result, HZ fruit has enhanced immunity, anti-aging, anti-cancer, and anti-inflammatory properties [7]. HZ has been widely cultivated in China, mainly in Xinjiang, Shaaxi, Hebei, and Shanxi. Xinjiang has emerged as one of the most significant HZ-producing regions in China, particularly in Aksu, Hotan, Bazhou, and Kashi, as a result of the substantial temperature disparity between day and night and the extended sunlight hours. However, the quality of the fruit varied significantly among the various producing regions.
Texture is one of the three major acceptability aspects of food (appearance, flavor, and texture) [8,9], consisting mostly of hardness, adhesiveness, cohesiveness, springiness, gumminess, and chewiness [10], and is assessed using sensory or instrumental methods [11]. Texture profile analysis (TPA), also referred to as the Double Mastication test [12], can simulate mastication in the human oral cavity using various probes. It then obtains the relevant texture parameters via secondary compression and the texture model [13,14] and overcomes the shortcomings of the subjectivity of traditional sensory evaluation [13]. TPA is commonly employed in the investigation of fruit texture features [15], including apple [16], pear [17], peach [18], and jujube [19]. The TPA method was used to determine and analyze the textural indexes of date fruits of three varieties at six fruit ripening periods, and the results showed that the textural indexes varied greatly at different ripening periods, while different varieties would not affect the trend of change [20,21]. In addition, fruit texture is mainly determined by microscopic factors such as cell size, shape, and cell wall mechanical strength [22], and is also affected by cell wall metabolic enzymes and related gene expression [23,24]. Therefore, fruit texture is directly related to cultivar and cultivation measures.
At present, many scholars have conducted a lot of research on fruit growth [25,26,27,28,29], extending the storage duration of fresh jujube [30,31,32] and developing functional components [33,34]. Although a small number of studies have reported the effects of climate or soil factors on the nutritional quality of jujube fruits in Xinjiang production areas [35,36,37], there are few reports on the differences in fruit texture indexes among different production areas and the relationship between climatic factors and texture quality on a large scale. However, there are few reports on the difference in texture quality from different producing areas and the influence of climatic factors on texture quality. Therefore, in this study, the texture quality of ‘Huizao’ jujube (HZ) grown in different orchards in four producing areas of Xinjiang was determined by the TPA method. Correlation analysis, principal component analysis, and stepwise regression analysis were employed to identify the core evaluation indexes of HZ texture quality. The relationship between climatic factors and the formation of fruit texture was further investigated through redundancy analysis (RDA). The texture characteristics of HZ fruit in different producing areas were distinguished and the texture quality of HZ fruit in four producing areas was comprehensively evaluated. This study gives theoretical direction for screening the superior producing locations and regional production of HZ in Southern Xinjiang.

2. Materials and Methods

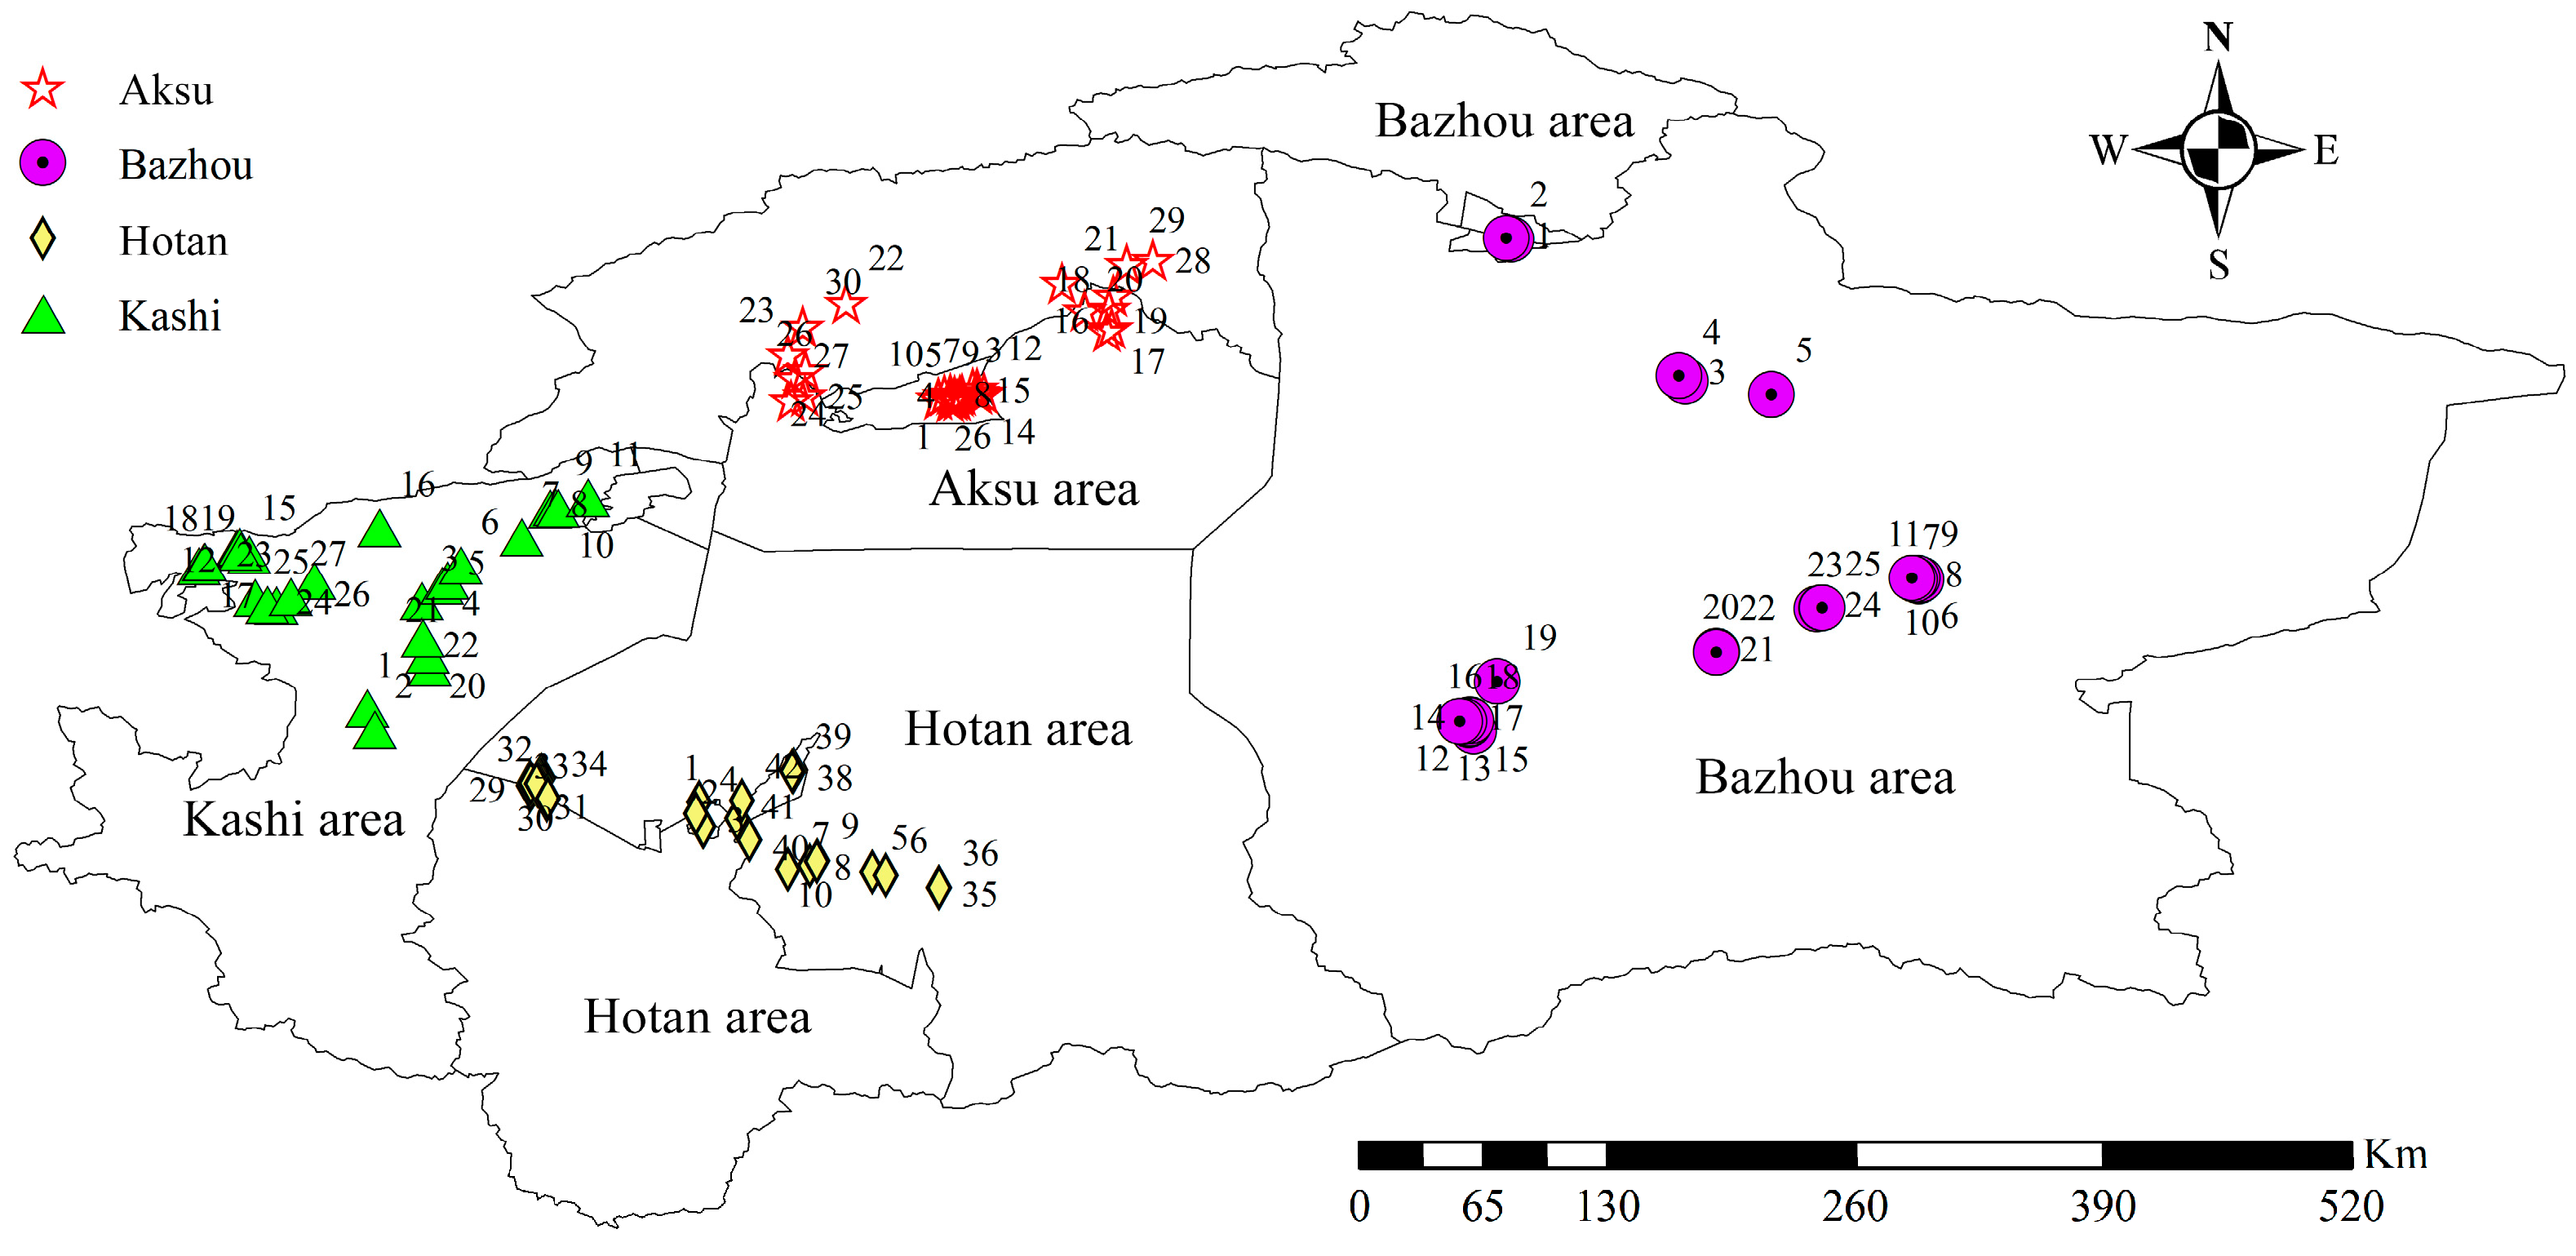
2.1. Preparation of Fruit Samples

The sampling stations included 109 jujube orchards from 31 production areas spread throughout 4 major producing areas: Aksu (28 orchards), Kashi (25 orchards), Hotan (29 orchards), and Bazhou (27 orchards). The distribution map of the sample points is generated in ArcGIS 10.8, as shown in Figure 1, by employing GPS (Jiaming GPSMAP 67, Jinan Zeshan Electronics, Ji’nan, China) to precisely determine the longitude and latitude of the sample points and to establish records (Table S1). At the crisp maturity stage, 3~5 trees were selected from each orchard, and 50 HZ fruit with good shape and smooth surfaces, without diseases, pests, and mechanical damage, were collected at random in different directions. The fruit was kept at low temperatures and sent to Tarim University’s laboratory in Alar, China. The samples were kept in a refrigerator at 4 °C after being removed from the field. For the texture test, 30 fruits were chosen at random from each orchard’s 50 samples, for a total of 3270.

2.2. Determination of Texture Indices

TMS-PRO (Beijing Yingsheng Hengtai Technology Co., Ltd., Beijing, China) was used to assess the texture of jujube fruit. The TPA extrusion test was conducted by placing the entire fruit on the carrier table of the texture analyzer. The fruit was positioned in the same direction and position during each test, with minor modifications to the methods of Zhao et al. [13] and Ma et al. [38]. The force induction element had a range of 400 N, a recovery height of 40 mm, a 25% deformation, a detection speed of 50 mm/min, and a starting force of 0.5 N. The P/2n needle probe (diameter 2 mm) was employed. The measurement depth was at 3.7 mm to prevent the probe from contacting the fruit core. The test surface was the flat portion of the middle part of the sunny side of the fruit, which was chosen to ensure that the probe was directly in the center of the fruit when it was penetrated. The test surface was the flat portion of the middle part of the sunny side of the fruit, which was chosen to ensure that the probe was directly in the center of the fruit when it was penetrated. Each group of samples underwent repetitive measurements of 10 fruits. The TPA software (https://texturetechnologies.com/resources/texture-profile-analysis, accessed on 4 July 2024) is employed to derive the TPA parameters.

2.3. Meteorological Data Acquisition

The meteorological data of each sampling point are derived from the National Geographic Information Cloud Platform (https://www.tianditu.gov.cn, accessed on 8 December 2021). A total of 24 meteorological data points were recorded (Table S2), which included the following: mean temperature (6–9 months TEM), maximum temperature (Max TEM) and minimum temperature (Min TEM), number of sunny days (6–9 months SSD), total precipitation (6–9 months PRE), relative humidity (Mean RHU), and peak fruit expansion (June to July) and pre-ripening (August to September) in 2021.

2.4. Statistical Analysis

Results were presented as mean ± SD (p < 0.05). Excel 2019 (Microsoft, WA, USA) and SPSS 29.0 (IBM, Armonk, NY, USA) were used to perform data statistics and variance analysis. Pearson correlation analysis and principal component analysis were performed using Originpro (OriginLab, Northampton, PA, USA). Firstly, the produce quality data are normalized in accordance with Formulas (1) and (2) [39]. The main indicators were screened, and the fruit texture quality was comprehensively evaluated using principal component analysis and correlation analysis. A redundancy analysis (RDA) was conducted to examine the correlation between the quality of HZ produce texture and environmental parameters in CANOCO 5.0 software (CABE Information Technology Co., Ltd., Shanghai, China) [40,41].
Z = (x − µ)/σ
Y1 = (x − xmin)/(xmax − xmin)
(1) Z is the Z-score value, x is the individual observation, σ is the standard deviation of the population data, and μ is the mean of the population mean; (2) Y1 is the normalization value, xmin is the minimum observation, and xmax is the maximum observation.

3. Results

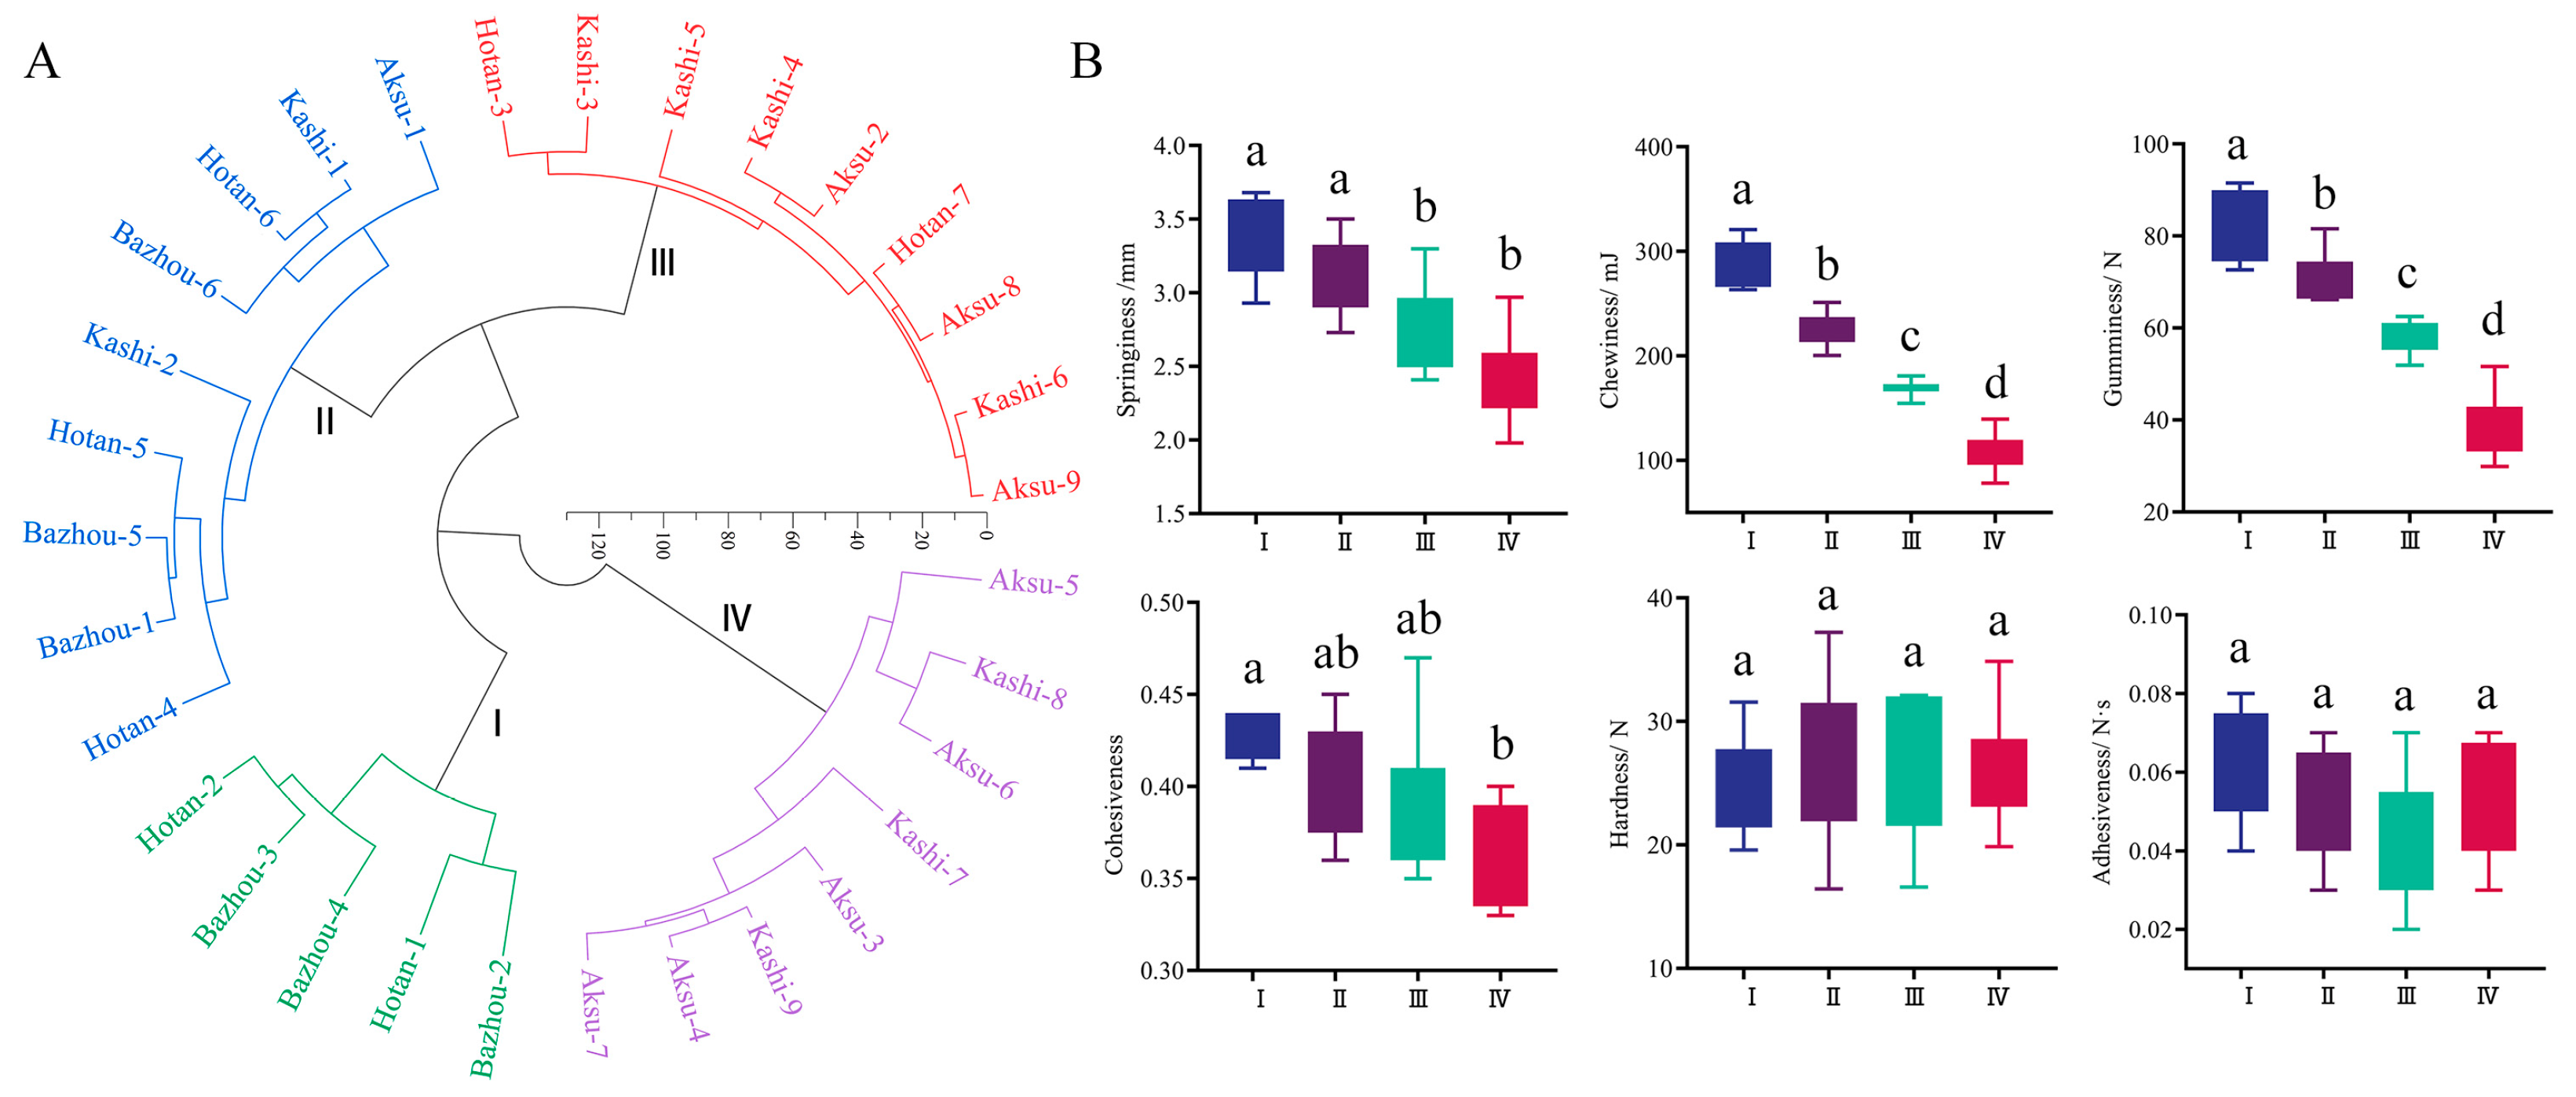
3.1. Comparison of Texture Quality Indices of HZ Fruit from Different Main Producing Areas

Figure 2A shows the differences in hardness, gumminess, chewiness, adhesiveness, cohesiveness, and springiness among HZ fruit from various production sites. There were no significant differences in hardness and adhesiveness between the four places, and the gumminess of the fruit in Bazhou and Hotan was much greater than that of Aksu. Bazhou and Hotan had much higher fruit chewiness and elasticity than Aksu and Kashi, as well as fruit cohesiveness, but there was no significant difference between Bazhou and Kashi. The findings indicated that Bazhou HZ fruit samples may have much superior texture quality than samples from the other three producing zones.
The six texture indexes are incapable of being immediately compared due to their distinct meanings and units. Therefore, it is imperative to standardize the data and employ Formula (1) to compute the standardized data. A cumulative score graph was generated (Figure 2B). Interestingly, the fruit from Hotan and Bazhou was positive except for hardness, but the fruit from Kashi and Aksu was negative save for hardness. As a result, the cumulative scores of sample texture indexes in the areas of Hotan and Bazhou were significantly higher than those in the areas of Aksu and Kashi. Therefore, Hotan and Bazhou produce higher-quality fruit textures than Aksu and Kashi. The data were further processed by the normalized Formula (2) to draw an interactive heat map (Figure 2C). It can be seen that there are differences in the texture of jujube in 31 producing areas. HZ fruit from Hotan and Bazhou have less hardness than those from Kashi and Aksu, but more gumminess, chewiness, adhesiveness, cohesiveness, and springiness. Table S3 (Bazhou), Table S4 (Hotan), Table S5 (Kashi), and Table S6 (Aksu) indicate the textural qualities of HZ fruit from the four producing areas.

3.2. Probability Grading of Texture Quality Indices of HZ Fruit

The coefficient variation (CV) of fruit quality indices in four producing areas (Table 1) shows the degree of index variation for each texture. Fruit hardness varied slightly, chewiness, adhesiveness, and springiness varied the least, cohesiveness varied the most, and gumminess changed little. The higher the variation range, the more conducive to grading.
In this study, the sample size for index grading was 3270, drawn from 109 HZ orchards in four major HZ-producing locations, which can adequately represent the textural features of HZ fruit in Xinjiang. Each texture index of HZ fruit was classified into five grades (lower, low, medium, high, and higher) based on the normal distribution, with the 10th, 30th, 70th, and 90th percentiles. The results are presented in Table 2. In terms of distribution proportion, middle-grade samples (41.94%) had the highest proportion, while samples from lower and higher grades (9.68%) had the lowest proportion. The distribution frequency approaches theoretical probability, implying that the categorization standard is scientific and effective.

3.3. Classification of 31 HZ Producing Regions from Four Producing Areas

A comprehensive evaluation cannot be conducted directly using texture quality indices for HZ fruit due to the presence of correlations among them and the differences in index values. The six texture quality indices data are therefore standardized. Figure 3A shows that there are 31 HZ fruit-producing locations clustered into four categories, with each hue representing a separate category and a distance of 60. The texture quality categorizes the 31 producing areas into four groups: the first group includes the Hotan-1 and Hotan-2 areas, the Bazhou area of Bazhou-2, Bazhou-3, and Bazhou-4; the second group comprises nine areas, mostly in Hotan and Bazhou; and the third and fourth groups, with seventeen areas each, are located in Kashi and Aksu, respectively. Hotan and Bazhou were primarily classified as first and second, respectively, whilst Kashi and Aksu were classified as third and fourth. From group 1 to group 4, the four texture indexes of fruit springiness, chewiness, gumminess, and cohesiveness declined in turn, with a substantial difference, while the difference in hardness and adhesiveness was not visible (Figure 3B).

3.4. Identifying Key Indices for Texture Quality

3.4.1. Correlation Analysis of Texture Quality Indices

A Pearson correlation study was conducted on six parameters of HZ fruit from 109 orchards. In Figure 4, red and blue indicate positive and negative correlations, respectively. Chewiness correlated positively (p < 0.01) with cohesiveness, springiness, and gumminess (correlation coefficients of 0.56, 0.83, and 0.95), springiness and gumminess (correlation coefficients of 0.76 and 0.44), and gumminess (correlation coefficient of 0.66). This indicates that as chewiness increases, so do cohesiveness, springiness, and gumminess. However, hardness was significantly and negatively correlated with (p < 0.01) and cohesiveness (p < 0.05), with correlation coefficients of up to −0.65 and −0.40, respectively, demonstrating that the cohesiveness and springiness value decrease with increasing hardness during the fruit development of HZ fruit. There was no significant relationship between adhesiveness and other indices, indicating that they have less ability to interact with each other. The correlation analysis revealed a highly substantial positive link between chewiness, cohesiveness, springiness, and gumminess.

3.4.2. Stepwise Regression Analysis

Stepwise regression was used to minimize numerous linear properties such as hardness (x1), chewiness (x2), cohesiveness (x3), springiness (x4), gumminess (x5), and adhesiveness (x6) (Table 3). All of the regression equations (y1, y2, y3, y4, and y5) for chewiness, cohesiveness, springiness, and gumminess had R2 values of more than 0.55, indicating that the regression model is more reliable. The p-values for the five regression equations shown above were all below 0.001, showing that they can accurately predict the hardness, chewiness, cohesiveness, springiness, and gumminess of HZ fruit texture, respectively. The y6 has a poor R2 and p > 0.05, indicating that it cannot accurately predict the adhesiveness. The other five indicators were closely associated with the quality of fruit texture, with the exception of adhesiveness, as indicated by the results of the stepwise regression analysis.

3.4.3. Principal Component Analysis

Based on the criteria of cumulative variance percentage greater than 85%, three principal components were chosen, which actually accounted for 92.563% of all variances, as shown in Table 4. The variance contribution of principal component 1 (PC1) was 55.242%, and its representative indices were chewiness, cohesiveness, springiness, and gumminess. All of the eigenvalues were greater than 0.80, with springiness having the highest eigenvalue (0.926). Springiness may represent the chewing qualities of the flesh, as chewiness, cohesiveness, and gumminess were all extremely substantially connected (correlation values of 0.83, 0.76, and 0.66, respectively). PC2 accounted for 22.202% of the overall variance, and its representative index was hardness, with an eigenvalue of 0.802 that reflected the hardness qualities of the flesh. The variance contribution of PC3 was 15.119%, with adhesiveness serving as the typical index; the eigenvalue was 0.885, reflecting the adhesiveness features of the flesh. It has been found that springiness, hardness, and adhesiveness are major indications of the textural quality of HZ fruit. The ratio of the principal component score of each index to the square root of the corresponding principal component eigenvalue is used as the coefficient of each index to construct the expression of the three principal component scores as follows:
y1 = −0.255x1 + 0.499x2 + 0.154x3 + 0.454x4 + 0.509x5 + 0.444x6;
y2 = 0.695x1 + 0.330x2 − 0.318x3 − 0.321x4 + 0.014x5 + 0.451x6;
y3 = 0.213x1 + 0.054x2 + 0.929x3 − 0.227x4 − 0.140x5 + 0.131x6;
Considering that each principal component may have various variance contributions, the ratio of the variance contribution of each principal component to the cumulative variance contribution is used as a coefficient, and the final score of each principal component is used as the independent variable (y1, y2, y3) to establish a comprehensive evaluation model equation as follows: Y = 0.597y1 + 0.240y2 + 0.163y3. Table 5 shows that the comprehensive scores of HZ jujube texture quality could be divided into five levels (poor, somewhat poor, medium, good, and excellent) based on the 10th, 30th, 70th, and 90th percentiles. According to a comprehensive review of HZ jujube texture quality indexes, medium grade, rather poor, good grade, excellent grade, and low grade made up 41.935%, 19.355%, 19.355%, 9.677%, and 9.677% of the total, respectively.

3.5. Comprehensive Ranking of Texture Quality of 31 Producing Areas

Based on the comprehensive scoring methodology, 31 HZ fruit samples from four major producing areas were assessed separately (Table 6). The top five producers are Bazhou-2, Hotan-1, Bahzou-4, Bazhou-3, and Hotan-2, which corresponds to the cluster analysis results. Bazhou (16.1%) and Hotan (12.9%) received good or exceptional ratings out of the 31 areas. Furthermore, the average comprehensive score of samples from the four producing areas fell in descending order: Bazhou (1.24) > Hotan (0.773) > Kashi (−0.577) > Aksu (−0.852). Overall, the texture quality of HZ fruit from the four primary production areas may be evaluated as Bazhou > Hotan > Kashi > Aksu.

3.6. Relationship between Fruit Texture Quality and Climatic Factors of HZ Fruit

The climatic conditions of the four main producing areas are different. The temperature in Bazhou, Hotan, and Kashi was significantly higher than that in Aksu (Figure 5A(a–c)). HZ fruit from Bazhou and Hotan had higher texture quality, with Mean TEM, Max TEM, and Min TEM temperature data grouped in the upper part of the fiddle diagram (Figure 5A(a–c)), but PRE and RHU were in the lower half of the fiddle diagram (Figure 5A(e,f)). The texture quality of HZ fruit in the Aksu producing area falls into the fourth category, while climatic data show low temperatures and high humidity. At the same time, the SSD change rule for the four production sites does not correspond to the changing trend of fruit texture quality (Figure 5A(d)). The foregoing results show that production areas with good texture quality of HZ fruit must have high temperatures, whereas too high RHU in production areas with poor texture quality is detrimental to fruit texture quality improvement.
A redundancy analysis (RDA) method was used to identify climate parameters related to texture quality metrics in HZ fruit. The variables were selected based on their prioritized contributions from RDA analysis and Pearson’s correlation p < 0.05 (Figure 5B). The first of the three RDA axes was statistically significant, accounting for roughly 35.66% of the variance covered by the RDA model (Figure 5C). In various HZ fruit production zones, TEM had a considerable favorable effect on the five texture indices of gumminess, chewiness, adhesiveness, cohesiveness, and springiness, but a detrimental effect on the hardness of the fruit. High relative humidity increased the hardness of HZ fruits while decreasing the other five texture indices (Figure 5C). The results can be used to determine the ideal HZ planting area and as a theoretical reference for regional HZ production.

4. Discussion

Xinjiang is a large territory, and the climate and soil conditions vary widely, resulting in the same diversity in fruit quality in different regions [42]. Currently, evaluating fruit based on personal experience is the prevalent strategy [43]. However, this strategy lacks an objective basis and scientific theoretical guidance [44]. Accordingly, grading results are typically unstable and do not adequately reflect the eigenvalue’s distribution properties. As a result, researchers have developed a probability grading method that provides the advantages of objectivity, consistent criteria, and comparable outcomes [45]. A prerequisite for quality grading is the clarification of feature distribution [46], The variation coefficient is a measure of the degree of dispersion of the characteristics [47], and a higher variation coefficient facilitates indexing grading [48].
The variation coefficients of six texture indices were high in the current investigation, ranging from 5.25% to 38.02%. The six indices were ranked according to their probability. Through the cluster analysis and principal component analysis of texture indexes of 31 origins, the comprehensive evaluation concluded that the texture quality of HZ jujube in the Bazhou and Hotan production areas was significantly better than that in the Kashi and Aksu production areas. This is consistent with some of the findings of Huang [49] et al. Meanwhile, the results of correlation and stepwise regression analyses showed that springiness, chewiness, adhesiveness, and cohesiveness were the main evaluation indexes of the texture quality of HZ jujube fruits. This is consistent with the results of prior investigations on the textural properties of gray jujube winter [50] and winter jujube [51]. The measured data may overlap due to the texture index relationship [52]. Therefore, the main texture index screening is a more precise method of evaluating the quality of HZ. Research shows that Ruoqiang, Minfeng, Luopu, and Qiemo the four production areas are not only extremely suitable for grey jujube growth and development in terms of climatic factors, and grey jujube fruit quality is also better, for the Southern Xinjiang grey jujube best superiority area [53]. The samples from Bazhou outperformed those from all other main producing areas, as indicated by the comprehensive score.
The fruit quality is primarily determined by the level of orchard management and climate conditions [54,55]. A higher average temperature, sufficient light, and less rainfall are conducive to jujube fruit yield and the accumulation of the soluble solid content, soluble sugar content, and Vc content in fruit [56]. Therefore, we investigated the correlation between texture quality and climate characteristics in numerous production areas. It was found that the textural quality of excellent HZ jujube fruit was closely related to higher TEM and lower RHU, which was similar to the study on the relationship between textural quality and climatic factors in ‘Junzao’ [57] and significant differences in climatic factors across production areas. This may be due to the fact that the four primary producing locations are situated on the outskirts of the Taklamakan Desert, where precipitation fluctuations are not immediately apparent. The revaluation results can be used to ascertain the optimal HZ planting area and as a theoretical reference for regional HZ production.
Overall, the texture quality characteristics of HZ fruit from various producing locations were revealed, which is extremely important for selecting high-quality HZ fruit-producing areas. In the HZ industry, the established assessment model of HZ fruit may be used to completely analyze the texture quality of HZ fruit, as well as to pick more suitable sites for HZ growth based on climatic conditions. As a result, the findings of this study contribute to the assessment of the textural quality of HZ fruit and the premium region selection of HZ in various producing areas. However, additional study is required for the future development of the HZ business.

5. Conclusions

In this work, texture quality indicators were studied of Huizao jujube fruit from 109 orchards in Southern Xinjiang. The characteristic indices of HZ texture quality were analyzed by multivariate data, springiness hardness, and adhesiveness are essential indices for assessing the texture quality of HZ fruit. The texture quality of HZ texture quality is better under higher temperatures and lower relative humidity climate conditions. According to the comprehensive score, the texture quality of HZ fruit from the four major production areas is in the following order: Bazhou > Hotan > Kashi > Aksu. Therefore, the main production areas of ‘Huizao’ jujube in Southern Xinjiang should be concentrated in the advantageous production areas of Bazhou and Hotan, while Kashi and Aksu production areas should appropriately reduce the planting area, which is more conducive to the healthy and stable development of the ‘Huizao’ jujube industry.

Supplementary Materials

The following supporting information can be downloaded at https://www.mdpi.com/article/10.3390/horticulturae10080864/s1, Table S1: Names and geographical coordinates of 31 producing areas and 109 orchards. Table S2: Climatic factor data of 24 producing areas. Tables S3~S6: The texture quality data of Bazhou, Hotan, Kashi, and Aksu, respectively.

Author Contributions

T.G.: sampling, investigation, analyzing data, formal analysis, writing—original draft, writing—review and editing; Q.Q.: investigation, writing—original draft, writing—review and editing; C.Z.: investigation, data Analysis; X.L. (Xiangyu Li): investigation, data analysis; C.W.: formal analysis, funding acquisition, project administration, writing—review and editing; Z.W.: investigation, formal analysis; M.L.: investigation; S.J.: financial support; X.L. (Xingang Li): modification. All authors have read and agreed to the published version of the manuscript.

Funding

This work was supported by the Special Fund Project of Xinjiang Jujube Industry Technology System (No. XJCYTX-01), the agricultural Sciences Research Institute of Kunyu “Establishment of Standardized Garden and Standard System for Jujube” (No. 2021011), and the Demonstration Base for Cultivating Innovative Talents in Horticulture Industry (No. 2019CB001).

Data Availability Statement

The original contributions presented in the study are included in the article and Supplementary Material, further inquiries can be directed to the corresponding authors.

Acknowledgments

We wish to thank Wu Cuiyun and Li Xingang for their suggestions on the paper and Qiu Qianqian and Zhang Chuanjiang for their help in the organization of the experiment and the determination of indicators. The authors would like to express their gratitude to EditSprings (https://www.editsprings.cn, accessed on 4 July 2024) for the expert linguistic services provided.

Conflicts of Interest

Author Qianqian Qiu was employed by the company Xinjiang Tianji Mingde Information Technology Co., Ltd., Aral 843300, China. The remaining authors wish to disclose that, at the time of conducting this research and submitting the manuscript, they were not subject to any commercial or financial relationships that could be perceived as a potential conflict of interest.

References

  1. Li, D.; Niu, X.; Tian, J. Chinese Jujube Variety Resource Map; China Agricultural Press: Beijing, China, 2013. [Google Scholar]
  2. Qu, Z.; Wang, Y.; Peng, S.; Guo, Y. Chinese Fruit Trees. Jujube; Chinese Forestry Press: Beijing, China, 1993. [Google Scholar]
  3. Agrawal, P.; Singh, T.; Pathak, D.; Chopra, H. An updated review of Ziziphus jujube: Major focus on its phytochemicals and pharmacological properties. Pharmacol. Res. Mod. Chin. Med. 2023, 8, 100297. [Google Scholar] [CrossRef]
  4. El Maaiden, E.; El Kharrassi, Y.; Qarah, N.A.; Essamadi, A.K.; Moustaid, K.; Nasser, B. Genus Ziziphus: A comprehensive review on ethnopharmacological, phytochemical and pharmacological properties. J. Ethnopharmacol. 2020, 259, 112950. [Google Scholar] [CrossRef] [PubMed]
  5. Guo, S.; Duan, J.; Qian, D.; Tang, Y.; Wu, D.; Su, S.; Wang, H.; Zhao, Y. Content variations of triterpenic acid, nucleoside, nucleobase, and sugar in jujube (Ziziphus jujuba) fruit during ripening. Food Chem. 2015, 167, 468–474. [Google Scholar] [CrossRef] [PubMed]
  6. Xue, T.; Ruan, K.; Xu, H.; Liu, H.; Tang, Z.; Yang, Y.; Duan, J.; Sun, X.; Wang, M.; Song, Z. Effect of different drying methods on the drying characteristics, chemical properties and antioxidant capacity of Ziziphus jujuba var. Spinosa fruit. LWT 2024, 196, 115873. [Google Scholar] [CrossRef]
  7. Gao, Q.; Wu, C.; Wang, M. The jujube (Ziziphus jujuba Mill.) fruit: A review of current knowledge of fruit composition and health benefits. J. Agric. Food Chem. 2013, 61, 3351–3363. [Google Scholar] [CrossRef] [PubMed]
  8. Bourne, M. Relation between texture and mastication. J. Texture Stud. 2004, 35, 125–143. [Google Scholar] [CrossRef]
  9. Ye, Z. Quality Analysis of Horticultural Products; China Agricultural Press: Beijing, China, 2011. [Google Scholar]
  10. Pham, Q.T.; Liou, N.-S. Investigating texture and mechanical properties of Asian pear flesh by compression tests. J. Mech. Sci. Technol. 2017, 31, 3671–3674. [Google Scholar] [CrossRef]
  11. Bianchi, T.; Guerrero, L.; Gratacós-Cubarsí, M.; Claret, A.; Argyris, J.; Garcia-Mas, J.; Hortós, M. Textural properties of different melon (Cucumis melo L.) fruit types: Sensory and physical-chemical evaluation. Sci. Hortic. 2016, 201, 46–56. [Google Scholar] [CrossRef]
  12. Wu, M.; Chen, Y.; Jin, B. Detection of texture properties of kiwi fruits by texture profile analysis and simulation of manual chewing. Sci. Technol. Food Ind. 2010, 31, 146–148+152. [Google Scholar]
  13. Zhao, A.; Xue, X.; Wang, Y.; Ren, H.; Gong, G.; Jiao, J.; Sui, C.; Li, D. Measuring texture quality of fresh jujube fruit using texture analyser. J. Fruit Sci. 2018, 35, 631–641. [Google Scholar]
  14. Chen, L.; Opara, U.L. Approaches to analysis and modeling texture in fresh and processed foods—A review. J. Food Eng. 2013, 119, 497–507. [Google Scholar] [CrossRef]
  15. Contador, L.; Shinya, P.; Infante, R. Texture phenotyping in fresh fleshy fruit. Sci. Hortic. 2015, 193, 40–46. [Google Scholar] [CrossRef]
  16. Yang, L.; Xiao, L.; Wang, Q.; Zhang, C.; Cong, P.; Tian, Y. Study on texture properties of apple flesh by using texture profile analysis. J. Fruit Sci. 2014, 31, 977–985. [Google Scholar]
  17. Gao, H.; Jia, Y.; Wei, J.; Ran, X.; Le, W. Studies on the post-harvested fruit texture changes of ‘Yali’ and ‘Jingbaili’ pears by using texture analyzer. Acta Hortic. Sin. 2012, 39, 1359. [Google Scholar]
  18. Christofi, M.; Mourtzinos, I.; Lazaridou, A.; Drogoudi, P.; Tsitlakidou, P.; Biliaderis, C.G.; Manganaris, G.A. Elaboration of novel and comprehensive protocols toward determination of textural properties and other sensorial attributes of canning peach fruit. J. Texture Stud. 2021, 52, 228–239. [Google Scholar] [CrossRef]
  19. Yang, Z.; Wang, Z. Evaluation and cluster analysis of Jujube fruit texture based on TPA method. Xinjiang Agric. Sci. 2019, 56, 1860–1868. [Google Scholar]
  20. Chen, K.; Zhou, T.; Xu, M.; Fu, B.; Ma, X.; Li, H. Study on correlation between organizational structure and puncturing texture of jujube. Food Mach. 2018, 34, 59–64. [Google Scholar]
  21. Lu, C.; Zhang, M.; Liu, W.; Wei, X.; Song, J.; Liu, S.; Yang, W.; Zhang, L.; Li, J. Analysis on development dynamics of juiube fruit texture. Non Wood For. Res. 2019, 37, 119–127. [Google Scholar]
  22. Konstankiewicz, K.; Zduneka, A. Influence of turgor and cell size on the cracking of potato tissue. Int. Agrophysics 2001, 14, 181–186. [Google Scholar]
  23. Shen, Y.; Li, F.; Wang, Y.; Zhang, X.; Li, Y.; Zhao, H.; Zhang, F. A study on the variation of cell wall components and activities of their degradation enzymes in sweet cherry during fruit development. J. Fruit Sci. 2020, 37, 677–686. [Google Scholar]
  24. Gao, Z.; Fan, X.; Yang, H.; Jiang, X.; Yang, Y.; Zhao, Z.; Dang, Z. Correlation among cell wall components, related enzyme activities and texture of developing fruits of different apple (Malus × domestica) cultivars. Food Sci. 2016, 37, 70–75. [Google Scholar]
  25. Zhang, Z.; Huang, J.; Li, X. Transcript analyses of ethylene pathway genes during ripening of Chinese jujube fruit. J. Plant Physiol. 2018, 224–225, 1–10. [Google Scholar] [CrossRef] [PubMed]
  26. Guo, M.; Zhang, Z.; Li, S.; Lian, Q.; Fu, P.; He, Y.; Qiao, J.; Xu, K.; Liu, L.; Wu, M.; et al. Genomic analyses of diverse wild and cultivated accessions provide insights into the evolutionary history of jujube. Plant Biotechnol. J. 2021, 19, 517–531. [Google Scholar] [CrossRef] [PubMed]
  27. Guo, M.; Zhang, Z.; Cheng, Y.; Li, S.; Shao, P.; Yu, Q.; Wang, J.; Xu, G.; Zhang, X.; Liu, J.; et al. Comparative population genomics dissects the genetic basis of seven domestication traits in jujube. Hortic. Res. 2020, 7, 89. [Google Scholar] [CrossRef] [PubMed]
  28. Shi, Q.; Du, J.; Zhu, D.; Li, X.; Li, X. Metabolomic and transcriptomic analyses of anthocyanin biosynthesis mechanisms in the color mutant Ziziphus jujuba cv. Tailihong. J. Agric. Food Chem. 2020, 68, 15186–15198. [Google Scholar] [CrossRef] [PubMed]
  29. Liu, N.; Zhao, H.; Hou, L.; Zhang, C.; Bo, W.; Pang, X.; Li, Y. HPLC-MS/MS-based and transcriptome analysis reveal the effects of ABA and MeJA on jujube (Ziziphus jujuba Mill.) cracking. Food Chem. 2023, 421, 136155. [Google Scholar] [CrossRef] [PubMed]
  30. Zhang, J.; Wang, C.; Chen, C.; Zhang, S.; Zhao, X.; Wu, C.; Kou, X.; Xue, Z. Glycine betaine inhibits postharvest softening and quality decline of winter jujube fruit by regulating energy and antioxidant metabolism. Food Chem. 2023, 410, 135445. [Google Scholar] [CrossRef] [PubMed]
  31. Li, D.; Li, L.; Li, W.; Xu, Y.; Han, X.; Bao, N.; Sheng, Z.; Yuan, Y.; Zhang, X.; Luo, Z. Elevated O2 alleviated anaerobic metabolism in postharvest winter jujube fruit by regulating pyruvic acid and energy metabolism. Postharvest Biol. Technol. 2023, 203, 112397. [Google Scholar] [CrossRef]
  32. Dou, J.; Kou, X.; Wu, C.; Fan, G.; Li, T.; Li, X.; Zhou, D.; Yan, Z.; Zhu, J. Recent advances and development of postharvest management research for fresh jujube fruit: A review. Sci. Hortic. 2023, 310, 111769. [Google Scholar] [CrossRef]
  33. Wang, C.; Wang, R.; Fu, C.; Jiang, X.; Li, X.; Han, G.; Zhang, J. Combining bioactive compounds and antioxidant activity profiling provide insights into assessment of geographical features of Chinese jujube. Food Biosci. 2022, 46, 101573. [Google Scholar] [CrossRef]
  34. Wang, T.; Guo, S.; Ren, X.; Du, J.; Bai, L.; Cui, X.; Ho, C.-T.; Bai, N. Simultaneous quantification of 18 bioactive constituents in Ziziphus jujuba fruits by HPLC coupled with a chemometric method. Food Sci. Hum. Wellness 2022, 11, 771–780. [Google Scholar] [CrossRef]
  35. Wan, S.; Sun, J.; Wang, L.; Huguo, Z.; Yu, T.; Zhang, S.; Zhang, G.; Li, J. Jujube fruit quality and its response to environment factors in Xinjiang different plantation areas. Non Wood For. Res. 2023, 41, 97–105. [Google Scholar]
  36. Xiao, L.; Huang, J.; Loiu, C.; ZAN, Y. Effects of climate factors on the quality of gray jujube. Hubei Agric. Sci. 2022, 61, 91–97. [Google Scholar]
  37. Liu, W.; Zhang, L.; Yang, W.; Zhao, W.; Zhang, M.; Wei, X.; Yang, Z.; Ma, L.; Wang, L.; Wang, S.; et al. Canonical correlation analysis of soil nutrients and fruit quality in Junzao orchard. Non Wood For. Res. 2021, 39, 104–114+122. [Google Scholar]
  38. Ma, Q.; Wang, G.; Liang, L. Establishment of the detecting method on the fruit texture of ‘Dongzao’ by puncture test. Sci. Agric. Sin. 2011, 44, 1210–1217. [Google Scholar]
  39. Li, Q.; Xu, S.; Zhang, Y.; Huang, J.; Li, D.; Liu, B.; Zhu, Z.; Liu, H. Stacking ensemble learning modeling and forecasting of maize yield based on meteorological factors. Sci. Agric. Sin. 2024, 57, 679–697. [Google Scholar]
  40. Zhou, X.; Wang, J.; Liu, X.; Peng, P.; Ma, Z.; Guo, H. Relationship Between Folicles and Seeds Traits of Paeonia decomposita and Environment Factors. J. Northeast For. Univ. 2018, 46, 41–45+58. [Google Scholar]
  41. Huang, T.; Döring, T.F.; Zhao, X.; Weiner, J.; Dang, P.; Zhang, M.; Zhang, M.; Siddique, K.H.M.; Schmid, B.; Qin, X. Cultivar mixtures increase crop yields and temporal yield stability globally. A meta-analysis. Agron. Sustain. Dev. 2024, 44, 28. [Google Scholar] [CrossRef]
  42. Li, X.; Huang, J.; Gao, W. A study on high-quality production regions of dry Chinese jujube in China. J. Fruit Sci. 2005, 22, 620–625. [Google Scholar]
  43. Han, B.; Tong, H.; Du, S. Sensory Evaluation of Food; China Forestry Press: Beijing, China, 2016. [Google Scholar]
  44. Zhu, D.; Li, H.; Cao, X.; Liu, H.; LI, J.; Meng, X. Research progress in quality evaluation of fresh foods by texture analyzers. Food Sci. 2014, 35, 264–269. [Google Scholar]
  45. Liu, M. Studies on the variations and grading standards of several economid characters of peach. J. Beijing Agric. Coll. 1992, 7, 98–104. [Google Scholar]
  46. Kong, X.; Xu, M.; Wang, K.; Chen, Q.; Han, L.; Li, Q.; Guo, Q.; Wan, H.; Nie, J. Development of a comprehensive evaluation system for the sensory and nutritional quality of winter jujube (Ziziphus jujuba Mill. cv. Dongzao). LWT 2024, 194, 115777. [Google Scholar] [CrossRef]
  47. Wang, L.; Zhu, G.; Fang, W. The evaluating criteria of some fruit quantitative characters of peach (Prunus persica L.) genetic resources. Acta Hortic. Sin. 2005, 32, 1–5. [Google Scholar]
  48. Zheng, L.; Nie, J.; Li, M.; Kang, Y.; Kuang, L.; Ye, M. Study on screening of taste evaluation indexes for apple. Sci. Agric. Sin. 2015, 48, 2796–2805. [Google Scholar]
  49. Huang, Y.; Liu, F.; Zhao, W.; Sun, J.; Wan, S.; Wang, L.; Wang, S.; Yang, Z.; Ma, L.; Lu, C.; et al. Texture analysis of Hui jujube and Jun jujube in different production areas of Xinjiang. Non Wood For. Res. 2022, 40, 65–76. [Google Scholar]
  50. Zhou, L.; Yang, W.; Wang, C.; Li, X. Superior production region of Chinese jujube in Xinjiang. J. Fruit Sci. 2015, 32, 8. [Google Scholar]
  51. Kong, X.; Xu, M.; Wan, H.; Han, L.; Liu, X.; Li, Q.; Hao, B.; Zhang, S.; Li, X.; Liu, Y.; et al. Development of a texture evaluation system for winter jujube (Ziziphus jujuba ‘Dongzao’). J. Integr. Agric. 2022, 21, 3658–3668. [Google Scholar] [CrossRef]
  52. Pan, H.; Liu, D.; Shao, Q.; Gao, G.; Qi, H. Analysis and comprehensive evaluation of textural quality of ripe fruits from different varieties of oriental melon (Cucumis melo var. makuwa Makino). Shipin Kexue/Food Sci. 2019, 40, 35–42. [Google Scholar]
  53. Liang, F.; Tong, P.; Zhang, Y.; Jin, Y.; Wang, H.; Wu, C.; Wang, J. Analysis of fruit quality and division of eugenic zone in differentgray jujube producing regions in Southern Xinjiang. J. Huazhong Agric. Univ. 2021, 40, 123–132. [Google Scholar]
  54. Shi, Q.; Han, G.; Liu, Y.; Jiang, J.; Jia, Y.; Li, X. Nutrient composition and quality traits of dried jujube fruits in seven producing areas based on metabolomics analysis. Food Chem. 2022, 385, 132627. [Google Scholar] [CrossRef] [PubMed]
  55. Chen, Z.; Chen, X.; Tan, Z.; Chen, Z.; Shen, D.; Ma, Y.; Zheng, Y.; Yi, S.; LÜ, Q.; Xie, R. Comprehensive fruit quality evaluation and suitable areas selection of newhall navel orange in China. Sci. Agric. Sin. 2023, 56, 1949–1965. [Google Scholar]
  56. Duan, Y.; Liu, S.; Zhu, Y.; Wang, Y.; Yan, F.; Liu, Z.; Shi, X.; Liu, P.; Liu, M. The influences of soil and meteorological factors on the growth and fruit quality of Chinese Jujube (Ziziphus jujuba Mill.). Plants 2023, 12, 4107. [Google Scholar] [CrossRef] [PubMed]
  57. Lu, C.; He, B.; Ma, S.; Zhang, M.; Wei, X.; Song, J.; Liu, W.; Li, J. Texture quality of Ziziphus jujuba cv. junzao of Tarim Basin and its relationship with meteorological factors. J. Northwest A F Univ. (Nat. Sci. Ed.) 2021, 49, 45–53. [Google Scholar]
Figure 1. Distribution map of sample points in the main producing areas of HZ fruit. (☆, ⊙, ◇, and △ represents Aksu, Bazhou, Hotan, and Kashi, respectively). The number represents the number of each sampling point.
Horticulturae 10 00864 g001
Figure 2. The difference in textural quality of HZ fruit throughout four production areas. (A) Six indices exhibiting substantial variations; (B) a standardized texture score; (C) an interactive heatmap showing 31 producing regions and texture quality indicators. The data are normalized to a value between 0 and 1. The value is closer to 1 as the yellow becomes deeper, and the value is closer to 0 as the blue becomes deeper. Significant differences at p < 0.05 are denoted by different lowercase letters.
Horticulturae 10 00864 g002
Figure 3. A total of 31 producing areas were clustered. (A) Cluster analysis was used to examine texture quality in 31 producing regions (I, II, III, IV indicate four groups). (B) Four groups of HZ fruit were analyzed for texture quality. Different lowercase letters indicate significant differences at p < 0.05.
Horticulturae 10 00864 g003
Figure 4. Relationship analysis of six texture indexes of HZ fruit (* p < 0.05, ** p < 0.01).
Horticulturae 10 00864 g004
Figure 5. An overview of meteorological data from different regions. (A) Comparison of meteorological parameters of 6–9 months in four HZ-producing locations, * p < 0.05, ** p < 0.01 (a): mean temperature (TEM); (b): maximum temperature (TEM); (c): minimum temperature (TEM); (d): sunshine day (SSD); (e): precipitation (PRE); (f): relative humidity (RHU)). (B) Pearson’s correlation (above the diagonal) and contribution ranking (below the diagonal; * p < 0.05, ** p < 0.01, × indicates no correlation) for 24 climate variables. The bold variables identify the six climate variables selected for RDA analysis; (C) PCA figure using RDA axes 1 and 2.
Horticulturae 10 00864 g005
Table 1. The variations degree of six texture indices in four producing areas.
AreaStatisticHardnessChewinessAdhesivenessCohesivenessSpringinessGumminess
HotanCV/%13.6922.8931.176.4910.3613.36
BazhouCV/%22.6912.4320.576.539.6913.67
KashiCV/%22.4632.6038.0212.4113.6428.16
AksuCV/%14.4227.3327.325.2512.0026.76
Table 2. Probability grading of texture indices and the sample proportion of each grade.
IndexGradeLowerLowMediumHighHigher
hardnessStandard (N)<17.7617.76~23.0123.02~29.7529.76~32.23>32.23
Proportion (%)9.6819.3641.9419.369.68
chewinessStandard (mJ)<97.0997.09~160.14160.15~231.96231.97~273.09>273.10
Proportion (%)9.6819.3641.9419.369.68
adhesivenessStandard (N·s)<0.0290.03~0.040.05~0.060.061~0.07>0.07
Proportion (%)22.5812.9041.9419.363.23
cohesivenessStandard<0.360.36~0.370.38~0.410.42~0.45>0.45
Proportion (%)12.9029.0329.0319.369.68
springinessStandard (mm)<2.432.43~2.592.60~3.153.16~3.52>3.52
Proportion (%)9.6819.3641.9419.369.68
gumminessStandard (N)<35.9235.92~53.5353.54~69.9669.97~86.28>86.28
Proportion (%)9.6819.3641.9419.369.68
Table 3. Results of stepwise regression among indices of HZ fruit texture quality.
Dependent VariableRegressionR2Fp-Value
Hardness (x1)y1 = 54.532 − 109.815x3 + 0.385x50.5566.510<0.001
Chewiness (x2)y2 = 58.328x4 + 2.837x50.973177.012<0.001
Cohesiveness (x3)y3 = 0.267 + 0.075x4 − 0.003x10.75114.465<0.001
Springiness (x4)y4 = −0.026x5 + 0.011x2 + 4.491x30.89038.702<0.001
Gumminess (x5)y5 = 0.449x1 + 0.32x2 − 15.94x40.95294.507<0.001
Adhesiveness (x6)y6 = 0.08 − 0.001x1 − 0.028x3 − 0.001x40.0820.4300.823
Table 4. Principal component analysis of HZ fruit texture quality.
IndexPC1PC2PC3
Hardness (x1)−0.4640.8020.203
Chewiness (x2)0.9090.3810.051
Adhesiveness (x3)0.281−0.3670.885
Cohesiveness (x4)0.826−0.371−0.216
Springiness (x5)0.9260.016−0.133
Gumminess (x6)0.8080.5200.125
Eigenvalue3.3151.3320.907
Variance contribution (%)55.24222.20215.119
Percent of variance (%)55.24277.44492.563
Table 5. Probability grading of comprehensive score of HZ fruit texture indices.
GradePoorRelatively PoorMediumGoodExcellent
Comprehensive score<−1.480−1.479~(−0.728)−0.727~0.7800.781~1.700>1.700
Sample361363
Proportion (%)9.67719.35541.93519.3559.677
Table 6. Ranking of the comprehensive score of HZ fruit core texture quality.
Regionsy1 Scorey2 Scorey3
Score
Comprehensive ScoreRankRegionsy1 Scorey2 Scorey3
Score
Comprehensive ScoreRank
Bazhou-22.291.580.771.871Kashi-4−0.450.150.73−0.1117
Hotan-12.731.1−0.711.782Hotan-7−0.44−0.341.33−0.1318
Bazhou-42.49−0.141.641.723Aksu-8−0.870.20.23−0.4319
Bazhou-32.68−0.010.161.624Aksu-9−1.260.840.48−0.4720
Hotan-22.66−0.750.631.515Aksu-2−1.271.2−0.8−0.621
Bazhou-52.45−1.660.371.136Kashi-6−1.671.5−0.54−0.7222
Hotan-51.81−0.650.841.067Kashi-5−1.491.1−0.73−0.7423
Hotan-41.70.07−0.240.998Aksu-6−1.540.45−0.49−0.8924
Kashi-11.36−0.20.280.819Aksu-5−1.59−0.07−0.39−1.0325
Bazhou-11.44−0.18−0.330.7610Aksu-4−1.37−20.85−1.1626
Kashi-2−0.452.9−0.30.3811Aksu-7−1.7−1.471.07−1.227
Bazhou-6−0.061.280.460.3412Kashi-8−1.94−0.270.17−1.228
Aksu-1−0.111.120.320.2613Kashi-9−1.52−1.56−1.63−1.5529
Hotan-60.550.54−1.280.2514Kashi-7−3.22−0.90.92−1.9930
Hotan-30.91−1.55−1.35−0.0515Aksu-3−3.42−0.720.37−2.1531
Kashi-31.29−1.57−2.85−0.0716
Disclaimer/Publisher’s Note: The statements, opinions and data contained in all publications are solely those of the individual author(s) and contributor(s) and not of MDPI and/or the editor(s). MDPI and/or the editor(s) disclaim responsibility for any injury to people or property resulting from any ideas, methods, instructions or products referred to in the content.

