Article

Integrating Spectral Sensing and Systems Biology for Precision Viticulture: Effects of Shade Nets on Grapevine Leaves

1
Department of Geosciences, Environment and Spatial Planning, Faculty of Sciences of the University of Porto, Rua do Campo Alegre, S/N, 4169-007 Porto, Portugal
2
INESC TEC—Institute for Systems and Computer Engineering, Technology and Science, Campus of the Faculty of Engineering of the University of Porto, Rua Dr. Roberto Frias, S/N, 4200-465 Porto, Portugal
3
Associação para o Desenvolvimento da Viticultura Duriense, Edifício Centro de Excelência da Vinha e do Vinho Parque de Ciência e Tecnologia de Vila Real, Régia Douro Park, 5000-033 Vila Real, Portugal
4
GreenUPorto—Sustainable Agrifood Production Research Centre and Inov4Agro, Departamento de Biologia, Faculdade de Ciências da Universidade do Porto, Rua do Campo Alegre s/n, 4169-007 Porto, Portugal
5
iB2Lab, LAQV-REQUIMTE, Biology Department, Faculty of Sciences of the University of Porto, Rua do Campo Alegre s/n, 4169-007 Porto, Portugal
*
Author to whom correspondence should be addressed.
Horticulturae 2024, 10(8), 873; https://doi.org/10.3390/horticulturae10080873
Submission received: 9 July 2024 / Revised: 15 August 2024 / Accepted: 16 August 2024 / Published: 18 August 2024

Abstract

:
This study investigates how grapevines (Vitis vinifera L.) respond to shading induced by artificial nets, focusing on physiological and metabolic changes. Through a multidisciplinary approach, grapevines’ adaptations to shading are presented via biochemical analyses and hyperspectral data that are then combined with systems biology techniques. In the study, conducted in a ‘Moscatel Galego Branco’ vineyard in Portugal’s Douro Wine Region during post-veraison, shading was applied and predawn leaf water potential ( Ψ p d ) was then measured to assess water stress. Biochemical analyses and hyperspectral data were integrated to explore adaptations to shading, revealing higher chlorophyll levels (chlorophyll a-b 117.39% higher) and increased Reactive Oxygen Species (ROS) levels in unshaded vines (52.10% higher). Using a self-learning artificial intelligence algorithm (SL-AI), simulations highlighted ROS’s role in stress response and accurately predicted chlorophyll a (R2: 0.92, MAPE: 24.39%), chlorophyll b (R2: 0.96, MAPE: 17.61%), and ROS levels (R2: 0.76, MAPE: 52.17%). In silico simulations employing flux balance analysis (FBA) elucidated distinct metabolic phenotypes between shaded and unshaded vines across cellular compartments. Integrating these findings provides a systems biology approach for understanding grapevine responses to environmental stressors. The leveraging of advanced omics technologies and precise metabolic models holds immense potential for untangling grapevine metabolism and optimizing viticultural practices for enhanced productivity and quality.

Graphical Abstract

1. Introduction

1.1. Grapevine Biology Modulation under Light Stress

In grapevine cultivation, shade nets modulate plant microclimate and mitigate the adverse effects of excessive light exposure and temperature fluctuations driven by changing climatic conditions [1]. While this practice contributes to conserving water resources [2], it also presents a challenge due to the existing gap in knowledge concerning the physiological implications of shade nets on grapevine irrigation requirements and on overall plant performance. Addressing this deficiency necessitates an integrated physiological framework capable of deciphering the interactions among plant physiology, environmental factors, and cultural practices, with support through a systems biology approach.
This study investigates how spectral data can be applied in the context of systems biology and combined with the field of precision viticulture (PV). To make a proof of concept, this paper presents a case study to show the effects of shade nets on grapevines. By focusing on photorespiration, the study aims to demonstrate the potential for combining spectral data with systems biology to describe the central metabolism mechanisms of grapevine responses to shading, specifically regarding Reactive Oxygen Species (ROS) accumulation.
This research hypothesizes that integrating spectral data with systems biology can elucidate plant phenotypes and physiological mechanisms influenced by shading, thereby supporting PV practices. The concept of “phenometabolome”, encompassing the entirety of the grapevine’s metabolic phenotypes in response to shading conditions, is presented to explore these effects. This term covers a wide array of metabolic pathways and enzymatic reactions affected by changes in light availability, offering a holistic view of grapevine physiology under varying environmental conditions. By integrating metabolic models and in silico data, the study seeks to unravel the metabolic pathways affected by shading conditions, thus shedding light on the biological interactions driving grapevine responses [3].
Table 1 reviews a battery of enzymes and metabolites/compounds pivotal for the metabolic pathways governing grapevine responses to light-induced stress. This table serves two primary purposes: (i) identification and analysis—examining enzyme activity under specific light conditions to reveal patterns of activation or repression, thereby providing insights into how grapevines respond to varying light intensities and durations—and (ii) qualitative model analysis of critical metabolic processes, such as water availability, photorespiration, CO2 absorption during photosynthesis, and sugar formation, which are all crucial for understanding grapevine responses to light stress within a systems biology approach.

1.2. Systems Biology to Unravel Grape Physiology under Light Stress

As an interdisciplinary approach, systems biology takes the lead in unravelling the complexities of biological systems [13]. It examines components and interactions as an integrated whole, recognizing that biological events arise from dynamic relationships among various molecular, cellular, and environmental factors [14]. By integrating omics data with computational modelling, systems biology elucidates the molecular mechanisms governing plant growth, development, and responses to environmental inducements [13].
While traditional models like WOFOST [15], APSIM [16], STICS [17], and others focus on predicting crop performance based on external factors and management practices, systems biology offers a holistic perspective for understanding crop physiology and environmental interactions [18], integrating various biological components to unravel the complex relationships among genes, proteins, metabolites, and physiological processes [19]. This combination bridges traditional agricultural practices with cutting-edge scientific methodologies, signifying a paradigm shift in advancing the precision and sustainability of modern agriculture [18] by acknowledging the interconnection of crops and their environment and seeking to leverage this understanding to optimize agricultural outcomes.
One of the critical applications of systems biology in agriculture is in the development of virtual phenotyping, involving creating a computational model to predict plant characteristics based on metabolite profiles, enzymatic activities, and gene expressions [13]. Integrating bioinformatics tools, such as Flux Balance Analysis (FBA) [20], enhances the understanding by providing perceptions of cellular components and connectivity within metabolic pathways. With virtual phenotyping established as a powerful tool, its applications across various crops have been extensively studied, enabling the examination of metabolic shifts [21], enzymatic responses [22], and gene activation in plant physiology [23], thereby optimizing agricultural practices for enhanced productivity and sustainability. Incorporating physiological diagnosis into virtual phenotyping allows the assessment of plant responses to diverse environmental conditions [24,25], thereby contributing to informed decision-making in crop management practices.

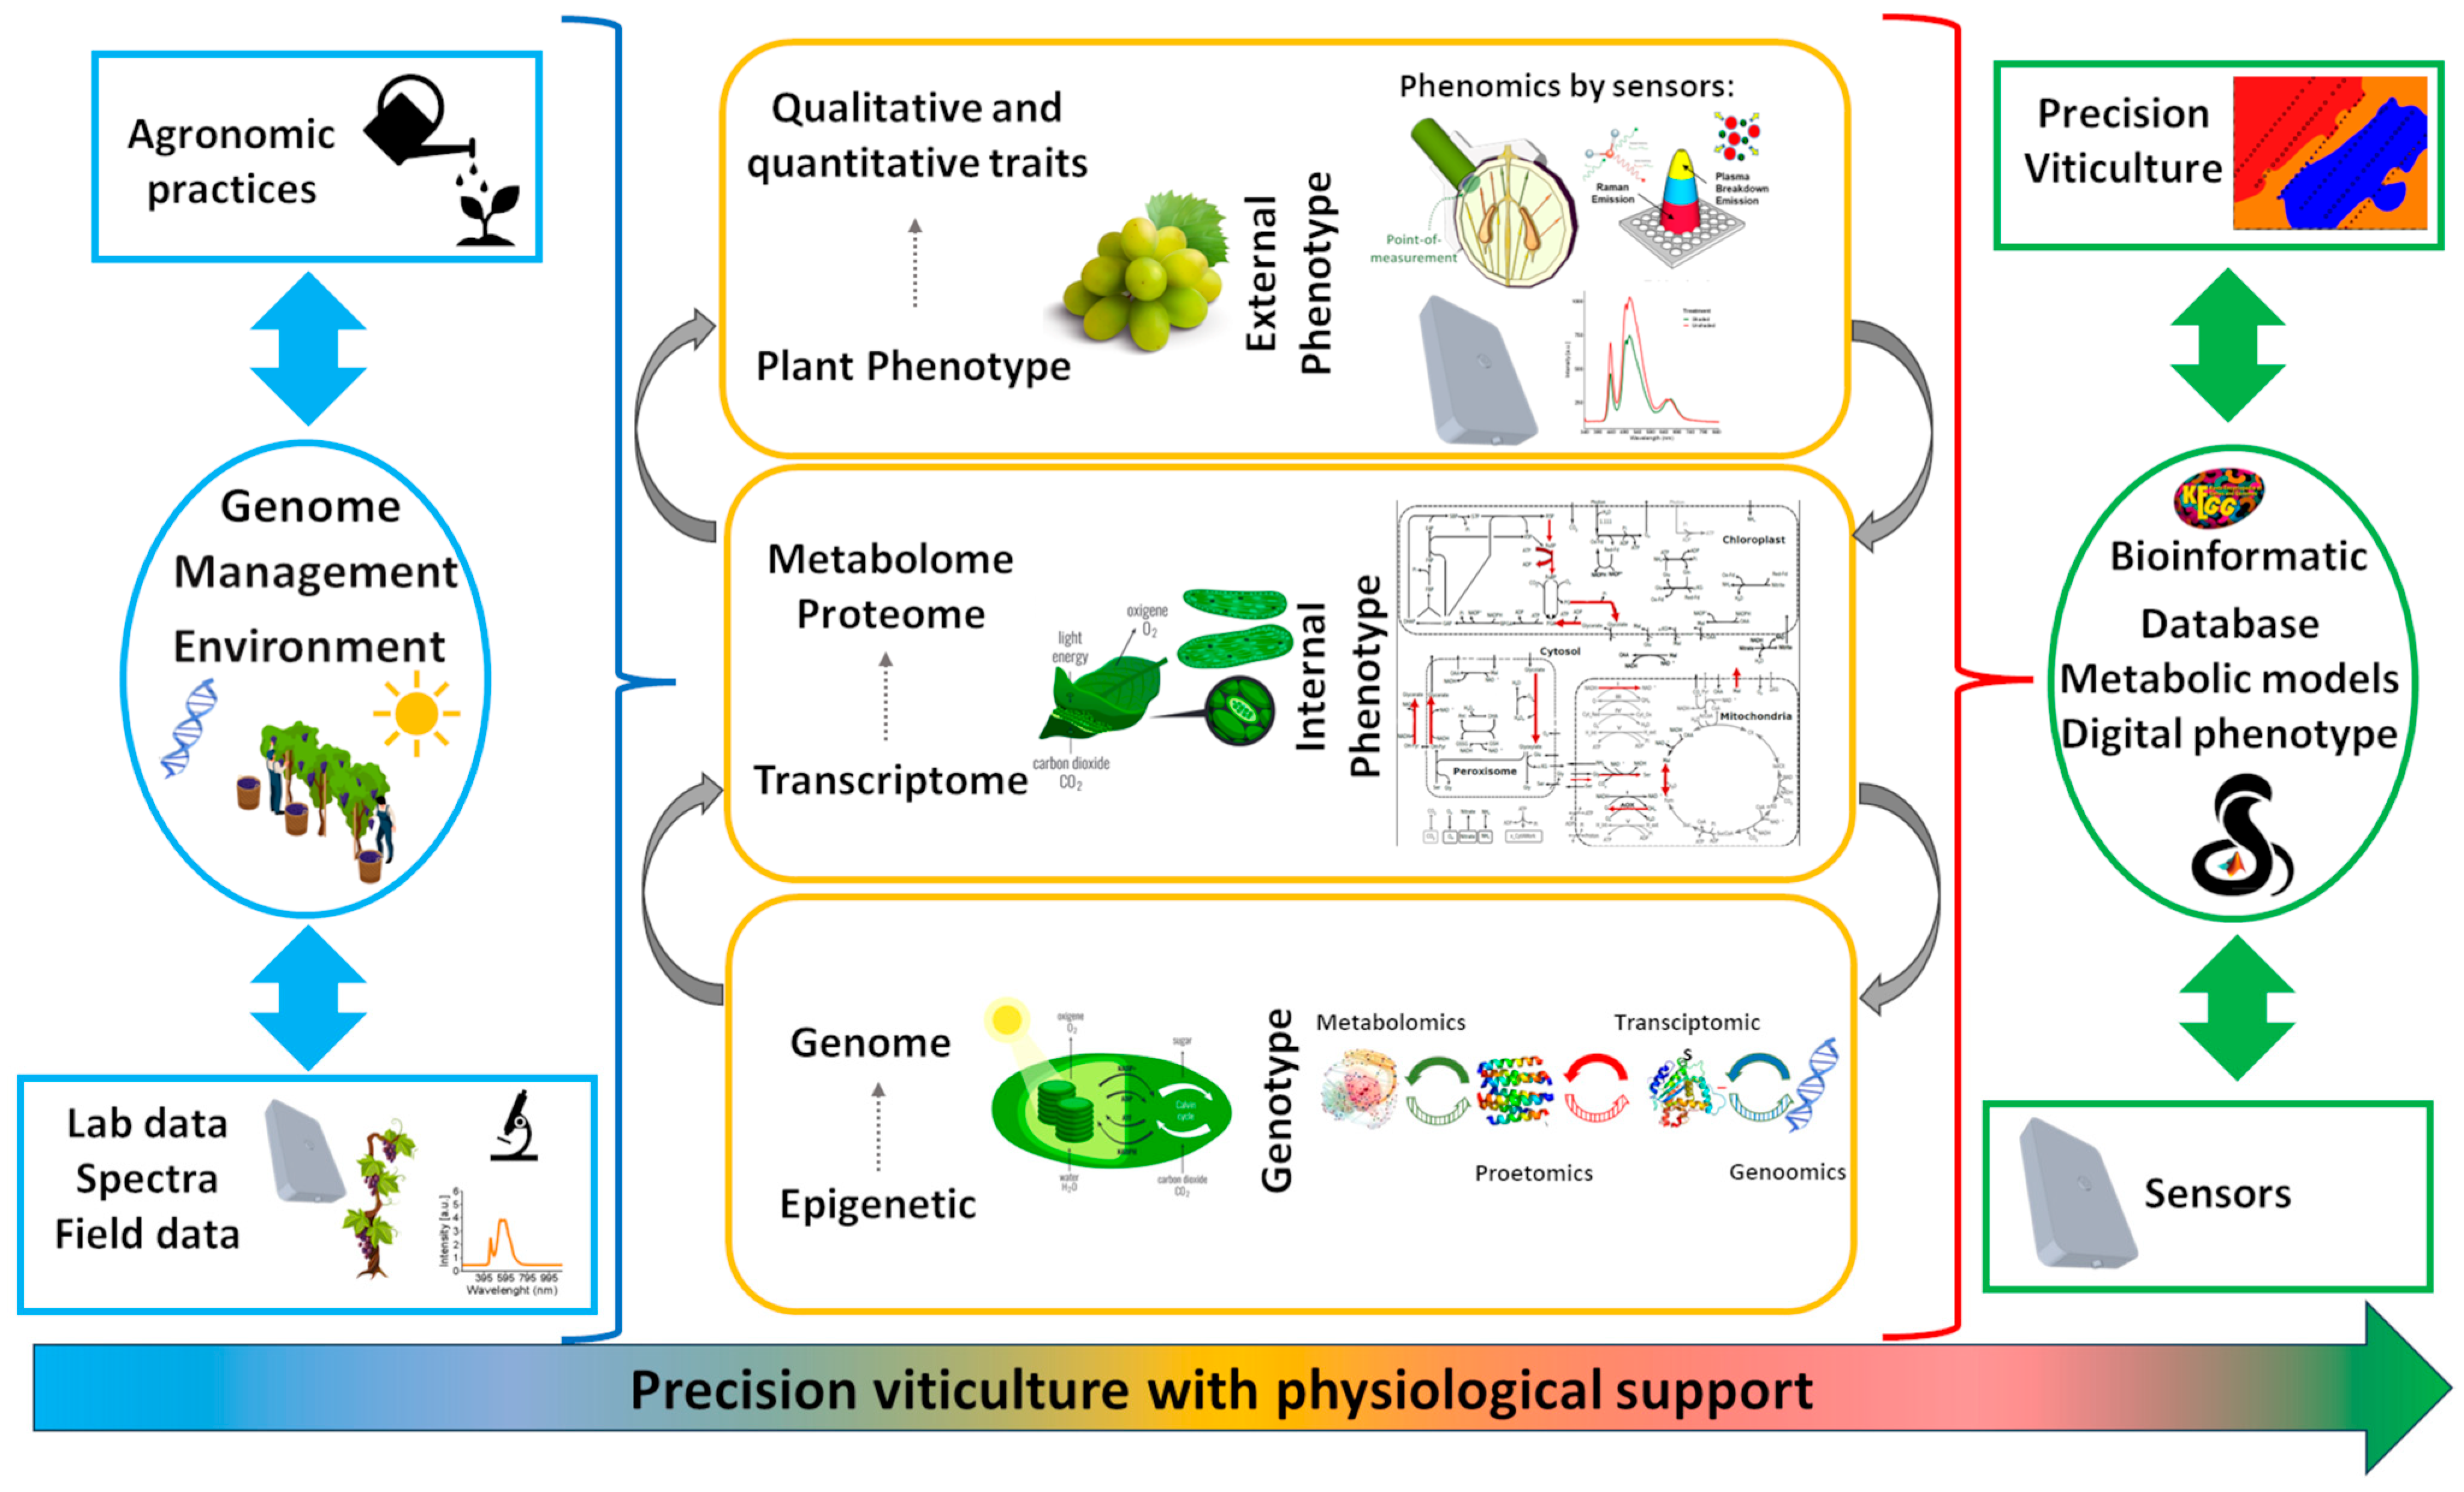
1.3. Integrating Plant Spectral Sensing and Systems Biology

Conventional laboratory-based methodologies for plant biochemical analysis, while indispensable for supporting systems biology models, present several limitations, including high costs, laborious procedures, and the consumption of sample volumes, which may not be feasible for rare plants [26,27]. Hence, there is a need for non-destructive, cost-effective, and efficient alternatives that can complement traditional methods and enhance the scope of systems biology research.
Hyperspectral sensors allow for the real-time monitoring of biochemical variables like foliar pigments, which can predict levels of chlorophylls [28], carotenes [29], anthocyanins [30], as well as flavonoids [31] and ROS [32]. This study hypothesizes that hyperspectral data can model foliar pigments and ROS, making it a novel approach through the integration of systems biology with hyperspectral data in order to investigate the impact of shade on photorespiration in grapevines.
Figure 1 illustrates an integrated methodology for showing plant responses through the merging of genomics, metabolomics, and systems biology approaches. This framework enables the establishment of connections between laboratory experiments and field observations, facilitating a more profound knowledge of grapevine physiology under varying environmental conditions. Central to this methodology is the integration of sensors for detecting molecular components with the monitoring of the physiological state of plants in real time. By leveraging high-throughput, high-resolution, and high-dimensionality techniques, this approach offers a holistic view of plants’ responses to abiotic stress, paving the way for more precise and tailored agricultural practices. By leveraging advanced analytical techniques, such as omics technologies, it is possible to investigate the molecular mechanisms governing plant responses to environmental inducements, thereby optimizing agricultural practices for enhanced productivity and sustainability.
Bioinformatics tools enable the explanation of metabolic engineering in plants by representing metabolic pathways through stoichiometric matrices and employing network-based or constraint-based modelling techniques [33]. These models, often available in the Systems Biology Markup Language (SBML) format, facilitate the understanding of metabolic pathways despite occasional limitations in accessing genetic and proteomic information [34].
By investigating these effects, this paper aims to demonstrate how systems biology can elucidate the phenotype observed in the field, focusing on the specific case of shade nets. The study utilizes a qualitative analysis approach, which involves comparing assumptions with experimental data. This method helps integrate metabolic models and in silico data to elucidate how shading conditions affect metabolism. By incorporating spectral data and biochemical variables such as foliar pigments, water status, and ROS levels, this research aims to reveal the complex biological interactions driving grapevine responses to shade. The specific objectives of the study include (i) the modelling of foliar pigments (chlorophylls) and ROS using hyperspectral data, (ii) initiating the development of a virtual phenotype and validating certain potential behaviors within the photorespiration pathway under both shaded and unshaded conditions, and (iii) identifying key enzymes and reactions involved in these processes.

2. Materials and Methods

2.1. Test Site and Sampling

The study was conducted at Quinta de Vale de Cavalos (latitude 41°07′ N, longitude 7°28′ W and 500 m of altitude), which belongs to Poças Vinhos, located in Numão in the Douro Wine Region. The Douro region’s Mediterranean-like climate entails warm, dry summers with pronounced hydric stress typically observed post-flowering. Viticulture in this region occurs under particularly rigorous climatic conditions, with vineyards primarily situated on terraces and slopes in soils predominantly derived from shale. These vineyards are in some of Europe’s most arid areas. During the grape ripening period, precipitation is generally lower than 30 mm, accompanied by high solar irradiation values, elevated temperature levels, and a high vapor pressure deficit, leading to combined light, thermal, and hydric plant stresses [35]. Rainfall is ≤28 mm in 80% of the years between approximately July 20 and September 20, and the available water reserve at the end of this period is always ≤20%, causing lower berry weight and, consequently, lower wine yields when irrigation is not feasible [36].
This study focused on the grape (Vitis vinifera L.) variety ‘Moscatel Galego Branco’ (Vitis International Variety Catalogue—VIVC 8031) within a non-irrigated, commercial parcel encompassed by sections shaded by nets that were installed above and to the sides of the grapevine rows. The experiment was conducted in both shaded and unshaded sections of the parcel. Leaf analysis was performed on a single date at the end of maturation (S1: 26/08/2022). One fully developed leaf was collected from each of the grapevines, with ten grapevines selected from shaded areas and ten from unshaded areas, resulting in a total of twenty leaves collected.

2.2. Phenotype Characterisation

2.2.1. Hyperspectral Data

Hyperspectral data were obtained from the leaves described in the previous subsection by collecting a single point measurement on each leaf before detaching them from the grapevine, using a point-of-measurement hyperspectral prototype device [37]. In this prototype, light is received by a central pinhole fiber and delivered by surrounding fibers, enabling it to penetrate the leaf. This device recorded reflectance signatures across the electromagnetic spectrum (340 nm to 850 nm). A well-developed leaf was selected, and three data points were collected from different areas of the leaf. The average of these data points was used for spectral representation. The spectral data will be used to develop a predictive model of plant pigments and ROS (see next section).

2.2.2. Water Status

Predawn leaf water potential ( Ψ p d ) was measured on the same leaf from which hyperspectral information was obtained using a Scholander pressure chamber (PMS600, Albany, OR, USA) [38], thereby providing a characterization of the effect of the net shades on plant water status and characterizing the phenotypes under different treatments.

2.3. Biochemical Analysis

2.3.1. Pigments Analysis

A 100 mg fresh grapevine leaf sample was used to quantify pigments. The leaves sampled in the test site were stored at −80 °C and then processed using liquid nitrogen. Pigments were extracted using an Acetone:Tris-HCl (50 mM) buffer (80:20, pH 7.8) [39]. Maceration was performed on a tissuelyser at 6 m/s with 2.4 mm ceramic beads, and 663 nm, 537 nm, 647 nm, and 470 nm readings were obtained resorting to a spectrophotometer (Omega Multimode Microplate Reader, BMG LABTECH GmbH, Ortenberg, Germany) to determine chlorophyll a and b levels. Each sample was analyzed in triplicate to ensure accuracy. Results are presented as mg/g of fresh mass (FM) (mg/gFM).

2.3.2. Superoxide ( O 2 . ) Quantification for ROS Assessment

A total of 100 mg of fresh leaf was used. Extraction occurred on a tissuelyser at 6 m/s, resorting to 2.4 mm ceramic beads. The extraction buffer was comprised of 0.01 M phosphate buffer (pH = 7.8), 0.05% (w/v) NBT (diluted in 100 µL of DMSO), and 10 mM sodium azide. After shaking, samples were stored in the dark, followed by centrifugation (13,000× g, 2 min, 4 °C) and heating (85 °C, 10 min); after, it was placed on ice for 10 min. Superoxide ( O 2 . ) levels, indicative of ROS activity, were quantified at 580 nm using a spectrophotometer (Omega Multimode Microplate Reader, BMG LABTECH GmbH, Ortenberg, Germany) [40,41]. Each sample was analyzed in triplicate to ensure accuracy. The unit is presented as absorbance per gram of fresh matter (ABS/gFM).

2.4. Spectral Biochemical Modelling Approach

The Vis-NIR data predicted the chlorophylls and the ROS. The aforementioned preprocessing steps were undertaken to ensure the reliability and accuracy of the leaf spectral data. Potential outliers that could bias the results were identified and removed. A logarithm multiplicative scattering correction (MSC-log) technique was applied to the spectral data. This correction method helps to enhance the spectral features and mitigate any variations caused by scattering effects, thereby improving the overall quality of the data [42].
The modelling of spectra-laboratory analysis (pigments and ROS) was subjected to modelling via a self-learning artificial intelligence algorithm (SL-AI) [43]. The utilization of the SL-AI is validated by its proficiency in establishing correlations between spectral attributes, its not requiring a minimum dataset size, and its ability to analyze biochemical parameters through Covariance Mode (CovM) analysis. The justification for employing the SL-AI also stems from its proficiency in managing datasets characterized by variations and its proven track record in accurately predicting grapevine biochemical characteristics, as evidenced in previous studies [44,45].
The SL-AI base model was evaluated using the following statistical metrics: coefficient of determination (R2), root mean square error (RMSE), and mean absolute percentage error (MAPE—%).

2.5. In Silico Simulations

The photorespiration model proposed by Huma, et al. [46] was considered for the in silico simulations of the photorespiration process under different shading conditions. The literature reviewed in Table 1 shows the potential impacts on metabolites involved in photorespiration synthesis under shaded and unshaded conditions.
The chlorophyll and ROS levels measured in the laboratory and those estimated through SL-AI were incorporated into the photorespiration model to elucidate the differences in each shading condition.
This study hypothesizes that under conditions of excessive light exposure, grapevines experience an elevation in ROS and a decline in chlorophyll levels. Also, grapevines activate a mechanism to increase chlorophyll production under shaded conditions, compensating for reduced photon availability. Two scenarios were considered to represent the impact of plant shade nets on leaf physiological adaptative mechanisms: (i) in unshaded scenarios, leaves exhibit a lower photosynthetic efficiency, around 80%, yet remain free from oxidative stress; and (ii) in shaded conditions, leaves become more efficient due to increased chlorophyll production, enabling photosynthetic rates to surpass those of sun-exposed leaves due to the absence of oxidative stress by preventing the accumulation of ROS.
Furthermore, under excessive light conditions, the costs of energy and ATP to mitigate ROS accumulation may compensate for the benefits of increased photon capture. Conversely, shaded plants may achieve greater energy efficiency in the Calvin cycle due to reduced ROS-induced oxidative stress [47].
This study employs systems biology approaches focusing on key reactions, such as the peroxisomal catalase reaction and the peroxisomal glycolate oxidase reaction that were presented in the model used for the simulations [46]. These reactions are incorporated into the in silico model to simulate grapevine photorespiration under different light conditions. Specifically, three photorespiration simulation hypotheses are formulated: (i) Photorespiration I (PH I): modifying the peroxisomal catalase reaction in response to ROS fluctuations within shaded environments, what changes would occur in fluxes?; (ii) Photorespiration II (PH II): how would fluxes be affected by manipulating the peroxisomal glycolate oxidase reaction?; and (iii) Photorespiration III (PH III): if the peroxisomal catalase reaction and the glycolate oxidase reaction were adjusted, what alterations would be observed in fluxes?
In silico simulations were generated using the Cobra toolbox (version 3.1) for MATLAB (MathWorks Inc., Natick, MA, USA, 2022) [34] with the glpk solver (version 4.47), aiming to solve the relationship S v = 0 . This equation, fundamental in systems biology, embodies the mass balance principle or stoichiometry. Here, S represents the stoichiometric matrix, delineating the stoichiometric coefficients of metabolites engaged in biochemical reactions within the biological system. Each row of the matrix corresponds to a metabolite, while each column corresponds to a reaction. Conversely, v symbolises the vector of reaction rates or fluxes, indicating the flow or rate of each reaction. The equation S v = 0 stipulates that the product of the stoichiometric matrix S and the vector of reaction rates v equals zero under steady-state conditions. This principle underscores mass conservation, ensuring that the total metabolite production rate equals its consumption within the system.
The in silico model utilized for these simulations had specified lower and upper bounds in abstract units. The lower bound was set to zero, while the upper bound was determined as the maximum value for these reactions, also expressed in abstract units. However, for the qualitative analysis in this paper, the lower bound remained at zero. In contrast, the upper bound was set to 100 to represent the lower values of ROS observed in laboratory analyses. The percentage variations were applied to the upper bound of these objective reactions in the simulations of varying conditions. Furthermore, Monte Carlo (MC) simulation was performed over ten times from the minimum to the maximum variance to observe changes in the phenotype space, thereby exploring the robustness and variability of the model under different conditions.
Principal Component Analysis (PCA) was used to discriminate the phenotype spaces within photorespiration from the Monte-Carlo simulations.

3. Results and Discussion

3.1. Phenotype Characterisation

This study investigated grapevines’ physiological and metabolic responses to varying light conditions, contrasting those subjected to direct sunlight with those shaded by nets.

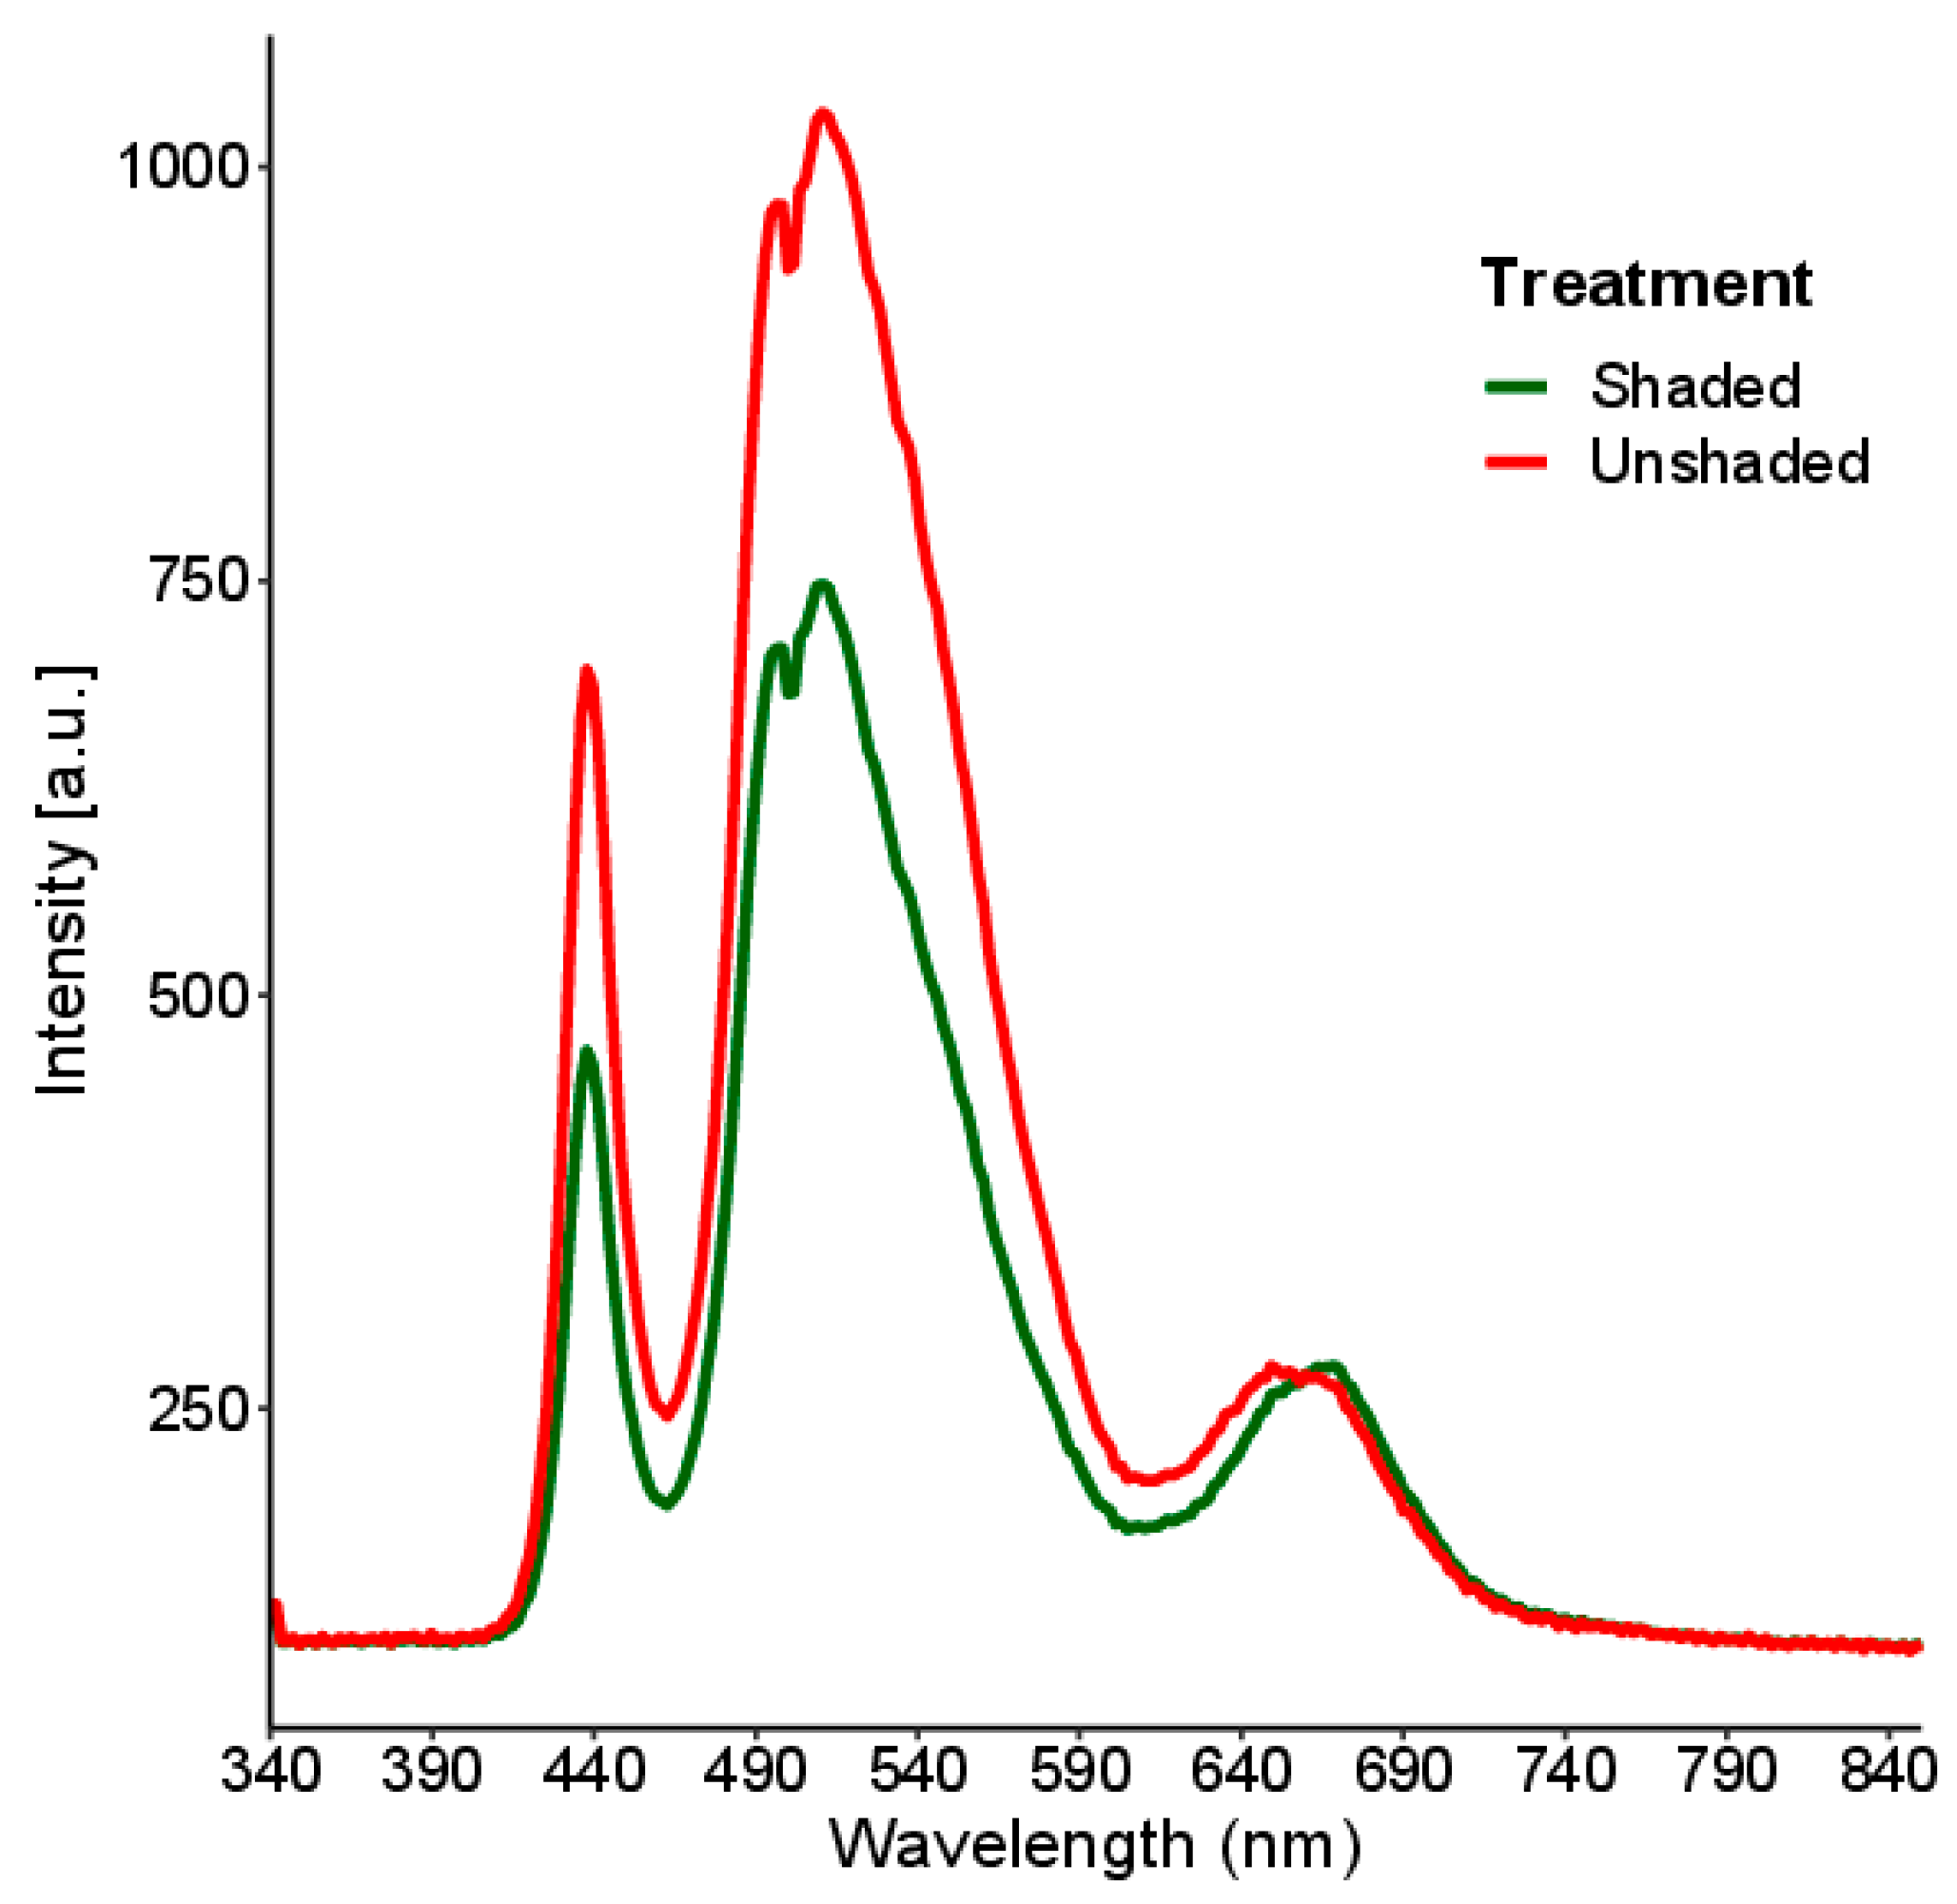
3.1.1. Hyperspectral Signatures
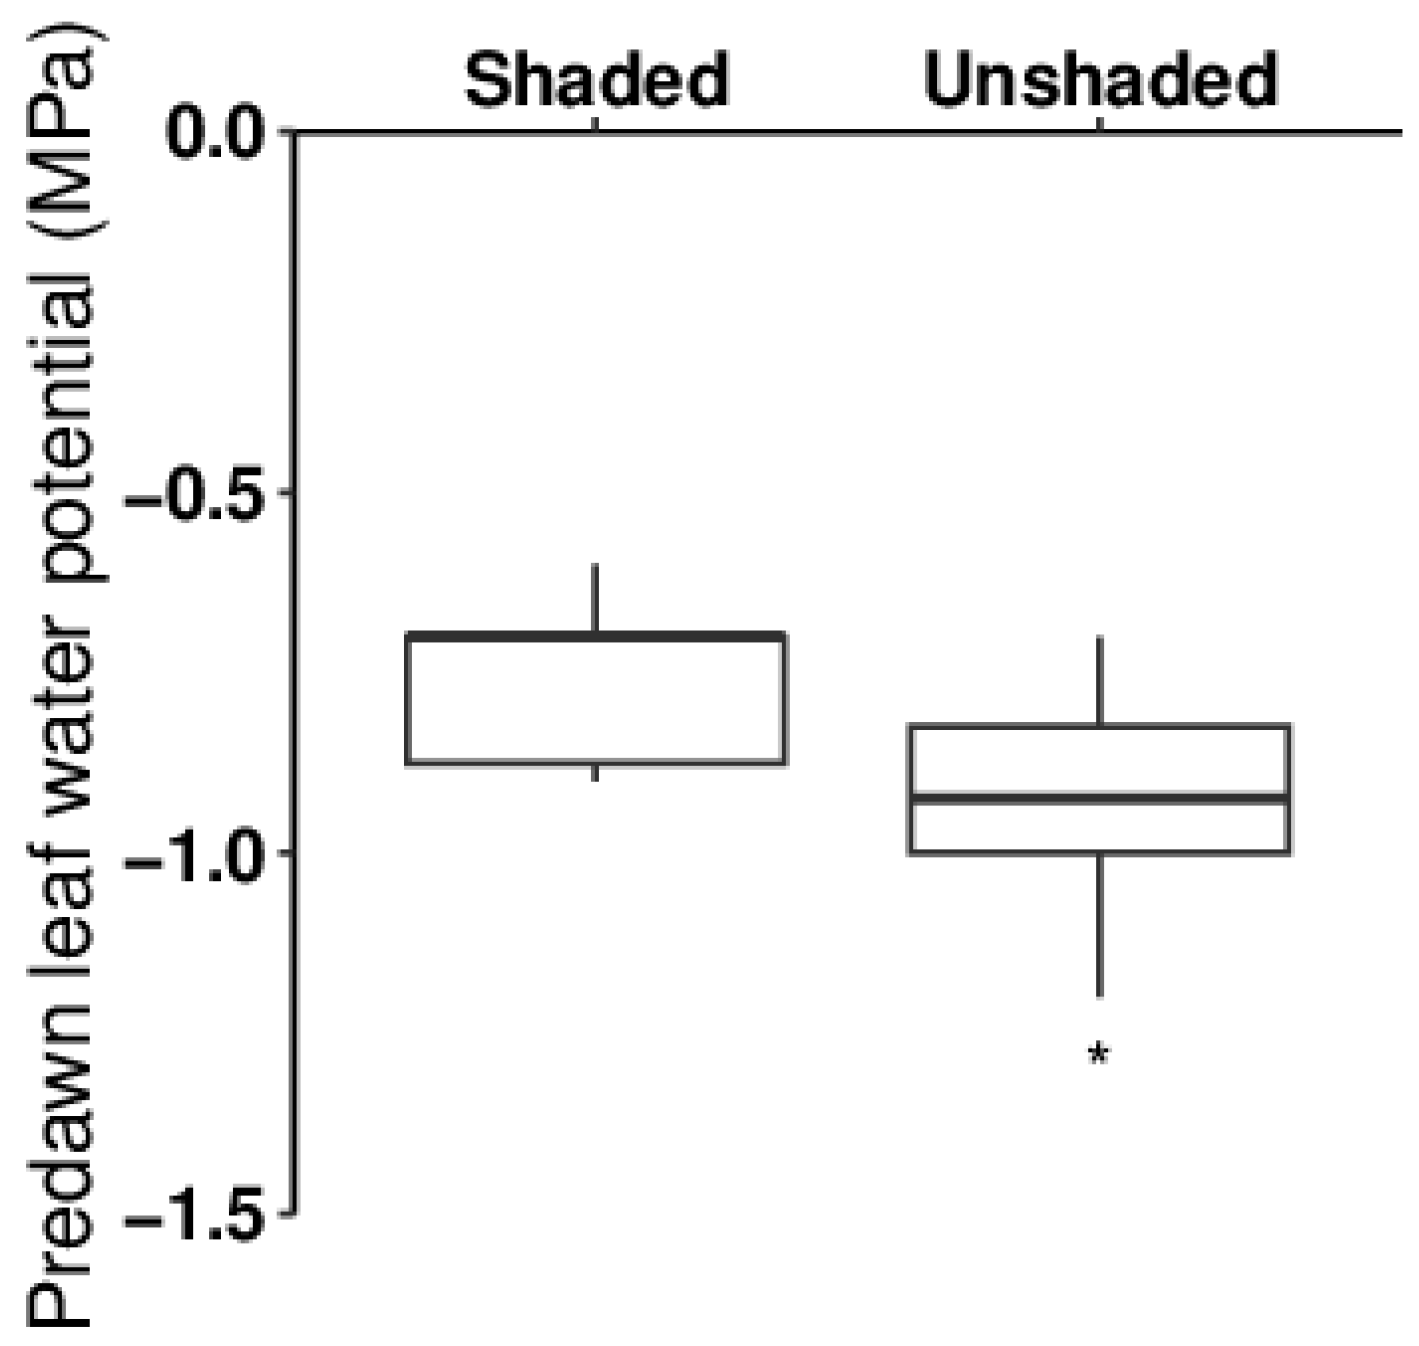
The hyperspectral analysis reveals a distinct difference in activity between plants subjected to shaded and unshaded conditions (Figure 2), showing that plants receiving less sunlight have lower values of spectra absorbance when compared to those in shaded conditions.
The observed variations in spectral patterns between grapevines exposed to sunlight and those in shaded conditions indicate distinctions in the vine phenotype (Figure 2). The shaded treatment shows a higher absorption across the blue (400–480 nm), green (481–560 nm), and red (561–700 nm) spectral zones, which are commonly associated with foliar pigments like chlorophylls [48].

3.1.2. Water Status

The differences in Ψ p d between shaded and unshaded grapevines (Figure 3) underscore the influence of light availability on plant water status [49,50]. Specifically, grapevines in unshaded conditions showed lower Ψ p d values, suggesting elevated water uptake and transpiration rates, possibly due to heightened metabolic activity and photosynthetic capacity in response to abundant sunlight [11,47]. However, grapevines may close their stomata in stressful conditions, reducing transpiration [51]. In such cases, alternative mechanisms are needed to dissipate the excess energy, particularly in the unshaded treatment. These observations align with the concept of phenometabolome, suggesting that shade nets modulate grapevine physiology, particularly influencing photorespiration [52].

3.1.3. Pigment and ROS Analysis

The pigment analysis in Table 2 revealed a significant difference in chlorophyll a and a + b levels. Under shaded conditions, plants exhibited heightened production of photosynthetic pigments, enhancing their ability to capture and utilize light energy efficiently. The higher chlorophyll level in shaded grapevines indicates a compensatory mechanism to optimize light capture and energy transduction under reduced light availability [29]. This aspect can be further clarified by examining the profile of chlorophyll a and b. Specifically, understanding the balance between chlorophyll a (typically associated with photosynthetic activity) and chlorophyll b (which plays a role in light harvesting and photoprotection) [53,54] could provide insights into the metabolic processes. Variations in these ratios may indicate shifts in the plant’s balance between catabolic and anabolic pathways, including the chlorophyll synthesis cycle. These shifts reflect the plant’s adaptations to environmental conditions such as light availability. For instance, increased chlorophyll synthesis under low light conditions can enhance light capture efficiency, while higher catabolic activity in high light conditions may be linked to increased energy demands and ROS detoxification processes [55]. Exploring these variations further could offer deeper insights into the dynamic regulatory mechanisms plants employ to optimize their metabolic responses to changing environments. Therefore, analyzing chlorophyll a/b ratios can provide information about the physiological responses of grapevines to varying light conditions, shedding light on their metabolic adjustments for enhanced survival and productivity.
Regarding ROS, there was also a decrease in ROS levels in shaded plants (Table 2), which may be attributed to a reduction in the plant’s photosynthesis and energy activity levels, or to its energy efficiency despite the greater amount of chlorophylls [56]. The differences in ROS levels between shaded and unshaded plants provide further evidence of the impact of light exposure on grapevine physiology [9,56]. Higher ROS levels observed in unshaded conditions suggest a link between light intensity, ROS production, and oxidative stress [56], which supports the hypothesis that shade nets mitigate oxidative stress by influencing photorespiration, which ultimately affects ROS levels [47]. The grapevine is a species with a high tolerance to high light intensity [56]), and secondary metabolites (carotenoids, polyphenols, and aroma compounds) are important tools to counter photooxidative stress in this species, allowing its acclimation to higher radiation. These results show the role of antioxidant defense mechanisms (including enzymatic and non-enzymatic systems) in grapevines under varying light conditions [57], underscoring the importance of understanding plant-environment interactions for sustainable viticulture practices.
ROS being at homeostatic levels is essential to the plant under stress conditions, and shade maintains the eustress levels within homeostatic values. In the unshaded condition, the regulation of chlorophyll pigments allowed for increased photon capture without saturating the light-harvesting complexes. This enhanced electron transfer activity within the photophosphorylation chain led to higher ROS formation in the chloroplast [58]. When in excess (particularly in organelles that possess electron transport chains, like chloroplasts and mitochondria), ROS can damage genetic material, lipids, and proteins, among other biomolecules, ultimately leading to the degradation of the organelles and to cell disturbance. In unshaded leaves there is a high production of energy and an increase in the transport of electrons from photosynthesis, which may increase the generation of superoxide molecules, hydrogen peroxide, and the hydroxyl radical [58].

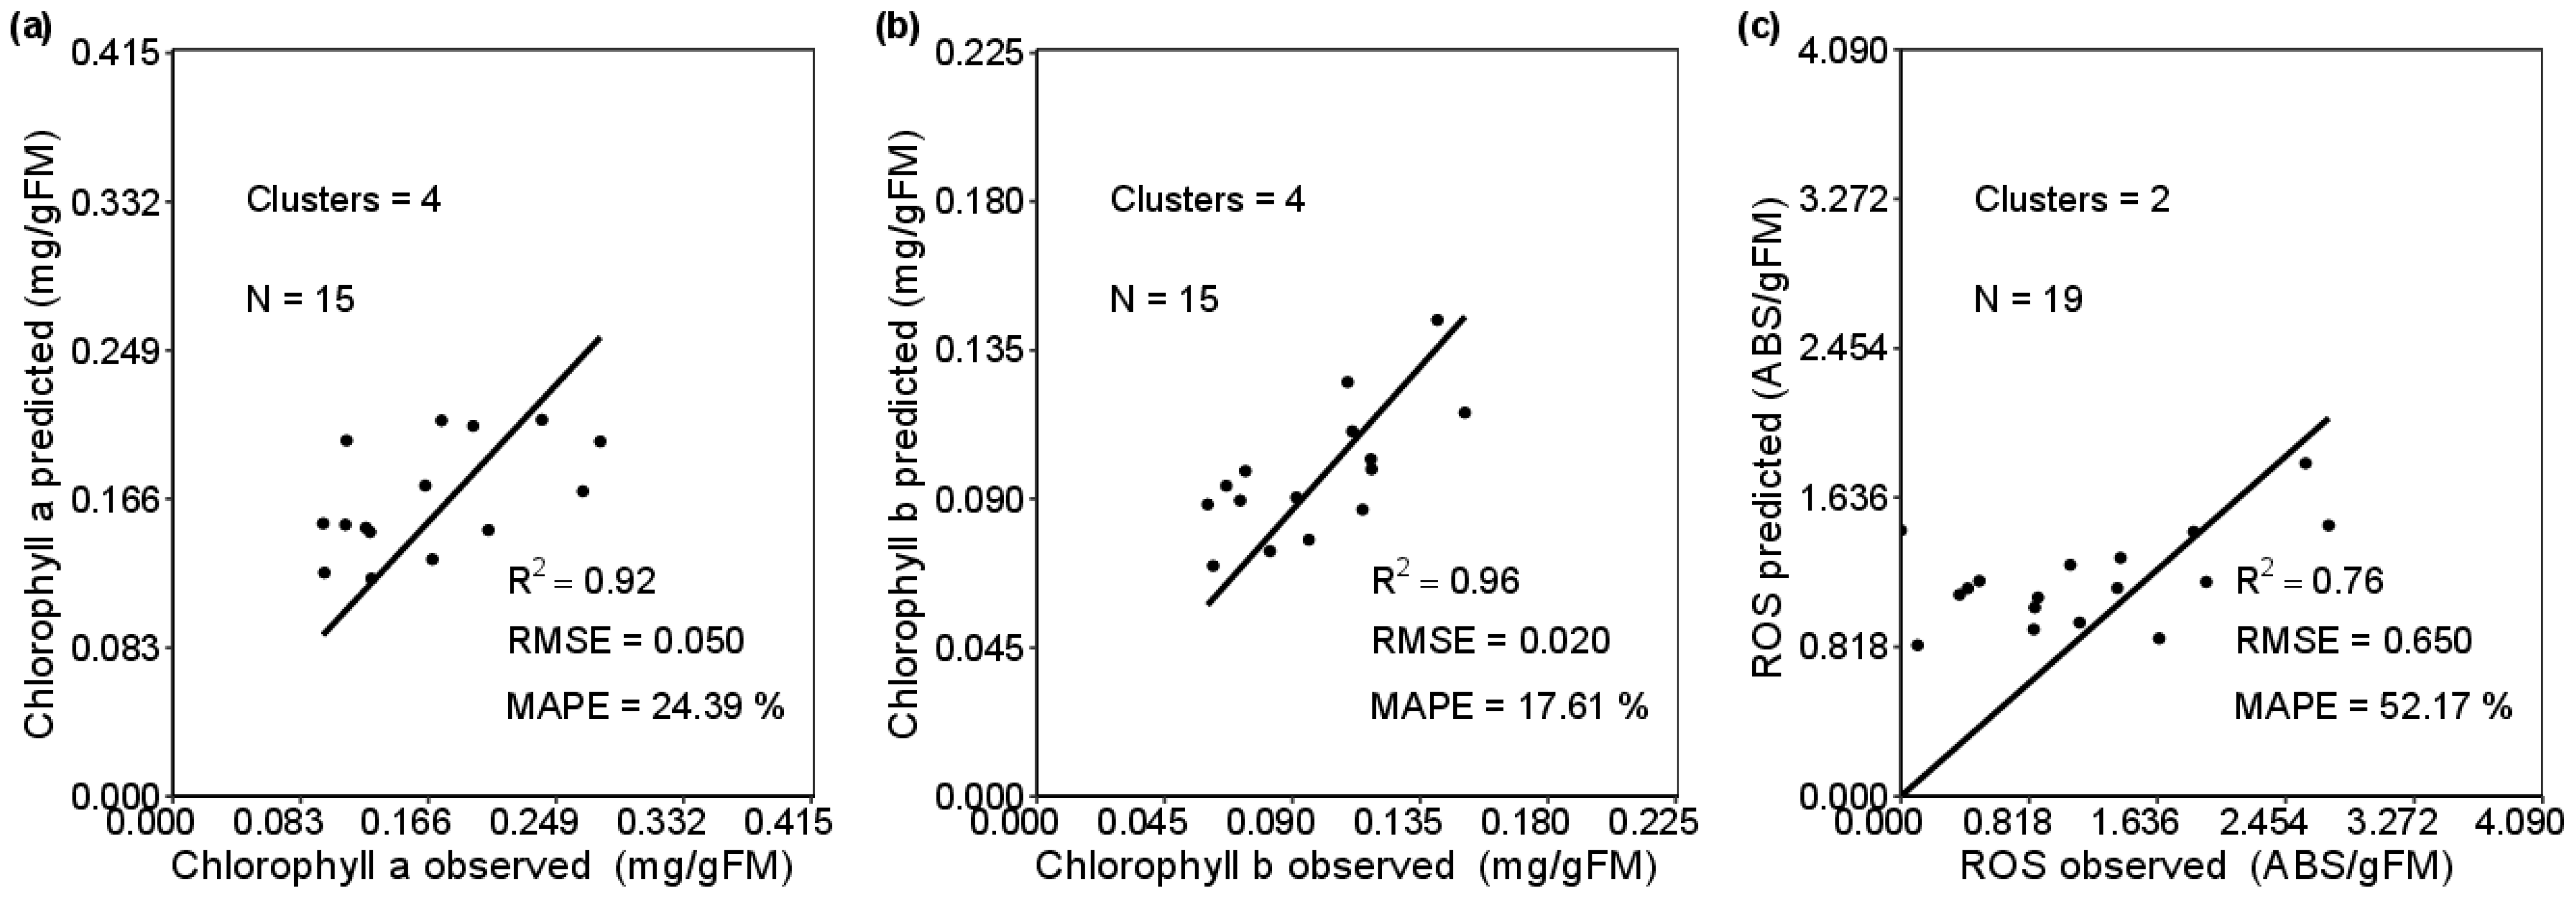
3.2. Modelling Biochemical Variables

The relationship between spectral data and metabolites bridges environmental conditions and internal biochemical processes by correlating spectral signatures with metabolites. Vis-NIR has mainly been used to quantify grapevine metabolites [59]. For example, quantifying chlorophyll through the Vis-NIR data [e.g., 28] is a proxy for water status and lacks a physiological explanation. Integrating hyperspectral data with systems biology methodologies enables a holistic understanding of how environmental factors influence plant metabolism and phenotype [13]. It can suggest vineyard management practices designed to enhance grape quality and yield based on a physiological approach.
The implementation of SL-AI in modelling chlorophyll a (mg/gFM), chlorophyll b (mg/gFM), and ROS (ABS/gFM) yielded robust statistical metrics (Figure 4) despite the limitation of a small dataset, comprising 19 observations from the shade and unshaded treatment (excluding one outlier observation). However, not all parameters were assessed across all observations due to the CovM architecture present in SL-AI. This limitation arises from the predefined number of clusters in the SL-AI, which might not effectively accommodate the diverse variations present in the dataset. Therefore, while the statistical metrics demonstrate the robustness of the model, the interpretation of the results should be cautious, considering the potential impact of data allocation constraints imposed by the SL-AI architecture.

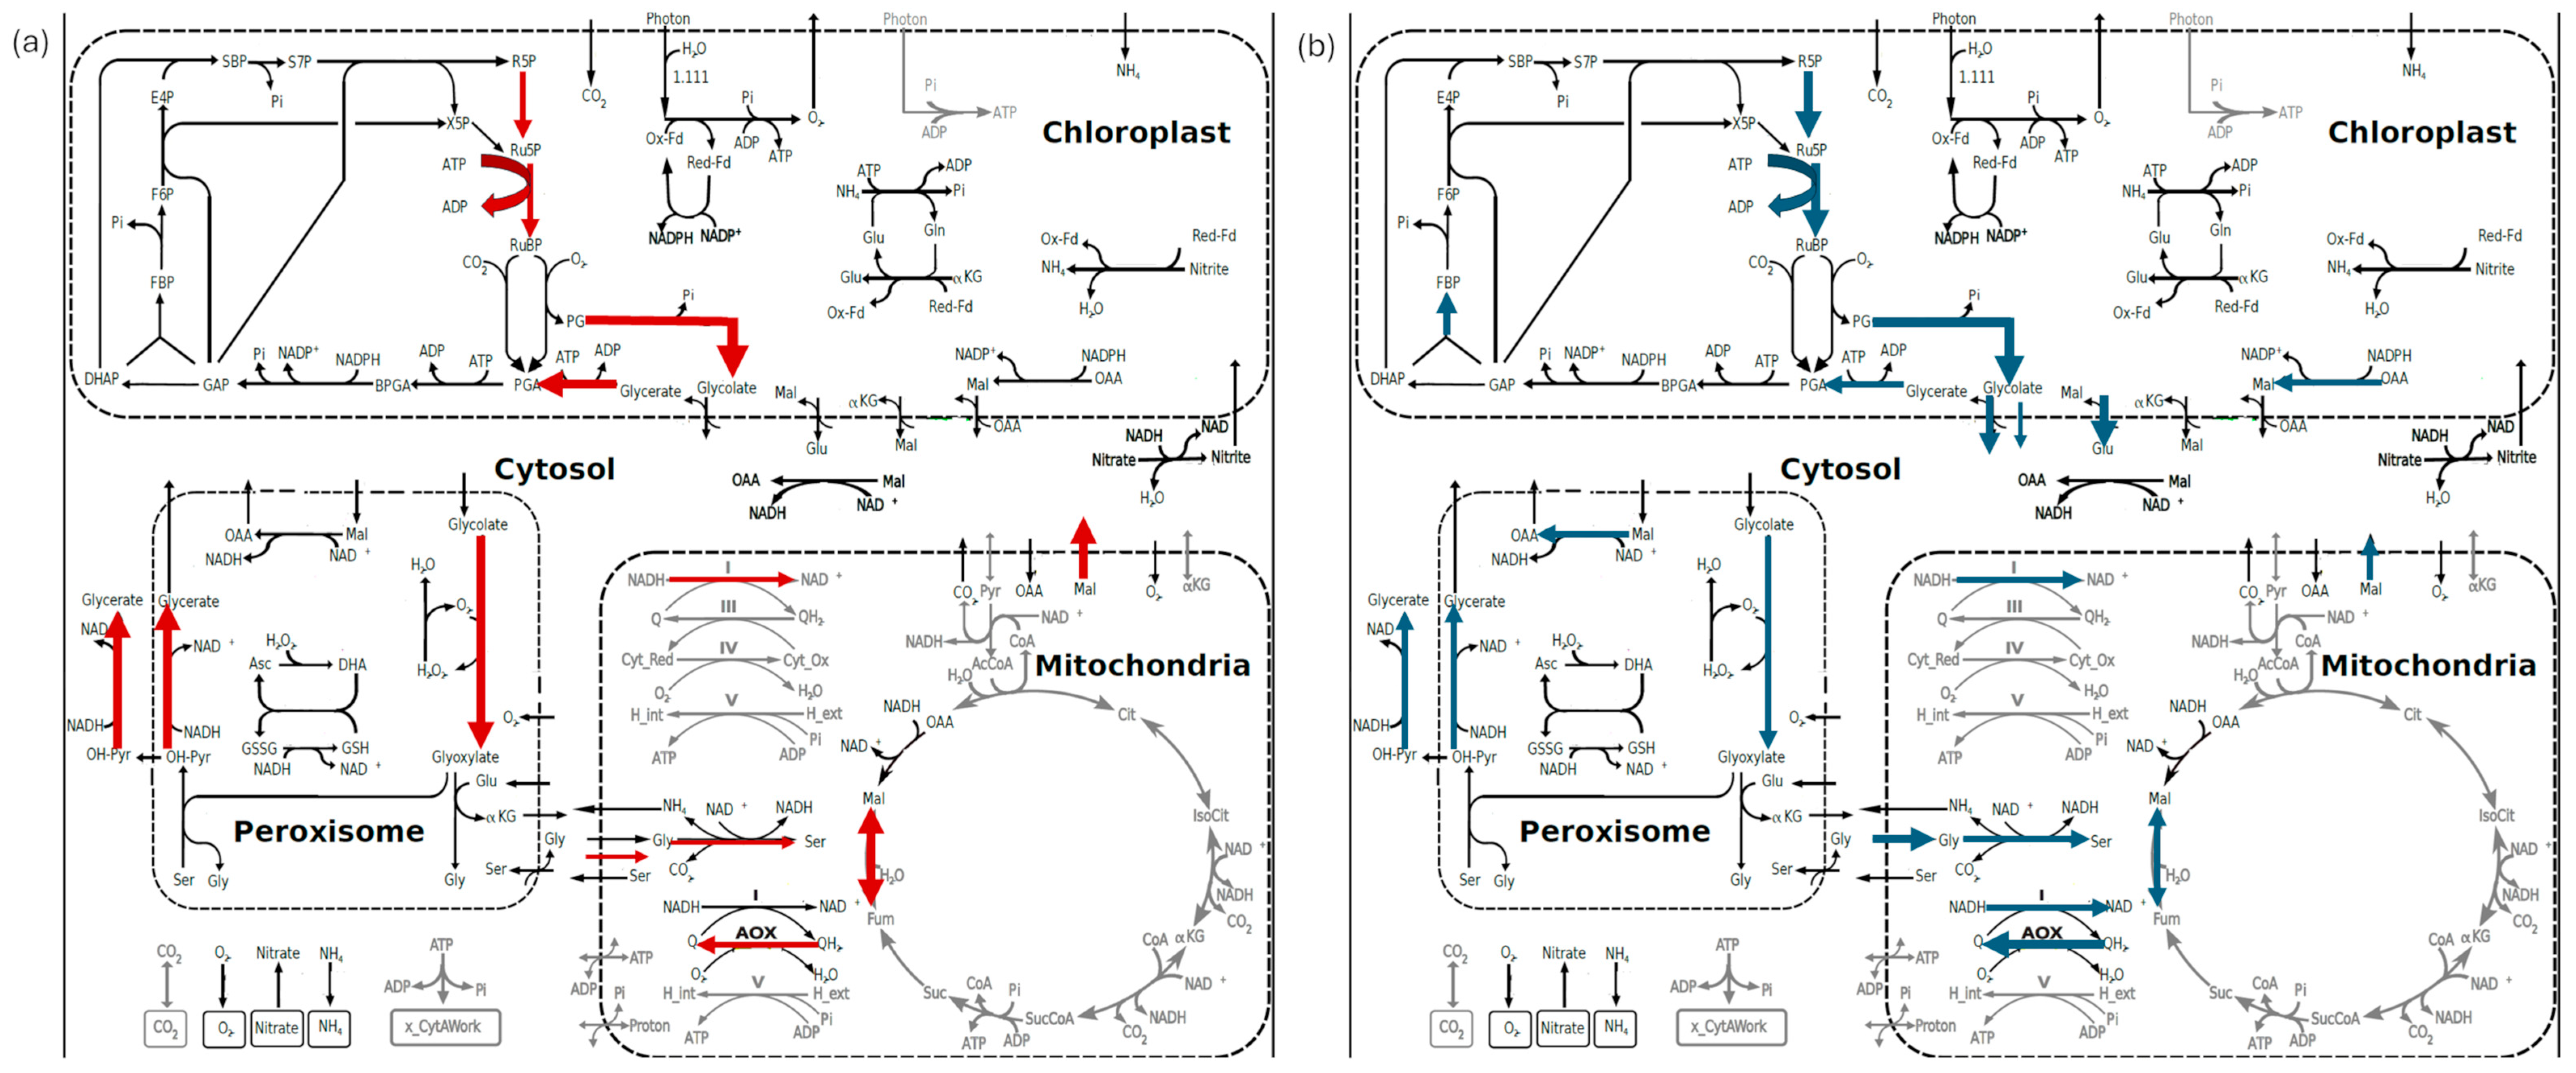
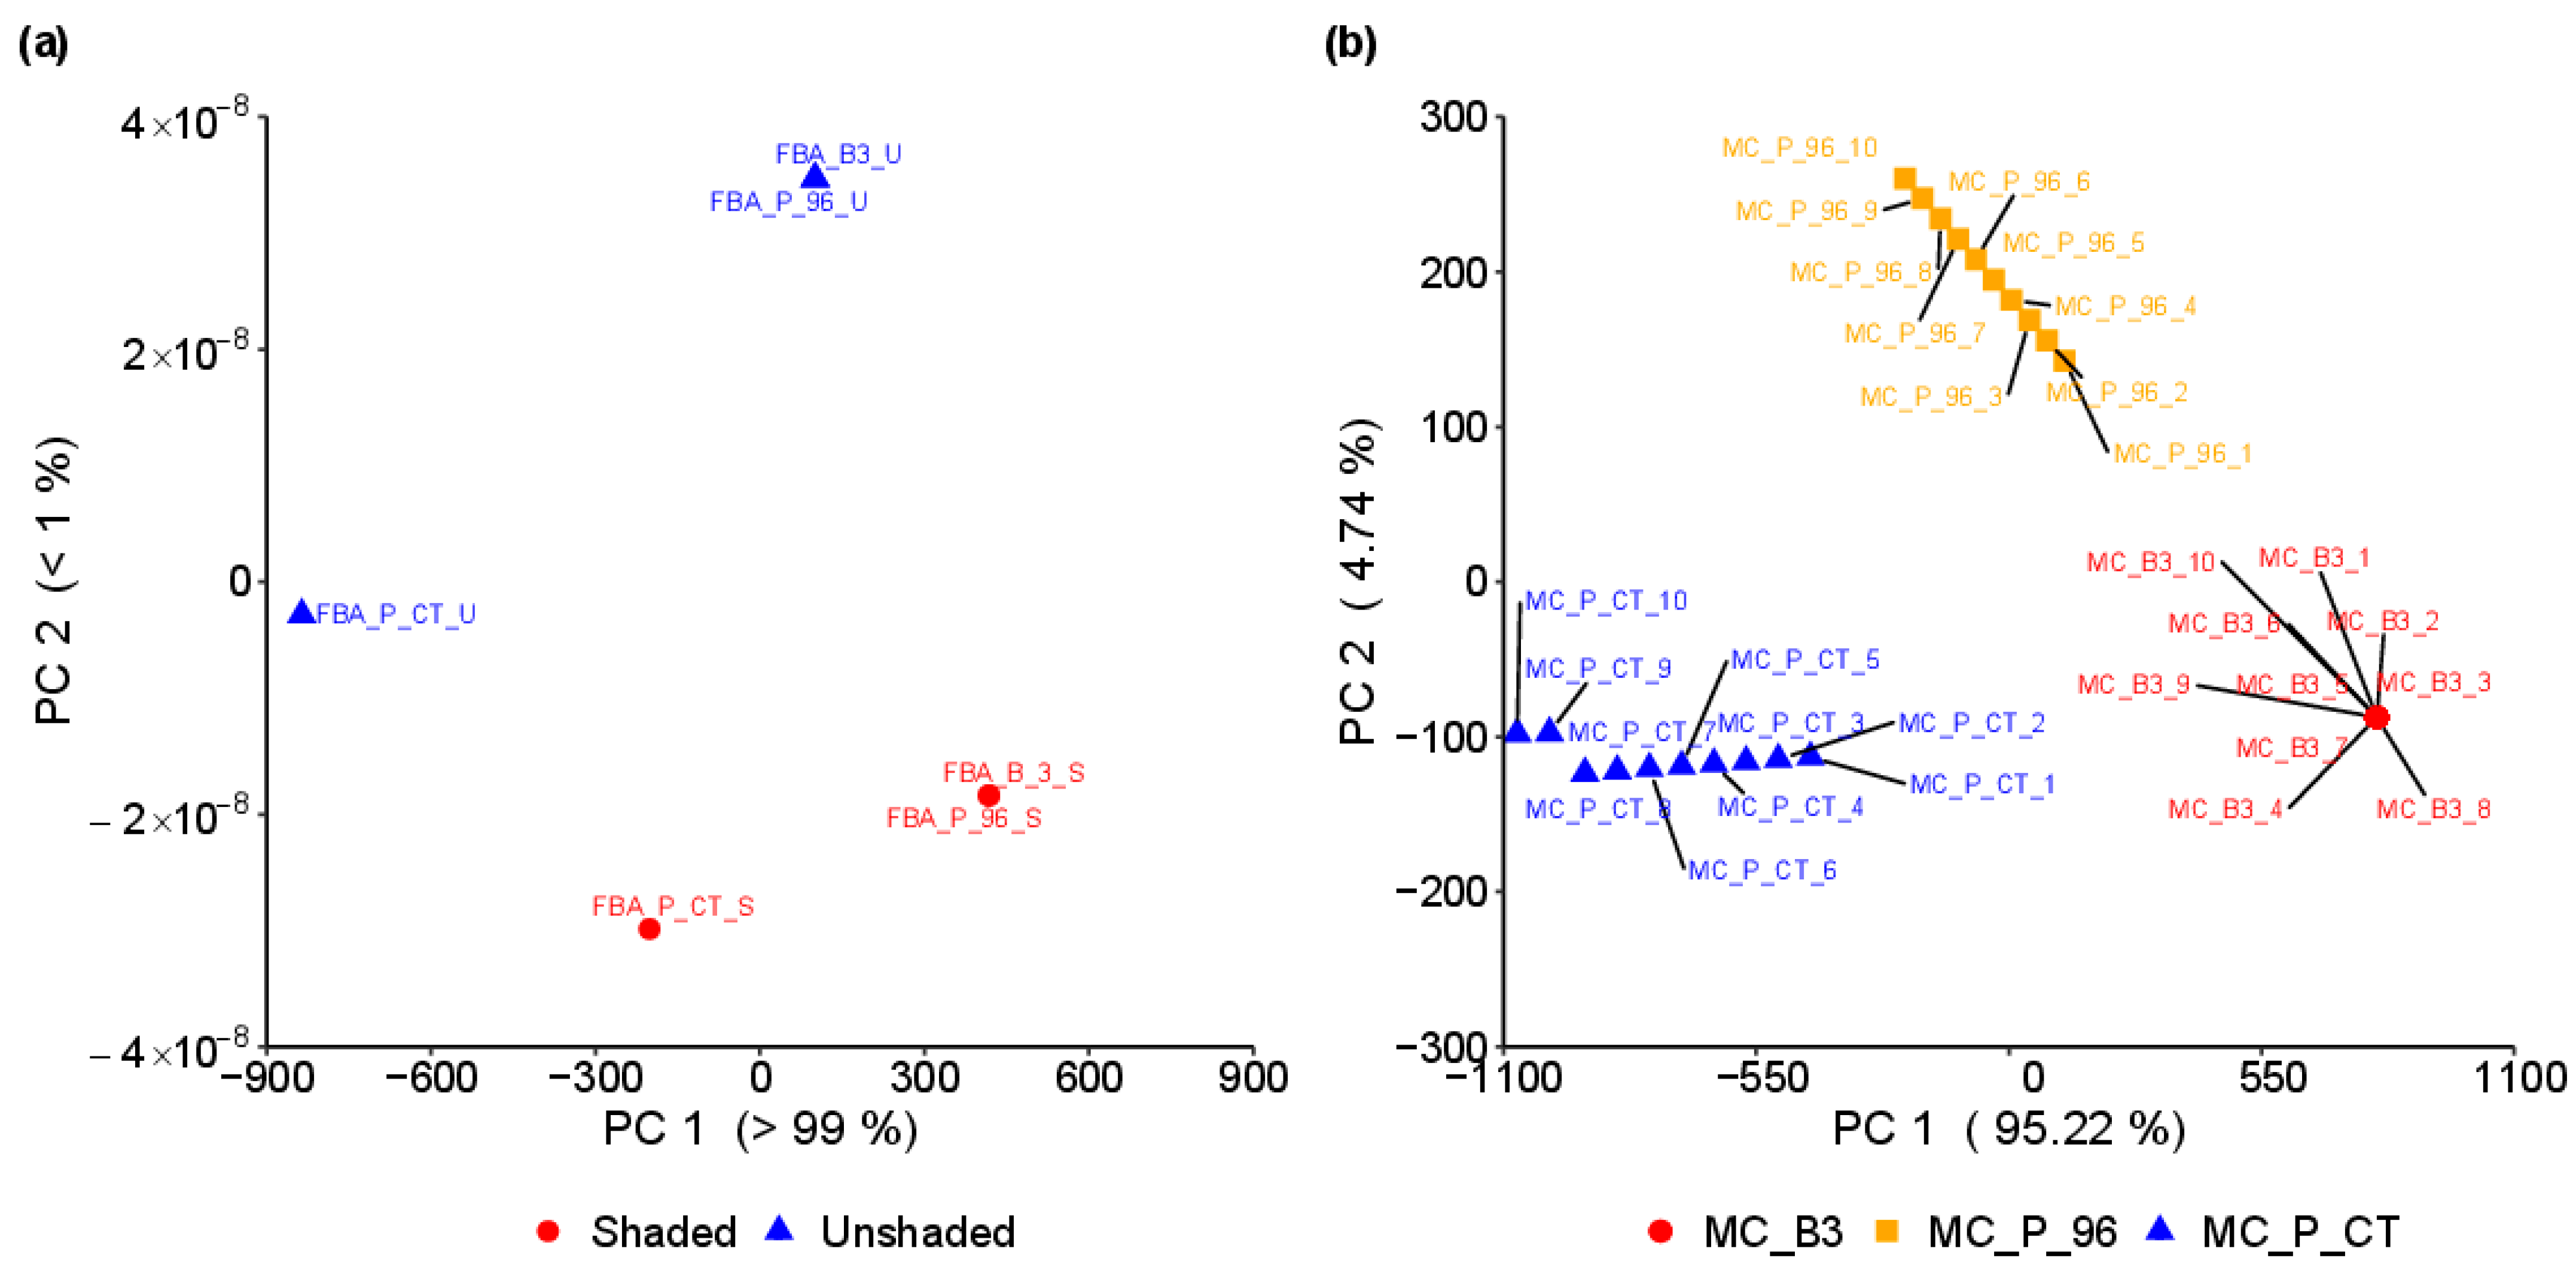
3.3. In Silico Simulations

This study combined hyperspectral data with systems biology, allowing simulations of plant responses under different light conditions and focusing on the role of ROS in mediating plant stress responses, mainly through its correlation with photorespiration mechanisms. The simulations, informed by experimental data and the existing literature [52,54], highlight the central role of enzymes such as peroxisomal catalase and peroxisomal glycolate oxidase in ROS metabolism. Peroxisomal catalase transforms hydrogen peroxide into oxygen and water, effectively counteracting the potentially detrimental impacts of ROS [60]. Similarly, peroxisomal glycolate oxidase converts O 2 . and glycolate into glyoxylate and H2O2. Although H2O2 is a reactive oxygen species that can contribute to oxidative stress, it also plays a role in the plant’s antioxidant defense system by acting as a signaling molecule and being managed by detoxifying enzymes [57].
Plants naturally produce ROS, which may increase when exposed to environmental stresses like light intensity and temperature, which are different from the levels to which they are adapted. Plants adopt a range of defense mechanisms known as antioxidants to protect themselves from ROS damage. These include small molecules such as ascorbic acid, glutathione, non-protein amino acids, phenolic compounds, α-tocopherol, and certain alkaloids, as well as antioxidant enzymes like superoxide dismutase, catalase, peroxidases, ascorbate peroxidase, monodehydroascorbate reductase, and dehydroascorbate reductase [61]. In environments with prolonged sunlight exposure, ROS-detoxifying enzymes like catalase, glycolate oxidase, and glutathione reductase may be upregulated to eliminate ROS, thereby safeguarding cellular components from oxidative stress-induced damage. This regulatory response helps maintain cellular stability and function, ensuring plant health and resilience [54].
This paper chose the PH III hypothesis (see Section 2.5) to demonstrate the metabolism simulation due to its advanced phase of photorespiration, which occurs in peroxisomes—the primary site of ROS detoxification [62]. This choice aligns with the laboratory data used in this study, particularly the quantification of O 2 . . PH III encompasses a widespread set of reactions involved in photorespiration, including those related to energy metabolism and biosynthesis. PH III accounts for key processes regulating carbon and energy flow within the cell by incorporating both peroxisomal catalase and glycolate oxidase reactions.
Figure 5 presents the simulated metabolic map of reactions for PR III under two contrasting conditions: (a) shaded and (b) unshaded. The map illustrates the hypothetical dynamic regulation of photorespiratory metabolism in response to changes in environmental light conditions as theorized in this paper. The reactions highlighted in blue and red show the intensity of the production or consumption of the reactions’ products; these reactions include maleate, citrate, and ascorbate, along with their interrelationships derived from the literature sources (referenced in Table 1).
In the simulations, these reactions have greater fluxes in unshaded conditions compared to shaded conditions. Additionally, PH III facilitates the analysis of metabolic changes in response to environmental factors such as shading, as evidenced by observed alterations in metabolite accumulation levels.
Maleate and citrate induce plant pigmentation in shading conditions [11]. Maleate, primarily associated with photorespiration II, is produced from other reactions and transported to the mitochondria [63]. Citrate is converted into oxaloacetate in the cytoplasm and then transferred to the chloroplast, where photorespiration resumes [64]. Ascorbate protects against oxidative damage during photorespiration by acting as an antioxidant, neutralizing ROS and safeguarding plant cells [65], and is more induced under sun exposure conditions.
Under unshaded conditions, the fluxes indicate increased activity in metabolic pathways associated with the glycolate metabolism and with ATP production, as evidenced by the elevated levels of chloroplast glycolate and chloroplast ATP due to increased sun exposure and by heightened activity in the energy acquisition pathways. The unshaded condition also showed a greater amount of ROS, which alters some mechanisms for ATP synthesis. Conversely, shaded conditions demonstrate a shift in metabolic activity, with a reduction in glycolate metabolism and ATP production, accompanied by changes in the levels of intermediates such as chloroplast glycerate and chloroplast ribulose-1,5-bisphosphate (Figure 5).
This paper (Table 1 and Figure 5) demonstrates the hypothetical metabolic fluxes in prioritizing energy conservation and carbon storage in shaded conditions, leading to decreased maleate levels, intermediates in energy metabolism, and biosynthesis [11]. Conversely, unshaded environments with ample sunlight suggest metabolic pathways toward increased energy production and carbon fixation, resulting in higher levels of maleate [11,47]. Additionally, although not shown in the simulations, antioxidants like ascorbate vary with light availability, including presenting lower levels in shaded conditions due to reduced ROS production [8,57]. While Reshef, Walbaum, Agam and Fait [11] showcased the impact of light interference through an in situ case study, providing a realistic representation of natural conditions, the results of Nilo-Poyanco, Olivares, Orellana, Hinrichsen and Pinto [8], from a study conducted under controlled indoor conditions, may introduce variations in the physiological response. This comparison highlights the importance of considering the experimental context when interpreting the impact of light on plant metabolism, as controlled conditions might not fully capture the complexity of natural environments.
Figure 6 shows the phenotype spaces resulting from the three photorespiration simulation approaches described in Section 2.5. In panel (a), it shows the phenotype spaces for FBA models under unshaded and shaded conditions. The x-axis in panel (a) indicates that Principal Component 1 (PC 1) explains more than 99% of the variance, while the y-axis shows that PC 2 explains less than 1% of the variance, highlighting the dominant influence of PC 1. For unshaded conditions, FBA models include FBA_P_CT_U (Peroxisomal Catalase Reaction as objective), FBA_P_96_U (Peroxisomal Glycolate Oxidase Reaction), and FBA_B3_U (Peroxisomal Catalase Reaction as objective and Peroxisomal Glycolate Oxidase Reaction as objective). Similarly, shaded conditions are represented by FBA_P_CT_S, FBA_P_96_S, and FBA_B3_S, respectively. Panel (b) demonstrates the phenotype spaces resulting from MC simulations, illustrating the range of variations in chlorophyll and ROS levels assessed in laboratory experiments. MC simulations encompass MC_B3 (Peroxisomal Catalase Reaction as objective and Peroxisomal Glycolate Oxidase Reaction as objective), MC_P_96 (Peroxisomal Glycolate Oxidase Reaction as objective), and MC_P_CT (Peroxisomal Catalase Reaction as objective). In the case of MC_P_96 and MC_P_CT, “1” represents higher ROS (unshaded condition) and “10” represents lower ROS (shaded condition). Unfortunately, the MC_B3 simulation did not yield valid results. This non-response for the third hypothesis may be related to the choice of two reactions related to ROS, as the same variation was used for these reactions, suggesting a static stage for the MC reactions.
In shaded conditions, plants, including those adapted to high radiation like the grapevine, can adapt to reduced light availability, leading to changes in metabolic fluxes and enzyme activities. Conversely, in unshaded conditions with ample sunlight exposure, metabolic pathways are geared towards increased energy production and carbon fixation. This differential regulation of metabolic pathways underscores the adaptive strategies employed by grapevines to optimize their performance under varying light conditions. The FBA_B3 simulation may better simulate ROS levels than the FBA_P_CT and FBA_P_96 simulations. This inference is drawn from the fact that the FBA_B3 simulation shows the highest loadings for ROS-related reactions among the three simulations. Specifically, the FBA_B3 simulation has the highest loadings for reactions involving peroxisomal catalase and glycolate oxidase, which are both enzymes in ROS metabolism [56].
The top 10 reactions identified through PCA loadings in both shaded and unshaded conditions encompass key enzymes involved in various metabolic pathways crucial for plant physiology, as well as the vector of the stoichiometric matrix for each reaction (Table 3). Chloroplast ferredoxin reductase (Chl_FerredoxinReductase), chloroplast glyceraldehyde-3-phosphate dehydrogenase (Chl_G3Pdh), and chloroplast phosphoglycerate kinase (Chl_PGK) represent steps in the Calvin cycle essential for carbon fixation and energy production [66]. Chloroplast ribulose-5-phosphate kinase (Chl_Ru5Pk) and chloroplast phosphoglycolate phosphatase (Chl_PGlyPase) are associated with the pentose phosphate pathway, facilitating the regeneration of ribulose-1,5-bisphosphate and the production of NADPH, crucial for redox balance and biosynthetic processes [62]. Additionally, chloroplast ribulose-1,5-bisphosphate oxygenase (Chl_RuBPOxid) participates in photorespiration.

3.4. Innovation for Precision Viticulture

The integration of systems biology techniques, exemplified in this study, provides an innovative framework to simulate pathways and metabolic processes within plants to discover practical applications across industries, including wine production, that can be incorporated in PV. Leveraging systems biology methodologies enables the simulation of the effects of environmental variables, such as shaded conditions, on plant metabolism, thereby facilitating investigations into their implications for final products like wine. The synthesis and accumulation of ascorbic acid, an antioxidant compound found in grapes and wine, can offer a pathway for investigating the relationship among shade treatment, ROS dynamics, and ascorbic acid levels during grape fermentation. Ascorbic acid’s role in alleviating oxidative stress and preserving wine quality underscores its importance in winemaking [65]. Unravelling the impact of shaded conditions on ROS dynamics, ascorbic acid metabolism, and oxidant potency during fermentation unveils novel avenues for wine research, offering prospects to refine winemaking techniques and elevate the caliber of the end product.
This study’s results revealed significant differences in biochemical parameters, including water status, hyperspectral signatures, pigment levels, and ROS levels, by supporting previous research on grapevine physiology e.g., [8,12] and underscoring the importance of photorespiration in mitigating oxidative stress, yet further exploration is necessary to clarify whether this mechanism solely protects plants from ROS or whether it serves additional physiological roles. An understanding of both the specific adaptive strategies employed by C3 plants to stabilize ROS damage and why photorespiration predominates over alternative mechanisms would expand the comprehension of plant stress resilience. Moreover, assessing the limitations and applicability of the metabolic engineering model used in this study is crucial for interpreting field data and capturing grapevine responses to light stress. Given the varied responses of grapevine cultivars to oxidative stress, investigating the genetic and physiological factors contributing to this diversity, and its implications for viticultural practices, is essential. Additionally, investigating the factors that activate shifts between iso- and anisohydric responses in grapevines, along with each strategy’s associated risks and limitations, would advance the understanding of vine physiology and inform adaptive management practices. Isohydric plants maintain a constant leaf water potential by tightly regulating stomatal conductance, prioritizing water conservation over photosynthesis. In contrast, anisohydric plants exhibit more variable leaf water potential, with stomatal conductance responding directly to changes in soil moisture, thus prioritizing photosynthesis over water conservation [49,67]. Addressing these questions through future research endeavors will refine the perception of grapevine stress responses and enhance the sustainability and resilience of viticultural systems.
Furthermore, integrating hyperspectral sensors within the systems biology framework, particularly in PV, holds promise for enhancing vineyard practices with robust physiological foundations. This approach enables the analysis of hypotheses grounded in plant physiology, thereby improving cultural practices and product quality. Moreover, the combination of spectral analysis and systems biology opens avenues for metabolic mapping, providing insight into the plant’s phenometabolome and physiological processes. Additionally, hyperspectral leaf reflectance covering the 350 to 2500 nm range can be employed for early disease detection, including identifying powdery mildew and other vineyard diseases [68]. This capability, integrated into a systems biology approach, can further enhance PV by enabling early intervention and understanding of plant metabolic responses to diseases. By leveraging this integrated approach, viticulturists can transcend the limitations of current data-driven PV approaches, often constrained by data circumstances, and instead adopt information-rich strategies. This cooperative combination of technologies and methodologies enables the generation of high-throughput data, which empowers viticulturists to make data-driven decisions, fostering the development of more sustainable and resilient agricultural systems.

4. Conclusions

This study investigated grapevines’ physiological and metabolic responses to varying light conditions through a systems biology approach, focusing specifically on the impact of shading compared to unshaded sunlight exposure. By combining hyperspectral data with biochemical parameters such as pigment levels and ROS levels and utilizing an in silico photorespiration model, the study uncovered adaptive strategies employed by grapevines in response to changes in light availability.
The observed differences in physiological parameters between shaded and unshaded grapevines underscore the strong correlation between light availability, plant water status, and metabolic activity. Grapevines exposed to unshaded conditions demonstrated increased water uptake and transpiration rates, thereby activating defense mechanisms to protect from excess light and heat. This was indicative of heightened metabolic activity and enhanced photosynthetic capacity.
Integrating hyperspectral data with systems biology techniques successfully simulated how plants respond to different light conditions, emphasizing the role of ROS in managing stress responses. The enzymatic reactions associated with ROS metabolism emphasized mitigating oxidative stress under environmental conditions. The concept of “phenometabolome” introduced in this study captures the complex interaction between grapevine metabolism and environmental factors, providing a thorough framework to understand how varying light conditions shape grapevine physiology and adaptive responses.
The study’s findings reveal the balance grapevines maintain between light capture and stress avoidance, providing insights into their adaptive mechanisms. Future research should investigate the molecular mechanisms governing grapevine responses to shading and other environmental stressors. Leveraging advanced technologies such as hyperspectral sensors and robotics, in conjunction with physiological modelling, holds great promise for refining PV practices and advancing the understanding of plant-environment interactions on a molecular level. However, this emerging field encompasses jargon from diverse areas, such as photonics and smart technologies, resulting in a somewhat insular interaction without a common language to bridge these distinct areas within this field of study.
The integration of systems biology methodologies not only provides a robust framework for simulating plant metabolic processes but also offers practical applications across industries, including that of wine production. Further investigations are warranted into the molecular mechanisms underlying grapevine responses to shading and other stressors. Such research can enhance PV practices, optimize crop productivity, and improve grape quality and yield.

Author Contributions

Conceptualization: R.T., I.P., C.S., R.M. and M.C.; methodology: R.T., R.M. and M.C.; validation: R.T., I.P., R.J.M., J.T., C.S., R.M. and M.C.; formal analysis: R.T. and I.P.; investigation: R.T., I.P., L.R., J.T., R.J.M., F.S., C.S., R.M. and M.C.; resources: C.B., F.S., C.S., R.M. and M.C.; data curation: R.T. and I.P.; writing—original draft preparation: R.T., I.P., R.M. and M.C.; writing—review and editing: R.T., I.P., L.R., I.G., C.B., J.T., R.J.M., F.S., C.S., R.M. and M.C.; supervision: R.M. and M.C.; project administration: M.C.; funding acquisition: C.B., F.S., C.S., R.M. and M.C. All authors have read and agreed to the published version of the manuscript.

Funding

Renan Tosin, Igor Portis and Leandro Rodrigues acknowledge “Fundação para a Ciência e Tecnologia (FCT)” PhD research grants Ref. SFRH/BD/145182/2019, 10.54499/2023.01760.BD and SFRH/BD 2023.01424, respectively. Rui Martins acknowledges Fundação para a Ciência e Tecnologia (FCT) research contract grant (CEEIND/017801/2018). Rafael J. Mendes and Conceição Santos acknowledge the support and help received from FCT/MCTES (LA/P/0008/2020 DOI 10.54499/LA/P/0008/2020, UIDP/50006/2020 DOI 10.54499/UIDP/50006/2020 and UIDB/50006/2020 DOI 10.54499/UIDB/50006/2020) via national funds. This work is financed by National Funds through the FCT—Fundação para a Ciência e a Tecnologia, I.P. (Portuguese Foundation for Science and Technology) within the project OmicBots—OmicBots: High-Throughput Integrative Omic-Robots Platform for a Next Generation Physiology-based Precision Viticulture, with reference PTDC/ASP-HOR/1338/2021.

Data Availability Statement

The raw data supporting the conclusions of this article will be made available by the authors on request.

Acknowledgments

The authors thank the wine company Poças Junior experimental facilities (and its Coordinator for Viticulture Maria Manuel Maia) for the facilities provided for fieldwork, as well as the Associação para o Desenvolvimento da Viticultura Duriense (ADVID) for the predawn leaf water potential.

Conflicts of Interest

The authors declare no conflicts of interest.

References

  1. Pallas, B.; Christophe, A. Relationships between biomass allocation, axis organogenesis and organ expansion under shading and water deficit conditions in grapevine. Funct. Plant Biol. 2015, 42, 1116–1128. [Google Scholar] [CrossRef]
  2. Rogiers, S.Y.; Greer, D.H.; Liu, Y.; Baby, T.; Xiao, Z. Impact of climate change on grape berry ripening: An assessment of adaptation strategies for the Australian vineyard. Front. Plant Sci. 2022, 13, 1094633. [Google Scholar] [CrossRef]
  3. Cunha, M.; Martins, R.; Neves dos Santos, F. Sustainable agriculture in the Era of field-omics. Let’s improve AgronOmics. INESC TEC Sci. Soc. 2022, 1. Available online: https://science-society.inesctec.pt/index.php/inesctecesociedade/article/view/93 (accessed on 15 August 2024).
  4. Adams, D.O. Phenolics and Ripening in Grape Berries. Am. J. Enol. Vitic. 2006, 57, 249–256. [Google Scholar] [CrossRef]
  5. Teixeira, A.; Eiras-Dias, J.; Castellarin, S.D.; Geros, H. Berry phenolics of grapevine under challenging environments. Int. J. Mol. Sci. 2013, 14, 18711–18739. [Google Scholar] [CrossRef]
  6. Spayd, S.E.; Tarara, J.M.; Mee, D.L.; Ferguson, J.C. Separation of Sunlight and Temperature Effects on the Composition of Vitis vinifera cv. Merlot Berries. Am. J. Enol. Vitic. 2002, 53, 171–182. [Google Scholar] [CrossRef]
  7. Sternad Lemut, M.; Trost, K.; Sivilotti, P.; Vrhovsek, U. Pinot Noir grape colour related phenolics as affected by leaf removal treatments in the Vipava Valley. J. Food Compos. Anal. 2011, 24, 777–784. [Google Scholar] [CrossRef]
  8. Nilo-Poyanco, R.; Olivares, D.; Orellana, A.; Hinrichsen, P.; Pinto, M. Proteomic analysis of grapevine (Vitis vinifera L.) leaf changes induced by transition to autotrophy and exposure to high light irradiance. J. Proteom. 2013, 91, 309–330. [Google Scholar] [CrossRef]
  9. Sun, R.Z.; Cheng, G.; Li, Q.; He, Y.N.; Wang, Y.; Lan, Y.B.; Li, S.Y.; Zhu, Y.R.; Song, W.F.; Zhang, X.; et al. Light-induced Variation in Phenolic Compounds in Cabernet Sauvignon Grapes (Vitis vinifera L.) Involves Extensive Transcriptome Reprogramming of Biosynthetic Enzymes, Transcription Factors, and Phytohormonal Regulators. Front. Plant Sci. 2017, 8, 547. [Google Scholar] [CrossRef]
  10. Ayenew, B.; Degu, A.; Manela, N.; Perl, A.; Shamir, M.O.; Fait, A. Metabolite profiling and transcript analysis reveal specificities in the response of a berry derived cell culture to abiotic stresses. Front. Plant Sci. 2015, 6, 728. [Google Scholar] [CrossRef]
  11. Reshef, N.; Walbaum, N.; Agam, N.; Fait, A. Sunlight Modulates Fruit Metabolic Profile and Shapes the Spatial Pattern of Compound Accumulation within the Grape Cluster. Front. Plant Sci. 2017, 8, 70. [Google Scholar] [CrossRef] [PubMed]
  12. du Plessis, K.; Young, P.R.; Eyeghe-Bickong, H.A.; Vivier, M.A. The Transcriptional Responses and Metabolic Consequences of Acclimation to Elevated Light Exposure in Grapevine Berries. Front. Plant Sci. 2017, 8, 1261. [Google Scholar] [CrossRef]
  13. Pazhamala, L.T.; Kudapa, H.; Weckwerth, W.; Millar, A.H.; Varshney, R.K. Systems biology for crop improvement. Plant Genome 2021, 14, e20098. [Google Scholar] [CrossRef]
  14. Trewavas, A. A brief history of systems biology. Every object that biology studies is a system of systems. Francois Jacob (1974). Plant Cell 2006, 18, 2420–2430. [Google Scholar] [CrossRef]
  15. van Diepen, C.A.; Wolf, J.; van Keulen, H.; Rappoldt, C. WOFOST: A simulation model of crop production. Soil. Use Manag. 1989, 5, 16–24. [Google Scholar] [CrossRef]
  16. Kumar, A.; Pathak, R.K.; Gupta, S.M.; Gaur, V.S.; Pandey, D. Systems Biology for Smart Crops and Agricultural Innovation: Filling the Gaps between Genotype and Phenotype for Complex Traits Linked with Robust Agricultural Productivity and Sustainability. OMICS 2015, 19, 581–601. [Google Scholar] [CrossRef]
  17. Brisson, N.; Mary, B.; Ripoche, D.; Jeuffroy, M.H.; Ruget, F.; Nicoullaud, B.; Gate, P.; Devienne-Barret, F.; Antonioletti, R.; Durr, C.; et al. STICS: A generic model for the simulation of crops and their water and nitrogen balances. I. Theory and parameterization applied to wheat and corn. Agronomie 1998, 18, 311–346. [Google Scholar] [CrossRef]
  18. Lo Presti, D.; Di Tocco, J.; Massaroni, C.; Cimini, S.; De Gara, L.; Singh, S.; Raucci, A.; Manganiello, G.; Woo, S.L.; Schena, E.; et al. Current understanding, challenges and perspective on portable systems applied to plant monitoring and precision agriculture. Biosens. Bioelectron. 2023, 222, 115005. [Google Scholar] [CrossRef]
  19. Li, C.; Donizelli, M.; Rodriguez, N.; Dharuri, H.; Endler, L.; Chelliah, V.; Li, L.; He, E.; Henry, A.; Stefan, M.I.; et al. BioModels Database: An enhanced, curated and annotated resource for published quantitative kinetic models. BMC Syst. Biol. 2010, 4, 92. [Google Scholar] [CrossRef] [PubMed]
  20. Orth, J.D.; Thiele, I.; Palsson, B.O. What is flux balance analysis? Nat. Biotechnol. 2010, 28, 245–248. [Google Scholar] [CrossRef]
  21. Yuan, H.; Cheung, C.Y.; Poolman, M.G.; Hilbers, P.A.; van Riel, N.A. A genome-scale metabolic network reconstruction of tomato (Solanum lycopersicum L.) and its application to photorespiratory metabolism. Plant J. 2016, 85, 289–304. [Google Scholar] [CrossRef] [PubMed]
  22. Dal’Molin, C.G.; Quek, L.E.; Palfreyman, R.W.; Brumbley, S.M.; Nielsen, L.K. C4GEM, a genome-scale metabolic model to study C4 plant metabolism. Plant Physiol. 2010, 154, 1871–1885. [Google Scholar] [CrossRef]
  23. de Oliveira Dal’Molin, C.G.; Quek, L.E.; Palfreyman, R.W.; Brumbley, S.M.; Nielsen, L.K. AraGEM, a genome-scale reconstruction of the primary metabolic network in Arabidopsis. Plant Physiol. 2010, 152, 579–589. [Google Scholar] [CrossRef] [PubMed]
  24. Gerlin, L.; Cottret, L.; Escourrou, A.; Genin, S.; Baroukh, C. A multi-organ metabolic model of tomato predicts plant responses to nutritional and genetic perturbations. Plant Physiol. 2022, 188, 1709–1723. [Google Scholar] [CrossRef]
  25. Rai, A.; Yamazaki, M.; Saito, K. A new era in plant functional genomics. Curr. Opin. Syst. Biol. 2019, 15, 58–67. [Google Scholar] [CrossRef]
  26. Tosin, R.; Monteiro-Silva, F.; Martins, R.; Cunha, M. A New Approach for Element Characterization of Grapevine Tissue with Laser-Induced Breakdown Spectroscopy. Horticulturae 2024, 10, 82. [Google Scholar] [CrossRef]
  27. D’Agostino, N.; Tripodi, P. NGS-Based Genotyping, High-Throughput Phenotyping and Genome-Wide Association Studies Laid the Foundations for Next-Generation Breeding in Horticultural Crops. Diversity 2017, 9, 38. [Google Scholar] [CrossRef]
  28. Tosin, R.; Pôças, I.; Novo, H.; Teixeira, J.; Fontes, N.; Graça, A.; Cunha, M. Assessing predawn leaf water potential based on hyperspectral data and pigment’s concentration of Vitis vinifera L. in the Douro Wine Region. Sci. Hortic. 2021, 278, 109860. [Google Scholar] [CrossRef]
  29. Van Wittenberghe, S.; Amin, E.; Pascual-Venteo, A.B.; Pérez-Suay, A.; Tenjo, C.; Sabater, N.; van der Tol, C.; Drusch, M.; Moreno, J. Retrieval of leaf-level fluorescence quantum efficiency and NPQ-related xanthophyll absorption through spectral unmixing strategies for future VIS-NIR imaging spectroscopy. Remote Sens. Environ. 2024, 300, 113879. [Google Scholar] [CrossRef]
  30. Liu, X.; Liu, C.; Shi, Z.; Chang, Q. Comparison of prediction power of three multivariate calibrations for estimation of leaf anthocyanin content with visible spectroscopy in Prunus cerasifera. PeerJ 2019, 7, e7997. [Google Scholar] [CrossRef]
  31. Falcioni, R.; Goncalves, J.V.F.; de Oliveira, K.M.; de Oliveira, C.A.; Reis, A.S.; Crusiol, L.G.T.; Furlanetto, R.H.; Antunes, W.C.; Cezar, E.; de Oliveira, R.B.; et al. Chemometric Analysis for the Prediction of Biochemical Compounds in Leaves Using UV-VIS-NIR-SWIR Hyperspectroscopy. Plants 2023, 12, 3424. [Google Scholar] [CrossRef] [PubMed]
  32. Herman, J.; Zhang, Y.; Castranova, V.; Neal, S.L. Emerging technologies for optical spectral detection of reactive oxygen species. Anal. Bioanal. Chem. 2018, 410, 6079–6095. [Google Scholar] [CrossRef] [PubMed]
  33. Tomar, N.; De, R.K. Comparing methods for metabolic network analysis and an application to metabolic engineering. Gene 2013, 521, 1–14. [Google Scholar] [CrossRef] [PubMed]
  34. Heirendt, L.; Arreckx, S.; Pfau, T.; Mendoza, S.N.; Richelle, A.; Heinken, A.; Haraldsdóttir, H.S.; Wachowiak, J.; Keating, S.M.; Vlasov, V.; et al. Creation and analysis of biochemical constraint-based models using the COBRA Toolbox v.3.0. Nat. Protoc. 2019, 14, 639–702. [Google Scholar] [CrossRef] [PubMed]
  35. Cunha, M.; Ribeiro, H.; Abreu, I. Pollen-based predictive modelling of wine production: Application to an arid region. Eur. J. Agron. 2016, 73, 42–54. [Google Scholar] [CrossRef]
  36. Cunha, M.; Richter, C. The impact of climate change on the winegrape vineyards of the Portuguese Douro region. Clim. Change 2016, 138, 239–251. [Google Scholar] [CrossRef]
  37. Martins, R.C.; Magalhães, S.; Jorge, P.; Barroso, T.; Santos, F. Metbots: Metabolomics Robots for Precision Viticulture. In Proceedings of the Progress in Artificial Intelligence, Vila Real, Portugal, 3–6 September 2019; pp. 156–166. [Google Scholar]
  38. Scholander, P.F.; Bradstreet, E.D.; Hemmingsen, E.A.; Hammel, H.T. Sap Pressure in Vascular Plants: Negative hydrostatic pressure can be measured in plants. Science 1965, 148, 339–346. [Google Scholar] [CrossRef] [PubMed]
  39. Sims, D.A.; Gamon, J.A. Relationships between leaf pigment content and spectral reflectance across a wide range of species, leaf structures and developmental stages. Remote Sens. Environ. 2002, 81, 337–354. [Google Scholar] [CrossRef]
  40. Gajewska, E.; Skłodowska, M. Effect of nickel on ROS content and antioxidative enzyme activitiesin wheat leaves. BioMetals 2007, 20, 27–36. [Google Scholar] [CrossRef]
  41. Costa-Santos, M.; Mariz-Ponte, N.; Dias, M.C.; Moura, L.; Marques, G.; Santos, C. Effect of Bacillus spp. and Brevibacillus sp. on the Photosynthesis and Redox Status of Solanum lycopersicum. Horticulturae 2021, 7, 24. [Google Scholar] [CrossRef]
  42. Martins, R.C.; Barroso, T.G.; Jorge, P.; Cunha, M.; Santos, F. Unscrambling spectral interference and matrix effects in Vitis vinifera Vis-NIR spectroscopy: Towards analytical grade ‘in vivo’ sugars and acids quantification. Comput. Electron. Agric. 2022, 194, 106710. [Google Scholar] [CrossRef]
  43. Martins, R. Big Data Self-Learning Methodology for the Accurate Quantification and Classification of Spectral Information under Complex Variability and Multi-Scale Interference. WO Patent 2018060967, 5 April 2018. Available online: https://patentscope.wipo.int/search/en/detail.jsf?docId=WO2018060967 (accessed on 15 August 2024).
  44. Tosin, R.; Martins, R.; Pôças, I.; Cunha, M. Canopy VIS-NIR spectroscopy and self-learning artificial intelligence for a generalised model of predawn leaf water potential in Vitis vinifera. Biosyst. Eng. 2022, 219, 235–258. [Google Scholar] [CrossRef]
  45. Tosin, R.; Monteiro-Silva, F.; Martins, R.; Cunha, M. Precision maturation assessment of grape tissues: Hyperspectral bi-directional reconstruction using tomography-like based on multi-block hierarchical principal component analysis. Biosyst. Eng. 2023, 236, 147–159. [Google Scholar] [CrossRef]
  46. Huma, B.; Kundu, S.; Poolman, M.G.; Kruger, N.J.; Fell, D.A. Stoichiometric analysis of the energetics and metabolic impact of photorespiration in C3 plants. Plant J. 2018, 96, 1228–1241. [Google Scholar] [CrossRef]
  47. Adams, W.W.; Stewart, J.J.; Demmig-Adams, B. Photosynthetic Modulation in Response to Plant Activity and Environment. In The Leaf: A Platform for Performing Photosynthesis; Adams Iii, W.W., Terashima, I., Eds.; Springer International Publishing: Cham, Switzerland, 2018; pp. 493–563. [Google Scholar] [CrossRef]
  48. Lichtenthaler, H.K.; Babani, F. Light Adaptation and Senescence of the Photosynthetic Apparatus. Changes in Pigment Composition, Chlorophyll Fluorescence Parameters and Photosynthetic Activity. In Chlorophyll a Fluorescence: A Signature of Photosynthesis; Papageorgiou, G.C., Govindjee, Eds.; Springer: Dordrecht, The Netherlands, 2004; pp. 713–736. [Google Scholar] [CrossRef]
  49. Palliotti, A.; Poni, S. Grapevine under light and heat stresses. In Grapevine in a Changing Environment; John Wiley & Sons, Ltd.: Hoboken, NJ, USA, 2015; Chapter 7; pp. 148–178. [Google Scholar] [CrossRef]
  50. Zhang, P.; Dong, T.; Jin, H.; Pei, D.; Pervaiz, T.; Ren, Y.; Jia, H.; Fang, J. Analysis of photosynthetic ability and related physiological traits in nodal leaves of grape. Sci. Hortic. 2022, 304, 111251. [Google Scholar] [CrossRef]
  51. Savoi, S.; Wong, D.C.; Arapitsas, P.; Miculan, M.; Bucchetti, B.; Peterlunger, E.; Fait, A.; Mattivi, F.; Castellarin, S.D. Transcriptome and metabolite profiling reveals that prolonged drought modulates the phenylpropanoid and terpenoid pathway in white grapes (Vitis vinifera L.). BMC Plant Biol. 2016, 16, 67. [Google Scholar] [CrossRef] [PubMed]
  52. Ju, Y.L.; Yue, X.F.; Zhao, X.F.; Zhao, H.; Fang, Y.L. Physiological, micro-morphological and metabolomic analysis of grapevine (Vitis vinifera L.) leaf of plants under water stress. Plant Physiol. Biochem. 2018, 130, 501–510. [Google Scholar] [CrossRef] [PubMed]
  53. Christ, B.; Hörtensteiner, S. Mechanism and Significance of Chlorophyll Breakdown. J. Plant Growth Regul. 2013, 33, 4–20. [Google Scholar] [CrossRef]
  54. Wang, G.; Zeng, F.; Song, P.; Sun, B.; Wang, Q.; Wang, J. Effects of reduced chlorophyll content on photosystem functions and photosynthetic electron transport rate in rice leaves. J. Plant Physiol. 2022, 272, 153669. [Google Scholar] [CrossRef]
  55. Luo, Y.Y.; Li, R.X.; Jiang, Q.S.; Bai, R.; Duan, D. Changes in the chlorophyll content of grape leaves could provide a physiological index for responses and adaptation to UV-C radiation. Nord. J. Bot. 2019, 37. [Google Scholar] [CrossRef]
  56. Carvalho, L.C.; Vidigal, P.; Amâncio, S. Oxidative stress homeostasis in grapevine (Vitis vinifera L.). Front. Environ. Sci. 2015, 3, 20. [Google Scholar] [CrossRef]
  57. Sandalio, L.M.; Rodríguez-Serrano, M.; Romero-Puertas, M.C.; del Río, L.A. Role of Peroxisomes as a Source of Reactive Oxygen Species (ROS) Signaling Molecules. In Peroxisomes and Their Key Role in Cellular Signaling and Metabolism; del Río, L.A., Ed.; Springer: Dordrecht, The Netherlands, 2013; pp. 231–255. [Google Scholar] [CrossRef]
  58. Iqbal, Z.; Iqbal, M.S.; Hashem, A.; Abd Allah, E.F.; Ansari, M.I. Plant Defense Responses to Biotic Stress and Its Interplay With Fluctuating Dark/Light Conditions. Front. Plant Sci. 2021, 12, 631810. [Google Scholar] [CrossRef]
  59. van Wyngaard, E.; Blancquaert, E.; Nieuwoudt, H.; Aleixandre-Tudo, J.L. Infrared Spectroscopy and Chemometric Applications for the Qualitative and Quantitative Investigation of Grapevine Organs. Front. Plant Sci. 2021, 12, 723247. [Google Scholar] [CrossRef]
  60. Carmo de Carvalho e Martins, M.d.; da Silva Santos Oliveira, A.S.; da Silva, L.A.A.; Primo, M.G.S.; de Carvalho Lira, V.B. Biological Indicators of Oxidative Stress [Malondialdehyde, Catalase, Glutathione Peroxidase, and Superoxide Dismutase] and Their Application in Nutrition. In Biomarkers in Nutrition; Springer: Cham, Switzerland, 2022; pp. 833–856. [Google Scholar] [CrossRef]
  61. Berni, R.; Luyckx, M.; Xu, X.; Legay, S.; Sergeant, K.; Hausman, J.-F.; Lutts, S.; Cai, G.; Guerriero, G. Reactive oxygen species and heavy metal stress in plants: Impact on the cell wall and secondary metabolism. Environ. Exp. Bot. 2019, 161, 98–106. [Google Scholar] [CrossRef]
  62. Geigenberger, P.; Fernie, A.R. Metabolic Control of Redox and Redox Control of Metabolism in Plants. Antioxid. Redox Signal. 2014, 21, 1389–1421. [Google Scholar] [CrossRef]
  63. Tomaz, T.; Bagard, M.; Pracharoenwattana, I.; Lindén, P.; Lee, C.P.; Carroll, A.J.; Ströher, E.; Smith, S.M.; Gardeström, P.; Millar, A.H. Mitochondrial Malate Dehydrogenase Lowers Leaf Respiration and Alters Photorespiration and Plant Growth in Arabidopsis. Plant Physiol. 2010, 154, 1143–1157. [Google Scholar] [CrossRef]
  64. Zakhartsev, M.; Medvedeva, I.; Orlov, Y.; Akberdin, I.; Krebs, O.; Schulze, W.X. Metabolic model of central carbon and energy metabolisms of growing Arabidopsis thaliana in relation to sucrose translocation. BMC Plant Biol. 2016, 16, 262. [Google Scholar] [CrossRef]
  65. Burbidge, C.A.; Ford, C.M.; Melino, V.J.; Wong, D.C.J.; Jia, Y.; Jenkins, C.L.D.; Soole, K.L.; Castellarin, S.D.; Darriet, P.; Rienth, M.; et al. Biosynthesis and Cellular Functions of Tartaric Acid in Grapevines. Front. Plant Sci. 2021, 12, 643024. [Google Scholar] [CrossRef] [PubMed]
  66. Trost, P.; Fermani, S.; Marri, L.; Zaffagnini, M.; Falini, G.; Scagliarini, S.; Pupillo, P.; Sparla, F. Thioredoxin-dependent regulation of photosynthetic glyceraldehyde-3-phosphate dehydrogenase: Autonomous vs. CP12-dependent mechanisms. Photosynth. Res. 2006, 89, 263–275. [Google Scholar] [CrossRef] [PubMed]
  67. Chaves, M.M.; Zarrouk, O.; Francisco, R.; Costa, J.M.; Santos, T.; Regalado, A.P.; Rodrigues, M.L.; Lopes, C.M. Grapevine under deficit irrigation: Hints from physiological and molecular data. Ann. Bot. 2010, 105, 661–676. [Google Scholar] [CrossRef] [PubMed]
  68. Vélez, S.; Barajas, E.; Rubio, J.A.; Pereira-Obaya, D.; Rodríguez-Pérez, J.R. Field-Deployed Spectroscopy from 350 to 2500 nm: A Promising Technique for Early Identification of Powdery Mildew Disease (Erysiphe necator) in Vineyards. Agronomy 2024, 14, 634. [Google Scholar] [CrossRef]
Figure 1. Representation of an integrated methodology combining the genomics, metabolomics, and systems biology approaches, aimed at establishing connections between laboratory experiments and field observations. Also, represents the integration of sensors for detecting molecular components and monitoring the physiological state of plants to feed the systems biology.
Horticulturae 10 00873 g001
Figure 2. Mean spectra absorbance from leaves on vines exposed to unshaded conditions and shaded conditions. a.u.: arbitrary units.
Horticulturae 10 00873 g002
Figure 3. Predawn leaf water potential variation in grapevine leaves under unshaded and shaded conditions. * Statistically significant (p < 0.05) according to t-test.
Horticulturae 10 00873 g003
Figure 4. Results of the use of foliar spectral data combined with self-learning artificial intelligence (SL-AI) in modelling: (a) chlorophyll a (mg/gFM), (b) chlorophyll b (mg/gFM), and (c) reactive oxygen species (ROS—ABS/gFM). N = number of samples considered. Coefficient of determination (R2), root mean square error (RMSE), and mean absolute percentage error (MAPE—%).
Horticulturae 10 00873 g004
Figure 5. Photorespiration cycle under (a) shaded and (b) unshaded conditions, showcasing the Photorespiration III hypothesis with the objective reactions in the flux balance analyses of Peroxisomal Catalase and Peroxisomal Glycolate Oxidase. The red and blue arrows represent respectively the flux balance analysis (FBA) of the reactions involved under shaded and unshaded conditions, offering a dynamic regulation of photorespiratory metabolism in response to environmental light conditions. The arrows’ sizes indicates each pathway’s intensity under the respective condition. Figure adapted from Huma, Kundu, Poolman, Kruger and Fell [46].
Horticulturae 10 00873 g005
Figure 6. Panel (a) shows the phenotype spaces for the three Flux Balance Analysis (FBA) models under different photorespiration conditions. For unshaded conditions, FBA models include FBA_P_CT_U (Peroxisomal Catalase Reaction as objective), FBA_P_96_U (Peroxisomal Glycolate Oxidase Reaction), and FBA_B3_U (Peroxisomal Catalase Reaction as objective and Peroxisomal Glycolate Oxidase Reaction as objective). Similarly, shaded conditions are represented by FBA_P_CT_S, FBA_P_96_S and FBA_B3_S, respectively. Panel (b) demonstrates the phenotype spaces resulting from Monte Carlo (MC) simulations, illustrating the range of variations in chlorophyll and reactive oxygen species (ROS) levels assessed in laboratory experiments. MC simulations encompass MC_B3 (Peroxisomal Catalase Reaction as objective and Peroxisomal Glycolate Oxidase Reaction as objective), MC_P_96 (Peroxisomal Glycolate Oxidase Reaction as objective), and MC_P_CT (Peroxisomal Catalase Reaction as objective). In the case of MC_P_96 and MC_P_CT, 1 represents higher ROS (unshaded condition) and 10, lower ROS (shaded condition). MC_B3 did not result in a valid MC simulation.
Horticulturae 10 00873 g006
Table 1. Enzymes and compounds associated with key metabolic pathways in grapevines that are related to light and shading conditions. The table is categorized into two sections: unshaded and shaded. Each section contains columns indicating metabolic pathways, enzyme expression (upregulated or downregulated) or compound level, enzyme or compound function, and relevant references.
Enzymes and CompoundsPathwayExpressionFunctionReference
Unshaded
hydroxycinnamic acids (HCAs)Phenolic acidsUpUV protection, pigmentation, cell defense[4,5]
hydroxybenzoic acids (HBAs)Phenolic acidsUpUV protection, pigmentation, cell defense[4,5]
ResveratrolNon-flavonoid polyphenolsUpUV protection, pigmentation, cell defense[6,7]
QuercetinPolyphenolUpUV protection[6,7]
KaempferolPolyphenolUpUV protection[6,7]
MyricetinPolyphenolUpUV protection[6,7]
Lipocalin (s240)Oxidative stress defenseUpCell defense[8]
quinone oxidoreductase-like protein (s472)Oxidative stress defenseUpCell defense[8]
ascorbate peroxidase2 (APX2)Oxidative stress defenseUpCell defense[8]
peroxiredoxin (PRX)Oxidative stress defenseUpCell defense[8]
glutathione-s-transferase (GST)Oxidative stress defenseUpCell defense[8]
catalase (CAT)Oxidative stress defenseUpCell defense[8]
isoflavone-reductase-like protein (IRL)Oxidative stress defenseUpCell defense[8]
nucleoside diphosphate kinase2 (NDPK2)Oxidative stress defenseUpCell defense[8]
Auxin (AUX)HormonesUPHormone signal[9]
XyloseCell membraneDownCell membrane[10]
XylobioseCell membraneDownCell membrane[10]
PhenylalanineAmino acid pathwayUpUV protection, pigmentation, cell defense[11]
Light-inducible protein (ELIP1)Chlorophyll biosynthesisUpRegulates the chlorophyll biosynthesis[12]
photosystem II PsbO proteinPhotosynthesisDown (final stage)Photosynthesis[12]
LHB1B1 light-harvesting proteinPhotosynthesisDown (final stage)Photosynthesis[12]
polyphenol oxidase chloroplast precursorPhotosynthesisDown (final stage)Photosynthesis[12]
Shade
blue light receptor cryptochrome 2 (CRY2)PhotoreceptorsDownLight receptors[9]
HY5Photoreceptor regulatorDownLight receptors[9]
HY5- homolog (HYHPhotoreceptor regulatorDownLight receptors[9]
cytokinin (CTK)HormonesUpHormone signal[9]
brassinosteroid (BR)HormonesUpHormone signal[9]
pyrabactin resistance 1/PYR1-like (PYR)HormonesUpHormone signal[9]
ABA-responsive (element binding factor)HormonesUpHormone signal[9]
MaleateMaleic acidUpUV protection, pigmentation, cell defense[11]
beta-alanineAmino acid pathwayUpUV protection, pigmentation, cell defense[11]
CitrateAmino acid pathwayUpUV protection, pigmentation, cell defense[11]
AspartateAmino acid pathwayUpUV protection, pigmentation, cell defense[11]
procyanidin B1PolyphenolUpUV protection, pigmentation, cell defense[11]
EpigallocatechinPolyphenolUpUV protection, pigmentation, cell defense[11]
CatechinPolyphenolUpUV protection, pigmentation, cell defense[11]
RaffinoseSugars; Carbon metabolismUpCarbon metabolism[11]
Up: consists of positive regulation of enzymes involved in metabolic pathways; Down: consists of negative regulation of enzymes involved in metabolic pathways.
Table 2. Comparison of shaded and unshaded conditions for chlorophyll a (mg/gFM), chlorophyll b (mg/gFM), chlorophyll a + b (mg/gFM), and ROS O2.− (ABS/gFM).
Biochemical AnalytesShadedUnshadedp-ValueVariation %
Chlorophyll a (mg/gFM)0.190.120.001 *158.33
Chlorophyll b (mg/gFM)0.080.110.006 *71.03
Chlorophyll a + b (mg/gFM)0.270.230.037 *117.39
ROS O2.− (ABS/gMF)0.991.900.019 *52.10
* Statistically significant (p < 0.05) according to t-test. mg/gFM: milligrams per gram of fresh matter; ABS/gFM: absorbance per grams of fresh matter. Variations were computed considering the initial stage of the unshaded treatments.
Table 3. The top 10 reactions ranked through the PCA loadings contribute to the leave’s phenotype in shaded and unshaded conditions and the Flux Balance Analysis (FBA) in a.u. for each simulation.
Top 10 Reactions%FBA_P_CT_UFBA_P_CT_SFBA_P_96_UFBA_P_96_SFBA_B3_UFBA_B_3_S
Chl_FerredoxinReductase7.39%−793.91−525−396.95−262.5−396.95−262.5
Chl_G3Pdh7.04%756.10500378.05250378.05250
Chl_PGK7.04%756.10500378.05250378.05250
Chl_Ru5Pk4.22%453.66300226.83150226.83150
Chl_PGlyPase2.81%302.44200151.22100151.22100
Chl_RuBPOxid2.81%302.44200151.22100151.22100
Chl_TPI2.81%302.44200151.22100151.22100
Chl_X5Piso2.81%302.44200151.22100151.22100
Mit_Gly_tx2.81%302.44200151.22100151.22100
Per_Glycolate_tx2.81%302.44200151.22100151.22100
Total42.57%------
Chl_FerredoxinReductase: chloroplast ferredoxin reductase; Chl_G3Pdh: chloroplast glyceraldehyde-3-phosphate dehydrogenase; Chl_PGK: chloroplast phosphoglycerate kinase; Chl_Ru5Pk: chloroplast ribulose-5-phosphate kinase; Chl_PGlyPase: chloroplast phosphoglycolate phosphatase; Chl_RuBPOxid: chloroplast ribulose-1,5-bisphosphate oxygenase; Chl_TPI: chloroplast triose phosphate isomerase; Chl_X5Piso: chloroplast xylulose-5-phosphate isomerase; Mit_Gly_tx: mitochondrial glycolate transporter; Per_Glycolate_tx: peroxisomal glycolate transporter. For unshaded conditions, the vector of Flux Balance Analysis (FBA) models include FBA_P_CT_U (Peroxisomal Catalase Reaction as objective), FBA_P_96_U (Peroxisomal Glycolate Oxidase Reaction), and FBA_B3_U (Peroxisomal Catalase Reaction as objective and Peroxisomal Glycolate Oxidase Reaction as objective). Similarly, shaded conditions are represented by FBA_P_CT_S, FBA_P_96_S, and FBA_B3_S, respectively.
Disclaimer/Publisher’s Note: The statements, opinions and data contained in all publications are solely those of the individual author(s) and contributor(s) and not of MDPI and/or the editor(s). MDPI and/or the editor(s) disclaim responsibility for any injury to people or property resulting from any ideas, methods, instructions or products referred to in the content.

