Article

Phenotypic and Molecular-Markers-Based Assessment of Jamun (Syzygium cumini) Genotypes from Pakistan

by
Safeer Uddin
1,2,
Muhammad Jafar Jaskani
2,
Zhanao Deng
3,
Rizwana Maqbool
4,
Summar Abbas Naqvi
2,
Saroj Parajuli
3,
Naseem Sharif
5,
Abdul Rahman Saleem
2,
Steven Ledon
6,
Sufian Ikram
2,
Iqrar Ahmad Khan
2 and
Waqar Shafqat
7,*
1
Pakistan Agricultural Research Council-Arid Zone Research Centre, Dera Ismail Khan 29050, Pakistan
2
Institute of Horticultural Sciences, University of Agriculture, Faisalabad 38000, Pakistan
3
Gulf Coast Research and Education Center, University of Florida, Wimauma, FL 33598, USA
4
Center for Advanced Studies in Agriculture and Food Security, University of Agriculture, Faisalabad 38000, Pakistan
5
Horticultural Research Institute, Ayub Agricultural Research Institute, Faisalabad 38850, Pakistan
6
Agricultural and Biological Engineering Department, University of Florida, Gainesville, FL 32608, USA
7
Department of Forestry, College of Forest Resources, Mississippi State University, Mississippi State, MS 39762, USA
*
Author to whom correspondence should be addressed.
Horticulturae 2024, 10(8), 879; https://doi.org/10.3390/horticulturae10080879
Submission received: 11 July 2024 / Revised: 17 August 2024 / Accepted: 18 August 2024 / Published: 20 August 2024

Abstract

:
Jamun plant displays enormous diversity throughout Pakistan, which necessitates its screening, evaluation, and validation to document elite genotypes having better traits for the benefit of the fruit industry and farmers. Surveys were made in natural Jamun habitats across Punjab, Pakistan, and genotypes were marked based on visual diversity of trees and fruits. In total, 60 Jamun genotypes were selected for characterization based on phenotypic and genetic markers. Phenotypic characters related to trees, leaf, and flower along with fruit qualitative traits were assessed in situ. Results revealed significant diversity with high (>25%) coefficient of variance values and the first two components of correspondence analysis exhibited 41.71% variation among genotypes. A strong association was observed among traits like upright tree and round fruit shape (0.74), bluish-colored fruit and pinkish pulp (0.85), and elliptic-shaped fruit with low fruit waxiness (−0.72). Leaves of phenotypically characterized plants were brought to Wheat Biotechnology Lab., University of Agriculture, Faisalabad, Pakistan, where Jamun genotypes were investigated genetically using Random Amplified Polymorphic DNA (RAPD) and Inter Simple Sequence Repeat (ISSR) markers. A total of 132 bands were scored, of which 108 were polymorphic, corresponding to almost 81% polymorphism among collected genotypes. High polymorphism information content values were observed against RAPD (0.389) and ISSR (0.457) markers. Genotypes were compared in relation to genetic markers, which exhibited that almost 86% of genetic variability was attributed to differences among accessions, while 14% of variation was due to differences between collections of different areas. Findings of this study confirmed wide phenotypic and genetic distinctness of Jamun in Pakistan that can aid breeders for marker-assisted selection and germplasm enhancement for future crop improvement programs.

1. Introduction

Syzygium cumini is a member of the genus Syzygium, from the family Myrtaceae, a taxonomic group that includes numerous species of nutritional and medicinal significance, such as Psidium guajava (guava), Syzygium aromaticum (clove), and Eucalyptus globulus (eucalyptus) [1]. It is a hardy, fruit-bearing tree [2] capable of growing in both tropical and subtropical environments [3]. S. cumini is commonly known as Jamun or black plum and is a medium to tall evergreen tree that bears nutritionally enriched fruit, typically eaten raw. The fruit is deep purple to black in color and has a unique sweet to sour astringent taste [4]. It is high in minerals (K, Ca, and Mg) [5,6], vitamins (C and A), anthocyanins, tannins, and antioxidant compounds [7,8]. Mature fruits possess antidiabetic, hepatoprotective, and vasorelaxant properties [8,9,10]. Other plant parts, such as leaves, bark, and seeds, also have antioxidant properties due to the higher amount of anthocyanins, flavonoids, tannins, and other phenolic constituents [10,11]. They have been reported to be significant in the prevention of cancer, diabetes [12], chronic diseases [13], and cardiovascular diseases [14].
Jamun has high ecological and economic importance; it is an evergreen tree of tropical and subtropical areas, which provides a habitat to various wildlife species (birds, insects, and animals) [3]. Jamun has an outstanding ability to mitigate climate change and can tolerate temperature and drought stress. Moreover, it can reduce carbon dioxide levels in the atmosphere by integrating carbon sequestration [15]. Jamun is an emerging fruit crop of the 21st century [10] and, due to its high significance, Jamun fruit has been referred to as the fruit of the future [16]. Its fruit has gained commercial importance due to high nutraceutical properties, which can cope with malnutrition and cure serious ailments [4]. Jamun plant has high economic value as its fruits can be eaten fresh or used in the processing industry for making jam, jellies, squashes, and pickles [17]. Its wood has high timber value as stem serves in making agricultural implements and building material and foliage serves as fodder for cattle. Regarding economic growth, wide Jamun cultivation gears up the employment opportunities for local farmers by boosting fruit and timber industry [18].
Jamun is native to the Indo-Malaysian region [19] and its high diversity has been reported from Southeast Asia (Indonesia, Malaysia, and the Philippines) to South Asia (India, Pakistan, and Sri Lanka) [20,21]. Jamun was introduced to different parts of the world, including the United States of America and Australia, in the early 20th century [1]. Pakistan is one of the native countries of Jamun and has a lot of area under its cultivation. Jamun is still underutilized and there are only two reported cultivars, Desi and Raw and they are mainly raised through seedling selections; variability is expected in Pakistani Jamun germplasm due to heterozygosity [22,23]. These seedling plants exhibit variation in tree behavior, fruit morphology, fruit quality, maturity, and productivity throughout the country, providing an excellent scope for selecting better varieties [23]. High nutraceutical importance and economic benefits necessitate screening, evaluation, and validation to document its elite genotypes having better traits for the benefit of the fruit/food industry and farmers. Morphological parameters are the first measure of any plant diversity and a basic tool for the identification of cultivars. These characters have been used to classify several genera and species [24,25,26]. Phenotypic characters have the limitation of being influenced by environment and age of the plant [27,28]. Information gathered on phenotypic bases can be further strengthened with the help of genetic markers [29]. The genetic/DNA markers system has the advantage of not being influenced by plant growth stage, age, or environment [30]. Therefore, it has been reported as ideal and more authentic for diversity and relationship studies [31,32,33,34]. Studies based on identification and characterization on phenotypic and genetic grounds are prerequisite for classification and can help in improving the precision and efficiency of crop genetic improvement programs [35].
Several molecular marker techniques have been reported to be suitable for evaluating genetic diversity in plant species [31,36]. Among these techniques, the Random Amplified Polymorphic DNA (RAPD) and Inter Simple Sequence Repeats (ISSR) based marker systems are known for their convenience and effectiveness in evaluating genetic diversity among various plant species [30,31,33]. These marker systems do not require high prior knowledge of genetic sequences [30,36] and are most suitable for genetic diversity analysis of unexplored or emerging crops [32]. Effectiveness of these markers has been reported in several studies related to genotype identification [18,37,38], zygotic and nucellar detection [39], and for assessing the relationship among accessions [40,41]. Refs. [42,43] reported these dominant markers as useful for the determination of genetic diversity among apples collected from Brazil and Romania. Ref. [38] found these marker systems effective for characterization and population analysis of grape cultivars from Igdir, Turkey. Recently, in India, Jamun genotypes from the northwestern Indian Himalayas have been characterized using RAPD and ISSR markers [18]. Ref. [39] used RAPD markers for identification of zygotic and nucellar seedlings in Jamun. Several other studies from different Jamun-growing countries have also reported RAPD and ISSR markers, effective for molecular fingerprinting and genetic diversity analysis of Jamun cultivars [3,28,35,44]. This study planned to determine variability and association among phenotypic traits under Pakistan climatic conditions coupled with assessment of genetic diversity and pattern of genetic structure in Pakistan’s Jamun genotypes.

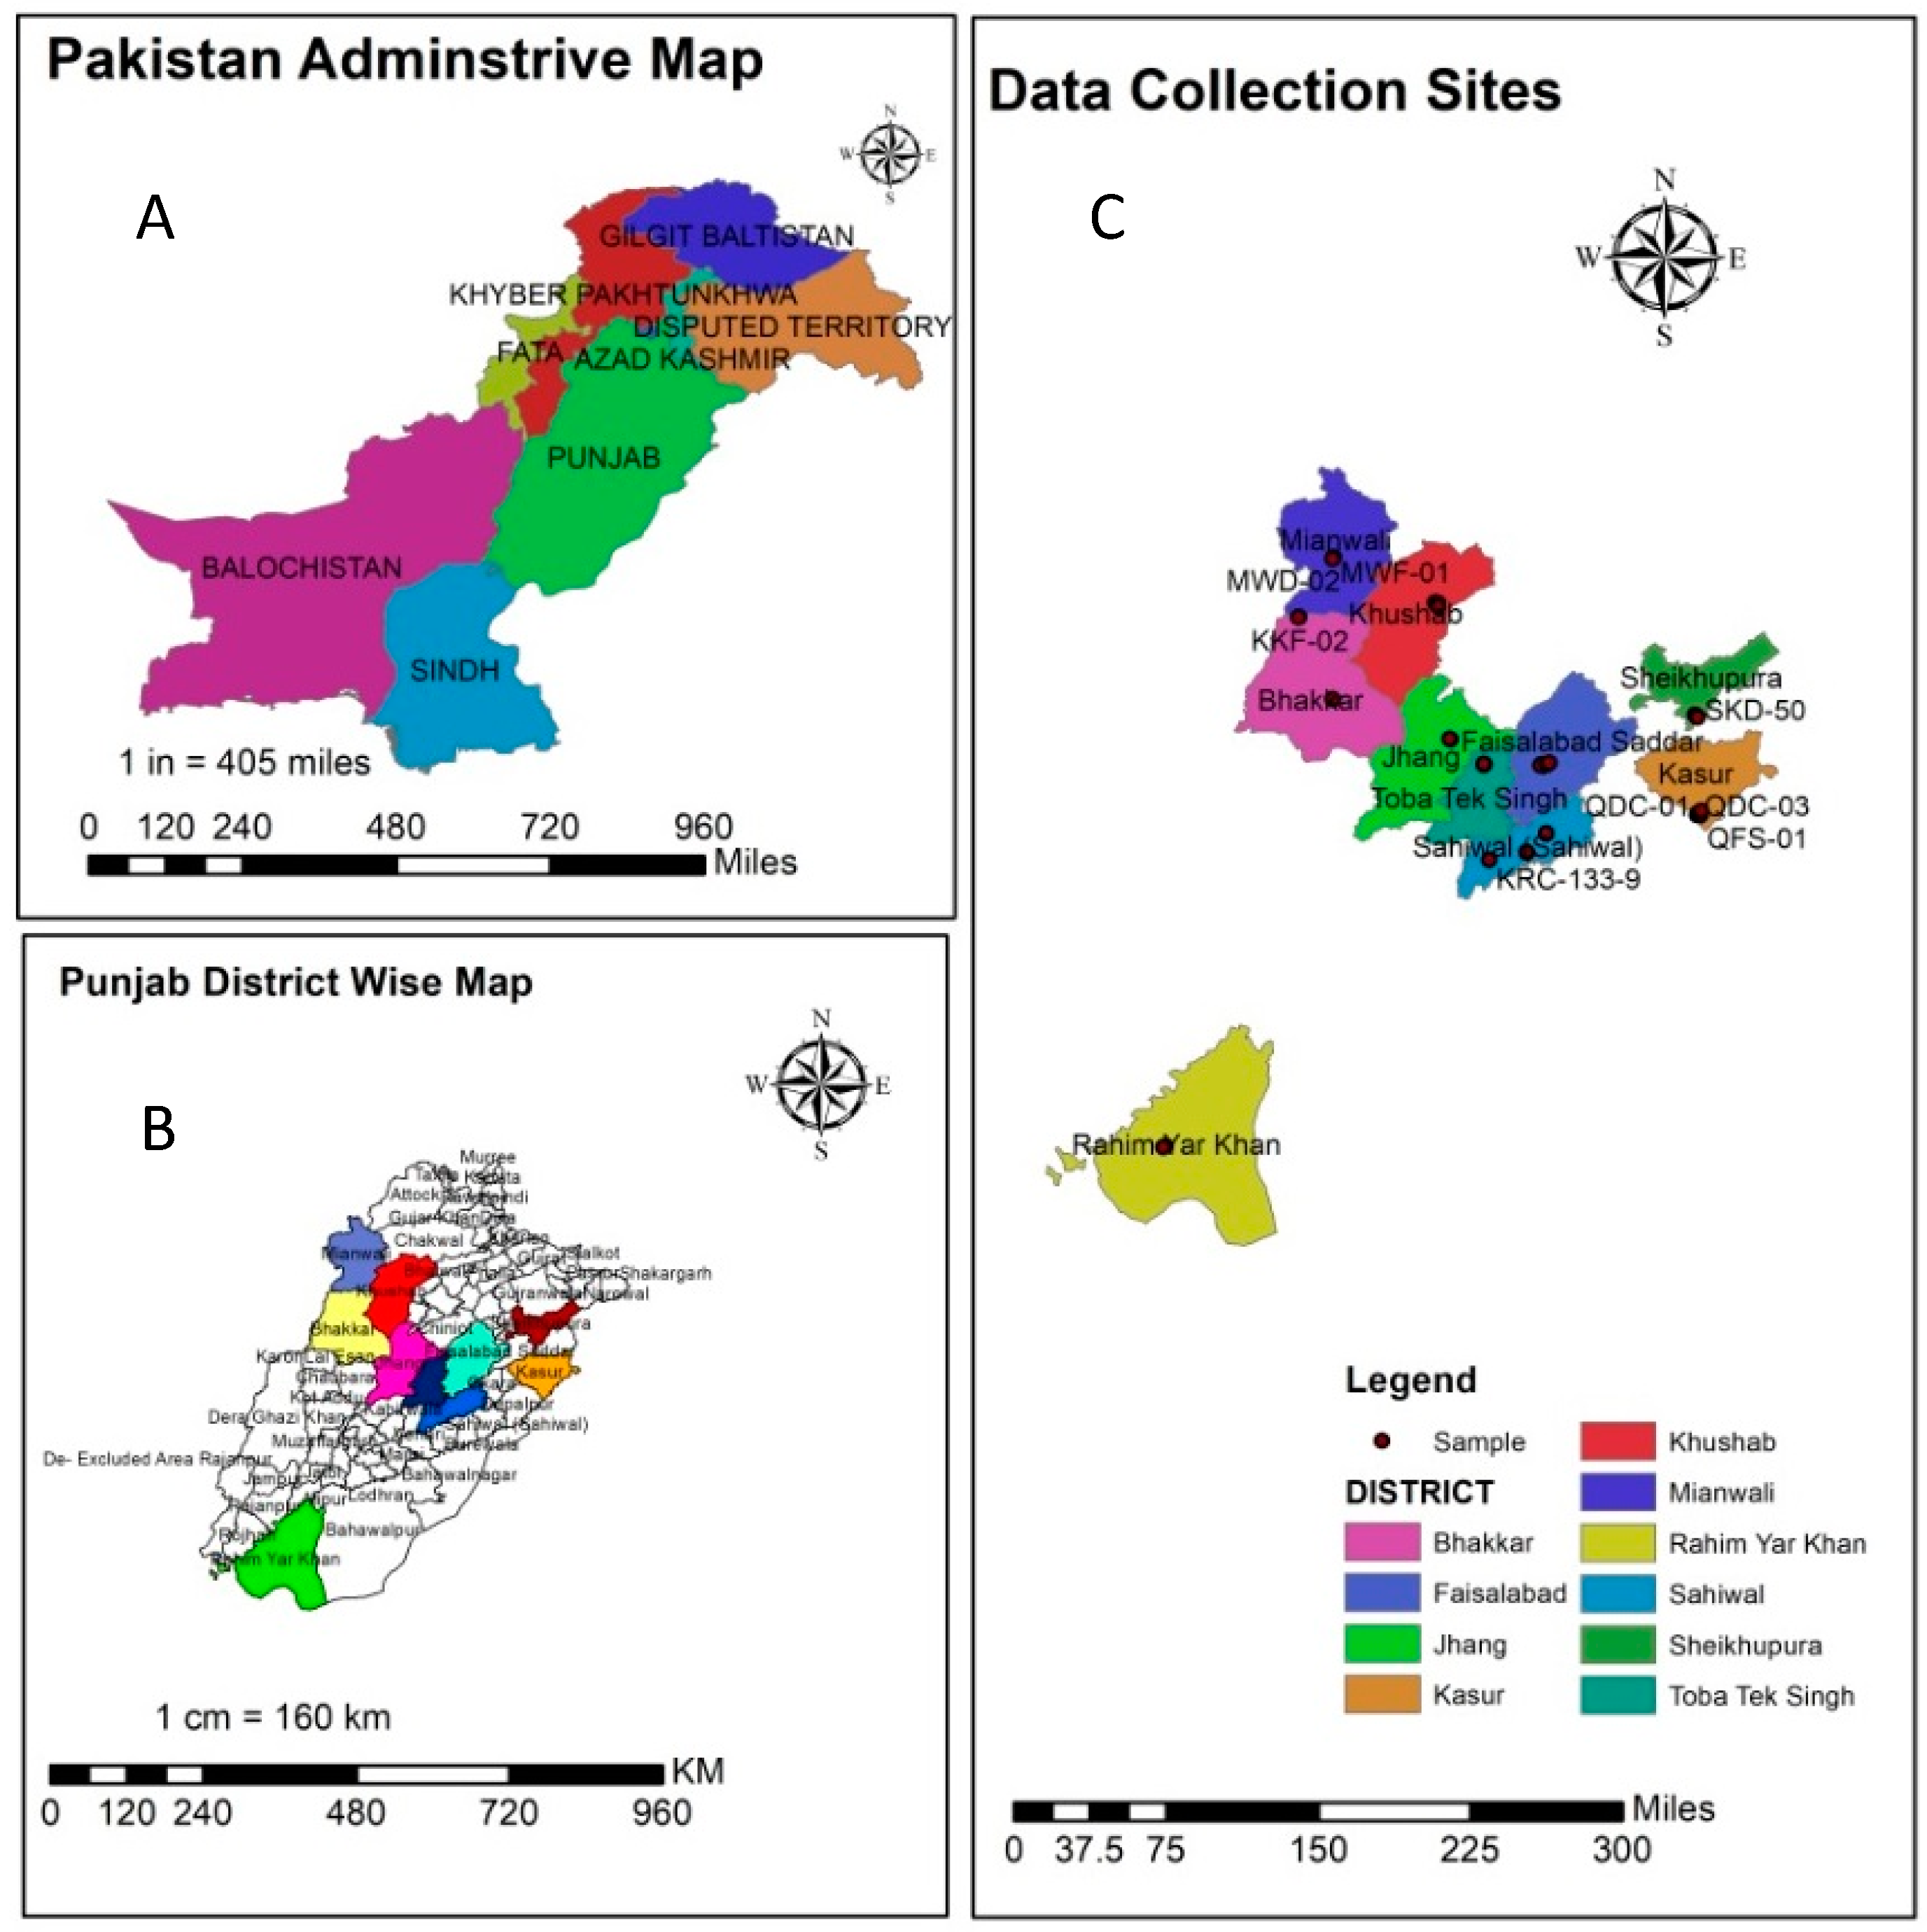
2. Materials and Methods

The present experiment was planned in Punjab province during 2021–22. Surveys were planned in natural Jamun habitats across various areas of Punjab province, Pakistan. The selected districts include Faisalabad, Sahiwal, Bhakkar, Jhang, Mianwali, Khushab, Sheikhupura, Toba Tek Singh, Kasur, and Rahim Yar Khan (Table 1; Figure 1). Within each district, five locations were surveyed, with an average distance of 15–20 km between each location. Genotypes were randomly marked based on visual diversiy of the fruit and tree [45]. The number of accessions sampled per location and district were determined based on the diversity of habitats observed. In total, 60 Jamun genotypes (Table 1) were collected and compared for phenotypic and genetic diversity.

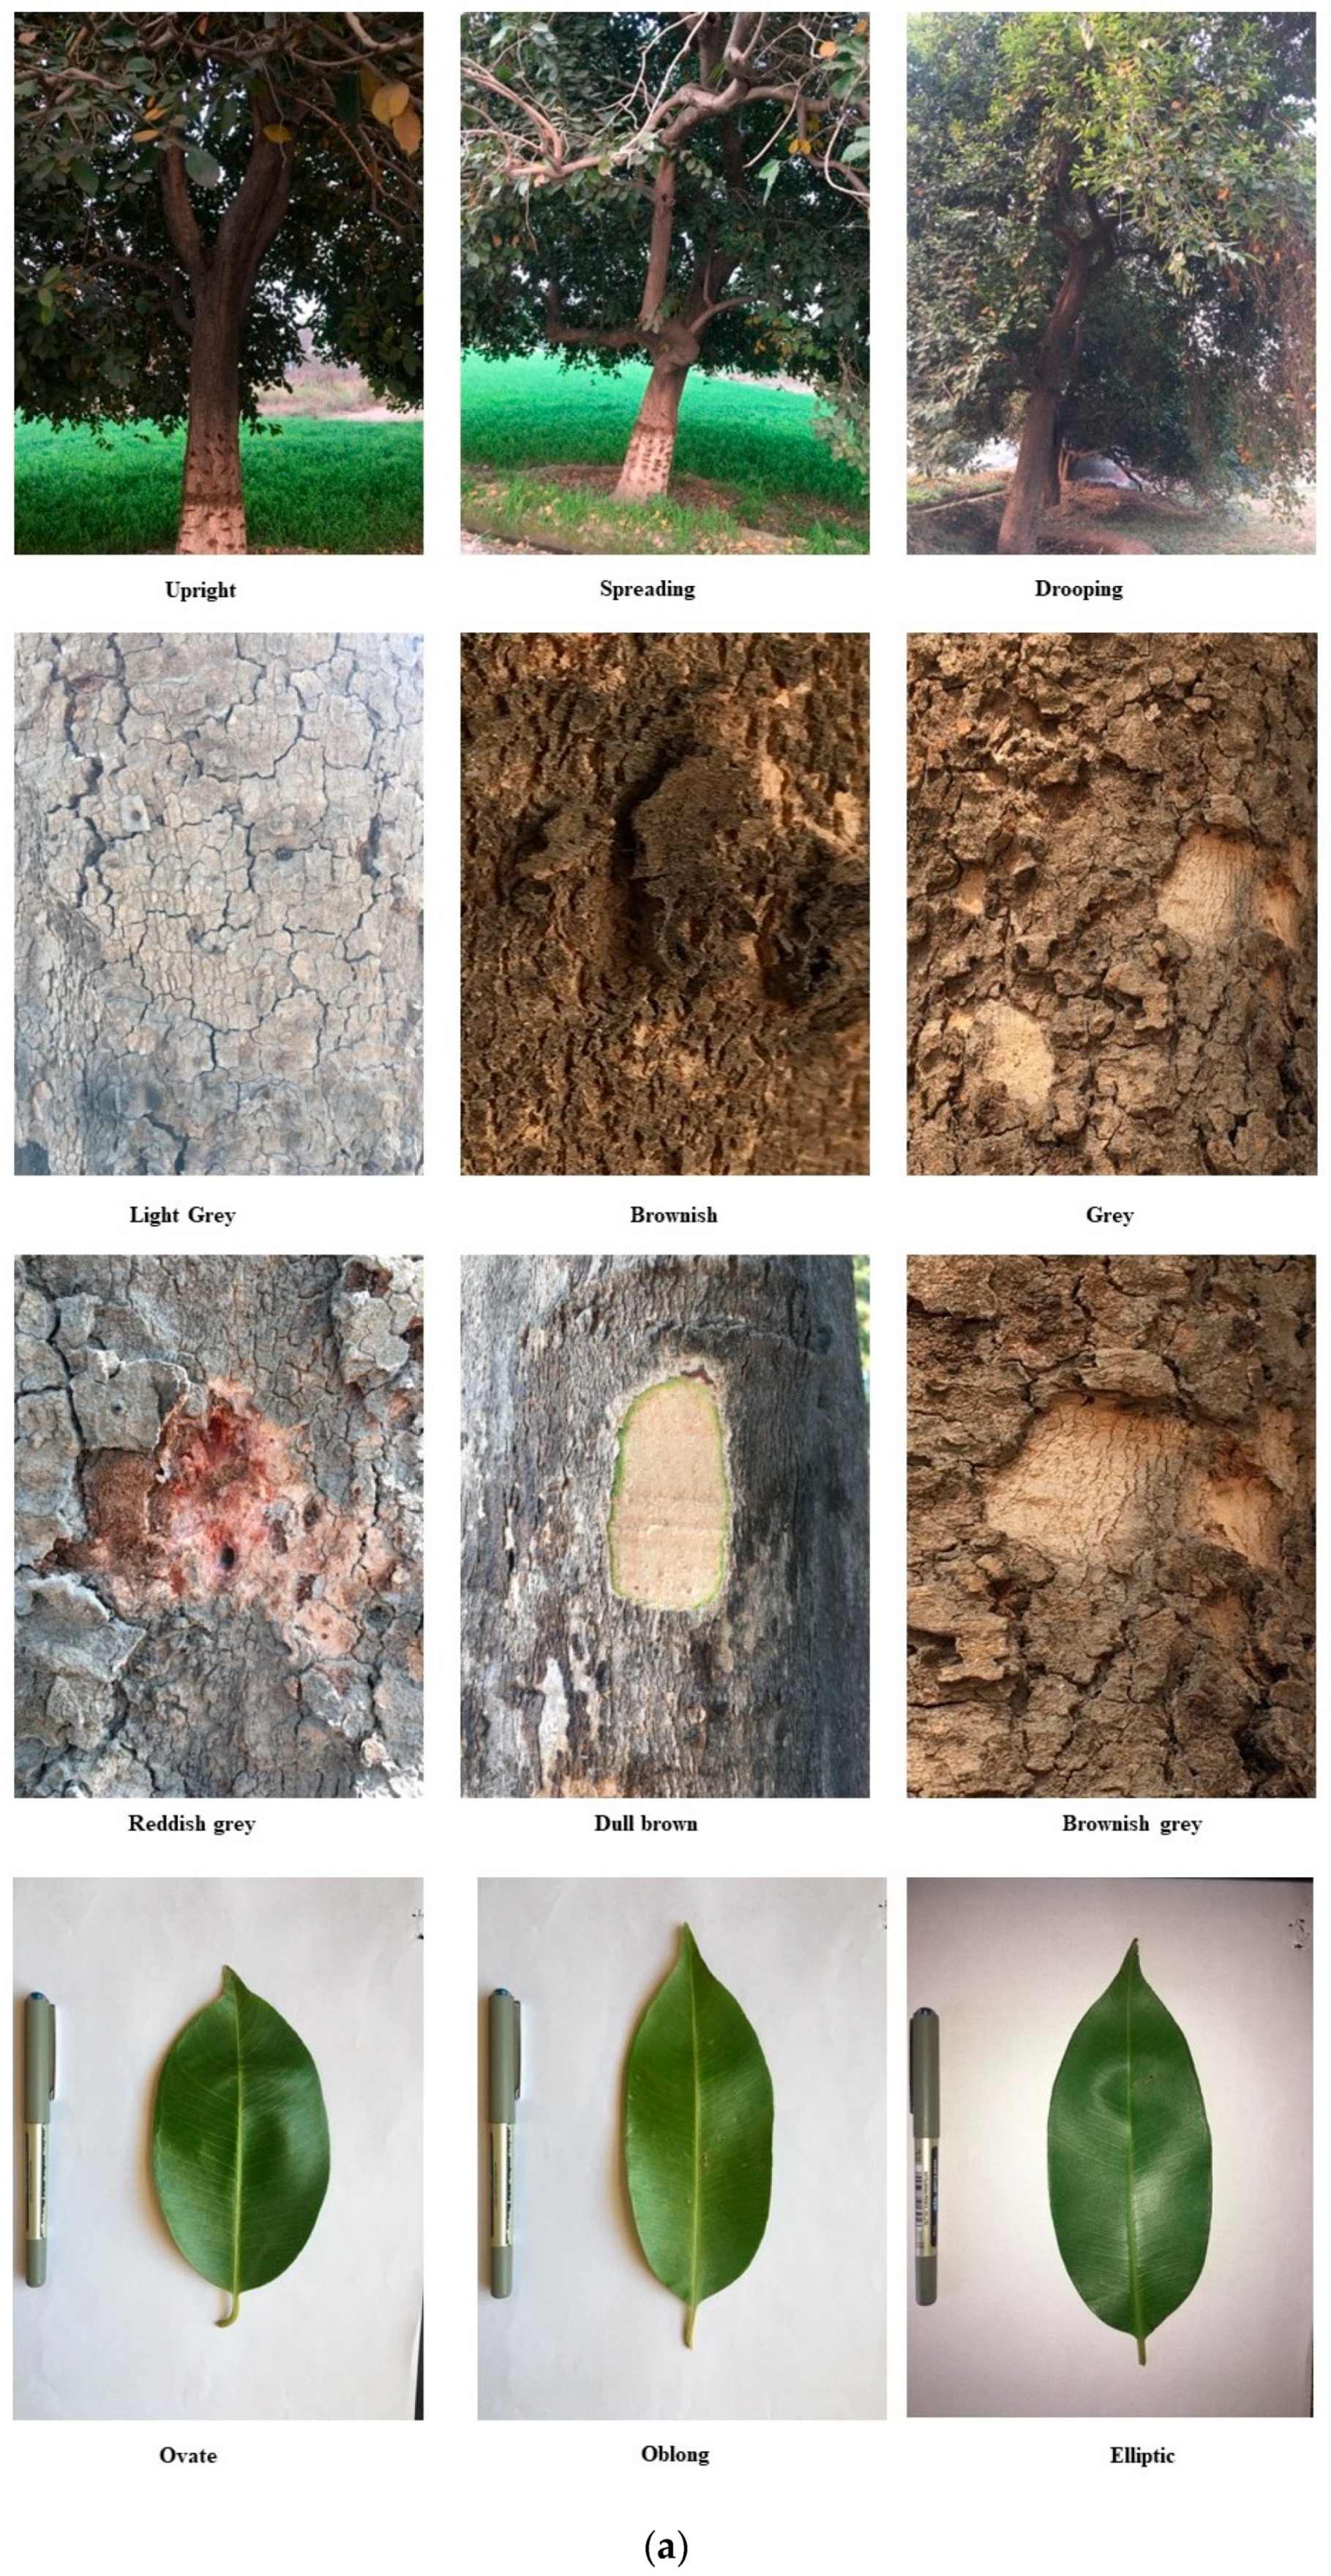
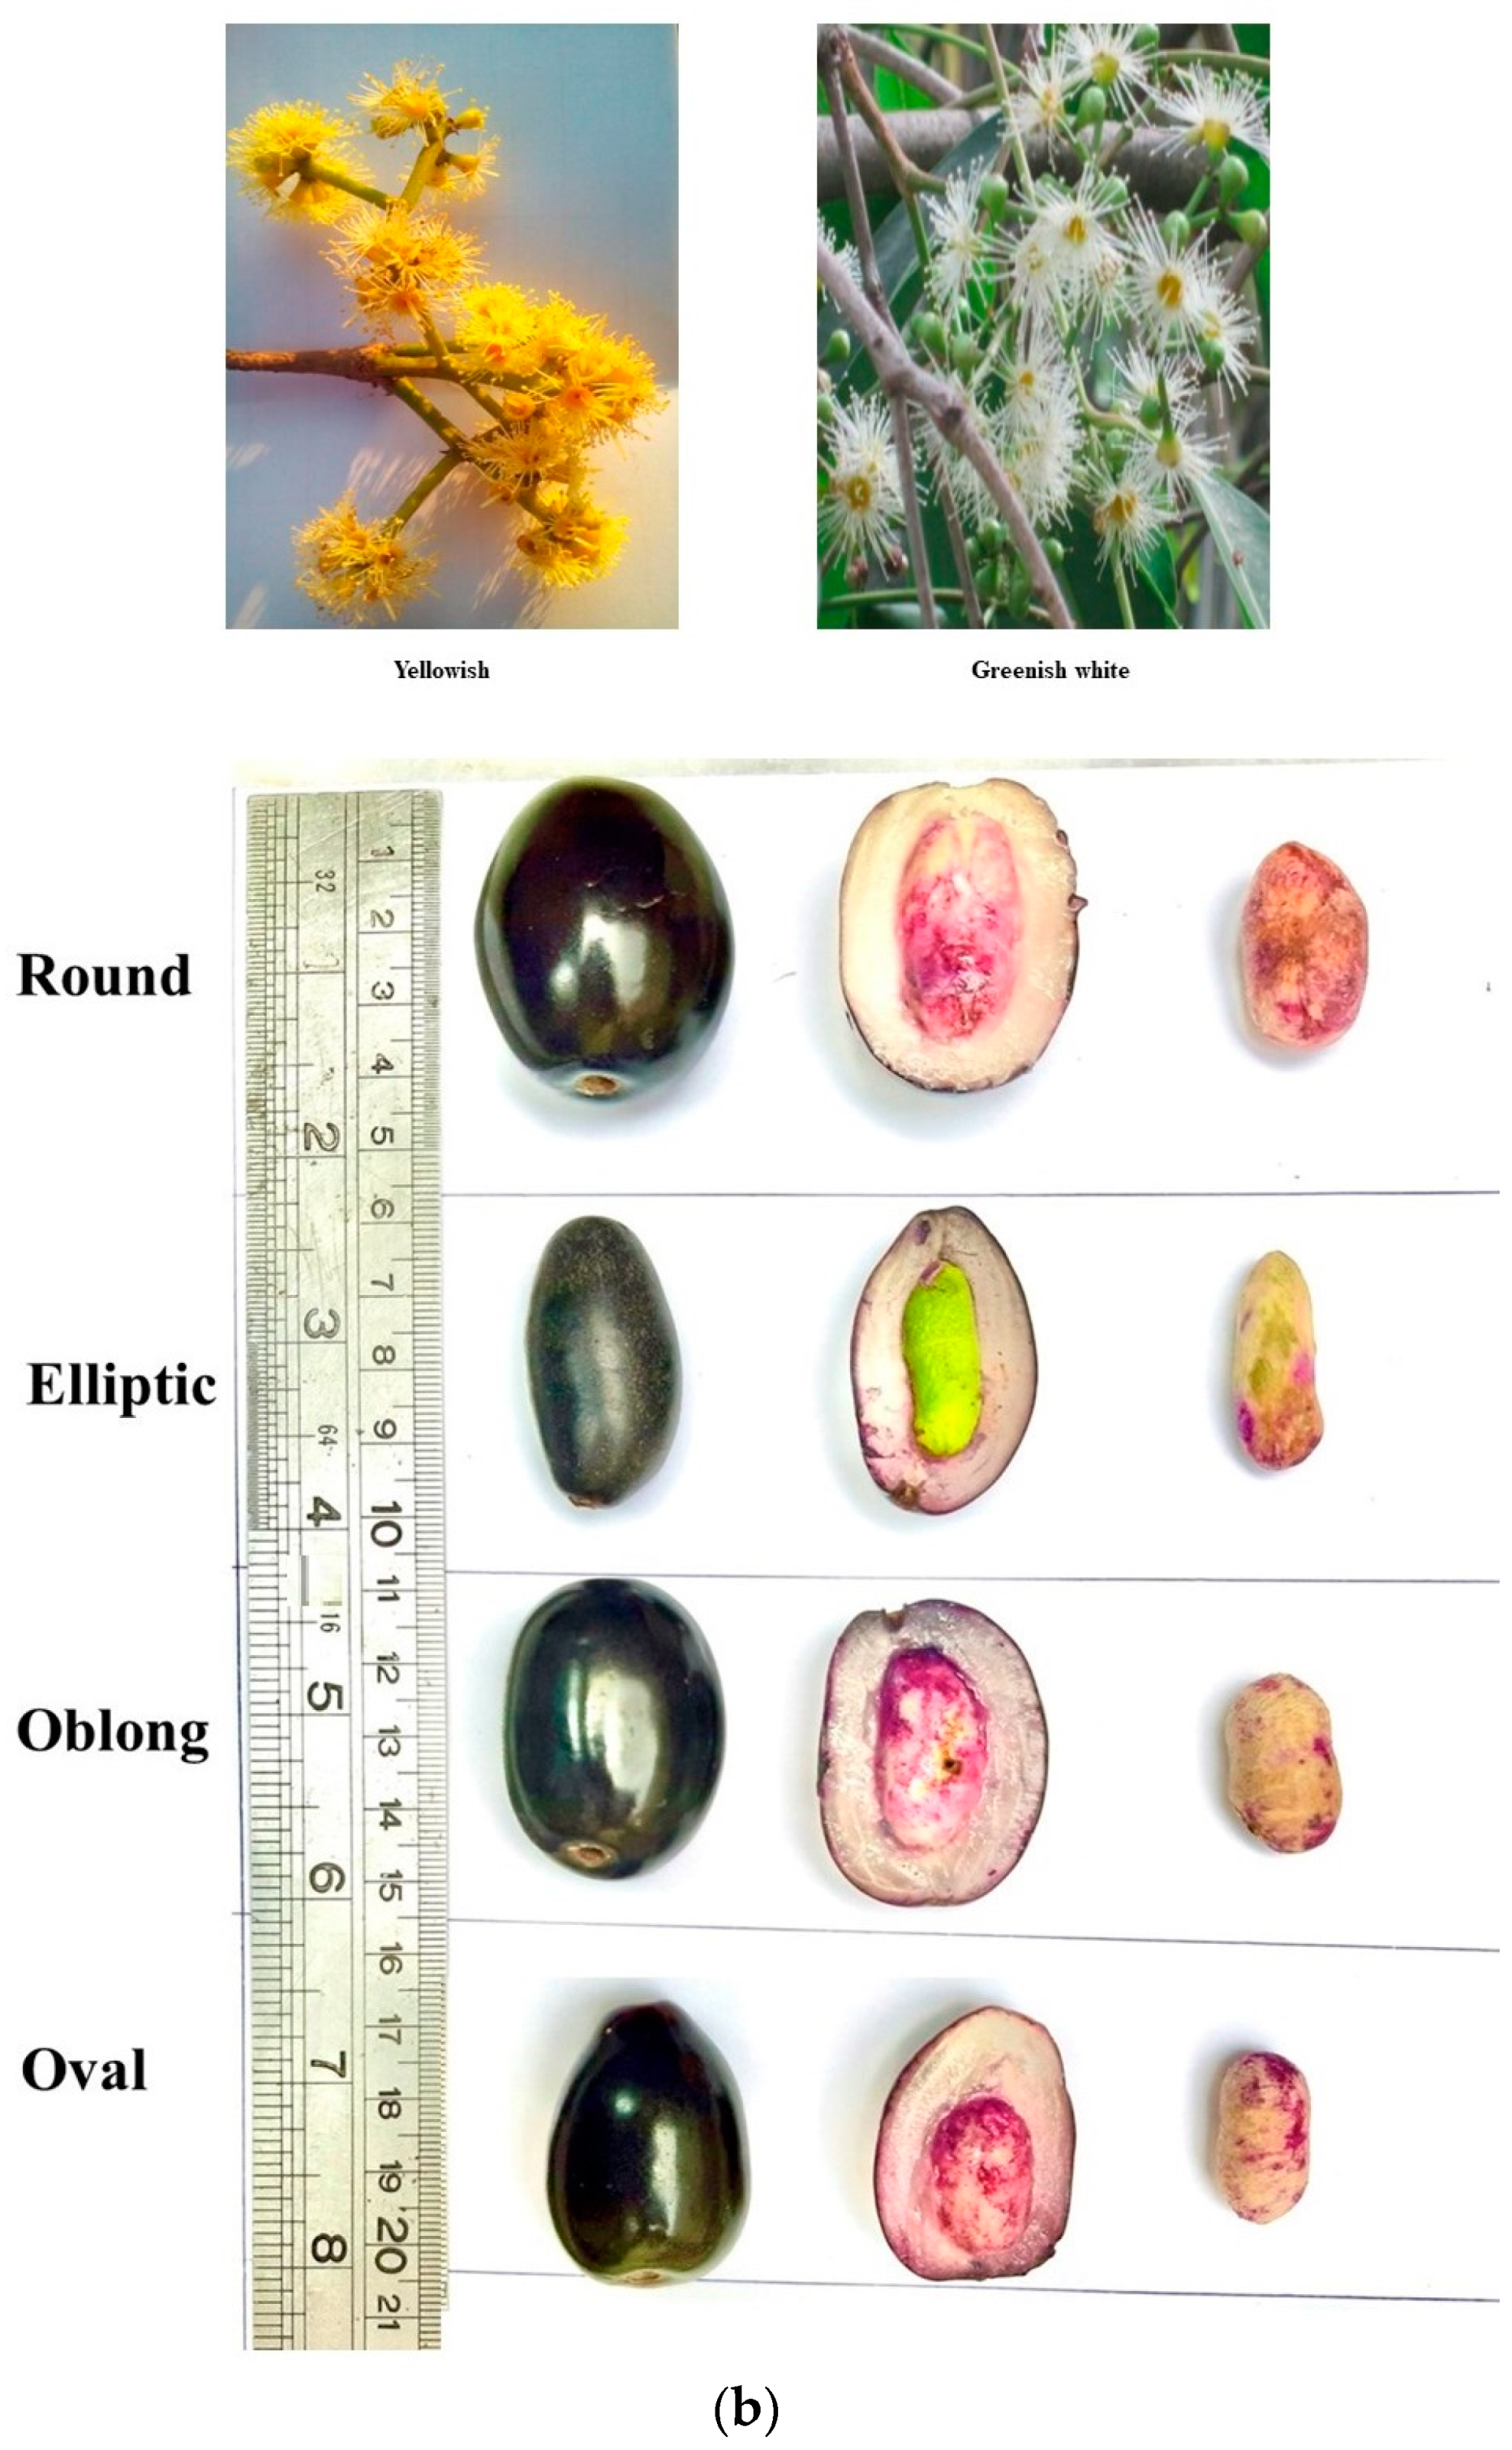
2.1. Phenotypic Diversity Estimation

Data for phenotypic characterization were obtined in situ from trees of aproximately the same age (based on trunk size and height) between 8 and 12 years, as mentioed earlier by [44,45]. Each individual tree was selected as an experimental unit witout replication and mature leaves and fruits were used for data collection. In selected Jamun genotypes, various tree, leaf, flower, and fruit qualitative traits were evaluated and scored under the light of Jamun biodiversity descriptors by Agro Biodiversity, Plant Genetic Resources [46]. Descriptive phenotypic characters and their categories are mentioned in Table 2; Figure 2 (a and b).

2.2. Genetic Diversity Estimation

Healthy, young, and disease-free leaves of each accession were collected to evaluate genetic variability among Jamun genotypes. Leaves were tagged and placed in zipper bags for preservation. Upon reaching the laboratory, the leaf samples were immediately stored in a −80 °C refrigerator until they were used for DNA extraction. The DNA from leaves of Jamun genotypes was extracted using the cetyl tri-methyl ammonium bromide (CTAB) protocol with minor modifications [47]. The quality and quantity of the extracted DNA was assessed using 1% agarose gel and a NanoDrop spectrophotometer (ND_1000, Wilmington, DE, USA). DNA preps were diluted in molecular-grade water, making a final concentration of 50 ng/µL, and used as templates for subsequent polymerase chain reactions (PCRs). For genetic characterization of Jamun genotypes, Random Amplified Polymorphic DNA (RAPD) and Inter Simple Sequence Repeats (ISSR) markers having more than 50% GC conent were employed on the basis of their ability to reveal high PIC values (>0.8) in previous studies on Jamun [3,18,44,48]. Initially, 15 RAPD (Decamer Oligonucleotide (Operon Technologies, Alameda, CA, USA)) and 10 ISSR markers/primers (di- or trinucleotide repeats (Biotechnology Laboratory, University of British Columbia)) were screened against the genomic DNA of 5 Jamun genotypes. Among them, 10 RAPD and 7 ISSR primers consistently produced a reproducible and robust amplification pattern (Table 3). These selected molecular markers were used for the genetic characterization of Jamun genotypes.
For PCR amplification of Jamun genotypes using RAPD primers, the guidelines of [44,49] were followed. As for ISSR markers, the protocol devised by [3,48] was utilized with minor modifications. The PCR program consisted of an initial denaturation step at 94 °C for 4 min, followed by 35 cycles of denaturation at 94 °C for 1 min, annealing at 36 °C for 1 min, and extension at 72 °C for 2 min. A final extension was performed at 72 °C for 10 min. After PCR amplification using both RAPD and ISSR markers, the resulting products were separated by standard agarose gel electrophoresis (1.2% w/v) in 1X TAE buffer at 70 volts and 250 mA for one and a half (1½) hours. To determine the size of the amplified fragments, 100 bp DNA ladders (New England Biolabs, Ipswich, MA, USA) were used as size markers. The gels were then photographed using a gel documentation system (Bio-Rad, Hercules, CA, USA).

2.3. Statistical Analysis

For evaluation of phenotypic characters, an R package correspondence analysis (FactoMineR) dedicated to multivariate analysis of qualitative (categorical) variables was employed [50,51]. A qualitative characters-based distance matrix was employed to construct a correspondence analysis plot to depict the affiliation among S. cumini genotypes. Correlation analysis was also conducted to analyze relation among different characters using “corrplot” function in “Psych” package of RStudio suit (4.1.1).
The reproducible amplified bands obtained from the PCR were manually scored for each primer and genotype as either present (1) or absent (0). This scoring created a binary matrix, following the approach mentioned by [32]. To assess the genetic relationship among individuals, “dissimilarity” distance algorithms were employed. The resulting data were visualized using the unweighted pair group method with an arithmetic mean (UPGMA) for construction of phylogenetic tree. To determine the distinction of accessions based on their subsp. assignment, the STUCTURE program version 2.3.4 was used following the method developed by [52]. The most likely number of clusters (k) was estimated using Structure Harvester [53].

3. Results

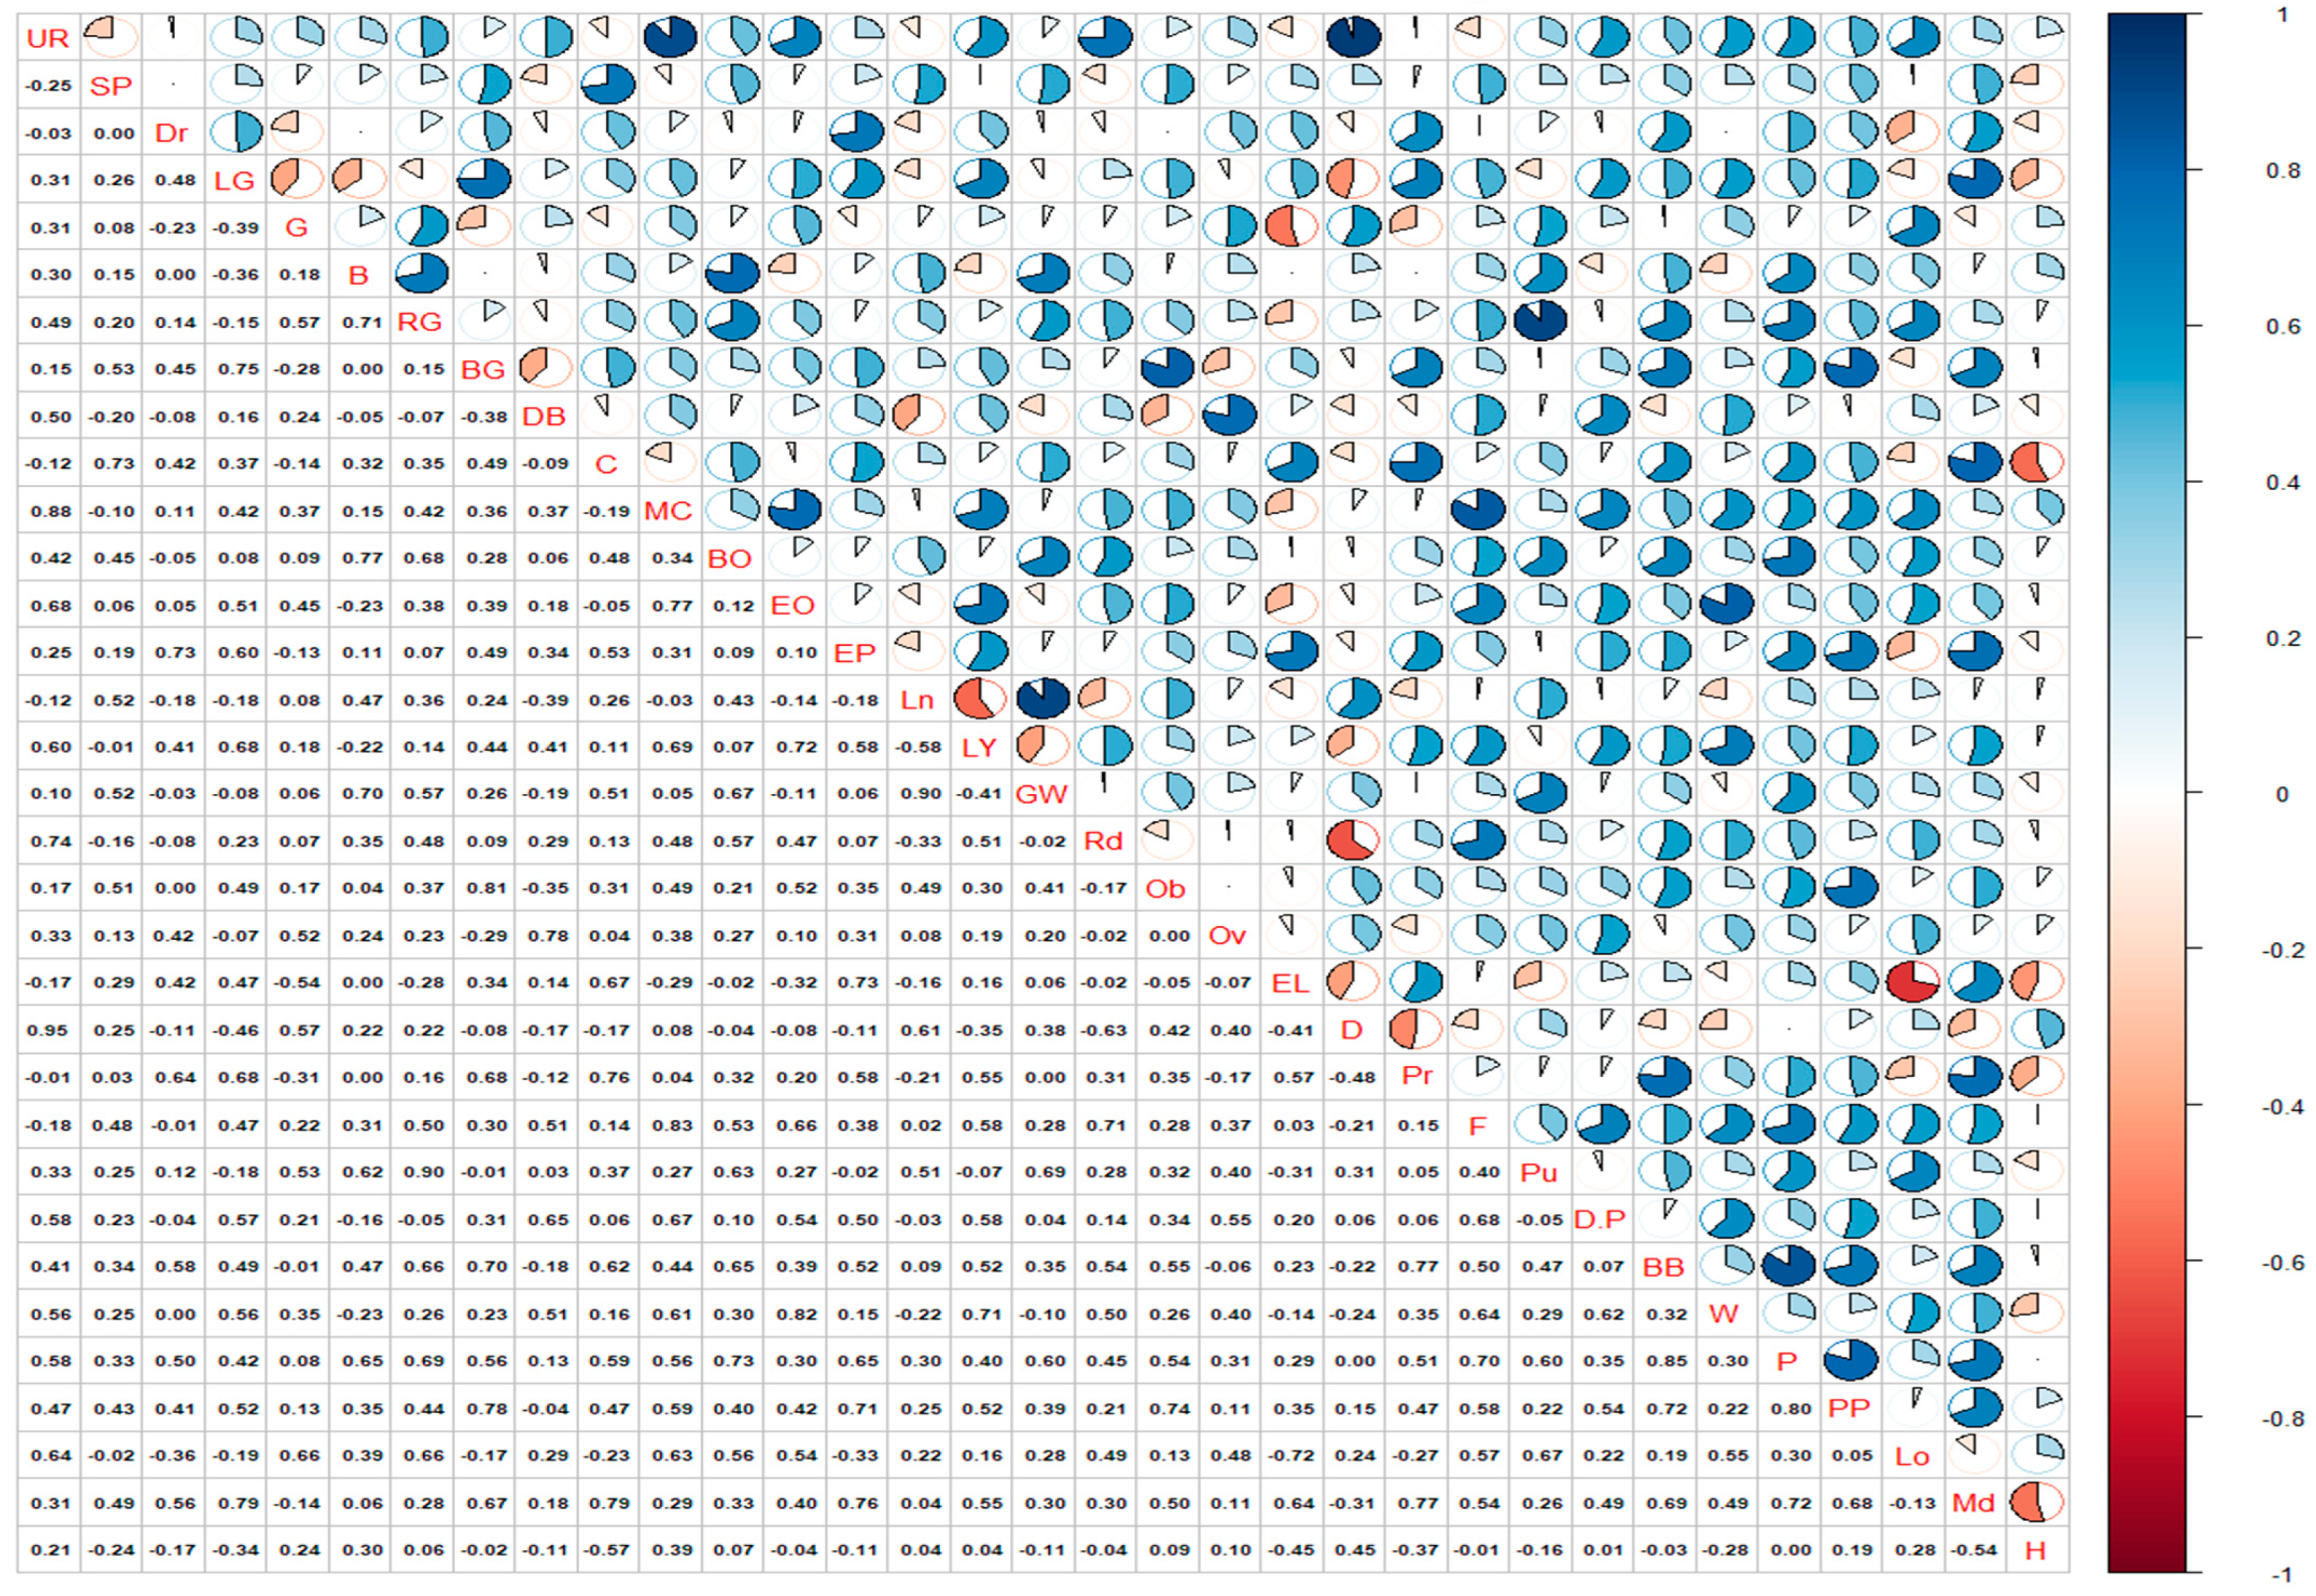
3.1. Frequency Distribution and Correlation of Descriptive Phenotypic Characters among Jamun (S. cumini) Genotypes

A statistically significant difference was observed among Jamun genotypes with respect to all the phenotypic characters (p < 0.05). The frequency distribution of traits and their observed polymorphs are explained in relation to different collection sites (Table 4). Oblong-shaped fruit was predominant (42%) and showed a higher proportion than other types (round, oval, and elliptic) in four collection districts (Khushab, Kasur, Sahiwal, and Toba Tek Singh). Fruit color varied from bluish black (60%) to deep purple (35%) in color, while only 5% of accessions revealed pinkish-colored fruit. Lanceolate-shaped leaves were only observed in genotypes from Kasur, while, from Jhang districts, all the genotypes had elliptic leaves. Flower color of Jamun genotypes was dominated (82%) by light yellow color, as Khushab, Sahiwal, Bhakkar, Sheikhupura, Faisalabad, Mianwali, and Toba Tek Singh showed more than 80% accessions with light yellowish flowers. Tree and leaf qualitative characters also revealed variations in shape and color. An accession-wise phenotypic description of 60 Jamun genotypes is mentioned in Table 5.
Correlation analysis was conducted among all the possible polymorphs of descriptive phenotypic characteristics, revealing their relationship for diversity/similarity, and is shown in Figure 3. Tree shape was associated with fruit shape (0.48) as, in most of upright-shaped trees, round (0.74) and oval (0.33) shaped fruits were observed with a depressed base (0.95). Flower color correlated with fruit shape as light yellowish flowers mostly produced round-shaped fruits (0.51). Bluish-black-colored fruits strongly correlated with pinkish (0.85) and purple pink (0.72) colored pulp. Leaf characteristics (leaf shape and leaf surface) also revealed correlations, as elliptic oblong leaves were mild coriaceous (0.77) and were dominant in upright-shaped trees (0.88); medium to high correlation in the case of fruit and pulp characters was also observed. A strong negative correlation was evident among characters like lanceolate-shaped leaves with light yellow flowers (−0.58) and elliptic-shaped fruits with low fruit skin waxiness (−0.72). Figure 3 indicates correlation among evaluated phenotypic characters with each other in Jamun genotypes from Pakistan.

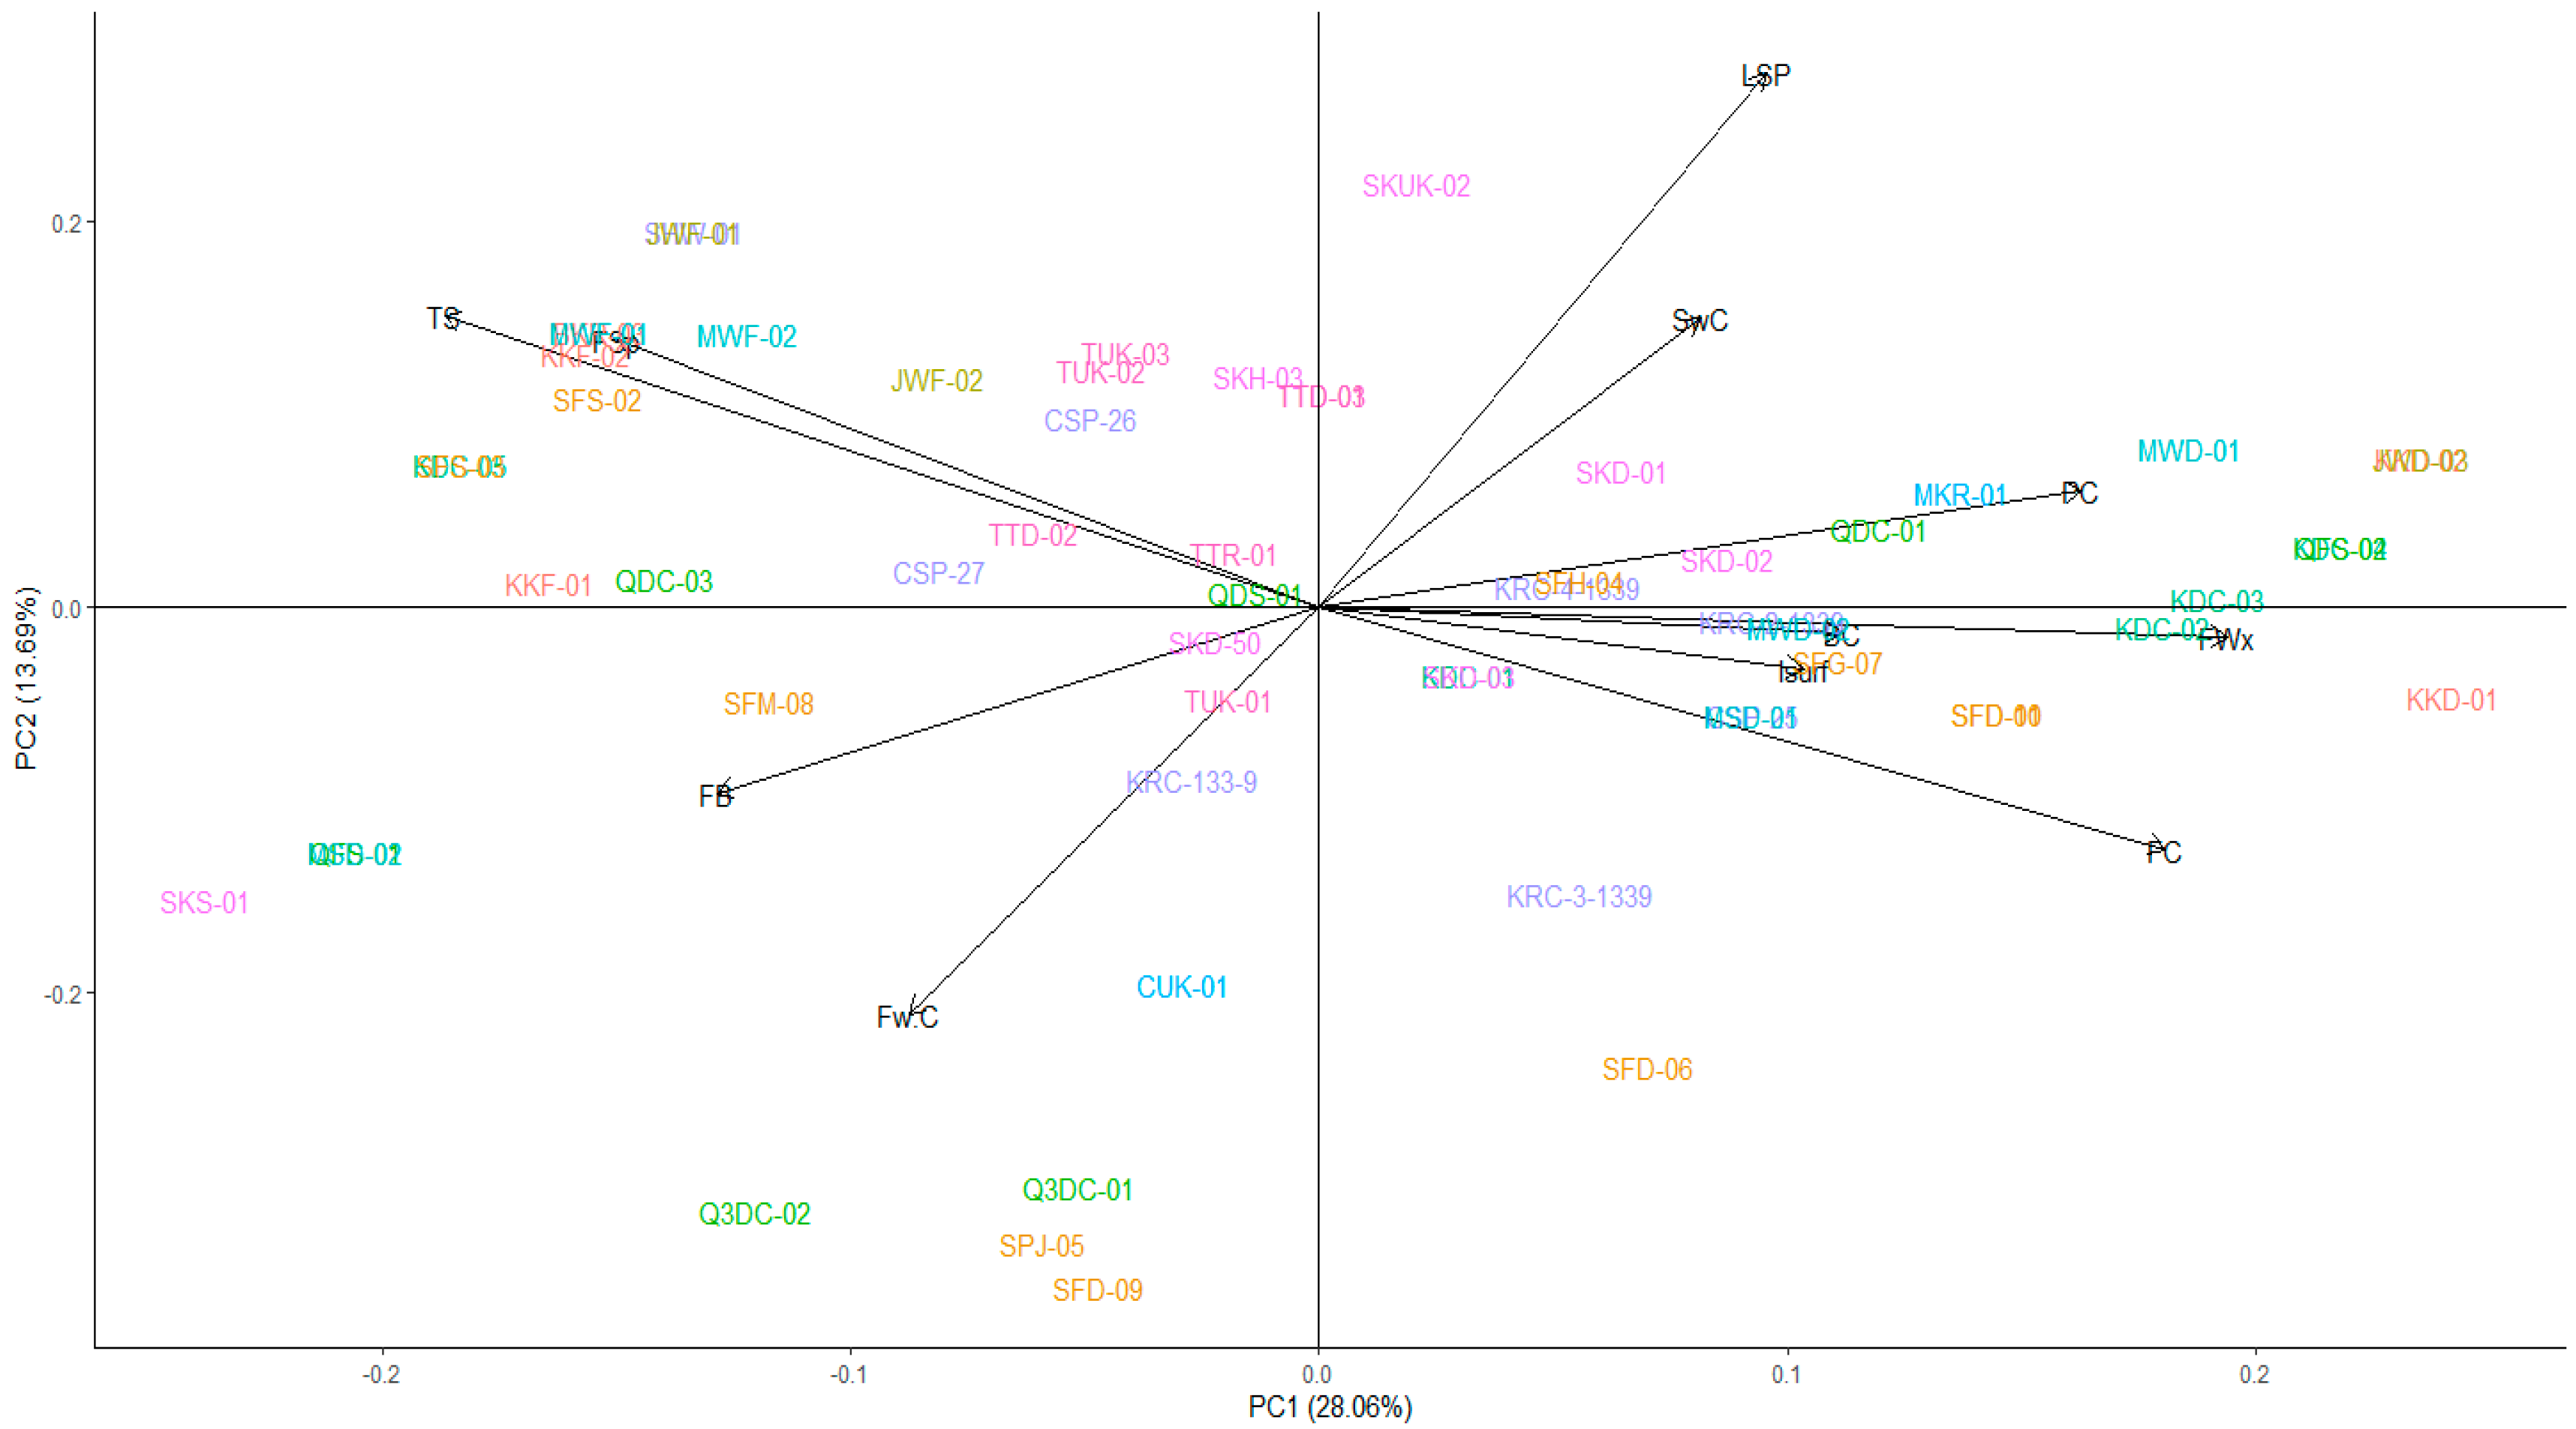
Correspondence Analysis on Phenotypic Bases

Scatter plot designed on the bases of the first two components (PC1 and PC2) distributed genotypes into all four planes and revealed a total variability of 41.75%. (Figure 4). CA grouped the genotypes based on their similarities. Thirteen accessions (SKUK-02, SKD-01, SKD-02, SFH-04, KRC-4-1339, MKR-01, QDC-01, MWD-01, JWD-02, QDC-02, KFS-04, KDC-03, and KKD-03) were placed in the top right plane due to the resemblance of traits like leaf shape, trunk wood color, and pulp color. Several genotypes like (KKF-02, MWF-01, SKD-03), (JWF-01, SHW-01), (SFS-03, KDC-05), (KRC-2-1339, MWD-02), and (SKD-03, KDC-01) were grouped together because of high similarity in qualitative traits. Eleven genotypes, including SKS-01, Q3DC-02, Q3DC-01, SPJ-05, SFD-09, CUK-01 TUK-01, SKD-50, SFM-08, QFS-01, and MSD-02, were spread in the lower left plane on the scatter plot based on similarity in fruit shape and flower color characters. Genotypes near to the center of the plot were less divergent and showed lower diversity than those (KKD-01, SKS-01, SFD-06, SFD-09, KRC-3-1339, SKUK-02, etc.) away from the central axis (Figure 3).

3.2. Polymorphism and Genetic Differentiation among Jamun Genotypes

Genetic diversity within the collected Jamun genotypes was accessed using RAPD and ISSR primers. These markers produced reproducible, robust bands, and the band scores were consistent across two repeat assessments. Detailed information regarding polymorphism and discriminatory characters in relation to RAPD markers is given in Table 6. Ten RAPD markers tested on a set of 60 Pakistani Jamun genotypes successfully analyzed genetic variation. These markers generated a total of 69 bands, varying in size between 50 and 2300 base pairs (bp), with an average of seven bands per marker (Table 6). The amplified polymorphic bands varied from 2 (OPF 2) to 8 (OPA 13) and exhibited a mean polymorphism percentage of 73.38% among the 10 RAPD primers. Primer OPA 13 and 70SP10C1 exhibited the maximum polymorphism percentage (100%), while the remaining primers showed percentages ranging from 40% (OPF 2) to 87% (OPX 4). A higher polymorphic information content (PIC) value of 0.465 was observed in 70SP10C1. The maximum mean band frequency (MBF) of 0.704 was observed in OPQ 4 (Table 6). The resolving power (RP) of the primers indicated their discriminatory potential. Primer 70SP10C1 exhibited the highest RP value of 3.781, followed by OPA 13 with a value of 3.433. On the other hand, OPF 2 displayed the lowest resolving power with a value of 0.784.
In the analysis of genetic variability using ISSR markers, seven primers consistently produced reproducible results when tested against 60 Pakistani genotypes. A total of 63 amplified products were produced employing seven ISSR markers, of which 57 were polymorphic. Among the markers, UBC 807, UBC 817, UBC-844, and UBC-864 exhibited 100% polymorphism (%Pol), while the lowest polymorphism percentage of 77.78% was observed for UBC 840. The ISSR markers showed higher PIC values (>0.400), ranging from 0.406 in UBC 864 to 0.500 in UBC 844. The major band frequencies varied widely, with a lowest of 0.475 for UBC-835 and a maximum of 0.612 for UBC-807. The average band frequency across the selected primers was 0.557. The resolving power had an average value of 3.591 in the selected seven ISSR markers (Table 6). The individual values of resolving power, total and polymorphic number of bands (TNB and NPB), amplified fragment size (AFS), and polymorphic information content (PIC) for all the selected RAPD and ISSR markers against Pakistan’s Jamun genotypes can be found in Table 6. Analysis of molecular variance was conducted to identify within- and among-population genetic diversity in Jamun genotypes based on RAPD and ISSR data (Table 7). AMOVA performed on 10 populations revealed high within-population variability (86%), while 14% of variation was observed among populations.

3.2.1. Genetic Variability Analysis among Jamun Genotypes Using RAPD and ISSR Markers

A UPGMA cluster analysis performed on Jamun genotypes from Pakistan revealed varying genetic distances among the genotypes. The maximum genetic distance of 0.155 was detected between QDS-01 and SFD-10. On the other hand, the genotypes CUK-01 and MKR-01 from Rahim Yar Khan exhibited the minimum genetic distance. The RAPD (Figure 5) grouped all genotypes in three major clusters (C1, C2, and C3). Cluster 1 (C1) consisted of 37 accessions and was further divided into two subclusters, C1A and C1B, with 21 and 16 accessions, respectively. These subclusters were mainly composed of genotypes from Sahiwal (KRC-133-9, CSP-26, CSP-27, SHW-01, KRC-2-1339, and KRC-3-1339), Bhakkar (BKR-03, KKD-01, KKD-02, KKF-01, and KKF-02), Jhang (JWF-01, JWF-02, and JWD-03), and Rahim Yar Khan (CUK-01 and MKR-01). The characteristic feature of this cluster included upright to spreading tree growth and pinkish or deep purple fruit. Cluster 2 was the smallest cluster, consisting of only 10 members. Two accessions from Mianwali (MWF-01 and MSD-02) were separated from the other members of the cluster. Cluster 3 was comprised of 13 members, primarily wild cultivars (with elliptic oblong-shaped leaves and large oblong or round-shaped fruits having either a depressed or flat base) and was divided into two subgroups.
Similarly, ISSR genetic distance-based cluster analysis revealed clear separation among the genotypes and, again, divided them into three major clusters (Figure 6). The genotypes SPJ-05 and SFH-04 from Faisalabad exhibited the maximum genetic distance value of 0.217, while the lowest distance was found between KDC-02 and CUK-01, with a value of 0.005. Cluster 1 contained 23 diverse genotypes, mainly from Faisalabad (SFS-03, SFD-10, SFD-06, and SFH-04) and Toba Tek Singh (TUK-01 and TUK-03), characterized by a spreading tree shape, elliptic oblong leaves, and oval fruit. Cluster 2 consisted of 17 genotypes, including QDC-01, KDC-01, KDC-03, KRC-2-1339, QDC-03, and SKD-02, which were separated from the others and exhibited a projected fruit base. Cluster 3 contained 20 accessions. Genotype KDC-02 from Khushab showed high similarity with CUK-01 from Rahim Yar Khan, while SHW-01 (Sahiwal) was found to be similar with SKD-03 (Sheikhupura), resulting in their placement with Cluster 3.

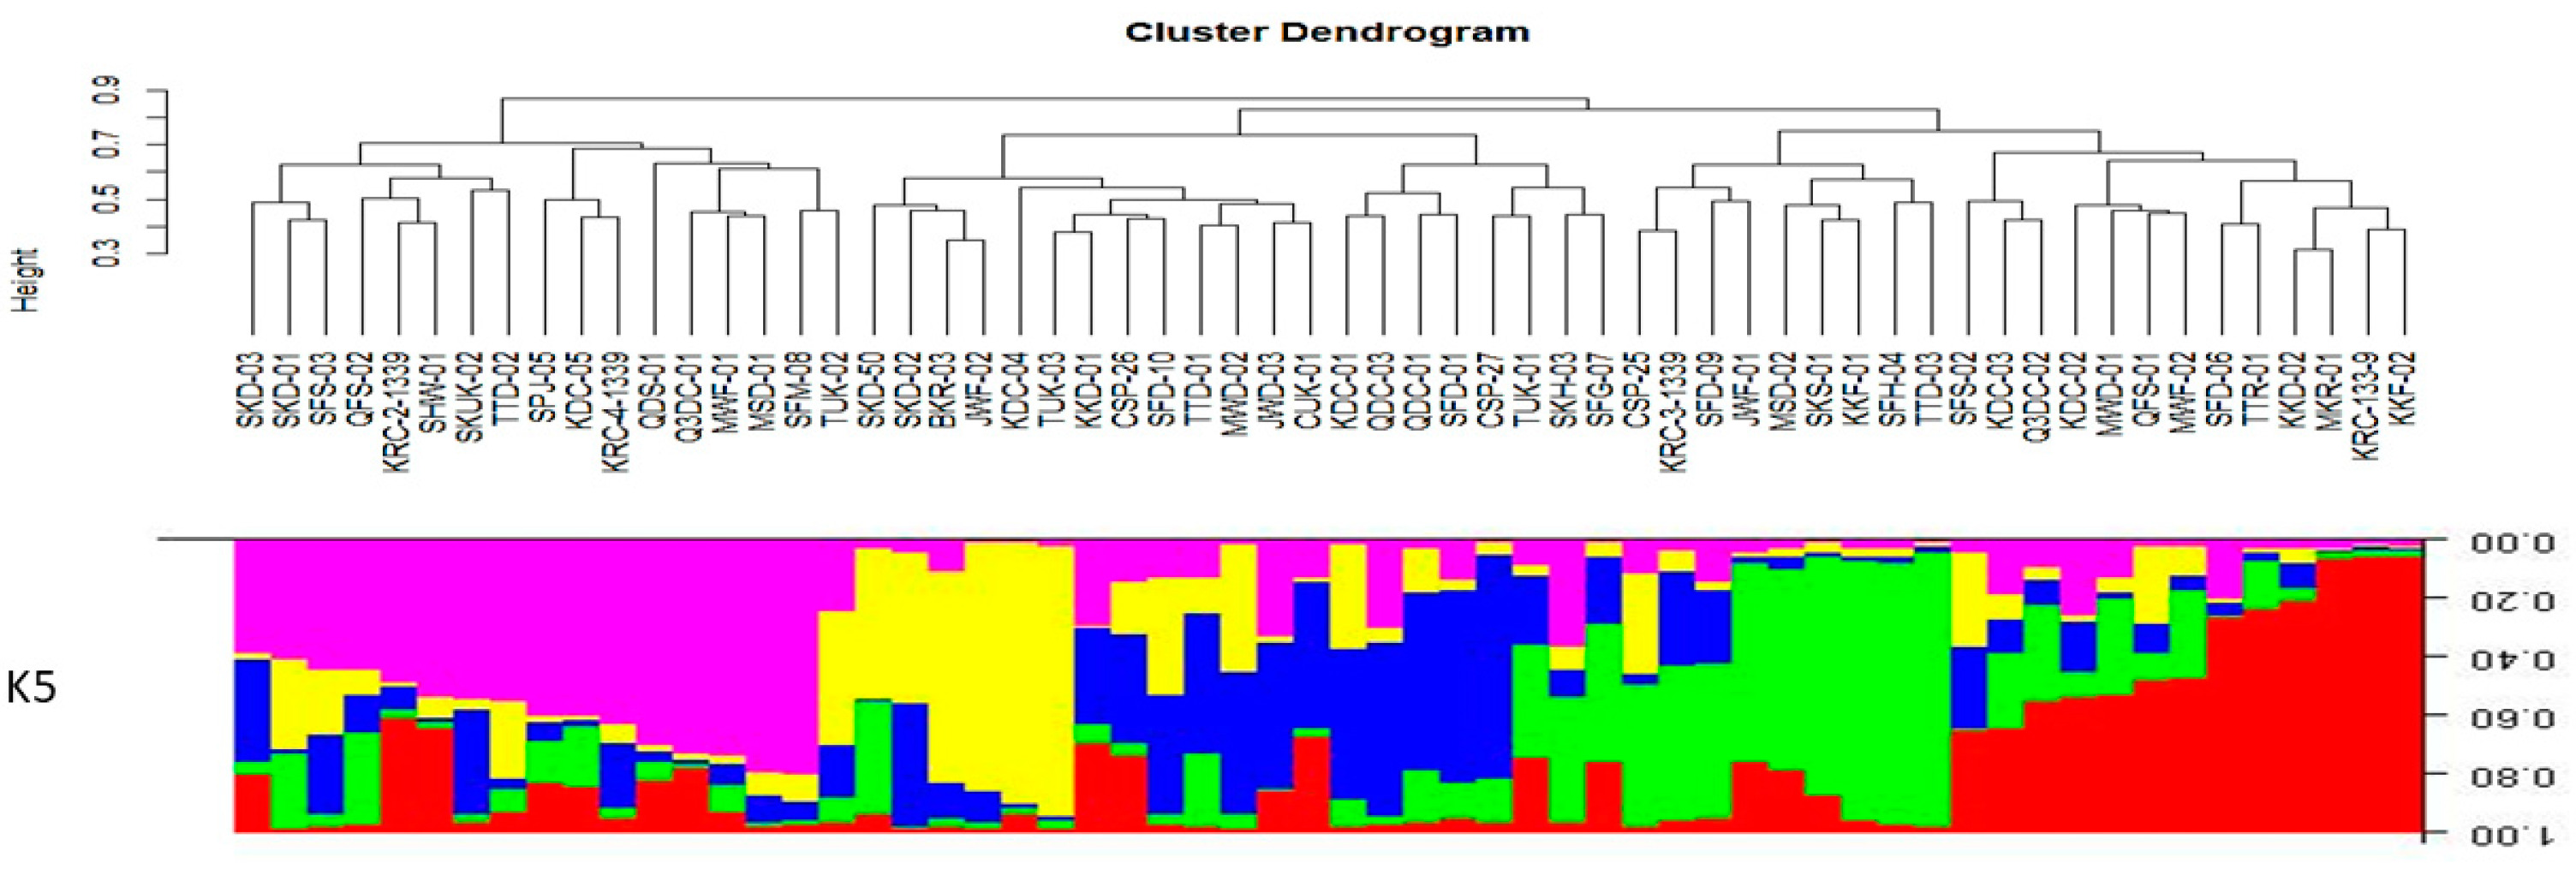
3.2.2. Population Genetic Structure

Jamun genotypes were assessed to determine the most likely number of genetic groups (K) within the collected germplasm. Using Evanno’s method, the rate of change in the log probability of the data (∆K) indicated a clear maximum at K = 5 [54]. This suggests that the 60 Pakistani genotypes could be divided into five subpopulations based on the results from these genetic markers (Figure 7). At K = 3, the genotypes were partitioned into three major clusters, with 17, 21, and 22 members in each group (Figure 7). When K = 4, in addition to the cluster identified at K = 3, a fourth group emerged, including two members from Kasur (QDC-01 and QDC-03), two from Toba Tek Singh (TUK-03 and TTD-01), and one from Mianwali, Faisalabad, and Jhang. At K = 5, there was a clear separation for 17 genotypes, representing a wild genotypes group with higher genetic diversity compared to the others. Many individuals in this group had a membership percentage (Qi) larger than 0.8 (e.g., SFH-04, SFM-08, TUK-02, KDC-04, TUK-03, KRC-133-9, KKD-01, MKR-01, KKF-02, SKS-01, KKF-01, TTD-03, and KDC-03), which was visually represented by the predominance of pink, yellow, green, and red color. Bayesian interference revealed considerable admixture within the genotypes of this group. Structure analysis indicated a random distribution of genotypes in groups with no particular geographical or area-based distinction.

3.3. Genetic Diversity Comparison between Pakistani and International S. cumini Genotypes

Additionally, a minor investigation was conducted to compare/relate Pakistan’s germplasm with 15 international Jamun genotypes obtained from the repositories of National Plant Germplasm System (GRIN-NPGS) and certified plant nurseries in the United States. For this purpose, genetic information of Pakistan and international genotypes was obtained against the same molecular markers. Pakistan’s germplasm exhibited distinct grouping from other countries in multidimensional scaling (Figure 8). Results indicated high genetic diversity among accessions of Pakistan followed by the United States and the Philippines

4. Discussion

Pakistan is known as home to several plant species [55,56]; Jamun (S. cumini) is one of them and native to Pakistan, where it is vernacularly known as “Jamun” [57]. Punjab province of Pakistan harbors rich diversity of Jamun; however, in the absence of proper identification, characterization, documentation, and management along with competition from other high-return fruit crops (mango, citrus, and guava) and burgeoning climate change, Jamun germplasm in Pakistan is under unprecedented threat [23]. Studies based on identification and characterization on phenotypic and genetic grounds are prerequisite for breeding and classification purposes. Jamun is well known as a medicinal plant with highly nutritious fruits [5]. Escalating hunger and malnutrition-like issues imply the need for a greater focus on cultivar development programs using morphological and molecular markers [35].

4.1. Phenotypic Diversity in Jamun Germplasm

Variability was observed among qualitative phenotypic characters of tree, leaf, flower, and fruit, which aligns with the work conducted by other researchers on S. cumini cultivars from different areas of India [35,58] and Sri Lanka [59]. Study revealed that Pakistan’s Jamun germplasm entails rich source of variations. According to [60,61], for morphological characters, a high coefficient of variance value (>20) indicates high diversity and significance of phenotypic markers for distinguishing variability among genotypes. Morphological identification of trees and fruits is a basic tool for cultivar identification and has been regarded as a first measure of any plant diversity [62]. Recently, effectiveness of these morphological markers has been reported in successful characterization of fruit plant germplasm of various countries like guava from India [62] and Vietnam [63], apples from Zimbabwe [64] and India [65], cashew from Brazil [66] and Benin [67], almonds from Bosnia, Herzigovina [68] and Iberian Peninsula [69], and peaches from Spain [24]. In the present study, Pakistan’s Jamun genotypes were characterized and documented on phenotypic bases that can help in identification of cultivars and selection of proper pre- and post-harvest management techniques [70]. Jamun genotypes exhibited variability in phenotypic characters of tree, leaf, flower, and fruit coupled with a strong association between phenotypic traits. Tree shape varied from upright to spreading and drooping, while fruits were of either oblong, oval elliptic, or round in shape with variation in fruit base (depressed, flat, or projected). Oblong-shaped fruits were most prominent in the studied Jamun genotypes, with discrimination of being small or big in size. The second prominent fruit shape was oval and most of the small-sized fruits were found to be oval in shape. These findings are strengthened by the work conducted by [58], who reported fruits of either oblong, oval elliptic, or round shape with variation in fruit base (depressed, flat, or projected) from India. Ref. [59] reported variation in fruit and pulp color in Jamun accessions obtained from different areas of Sri Lanka. Ref. [35] regarded morphological characters as important tools for visually analyzing difference among genotypes and found them effective in identifying Jamun genotypes. The presence of variation in phenotypic characters is indicative of genetic diversity that can help in future breeding programs [71]. Documentation of the gene pool on a phenotypic basis is the first step towards diversity estimation and selection of desired traits that can help to cater with consumer preferences and serves as a foundation for crop improvement programs [45].
Information gathered based on correlation among traits revealed an association of tree, leaf, flower, and fruit phenotypic traits (Figure 3). Ref. [72] observed correlation of upright trees with either round or oval-shaped fruits. In the present study, a strong association was witnessed among tree and fruit phenotypic characters, as drooping and spreading-shaped trees were smaller in height with an open canopy and were found producing fruits of large size with elliptic or oblong shape with either depressed (TUK-02, KKD-02, and MWF-02), flat (KDC-01, Q3DC-02, and TTD-02), or projected (CSP-26 and SKH-03) fruit base. Other characters like leaf shape, flower color, and fruit and pulp color also revealed variability and association among traits in collected germplasm. The observed correlation (Figure 3) suggested that selecting for certain tree morphologies could indirectly affect fruit characteristics. This type of information can help in streamlining breeding programs by targeting specific traits that are linked with desirable fruit characters, ultimately leading to efficient and effective cultivar improvement [45]. Correlation analysis identified key traits and revealed a relationship between traits [55]. It helps in identification of genetic resources by focusing on desired characters [73]. Correspondence analysis is a viable tool for identifying variability among qualitative phenotypic characters [50]. Previously, PCA has been used to differentiate several tree fruit species like Ziziphus mauritiana [45], Diospyros virginiana [74], and Prunus amygdalus [68] and it helped in accessing variability among accessions from diverse geographical areas. Pairwise Euclidean distance matrix was used to separate genotypes of Jamun on a phenotypic basis, which revealed high variability (>41%) and separated them based on their diverse characters. The random spread of genotypes in all four planes confirms high variability among genotypes than any geographical area, which is possible due to its spread by birds, humans, and animals [35]. In our study, the representative traits of the first principal component were related to tree and fruit morphological characters, which reflects their importance in germplasm evaluation of Jamun. Based on the size of the contribution rate, fruit and tree shape, stem color, leaf shape, and pulp color were found as primary morphological characters for identifying diversity among genotypes [75]. Jamun germplasm revealed significant diversity across various traits of tree, leaf, flower, and fruit, which describes the genetic enrichment of Pakistan’s Jamun germplasm. The strong correlation of tree and fruit traits along with variability in features provides a valuable foundation for breeding programs.

4.2. Characterization Based on Genetic Markers

Using morphological markers for plant characterization has limitations, as these characters can be influenced by environmental factors and plant age [3,27]. To overcome these limitations, genetic markers such as ISSR and RAPD have proven to be adequate for studying genetic relationships. ISSR and RAPD markers are efficient, easy to use, and do not require extensive prior knowledge of the genome [30]. They have been widely utilized for genetic characterization of several plant species [38,42,43]. RAPD primers, being dominant markers, have been successfully used for assessing genetic diversity and been mentioned by several international studies on fruit crops like grapes [76], apple [43], mango [41,77], and guava [78]. Similarly, studies employing ISSR primers have demonstrated their efficacy in identifying genetic variability in different fruit crops [38,41,79]. Recently, ref. [18] employed both RAPD and ISSR markers to characterize Jamun cultivars from India, revealing high variability among the cultivars. Previously, ref. [31] also used these dominant markers (RAPD and ISSR) for genetic studies.
In the present study, a diverse collection of Jamun genotypes was obtained from Pakistan. Collected genotypes were subjected to genetic diversity analysis and evaluation of genetic structure within and among populations and collection sites. For this purpose, a set of 10 RAPD and 7 ISSR markers were employed, generating robust bands. The obtained data were employed to access the genetic variability and pattern of genetic structure in Pakistan’s Jamun germplasm. Previous studies on DNA polymorphism in S. cumini wild and cultivated genotypes from India have reported varying percentages of DNA polymorphism depending on the primer used [18,35]. Previously, researchers [3,44,48,80] observed discriminatory characteristics of polymorphism (PIC, number of polymorphic bands, etc.) among Jamun genotypes from India using either RAPD or ISSR markers. Recently, ref. [18] characterized only 15 Indian S. cumini accessions from the northwestern Indian Himalayas using RAPD and ISSR markers and observed a varied number of polymorphic bands among genotypes. Resolving power (RP) and polymorphism information content (PIC) values are measures of markers’ discriminatory power [31] and values reported by earlier studies on Jamun [3,28] and other fruit crops like peach [38], guava [76], and apple [79] are also in contrast with our current investigation (Table 6). Our study is the first of its kind and no such comprehensive genetic characterization based on molecular markers has been conducted on S. cumini plant in Pakistan. The average good PIC value for dominant markers (ISSR and RAPD) reported by [81] is mentioned as between 0 and 0.5. Our findings aligned with the outcomes of [34,64]. Currently, ISSR markers were found more effective in uncovering discriminatory characters (percent polymorphism, resolving power, and PIC) in Jamun (S. cumini) genotypes than RAPD markers (Table 6), which complies with the findings of [31,82] Moreover, practicing ISSR technique was found to be more reproducible and effective for obtaining a composite marker pattern. Ref. [18] also reported ISSR markers as more effective than RAPD markers in differentiating closely related species. The present study revealed complementary strength of RAPD and ISSR markers in providing comprehensive genetic characterization of Jamun genotypes. Our results are in confirmation with the findings of [58,62].

4.3. Genetic Relationships

Information on the genetic relationship of genotypes is valuable for planning breeding programs and improving cultivars [83]. Genetic distance coefficient provides quantitative insight into the genetic relationship and diversity among genotypes. Nei’s genetic distance is a well known and widely accepted method in population genetics [31], which gives a comprehensive assessment of genetic variation [41]. Nei’s genetic distance between Pakistani genotypes ranged from 0.155 to 0.049 and 0.217 to 0.005 in the case of RAPD and ISSR markers, respectively. These outcomes indicate the competence of both markers in establishing the genetic relationship among the genotypes. The present study revealed high genetic diversity among genotypes compared to within the population, which may be due to large-scale cultivation and availability of diverse gene pools for this cross-pollinated plant. Ref. [31] reported distance matrix as an efficient method for determining the relationship among genotypes with limited genetic relatedness. Ref. [35] conducted a study on Jamun genotypes from India using advanced molecular techniques and observed high variability among genotypes compared to any geographical area, which confirms random spread of Jamun by birds, humans, and animals [35]. Genotypes such as SFD-10, SFD-09, KDC-02, SKD-50, KDC-03, SFD-01, SFM-08, TUK-01, TUK-03, SPJ-05, SFH-04, and CSP-26 showed higher genetic distance from other genotypes. The high genetic diversity observed among Pakistani germplasm contrasts the expectation for a cross-pollinated plant cultivated through seeds [20,28].
Dendrograms generated from RAPD and ISSR markers (Figure 5 and Figure 6) based on dissimilarity clearly showed distinct major and minor clusters. Both types of markers indicate clear and random separation of genotypes in UPGMA cluster analysis. Among the germplasm from Pakistan, genotypes from Sahiwal (KRC-133-9, KRC-4-1339, KRC-2-1339, and CSP-26), Kasur (QDS-01, QFS-02, and QDC-03), Faisalabad (SFM-08, SFS-03, SFD-01, and SPJ-05), and Toba Tek Singh (TTD-03, TUK-02, and TUK-01) showed high diversity. Clustering conducted by both (RAPD and ISSR) marker systems unambiguously discriminated Jamun (S. cumini) genotypes into homogeneous clusters, revealing similar potential for phylogenetic relationships with a moderate amount of similarity and few differences among results of both markers. Differences in grouping of genotypes within the groups can be explained as different marker techniques targeting different portions of the genome [83]. Differences may also be attributed to the level of polymorphism detected, reinforcing the importance of number of loci and their coverage of the overall genome for obtaining reliable estimates of genetic relationships among cultivars [82]. The pairwise Mantel test illustrated a positive correlation between markers, with an r value of 0.421 and p = 0.01. This indicates a good association between the results obtained from ISSR and RAPD markers in discriminating S. cumini genotypes. Furthermore, analysis of molecular variance for 60 Jamun genotypes revealed that 86% of the variation was attributed to differences among genotypes, while 14% was due to differences based on collection sites (Table 7). AMOVA indicated less genetic differences among populations; similar results were also reported by [31,35]. This supports the notion of a random spread of diversity among studied genotypes. In previous studies on genetic diversity of fruit crops, mango [77,84] and apple [79] determined the value of within- and among-population genetic diversity with the help of AMOVA. Although a few studies were conducted before to investigate the diversity of S. cumini genotypes [3,35,44,48], none was on such a great level. To obtain a clearer picture of the relationships between the evaluated S. cumini genotypes, a model-based population structure analysis (Figure 7) was conducted. This analysis confirmed the distinction between the examined genotypes and confirmed the grouping pattern into five distinct clusters of genotypes. This confirms the reliability of the analysis and highlights diversity of the germplasm. Hierarchical STRUCTURE analysis, which has been employed in many genetic variability studies [31,35], was also used in the present investigation to gain a deeper understanding of pedigree relationships. Furthermore, Pakistan’s Jamun germplasm was compared with accessions of the United States, the Philippines, and Indonesia. Pakistan’s germplasm exhibited distinct grouping from other countries revealing richness in diversity, which highlights the requirement for conservation, breeding, and improvement strategies. High genetic diversity without geographical constraints contrasts the expectation for a cross-pollinated plant cultivated through seeds [20,28]. Accessions of the Philippines, Indonesia, and the United States revealed relatedness, which is consistent with the historic introduction of S. cumini fruit trees into the United States through migration and importation of plants from the Philippines and Indonesia in the 1920s [1]. This finding highlights the reason for the low genetic distance between the collections from the United States, Philippines, and Indonesia. The smaller gene pool and cultivation constraints of Jamun also contributed to the low genetic distance between international collection. The results from this study indicate high genetic diversity and significant polymorphism among Pakistan’s S. cumini germplasm based on phenotypic and molecular markers.
This study documented the Jamun gene pool of Pakistan coupled with identified and confirmed diverse elite cultivars on a phenotypic and genetic basis. The findings can serve as fundamental for future breeding programs. Phenotypic and genetic information of the gene pool can help in marker-assisted selection (MAS) and development of core germplasm with high agronomic and nutritional value. Future work could focus on genome-wide association studies (GWAS) and single-nucleotide polymorphism (SNP) discovery, which can enhance understanding of structural and evolutionary history.

5. Conclusions

This study highlighted that the characters related to plant phenotypic traits like tree and fruit shape, stem color, and fruit and pulp color are helpful for quick and reliable discrimination of Jamun cultivars. Qualitative characters of Jamun (S. cumini) plant have been used to describe and identify cultivars. RAPD and ISSR primers, being dominant markers, offer several advantages in establishing genetic distances and have proved to be effective for accessing genetic diversity among Jamun cultivars. To the authors’ knowledge, there are no documented reports on the use of genetic markers for the characterization of S. cumini genotypes at such a comprehensive level from this region. This study is the first of its kind and has successfully identified and molecularly classified Pakistani genotypes. Several genotypes (SFD-10, SFD-09, KDC-02, SKD-50, KDC-03, SFD-01, SFM-08, TUK-01, TUK-03, SPJ-05, SFH-04, and CSP-26) have been identified as highly distinct and promising, which can aid breeders in molecular-marker-assisted breeding and better utilization of the germplasm. The outcomes of this investigation provide valuable insights for the improvement of fruit quality and other characteristics of S. cumini genotypes. Further, there is potential for the development of high-yielding varieties by selecting diverse parents for crossing based on phenotypic and molecular diversity information obtained from the present study. This study emphasizes the need for in-depth molecular characterization of S. cumini populations using a wide range of molecular markers to decipher their genetic structure. This information can be valuable for the better utilization of this highly nutritious and medicinal plant in various industries. Overall, this study highlights the significance of genetic diversity analysis and its potential applications in improving Jamun genotypes for desired traits.

Author Contributions

Conceptualization, S.U., S.A.N., and W.S.; Formal analysis, S.U. and S.P.; Investigation, S.U., A.R.S., and S.L.; Methodology, S.U., R.M., and S.I.; Project administration, S.U. and M.J.J.; Resources, M.J.J., Z.D., R.M. and S.P.; Supervision, M.J.J. and Z.D.; Validation, Z.D., N.S., I.A.K., and W.S.; Visualization, S.U. and Z.D.; Writing—original draft, S.U.; Writing—review and editing, Z.D., S.A.N., and W.S. All authors have read and agreed to the published version of the manuscript.

Funding

The present research work was funded through Ph.D. Fellowship Program by Office of the Research Innovation and Commercialization (ORIC), University of Agriculture, Faisalabad and by Higher Education Commission (HEC) Pakistan under International Research Support Initiative (IRSIP) Program. These funding opportunities were awarded to the first author.

Data Availability Statement

All data relevant to this manuscript can be obtained by contacting the corresponding author.

Acknowledgments

The institutional support of Gulf Coast Research and Education Center (GCREC), University of Florida, US, and University of Agriculture, Faisalabad, is highly acknowledged with appreciation. Furthermore, we extend our deepest gratitude to United States Department of Agriculture–National Plant Germplasm System (USDA-NPGS) for providing plant material.

Conflicts of Interest

The authors declare no conflicts of interest.

References

  1. Nair, K. The Genus Syzygium: Syzygium cumini and Other Underutilized Species; CRC Press: Boca Raton, FL, USA, 2017. [Google Scholar] [CrossRef]
  2. Parnell, J.A.N.; Craven, L.A.; Biffin, E. Matters of Scale: Dealing with One of the Largest Genera of Angiosperms. In Reconstructing the Tree of Life: Taxonomy and Systematics of Species Rich Taxa; CRC Press LLC: Boca Raton, FL, USA, 2007; ISBN 0849395798. [Google Scholar]
  3. Gajera, H.P.; Gevariya, S.N.; Patel, S.V.; Golakiya, B.A. Nutritional Profile and Molecular Fingerprints of Indigenous Black Jamun (Syzygium cumini L.) Landraces. J. Food Sci. Technol. 2018, 55, 730–739. [Google Scholar] [CrossRef] [PubMed]
  4. Rizvi, M.K.; Rabail, R.; Munir, S.; Inam-Ur-Raheem, M.; Qayyum, M.M.N.; Kieliszek, M.; Hassoun, A.; Aadil, R.M. Astounding Health Benefits of Jamun (Syzygium cumini) toward Metabolic Syndrome. Molecules 2022, 27, 7184. [Google Scholar] [CrossRef] [PubMed]
  5. Tak, Y.; Kaur, M.; Jain, M.C.; Samota, M.K.; Meena, N.K.; Kaur, G.; Kumar, R.; Sharma, D.; Lorenzo, J.M.; Amarowicz, R. Jamun Seed: A Review on Bioactive Constituents, Nutritional Value and Health Benefits. Pol. J. Food Nutr. Sci. 2022, 72, 211–228. [Google Scholar] [CrossRef]
  6. Ghosh, P.; PRadhaN, R.C.; Mishra, S.; Patel, A.S.; Kar, A. Physicochemical and Nutritional Characterization of Jamun (Syzygium cumini). Curr. Res. Nutr. Food Sci. J. 2017, 5, 25–35. [Google Scholar] [CrossRef]
  7. Qamar, M.; Akhtar, S.; Ismail, T.; Wahid, M.; Abbas, M.W.; Mubarak, M.S.; Yuan, Y.; Barnard, R.T.; Ziora, Z.M.; Esatbeyoglu, T. Phytochemical Profile, Biological Properties, and Food Applications of the Medicinal Plant Syzygium cumini. Foods 2022, 11, 378. [Google Scholar] [CrossRef]
  8. Jagetia, G.C. A review on the role of Jamun, Syzygium cumini Skeels in the treatment of diabetes. Int. J. Complement. Altern. Med. 2018, 11, 91–95. [Google Scholar] [CrossRef]
  9. Mulkalwar, S.; Kulkarni, V.; Deshpande, T.; Bhide, H.; Patel, A.; Tilak, A.V. Antihyperglycemic Activity of Syzygium cumini (Jamun) in Diabetic Rats. J. Pharm. Res. Int. 2021, 33, 12–19. [Google Scholar] [CrossRef]
  10. Agarwala, P.; Gaurb, P.K.; Tyagia, N.; Purib, D.; Kumarc, N.; Kumard, S.S. An Overview of Phytochemical, Therapeutic, Pharmacological and Traditional Importance of Syzygium cumini. Asian J. Pharmacogn. 2019, 3, 5–17. [Google Scholar]
  11. Syama, H.P.; Arya, A.D.; Dhanya, R.; Nisha, P.; Sundaresan, A.; Jacob, E.; Jayamurthy, P. Quantification of Phenolics in Syzygium cumini Seed and Their Modulatory Role on Tertiary Butyl-Hydrogen Peroxide-Induced Oxidative Stress in H9c2 Cell Lines and Key Enzymes in Cardioprotection. J. Food Sci. Technol. 2017, 54, 2115–2125. [Google Scholar] [CrossRef]
  12. Masaenah, E.; Elya, B.; Setiawan, H.; Fadhilah, Z.; Wediasari, F.; Nugroho, G.A.; Mozef, T. Antidiabetic Activity and Acute Toxicity of Combined Extract of Andrographis Paniculata, Syzygium cumini, and Caesalpinia Sappan. Heliyon 2021, 7, e08561. [Google Scholar] [CrossRef]
  13. Khalique, A.; Rauf, A. An Overview of Jamun (Eugenia jambolana Linn): A Traditional Multipotential Drug. Indian J. Unani Med. IX 2016, 9, 71–75. [Google Scholar]
  14. Chagas, V.T.; França, L.M.; Malik, S.; Paes, A.M.d.A. Syzygium cumini (L.) Skeels: A Prominent Source of Bioactive Molecules against Cardiometabolic Diseases. Front. Pharmacol. 2015, 6, 259. [Google Scholar] [CrossRef] [PubMed]
  15. Sarvade, S.; Gautam, D.S.; Bhalawe, S.; Bisen, P.K. An Overview of Potential Multipurpose Agroforestry Tree Species, Syzygium cuminii (L.) Skeels in India. J. Appl. Nat. Sci. 2016, 8, 1714–1719. [Google Scholar] [CrossRef]
  16. Madani, B.; Mirshekari, A.; Yahia, E.M.; Golding, J.B.; Hajivand, S.; Dastjerdy, A.M. Jamun (Syzygium cumini L. Skeels): A Promising Fruit for the Future. Hortic. Rev. (Am. Soc. Hortic. Sci). 2021, 48, 275–306. [Google Scholar] [CrossRef]
  17. Tewari, S.K.; Nainwal, R.C.; Singh, D. Potential of Syzygium cumini for Biocontrol and Phytoremediation. In The Genus Syzygium; CRC Press: Boca Raton, FL, USA, 2017; pp. 237–254. ISBN 1315118777. [Google Scholar] [CrossRef]
  18. Sharma, V.K.; Sharma, D.; Sharma, R.; Sharma, S.D.; Dhiman, K.; Murkute, A.A. Morpho-Molecular Exploration and Selection of Elite Genotypes from Indigenous Syzygium cumini L. Skeels (Jamun) Diversity of North-Western Indian Himalayas. Plant Genet. Resour. 2023, 21, 312–322. [Google Scholar] [CrossRef]
  19. Babu, K.D.; Patel, R.K.; Yadav, D.S. Comparative Evaluation of Guava Selections under North Eastern Region of India. Acta Hortic. 2007, 735, 99–103. [Google Scholar] [CrossRef]
  20. Gajera, H.P.; Gevariya, S.N.; Hirpara, D.G.; Patel, S.V.; Golakiya, B.A. Antidiabetic and Antioxidant Functionality Associated with Phenolic Constituents from Fruit Parts of Indigenous Black Jamun (Syzygium cumini L.) Landraces. J. Food Sci. Technol. 2017, 54, 3180–3191. [Google Scholar] [CrossRef]
  21. Soh, W.K. Taxonomy of Syzygium. In The Genus Syzygium: Syzygium cumini and Other Underutilized Species; CRC Press: Boca Raton, FL, USA, 2017; pp. 1–5. [Google Scholar] [CrossRef]
  22. Raza, A.; Ali, M.U.; Nisar, T.; Qasrani, S.A.; Hussain, R.; Sharif, M.N. Proximate Composition of Jamun (Syzygium cumini) Fruit and Seed. Digestion 2015, 15, 1221–1223. [Google Scholar]
  23. ud Din, S.; Jaskani, M.J.; Naqvi, S.A.; Awan, F.S. Diversity and Divergence in Domesticated and Wild Jamun (Syzygium cumini) Genotypes of Pakistan. Sci. Hortic. 2020, 273, 109617. [Google Scholar] [CrossRef]
  24. Mas-Gómez, J.; Cantín, C.M.; Moreno, M.Á.; Martínez-García, P.J. Genetic Diversity and Genome-Wide Association Study of Morphological and Quality Traits in Peach Using Two Spanish Peach Germplasm Collections. Front. Plant Sci. 2022, 13, 854770. [Google Scholar] [CrossRef]
  25. Gerrano, A.S.; Van Rensburg, W.S.J.; Mavengahama, S.; Bairu, M.; Venter, S.; Adebola, P.O. Qualitative Morphological Diversity of Amaranthus Species. J. Trop. Agric. 2017, 55, 12–20. [Google Scholar]
  26. Azad, R.; Ranawaka, R.; Senanayake, G.; Kumara, K.L.W.; Pushpakumara, D.; Wijesinghe, K.G.G.; Geekiyanage, S. Morphological Variation of Cinnamon (Cinnamomum verum Persl) Germplasm in Matara District of Sri Lanka. Int. J. Minor Fruits Med. Aromat. Plants 2016, 2, 6–14. [Google Scholar]
  27. Di Guardo, M.; Farneti, B.; Khomenko, I.; Modica, G.; Mosca, A.; Distefano, G.; Bianco, L.; Troggio, M.; Sottile, F.; La Malfa, S. Genetic Characterization of an Almond Germplasm Collection and Volatilome Profiling of Raw and Roasted Kernels. Hortic. Res. 2021, 8, 27–46. [Google Scholar] [CrossRef] [PubMed]
  28. Ahmad, I.; Bhagat, S.; Simachalam, P.; Srivastava, R.C. Molecular Characterization of Syzygium cuminii (Wild Jamun) from A&N Islands. Indian J. Hortic. 2012, 69, 306–311. [Google Scholar]
  29. Khachtib, Y.; Zinelabidine, L.H.; Bouda, S.; Hamdali, H.; Hammada, S.; Haddioui, A. Genetic Characterization of Cultivated Apple (Malus x domestica Borkh.) in Morocco Using Microsatellite (SSR) Markers. Ecol. Genet. Genom. 2022, 23, 100122. [Google Scholar] [CrossRef]
  30. Hiremath, C.; Philip, R.; Sundaresan, V. Molecular Characterization of India Ginseng Withania somnifera (L) Using ISSR Markers. Mol. Biol. Rep. 2021, 48, 3971–3977. [Google Scholar] [CrossRef] [PubMed]
  31. Mir, M.A.; Mansoor, S.; Sugapriya, M.; Alyemeni, M.N.; Wijaya, L.; Ahmad, P. Deciphering Genetic Diversity Analysis of Saffron (Crocus sativus L.) Using RAPD and ISSR Markers. Saudi J. Biol. Sci. 2021, 28, 1308–1317. [Google Scholar] [CrossRef] [PubMed]
  32. Soliman, E.R.S.; El-Shazly, H.H.; Börner, A.; Badr, A. Genetic Diversity of a Global Collection of Maize Genetic Resources in Relation to Their Subspecies Assignments, Geographic Origin, and Drought Tolerance. Breed. Sci. 2021, 71, 313–325. [Google Scholar] [CrossRef]
  33. Venkatesan, J.; Ramu, V.; Sethuraman, T.; Sivagnanam, C.; Doss, G. Molecular Marker for Characterization of Traditional and Hybrid Derivatives of Eleusine coracana (L.) Using ISSR Marker. J. Genet. Eng. Biotechnol. 2021, 19, 1–12. [Google Scholar] [CrossRef]
  34. Tao, J.; Qiao, G.; Wen, X.-P.; Gao, G.-L.; Liu, T.; Peng, Z.-J.; Cai, Y.-Q.; Chen, N.; Yan, F.-X.; Zhang, B.-X. Characterization of Genetic Relationship of Dragon Fruit Accessions (Hylocereus spp.) by Morphological Traits and ISSR Markers. Sci. Hortic. 2014, 170, 82–88. [Google Scholar] [CrossRef]
  35. Singh, A.; Verma, S.K.; Prasad, G.; Kumar, A.; Sharma, P.C.; Singh, A.K. Elucidating Genetic Diversity and Population Structure in Jamun [Syzygium cumini L.(Skeels)] Using Morpho-Physiological Traits and CAAT Box-Derived Polymorphism. S. Afr. J. Bot. 2022, 151, 454–465. [Google Scholar] [CrossRef]
  36. Bashir, M.H.; AM, N.M.S.; Khan, A.Z.; Aziz, S.; Ullah, F.; Qasim, M. Characterization and Advancement of Microsatellite (SSR) Markers for Various Stresses in Wheat. Int. J. Agric. Biosci. 2022, 11, 8. [Google Scholar] [CrossRef]
  37. Luz, G.C.; Strioto, D.K.; Mangolin, C.A.; Maria, d.F. ISSR Markers to Assess Genetic Diversity of Cultivated Populations from Artificial Selection of Stevia rebaudiana (Bert.) Bertoni. Breed. Sci. 2020, 70, 508–514. [Google Scholar] [CrossRef] [PubMed]
  38. Demirel, S.; Pehluvan, M.; Aslantaş, R. Evaluation of Genetic Diversity and Population Structure of Peach (Prunus persica L.) Genotypes Using Inter-Simple Sequence Repeat (ISSR) Markers. Genet. Resour. Crop Evol. 2024, 71, 1301–1312. [Google Scholar] [CrossRef]
  39. Talang, H.; Nandha, A.; Rekha, A.; Ravishankar, K.V.; Talukdar, M. Identification of Nucellar and Zygotic Seedlings of Jamun (Syzygium cumini Skeels.) Using RAPD Marker. J. Pharmacogn. Phytochem. 2022, 11, 101–103. [Google Scholar]
  40. Chen, M.; He, X.; Zhang, Y.; Lu, T.; Yang, J.; Huang, X.; Zhu, J.; Yu, H.; Luo, C. Genetic Diversity and Relationship Analyses of Mango (Mangifera indica L.) Germplasm Resources with ISSR, SRAP, CBDP and CEAP Markers. Sci. Hortic. 2022, 301, 111146. [Google Scholar] [CrossRef]
  41. Jena, R.C.; Chand, P.K. Multiple DNA Marker-Assisted Diversity Analysis of Indian Mango (Mangifera indica L.) Populations. Sci. Rep. 2021, 11, 10345. [Google Scholar] [CrossRef] [PubMed]
  42. Mariano, L.C.; Zchonski, F.L.; da Silva, C.M.; Da-Silva, P.R. Genetic Variability in a Brazilian Apple Germplasm Collection with Low Chilling Requirements. PeerJ 2019, 6, e6265. [Google Scholar] [CrossRef] [PubMed]
  43. Giancarla, V.; Madoşă, E.; Adriana, C.; Ciulca, S.; Camen, D.; Mihaela, M.; Carmen, L. Genetic Diversity of Some Apple Genotypes from West Part of Romania Based on ISSR Markers. J. Hortic. For. Biotechnol. 2021, 25, 64–68. [Google Scholar]
  44. Khan, S.; Vaishali; Sharma, V. Genetic Differentiation and Diversity Analysis of Medicinal Tree Syzygium cumini (Myrtaceae) from Ecologically Different Regions of India. Physiol. Mol. Biol. Plants 2010, 16, 149–158. [Google Scholar] [CrossRef]
  45. Sharif, N.; Jaskani, M.J.; Abbas Naqvi, S.; Awan, F.S. Exploitation of Diversity in Domesticated and Wild Ber (Ziziphus mauritiana Lam.) Germplasm for Conservation and Breeding in Pakistan. Sci. Hortic. 2019, 249, 228–239. [Google Scholar] [CrossRef]
  46. Mahajan, R.K.; Gangopadhyay, K.K.; Gunjeet Kumar, D.V.K.; Srivastava, U.; Gupta, P.N. Minimal Descriptors of Agrihorticultural Crops; Part III fruit Crops; National Bureau of Plant Genetic Resources: New Delhi, India, 2002. [Google Scholar]
  47. Rasul, K.S.; Grundler, F.M.W.; Tahir, A. Genetic Diversity and Population Structure Assessment of Iraqi Tomato Accessions Using Fruit Characteristics and Molecular Markers. Hortic. Environ. Biotechnol. 2022, 63, 523–538. [Google Scholar] [CrossRef]
  48. Shakya, R.; Siddiqui, S.A.; Srivatawa, N.; Bajpai, A. Molecular Characterization of Jamun (Syzygium cumini L. Skeels) Genetic Resources. Int. J. Fruit Sci. 2010, 10, 29–39. [Google Scholar] [CrossRef]
  49. Singh, J.P.; Singh, A.K.; Bajpai, A.; Ahmad, I.Z. Comparative Analysis of DNA Polymorphisms and Phylogenetic Relationships among Syzygium cumini Skeels Based on Phenotypic Characters and RAPD Technique. Bioinformation 2014, 10, 201. [Google Scholar] [CrossRef]
  50. Greenacre, M. Correspondence Analysis in Practice; Chapman and Hall/CRC: Boca Raton, FL, USA, 2017; ISBN 1315369982. [Google Scholar] [CrossRef]
  51. Abdi, H.; Béra, M. Correspondence Analysis. In Encyclopedia of Social Network Analysis and Mining; Springer: New York, NY, USA, 2014. [Google Scholar] [CrossRef]
  52. Pritchard, J.K.; Stephens, M.; Donnelly, P. Inference of Population Structure Using Multilocus Genotype Data. Genetics 2000, 155, 945–959. [Google Scholar] [CrossRef]
  53. Earl, D.A.; VonHoldt, B.M. STRUCTURE HARVESTER: A Website and Program for Visualizing STRUCTURE Output and Implementing the Evanno Method. Conserv. Genet. Resour. 2012, 4, 359–361. [Google Scholar] [CrossRef]
  54. Evanno, G.; Regnaut, S.; Goudet, J. Detecting the Number of Clusters of Individuals Using the Software STRUCTURE: A Simulation Study. Mol. Ecol. 2005, 14, 2611–2620. [Google Scholar] [CrossRef] [PubMed]
  55. Ali, M.A.; Iqbal, M.S.; Ahmad, K.S.; Akbar, M.; Mehmood, A.; Hussain, S.A.; Arshad, N.; Munir, S.; Masood, H.; Ahmad, T. Plant Species Diversity Assessment and Monitoring in Catchment Areas of River Chenab, Punjab, Pakistan. PLoS ONE 2022, 17, e0272654. [Google Scholar] [CrossRef]
  56. Shinwari, M.I.; Shinwari, M.I. Botanical Diversity in Pakistan; Past Present and Future. World Environ. 2010, 1, 85–104. [Google Scholar]
  57. Muhammad, S.; Sheikh, S.A.; Nizamani, S.M.; Bhanger, M.I.; Imran, A.; Ejaz, A. A Study on the Determination of Mineral Elements in Jamun Fruit (Eugenia jambolana) Products. Pak. J. Nutr. 2012, 11, 181–186. [Google Scholar] [CrossRef]
  58. Devi, C.A.; Sharma, G.L.; Singh, P.; Panigrahi, H.K.; Sharma, H.G.; Nag, J.L.; Paikra, P.S. Studies on Variability in Fruit Characters of Jamun (Syzygium cumini Skeels) Genotypes. Pharma Innov. J. 2019, 8, 391–393. [Google Scholar]
  59. Dissanayake, P.K.; Wekumbura, W.G.C.; Wijeratne, A.W.; Wijesundara, D.S.A. Morphological Characterization, Antioxidant Capacity and Diversity of Syzygium cumini Trees from Sri Lanka. Hortic. Plant J. 2022, 8, 53–67. [Google Scholar] [CrossRef]
  60. Guo, Q.; Liu, J.; Li, J.; Cao, S.; Zhang, Z.; Zhang, J.; Zhang, Y.; Deng, Y.; Niu, D.; Su, L. Genetic Diversity and Core Collection Extraction of Robinia pseudoacacia L. Germplasm Resources Based on Phenotype, Physiology, and Genotyping Markers. Ind. Crops Prod. 2022, 178, 114627. [Google Scholar] [CrossRef]
  61. Khadivi, A.; Mirheidari, F.; Moradi, Y.; Paryan, S. Morphological Variability of Wild Pomegranate (Punica granatum L.) Accessions from Natural Habitats in the Northern Parts of Iran. Sci. Hortic. 2020, 264, 109165. [Google Scholar] [CrossRef]
  62. Nikhil, H.N.; Goswami, A.K.; Singh, S.K.; Kumar, C.; Goswami, S.; Singh, R.; Bharadwaj, C.; Maurya, N.K. Assessment of Morpho-Genetic Diversity of Guava (Psidium guajava) Hybrids and Genotypes. Indian J. Agric. Sci. 2021, 91, 1640–1645. [Google Scholar] [CrossRef]
  63. Hien, P.T.H.I.T.H.U.; LE Thi, T.C.; Hang, V.U.T.H.I.T. Genetic Diversity of Guava Varieties (Psidium guajava L.) Based on Morphology and ISSR Molecular Markers. Biodivers. J. Biol. Divers. 2024, 25, 1037–1045. [Google Scholar] [CrossRef]
  64. Mbovora, S.M.; Musvosvi, C.; Gasura, E. Morphological Diversity among Accessions of Apple Tree (Malus× domestica Borkh). Adv. Agric. 2021, 2021, 7705856. [Google Scholar] [CrossRef]
  65. Dar, J.A.; Wani, A.A.; Dhar, M.K. Assessment of Apple (Malus× domestica Bark.) Germplasm of Kashmir Using RAPD Markers. Int. J. Fruit Sci. 2020, 20, 635–645. [Google Scholar] [CrossRef]
  66. Carvalho-Junior, G.d.N.C.; Costa, M.F.; Nunes, J.A.R.; de Almeida Lopes, Â.C.; Ferreira-Gomes, R.L. Estimation of the Extent of Phenotypic Diversity among Cashew (Anacardium occidentale L.) Genotypes Based on Agro-Morphological and Physicochemical Traits. Plant Genet. Resour. 2022, 20, 230–238. [Google Scholar]
  67. N’Djolossè, K.; Adoukonou-Sagbadja, H.; Gbèmavo, C.D.S.J.; Kodjo, S.; Badou, A.; Maliki, R.; Adjovi, N.R.A. Agro-Morphological Characterization of Preselected Cashew (Anacardium occidentale L.) Mother Trees in Benin Farmer’s Plantations. J. Agric. Environ. Int. Dev. 2019, 113, 17–34. [Google Scholar]
  68. Hasanbegovic, J.; Hadizabulic, S.; Kurtović, M.; Gaši, F.; Ercisli, S.; Dorbić, B.; Durul, M.S. Genetic and Morphological Diversity of Introduced Cultivars of Almonds (Prunus amygdalus L.) in Bosnia and Herzegovina. Cell. Mol. Biol. 2024, 70, 106–114. [Google Scholar] [CrossRef] [PubMed]
  69. Pérez-Sánchez, R.; Morales-Corts, M.R. Agromorphological Characterization and Nutritional Value of Traditional Almond Cultivars Grown in the Central-Western Iberian Peninsula. Agronomy 2021, 11, 1238. [Google Scholar] [CrossRef]
  70. Hu, Y.; Sun, D.; Hu, H.; Zuo, X.; Xia, T.; Xie, J. A Comparative Study on Morphological and Fruit Quality Traits of Diploid and Polyploid Carambola (Averrhoa carambola L.) Genotypes. Sci. Hortic. 2021, 277, 109843. [Google Scholar] [CrossRef]
  71. Palei, S.; Dasmohapatra, R.; Samal, S.; Rout, G.R. Cashew Nut (Anacardium occidentale L.) Breeding Strategies. In Advances in Plant Breeding Strategies: Nut and Beverage Crops: Volume 4; Springer: Cham, Switzerland, 2019; pp. 77–104. [Google Scholar] [CrossRef]
  72. Khadivi, A.; Mirheidari, F.; Saeidifar, A.; Moradi, Y. Selection of the Promising Accessions of Jamun (Syzygium cumini (L.) Skeels) Based on Pomological Characterizations. Food Sci. Nutr. 2023, 11, 470–480. [Google Scholar] [CrossRef] [PubMed]
  73. Meena, R.K.; Bhatnagar, P.; Singh, J.; Chopra, R.; Chhipa, H.R. Correlation Dynamics among Growth, Development and Soil Parameters in Response to Vermicompost and PSB on Jamun Cv. Goma Priyanka in Vertisols of Jhalawar District. J. Pharmacogn. Phytochem. 2020, 9, 1950–1952. [Google Scholar]
  74. Samarina, L.S.; Malyarovskaya, V.I.; Reim, S.; Koninskaya, N.G.; Matskiv, A.O.; Tsaturyan, G.A.; Rakhmangulov, R.S.; Shkhalakhova, R.M.; Shurkina, E.S.; Kulyan, R.V. Genetic Diversity in Diospyros Germplasm in the Western Caucasus Based on SSR and ISSR Polymorphism. Biology 2021, 10, 341. [Google Scholar] [CrossRef]
  75. Zhang, Y.; Cao, Y.-F.; Huo, H.-L.; Xu, J.-Y.; Tian, L.-M.; Dong, X.-G.; Dan, Q.I.; Chao, L.I.U. An Assessment of the Genetic Diversity of Pear (Pyrus L.) Germplasm Resources Based on the Fruit Phenotypic Traits. J. Integr. Agric. 2022, 21, 2275–2290. [Google Scholar] [CrossRef]
  76. Dev, R.; Singh, S.K.; Singh, R.; Singh, A.K.; Patel, V.B.; Alizadeh, M.; Motha, K.; Kumar, K. Assessment of Genetic Diversity of Grape Mutants Based on RAPD and SSR Markers. Indian J. Hortic. 2021, 78, 17–24. [Google Scholar] [CrossRef]
  77. Hussein, M.A.A.; Eid, M.; Rahimi, M.; Filimban, F.Z.; Abd El-Moneim, D. Comparative Assessment of SSR and RAPD Markers for Genetic Diversity in Some Mango Cultivars. PeerJ 2023, 11, e15722. [Google Scholar] [CrossRef]
  78. EL-Tarawy, O.M. Genetic Identification of Some Guava Seedling Trees. Ann. Agric. Sci. Moshtohor 2020, 58, 1039–1050. [Google Scholar] [CrossRef]
  79. Liliana, B.; Anca-Amalia, U.; Cornelia, B.A.; Mihaela, I. Genetic Diversity Analysis among Several Apple Genotypes Using ISSR Markers. Fruit Grow. Res. 2022, 38, 40–44. [Google Scholar] [CrossRef]
  80. Singh, Y.S.; Shira, V.D.; Swamy, G.S.K. Genetic Variation for Morphological and Physicochemical Traits in Jamun (Syzygium cuminii Skeels). Asian J. Hortic. 2016, 11, 163–167. [Google Scholar] [CrossRef]
  81. Chesnokov, Y.V.; Artemyeva, A.M. Evaluation of the Measure of Polymorphism Information of Genetic Diversity. Сельскoхoзяйственная биoлoгия 2015, 50, 571–578. [Google Scholar] [CrossRef]
  82. Ho, V.T.; Ngo, T.K.A.; Phan, T.H.T.; Ta, T.T.T.; Tran, T.K.P. Genetic Diversity among Passion Fruit (Passiflora edulis) Accessions of Southern Vietnam Using RAPD and ISSR Markers. SABRAO J. Breed. Genet. 2021, 53, 1–14. [Google Scholar]
  83. Adhiena, M.; Muez, M. Multivariate Analysis for Yield and Yield Related Traits in Durum Wheat Genotypes in Southern Tigray, North, Ethiopia. Int. J. Agric. Biosci. 2019, 8, 36–39. [Google Scholar]
  84. Gajera, H.P.; Tomar, R.S.; Patel, S.V.; Viradia, R.R.; Golakiya, B.A. Comparison of RAPD and ISSR Markers for Genetic Diversity Analysis among Different Endangered Mangifera indica Genotypes of Indian Gir Forest Region. J. Plant Biochem. Biotechnol. 2011, 20, 217–223. [Google Scholar] [CrossRef]
Figure 1. The (A) administrative map of Pakistan, (B) S. cumini growing belt in Punjab province of Pakistan, and (C) S. cumini sample collection sites from selected districts of Punjab.
Horticulturae 10 00879 g001
Figure 2. (a). Pictorial description of observed phenotypic characters among Jamun (S. cumini) genotypes from Pakistan; top: first three rows depict tree shapes, bark color, and trunk wood color; fourth row shows different leaf shapes. (b). Pictorial description of observed phenotypic characters among Jamun (S. cumini) genotypes from Pakistan; top: observed flower colors; bottom: pictures express different fruit qualitative traits.
Horticulturae 10 00879 g002aHorticulturae 10 00879 g002b
Figure 3. Correlation analysis among polymorphs of phenotypic characters in Jamun (S. cumini) genotypes. UR: upright, SP: spreading, Dr: drooping, LG: light grey, G: grey, B: brown, RG: reddish grey, BG: brownish grey, DB: dull brownish, C: coriaceous, MC: mild coriaceous, BO: broadly ovate, EO: elliptic oblong, EP: elliptic, Ln: lanceolate, LY: light yellow, GW: greenish white, Rd: round, Ob: oblong, Ov: oval, EL: elliptic, D: depressed, Pr: projected, F: flat, Pu: pinkish, D.P: deep purple, BB: bluish black, W: whitish, PP: purple pink, Lo: low, Md: medium, H: high; blue color denotes positive association and red color shows negative association, while intensity of color depicts the degree of association among phenotypic traits.
Horticulturae 10 00879 g003
Figure 4. Correspondence analysis (CA) among 60 Jamun (S. cumini) genotypes based on descriptive phenotypic characters. A two-dimensional plot exhibits distribution of genotypes (colored points) and phenotypic traits (black vectors) along the first two principal components. Each genotype is represented by its unique code, highlighting diversity and phenotypic relationships within Jamun genotypes.
Horticulturae 10 00879 g004
Figure 5. RAPD-markers-based UPGMA analysis of 60 Jamun (S. cumini) genotypes from Pakistan.
Horticulturae 10 00879 g005
Figure 6. ISSR markers-based UPGMA analysis of 60 Jamun (S. cumini) genotypes from Pakistan.
Horticulturae 10 00879 g006
Figure 7. Clustering of 60 S. cumini genotypes from Pakistan, utilizing genetic markers. Top: UPGMA cluster analysis tree based on Nei’s genetic distance coefficient obtained with RAPD and ISSR markers; bottom: the speculated genetic structure of clusters. Population stratification with K = 5 displayed in bar plot (each color represents a different subpopulation).
Horticulturae 10 00879 g007
Figure 8. Three-dimensional multi-dimensional scaling (MDS) of S. cumini genotypes from 4 countries (Pakistan, Indonesia, Philippines, and United States). Each color represents a different geographic origin, showing distinct clustering patterns and highlighting significant genetic variation. The findings underscore high genetic diversity of Pakistan’s genotypes and their distinctness from other countries.
Horticulturae 10 00879 g008
Table 1. List of Jamun (S. cumini) genotypes selected from different areas of Pakistan.
Sr. No.Collection SiteAccession IDSr. No.Collection SiteAccession ID
1KhushabKDC-0131FaisalabadSFH-04
2KDC-0232SPJ-05
3KDC-0333SFD-06
4KDC-0434SFG-07
5KDC-0535SFM-08
6KasurQFS-0136SFD-09
7QDS-0137SFD-10
8QDC-0138Toba Tek SinghTTR-01
9QDC-0339TUK-01
10Q3DC-0240TUK-02
11Q3DC-0141TUK-03
12QFS-0242TTD-01
13SahiwalCSP-2543TTD-02
14CSP-2644TTD-03
15CSP-2745BhakkarKKD-01
16KRC-133-946KKD-02
17KRC-2-133947KKF-01
18KRC-3-133948KKF-02
19KRC-4-133949BKR-03
20SHW-0150JhangJWF-01
21SheikhupuraSKS-0151JWF-02
22SKD-0152JWD-03
23SKD-0253MianwaliMWD-01
24SKH-0354MWD-02
25SKUK-0255MWF-01
26SKD-5056MWF-02
27SKD-0357MSD-01
28FaisalabadSFD-0158MSD-02
29SFS-0259Rahim Yar KhanCUK-01
30SFS-0360MKR-01
Table 2. Descriptive phenotypic characters of S. cumini genotypes from Pakistan observed using plant biodiversity descriptor [46].
Sr. No. Characters Categories
1Tree shape (TS)Upright (UR), spreading (SP), drooping (Dr)
2Bark color (BC)Light grey (LG), grey (G), brown (B)
3Trunk wood color (SwC)Reddish grey (RG), brownish grey (BG), Dull brown (DB)
4Leaf surface (lsurf)Coriaceous (C), mild coriaceous (MC)
5Leaf shape (LSP)Broadly ovate (BO), elliptic oblong (EO), elliptic (EP), lanceolate (Ln)
6Flower color (Fw.C)Light yellow (LY), greenish white (GW)
7Fruit shape (FSp)Round (Rd), oblong (Ob), oval (Ov), elliptic (EL)
8Fruit color (FC)Pinkish (Pu), deep purple (DP), Bluish black (BB)
9Pulp color (PC)Whitish (W), pinkish (P), purple pink (PP)
10Fruit waxiness (FWx)Low (Lo), medium (Md), high (H)
11Fruit base (FB)Depressed (D), flat (F), projected (Pr)
Table 3. Sequences of molecular markers (RAPD and ISSR) used for Jamun genetic variability analysis.
RAPD PrimersPrimer Sequence (5′-3′)ISSR PrimersPrimer Sequence (5′-3′)
OPB 08GTCCACACGGUBC 817 (CA)8A
OPA 13 CAGCACCCACUBC 834(AG)8YT
OPD 18 GAGAGCCAACUBC 835 (AG)8YC
OPG 4AGCGTGTGTGUBC 840 (GA)8YT
OPG 13 CTCTCCGCCAUBC 844 (CT)8RC
OPX 4CCGCTACCGAUBC 864 (ATGA)3 (TG)3
OPF 2GAGGATCCCTUBC 807(AG)8T
85SP10A16AGCCAGCGAA
OPQ 4 AGTGCGCTGA
70SP10C1CAGGCCCTTC
Key to symbols: R = A + G, Y = C + T [3,44,48].
Table 4. Frequency distribution of descriptive phenotypic characters and their polymorphs in S. cumini genotypes. The percentage values indicate the prevalence of each characteristic in the respective region, providing insights into the phenotypic diversity and adaptation of Jamun genotypes.
AreasTree ShapeBark ColorTrunk Wood ColorLeaf SurfaceLeaf ShapeFlower ColorFruit ShapeFruit ColorPulp ColorFruit WaxinessFruit Base
Upright (UR)Spreading (SP)Drooping (Dr)Light Grey (LG)Grey (G)Brown (B)Reddish Grey (RG)Brownish Grey (BG)Dull Brown (DB)Coriaceous (C)Mild Coriaceous (MC)Broadly Ovate (BO)Elliptic Oblong (EO)Elliptic (EP)Lanceolate (Ln)Light Yellow (LY)Greenish White (GW)Round (Rd) Oblong (Ob)Oval (Ov)Elliptic (EL)Pinkish (Pu)Deep Purple (DP)Bluish Black (BB)Whitish (W)Pinkish (Pu)Purple Pink (PP)Low (Lo)Medium (Md)High (H)Depressed (D)Flat (F)Projected (Pr)
KHUSHAB6004004060406002080020800100020602000208004060202060402040
KASUR295714142957435705743291443141486071290142957144343295714431443
SAHIWAL7513137525013503813880505001000255025006338382538256313131375
SHEIKHUPURA432929570431443437129140860712929142929043571443430100004357
FAISALABAD602020402040404020406030304008020503020010207030403030601004060
TOBA TEK SINGH0574386140148607129029710100007114140297129294301000147114
BHAKKAR4060006040202060406020206001000202060006040402040402040402040
JHANG3306767033033673367001000100003367003367333333333333333333
MIANWALI501733067335005050500336708317173350017335033333333670331750
RAHIM YAR KHAN5050005050505001000050500100010000000100500505050005050
TOTAL453025382833284527475312256228218234230553560273340236215203248
CV%36.55241.10841.04531.14028.20632.10141.31534.44541.50825.76136.243
Table 5. Phenotypic description of 60 Jamun (S. cumini) genotypes from Pakistan scored considering Jamun biodiversity descriptor by Agro Biodiversity, Plant Genetic Resources [46].
AccessionTree ShapeBark ColorStem Wood ColorFruit ColorFruit
Waxiness
Fruit ShapeFruit BasePulp ColorLeaf SurfaceLeaf ShapeFlower Color
KDC-01DroopingBrownReddish greyBluish BlackMediumOblong Flat PinkishMild coriaceousEllipticLight yellow
KDC-02UprightGreyReddish greyBluish BlackHighOblongDepressedPurple pinkMild coriaceousEllipticLight yellow
KDC-03UprightBrownBrownish greyBluish BlackHighRound FlatPurple pinkMild coriaceousEllipticLight yellow
KDC-04UprightBrownBrownish greyBluish BlackHighOval DepressedPurple pinkMild coriaceousEllipticLight yellow
KDC-05DroopingGreyBrownish greyDeep purpleLowOvalProjectedPinkishCoriaceousElliptic oblongLight yellow
QFS-01SpreadingGreyReddish greyPinkishMediumOvalProjectedWhitishCoriaceousElliptic oblongGreenish white
QDS-01SpreadingBrownBrownish greyDeep purpleMediumOblongDepressedPinkishCoriaceousEllipticGreenish white
QDC-01SpreadingBrownBrownish greyBluish BlackMediumOblongDepressedPurple pinkMild coriaceousLanceolateGreenish white
QDC-03DroopingGreyReddish greyDeep purpleMediumOvalFlatPinkishCoriaceousEllipticGreenish white
Q3DC-02SpreadingBrownReddish greyBluish BlackLowOblongFlat PinkishCoriaceousBroadly ovateGreenish white
Q3DC-01UprightLight greyBrownish greyBluish BlackLowOblongProjectedPurple pinkMild coriaceousBroadly ovateGreenish white
QFS-02UprightBrownBrownish greyBluish BlackHighOval DepressedPurple pinkMild coriaceousEllipticLight yellow
CSP-25UprightGreyDull Brown Bluish BlackMediumRound Depressed Purple pinkMild coriaceousElliptic oblongLight yellow
CSP-26SpreadingLight greyDull Brown Deep purpleMediumOblongProjectedWhitishMild coriaceousEllipticLight yellow
CSP-27UprightLight greyBrownish greyDeep purpleLowOblongProjectedWhitishMild coriaceousEllipticLight yellow
KRC-133-9UprightLight greyBrownish greyBluish BlackMediumOvalProjectedWhitishMild coriaceousElliptic oblongLight yellow
KRC-2-1339UprightGreyReddish greyDeep purpleHighRoundFlatPurple pinkCoriaceousEllipticLight yellow
KRC-3-1339UprightLight greyBrownish greyBluish BlackMediumRoundDepressed PinkishMild coriaceousElliptic oblongLight yellow
KRC-4-1339UprightLight greyBrownish greyDeep purpleMediumOval DepressedPurple pinkMild coriaceousElliptic oblongLight yellow
SHW-01DroopingLight greyDull Brown Deep purpleLowOvalProjectedPinkishMild coriaceousEllipticLight yellow
SKS-01DroopingLight greyBrownish greyDeep purpleMediumOvalProjectedWhitishCoriaceousBroadly ovateGreenish white
SKD-01UprightLight greyDull Brown Bluish BlackMediumOvalProjectedPurple pinkMild coriaceousEllipticLight yellow
SKD-02UprightLight greyDull Brown Bluish BlackMediumRoundFlatPinkishCoriaceousEllipticLight yellow
SKH-03SpreadingBrownDull Brown Deep purpleMediumOblongProjectedPinkishCoriaceousEllipticLight yellow
SKUK-02SpreadingBrownBrownish greyDeep purpleMediumEllipticFlatPinkishCoriaceousEllipticLight yellow
SKD-50UprightLight greyBrownish greyBluish BlackMediumEllipticProjected Purple pinkCoriaceousEllipticGreenish white
SKD-03DroopingBrownReddish greyBluish BlackMediumRoundProjectedPinkishMild coriaceousEllipticLight yellow
SFD-01UprightBrownBrownish greyBluish BlackMediumRoundProjectedPurple pinkMild coriaceousEllipticLight yellow
SFS-02DroopingLight greyDull Brown Deep purpleLowOvalProjectedPinkishMild coriaceousElliptic oblongLight yellow
SFS-03DroopingGreyBrownish greyDeep purpleLowOvalProjectedPinkishCoriaceousElliptic oblongLight yellow
SFH-04UprightLight greyDull Brown Bluish BlackHighOblongProjectedWhitishCoriaceousEllipticLight yellow
SPJ-05SpreadingGreyReddish greyBluish BlackMediumOblongFlat PinkishMild coriaceousBroadly ovateGreenish white
SFD-06UprightLight greyReddish greyBluish BlackMediumRoundFlatPurple pinkMild coriaceousBroadly ovateLight yellow
SFG-07UprightBrownBrownish greyBluish BlackMediumRoundFlatPinkishCoriaceousEllipticLight yellow
SFM-08SpreadingBrownReddish greyPinkishLowRoundFlatWhitishCoriaceousElliptic oblongLight yellow
SFD-09UprightLight greyReddish greyBluish BlackMediumOval FlatWhitishMild coriaceousBroadly ovateGreenish white
SFD-10UprightBrownBrownish greyBluish BlackMediumRoundProjectedPurple pinkMild coriaceousEllipticLight yellow
TTR-01SpreadingLight greyBrownish greyBluish BlackMediumOblongProjectedPinkishCoriaceousEllipticLight yellow
TUK-01SpreadingGreyBrownish greyBluish BlackMediumOblongFlatWhitishCoriaceousElliptic oblongLight yellow
TUK-02SpreadingLight greyBrownish greyDeep purpleMediumOblongDepressedWhitishCoriaceousEllipticLight yellow
TUK-03SpreadingLight greyBrownish greyDeep purpleMediumOvalFlatPinkishMild coriaceousEllipticLight yellow
TTD-01DroopingLight greyBrownish greyBluish BlackMediumOblongFlatPurple pinkCoriaceousEllipticLight yellow
TTD-02DroopingLight greyReddish greyBluish BlackMediumEllipticFlatPurple pinkMild coriaceousElliptic oblongLight yellow
TTD-03DroopingLight greyBrownish greyBluish BlackMediumOblongFlatPurple pinkCoriaceousEllipticLight yellow
KKD-01UprightBrownDull Brown Bluish BlackHighRoundDepressedPurple pinkMild coriaceousElliptic oblongLight yellow
KKD-02Drooping BrownDull Brown Bluish BlackHighOblongDepressedPurple pinkMild coriaceousEllipticLight yellow
KKF-01DroopingGreyDull Brown Deep purpleMediumOvalProjectedWhitishCoriaceousBroadly ovateLight yellow
KKF-02DroopingGreyBrownish greyDeep purpleLowOvalProjectedWhitishMild coriaceousEllipticLight yellow
BKR-03DroopingGreyReddish greyDeep purpleLowOvalFlatPinkishCoriaceousEllipticLight yellow
JWF-01DroopingLight greyDull Brown Deep purpleLowOvalProjectedPinkishMild coriaceousEllipticLight yellow
JWF-02DroopingLight greyBrownish greyBluish BlackMediumOvalFlatWhitishCoriaceousEllipticLight yellow
JWD-03UprightBrownDull Brown Bluish BlackHighOblongDepressedPurple pinkMild coriaceousEllipticLight yellow
MWD-01UprightBrownDull Brown Bluish BlackMediumOblongDepressedPurple pinkMild coriaceousEllipticLight yellow
MWD-02UprightBrownDull Brown Bluish BlackMediumRoundProjectedPinkishCoriaceousEllipticLight yellow
MWF-01DroopingGreyReddish greyDeep purpleLowOvalFlatPinkishCoriaceousEllipticLight yellow
MWF-02DroopingGreyReddish greyDeep purpleLowOblong DepressedWhitishMild coriaceousEllipticLight yellow
MSD-01UprightGreyDull Brown Bluish BlackMediumRound ProjectedPurple pinkMild coriaceousElliptic oblongLight yellow
MSD-02SpreadingGreyReddish greyPinkishMediumOblong Flat WhitishCoriaceousElliptic oblongGreenish white
CUK-01UprightBrownReddish greyBluish BlackLowRoundProjectedWhitishCoriaceousElliptic oblongLight yellow
MKR-01SpreadingGreyBrownish greyBluish BlackMediumRoundFlatPurple pinkCoriaceousEllipticLight yellow
Table 6. Summary of genetic estimates for ten Random Amplified Polymorphic DNA (RAPD) and seven Inter Simple Sequence Repeats (ISSR) markers in relation to 60 S. cumini genotypes from Pakistan.
Primer AFSTNBNPBMBFPICRP%Pol
For RAPD markers
OPA 1350–1050880.6830.4243.433100
OPD 18480–1460760.7000.4062.86185.714
OPG 13600–1500640.6670.3531.55666.667
OPG 4260–1500750.5240.3521.93171.428
OPX 4100–1340870.6020.4192.33087.500
OPF 2670–1600520.6970.3470.78440.000
85SP10A16100–13001070.6350.4052.10670.000
OPQ 4340–2000850.7040.3362.02162.500
70SP10C1150–950440.5870.4653.781100
OPB 8850–2300630.6030.3861.76050.000
Mean 6.905.100.6400.3892.25673.381
Total 6951----
For ISSR markers
UBC 807300–1200880.6120.4603.800 100
UBC 817380–120010100.5210.4594.431100
UBC 834400–20001090.5770.4793.75890.000
UBC 835750–210016130.4750.4554.37681.250
UBC 840100–1200970.6080.4373.93277.778
UBC 84450–860440.5120.5002.221100
UBC 864250–900660.5940.4062.630100
Mean 98.1430.5570.4573.59192.718
Total 6357----
Abbreviations: amplified fragment size (AFS), total number of bands (TNB), number of polymorphic bands (NPB), mean band frequency (MBF), polymorphic information content (PIC), resolving power (RP), polymorphism percentage (%Pol).
Table 7. Analysis of molecular variance (AMOVA) for within- and among-population genetic differentiation.
SourcedfSSMSEst. Var%
Among Population9256.60828.5122.33414%
Within Population50736.15814.72314.72386%
Total59992.767 17.057100%
Abbreviations: df = degree of freedom; SS = sum of squares; MS = mean sum of squares; Est. Var. = estimate of variance; % = total variation percentage.
Disclaimer/Publisher’s Note: The statements, opinions and data contained in all publications are solely those of the individual author(s) and contributor(s) and not of MDPI and/or the editor(s). MDPI and/or the editor(s) disclaim responsibility for any injury to people or property resulting from any ideas, methods, instructions or products referred to in the content.

