


Modeling Tomato Yield and Quality Responses to Water and Nitrogen Deficits with a Modified Crop Water Production Function
 ,
,
Abstract
:
1. Introduction
2. Materials and Methods
2.1. Experiment Site and Design
2.2. Measurements
2.2.1. Water and Nitrogen Consumption
2.2.2. Fruit Yield and Quality Parameters
2.3. Models
2.3.1. Water-Nitrogen Models for the Whole Growth Stage
2.3.2. Water-Nitrogen Models for the Separated Growth Stage
2.4. Model Calibration and Evaluation
2.4.1. Model Calibration
2.4.2. Model Evaluation
2.5. Data Analysis
3. Results
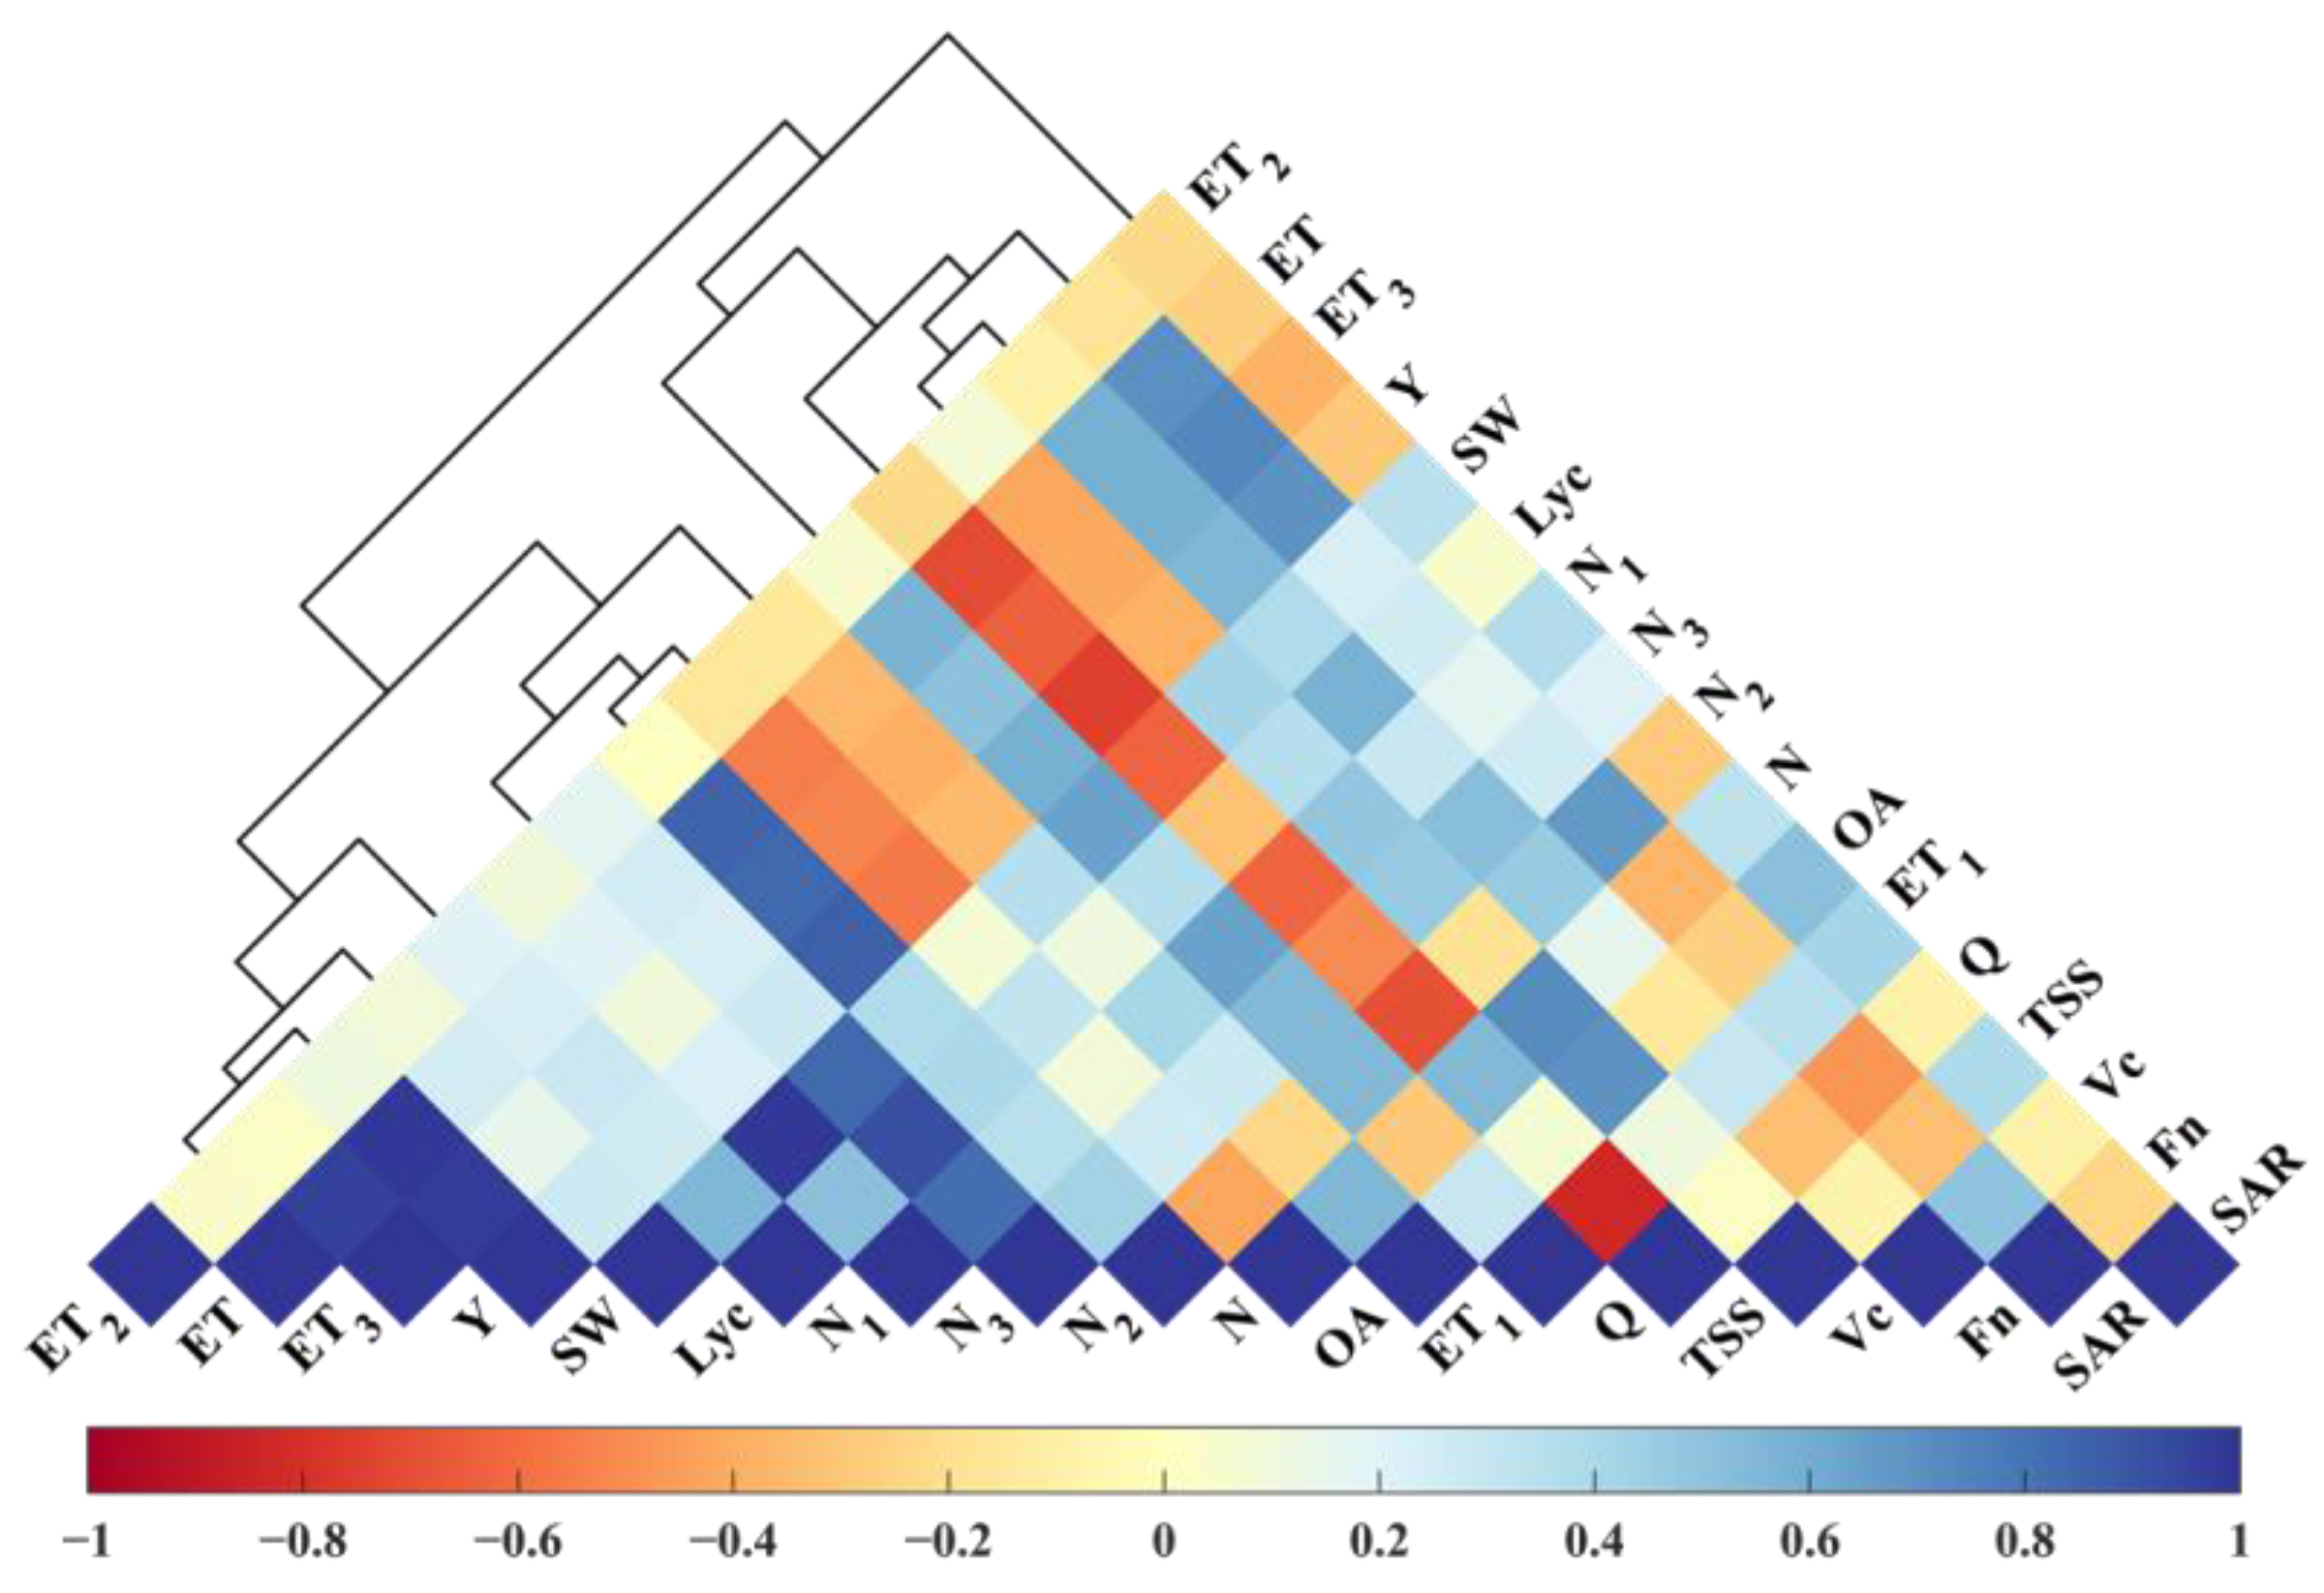
3.1. Relationship between Water-Nitrogen Consumption, Yield, and Fruit Quality
3.2. Coefficients Calibration of Water-Nitrogen, Yield, and Fruit Quality Models
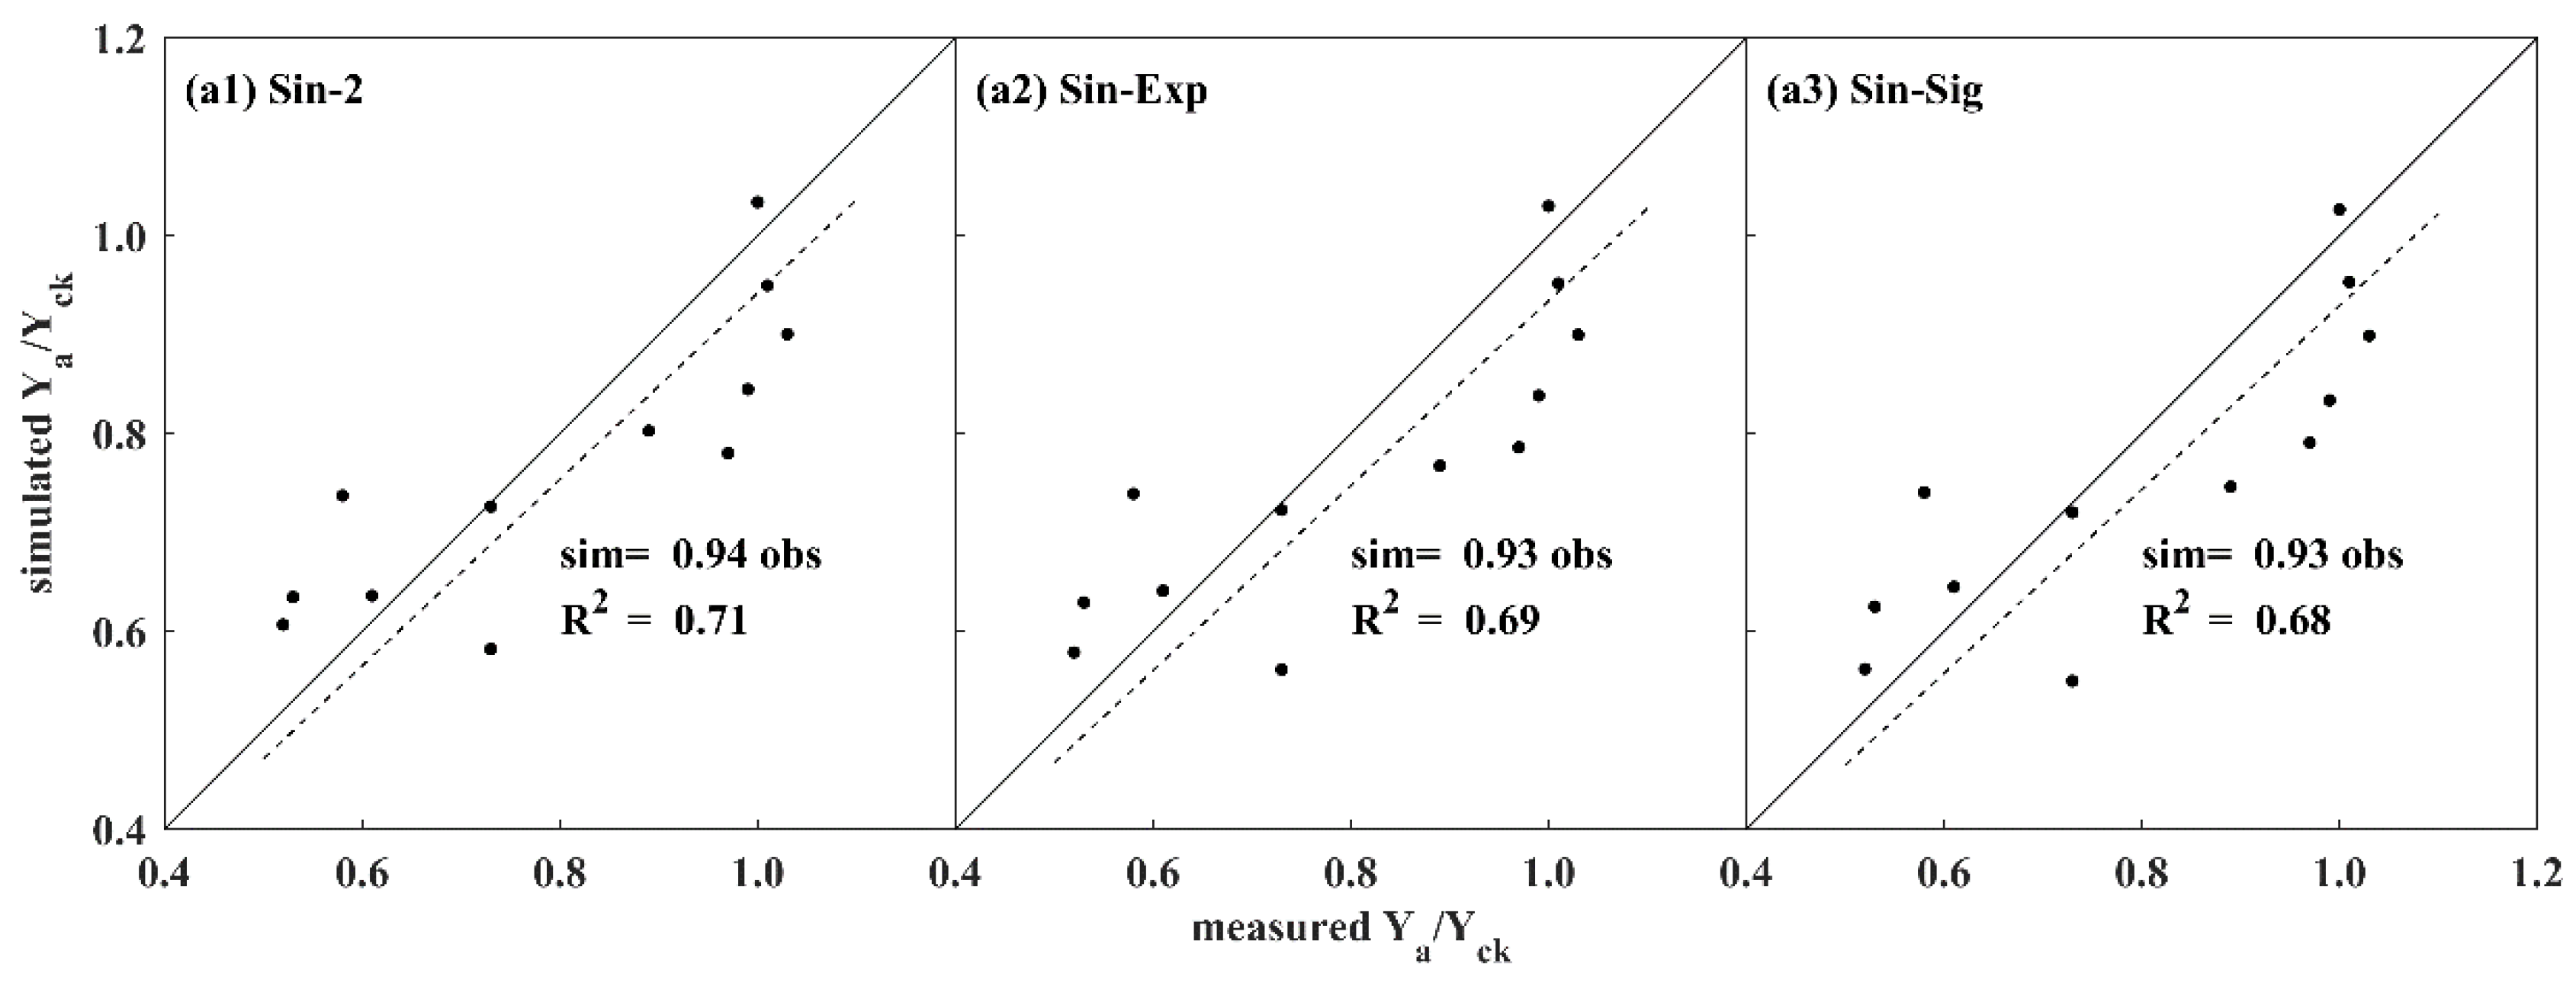
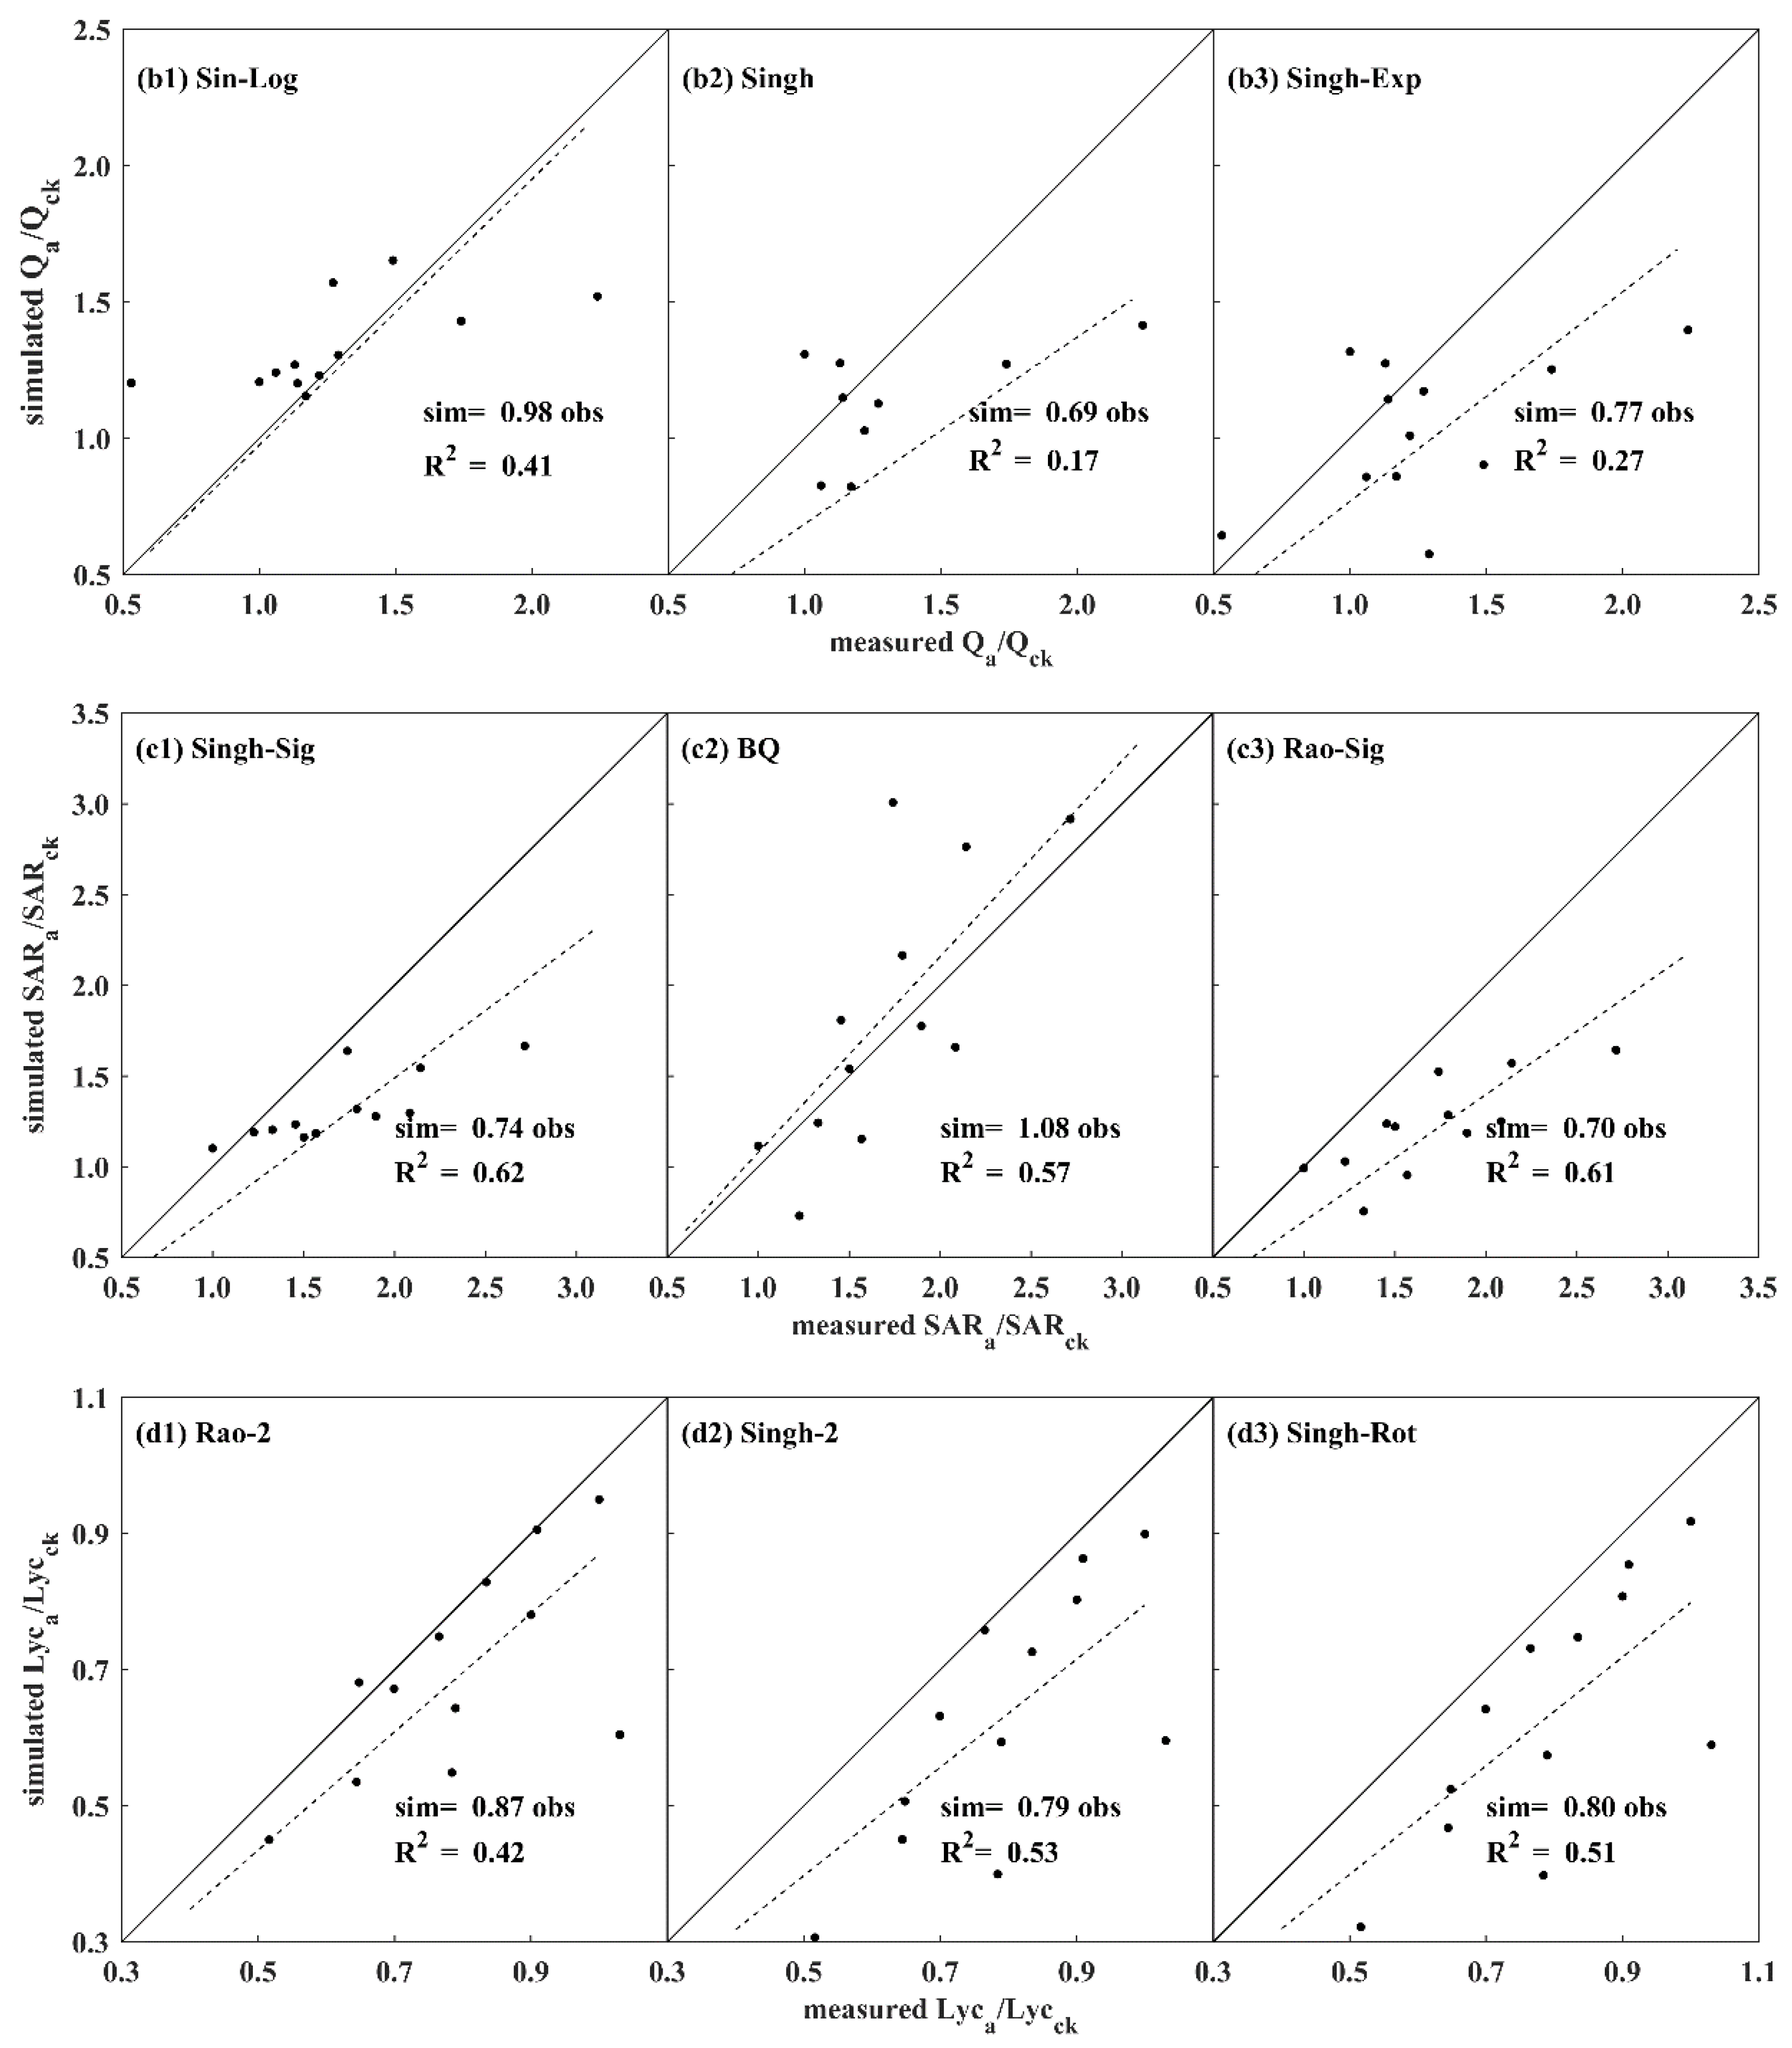
3.3. Prediction Performance of Water-Nitrogen Yield and Fruit Quality Function
4. Discussion
4.1. The Reaction of Tomato to Water-Nitrogen Deficit
4.2. Evaluation of the Three Forms of Tomato Production Models
5. Conclusions
Author Contributions
Funding
Data Availability Statement
Conflicts of Interest
References
- Ali, M.Y.; Sina, A.A.I.; Khandker, S.S.; Neesa, L.; Tanvir, E.M.; Kabir, A.; Khalil, M.I.; Gan, S.H. Nutritional Composition and Bioactive Compounds in Tomatoes and Their Impact on Human Health and Disease: A Review. Foods 2020, 1, 45. [Google Scholar] [CrossRef]
- Coelho, M.C.; Rodrigues, A.S.; Teixeira, J.A.; Pintado, M.E. Integral valorisation of tomato by-products towards bioactive compounds recovery: Human health benefits. Food Chem. 2023, 410, 135319. [Google Scholar] [CrossRef]
- FAOSTAT, Food and Agricultural Organization of United Nations. Rome. 2018. Available online: https://www.fao.org/faostat/es/#data (accessed on 19 August 2024).
- Bhargava, A.; Bansal, A. Fruits and vegetables quality evaluation using computer vision: A review. J. King Saud Univ.-Comput. Inf. Sci. 2021, 33, 243–257. [Google Scholar] [CrossRef]
- Gao, L.; Hao, N.; Wu, T.; Cao, J. Advances in Understanding and Harnessing the Molecular Regulatory Mechanisms of Vegetable Quality. Front. Plant Sci. 2022, 13, 836515. [Google Scholar] [CrossRef] [PubMed]
- Sarker, M.R.; Choudhury, S.; Islam, N.; Zeb, T.; Zeb, B.S.; Mahmood, Q. The effects of climatic change mediated water stress on growth and yield of tomato. Cent. Asian J. Environ. Sci. Technol. Innov. 2020, 1, 85–92. [Google Scholar] [CrossRef]
- Rathore, V.S.; Nathawat, N.S.; Bhardwaj, S.; Yadav, B.M.; Kumar, M.; Santra, P.; Praveen, K.; Reager, M.L.; Yadava, N.D.; Yadav, O.P. Optimization of deficit irrigation and nitrogen fertilizer management for peanut production in an arid region. Sci. Rep. 2021, 11, 5456. [Google Scholar] [CrossRef]
- Yang, H.; Du, T.; Qiu, R.; Chen, J.; Wang, F.; Li, Y.; Wang, C.; Gao, L.; Kang, S. Improved water use efficiency and fruit quality of greenhouse crops under regulated deficit irrigation in northwest China. Agric. Water Manag. 2017, 179, 193–204. [Google Scholar] [CrossRef]
- Villa e Vila, V.; Marques, P.A.A.; Rezende, R.; Wenneck, G.S.; Terassi, D.d.S.; Andrean, A.F.B.A.; Nocchi, R.C.d.F.; Matumoto-Pintro, P.T. Deficit Irrigation with Ascophyllum nodosum Extract Application as a Strategy to Increase Tomato Yield and Quality. Agronomy 2023, 13, 1853. [Google Scholar] [CrossRef]
- Lu, J.; Shao, G.; Cui, J.; Wang, X.; Keabetswe, L. Yield, fruit quality and water use efficiency of tomato for processing under regulated deficit irrigation: A meta-analysis. Agric. Water Manag. 2019, 222, 301–312. [Google Scholar] [CrossRef]
- Galindo, A.; Collado-González, J.; Griñán, I.; Corell, M.; Centeno, A.; Martín-Palomo, M.J.; Girón, I.F.; Rodríguez, P.; Cruz, Z.N.; Memmi, H.; et al. Deficit irrigation and emerging fruit crops as a strategy to save water in Mediterranean semiarid agrosystems. Agric. Water Manag. 2018, 202, 311–324. [Google Scholar] [CrossRef]
- Zhang, H.; Xiong, Y.; Huang, G.; Xu, X.; Huang, Q. Effects of water stress on processing tomatoes yield, quality and water use efficiency with plastic mulched drip irrigation in sandy soil of the Hetao Irrigation District. Agric. Water Manag. 2017, 179, 205–214. [Google Scholar] [CrossRef]
- Wei, Z.; Du, T.; Li, X.; Fang, L.; Liu, F. Interactive effects of CO2 concentration elevation and nitrogen fertilization on water and nitrogen use efficiency of tomato grown under reduced irrigation regimes. Agric. Water Manag. 2018, 202, 174–182. [Google Scholar] [CrossRef]
- Rudnick, D.R.; Irmak, S.; Djaman, K.; Sharma, V. Impact of irrigation and nitrogen fertilizer rate on soil water trends and maize evapotranspiration during the vegetative and reproductive periods. Agric. Water Manag. 2017, 191, 77–84. [Google Scholar] [CrossRef]
- Cheng, M.; Wang, H.; Fan, J.; Xiang, Y.; Tang, Z.; Pei, S.; Zeng, H.; Zhang, C.; Dai, Y.; Li, Z.; et al. Effects of nitrogen supply on tomato yield, water use efficiency and fruit quality: A global meta-analysis. Sci. Hortic. 2021, 290, 110553. [Google Scholar] [CrossRef]
- Hernández, V.; Hellín, P.; Fenoll, J.; Flores, P. Impact of nitrogen supply limitation on tomato fruit composition. Sci. Hortic. 2020, 264, 109173. [Google Scholar] [CrossRef]
- Li, Y.; Sun, Y.; Liao, S.; Zou, G.; Zhao, T.; Chen, Y.; Yang, J.; Zhang, L. Effects of two slow-release nitrogen fertilizers and irrigation on yield, quality, and water-fertilizer productivity of greenhouse tomato. Agric. Water Manag. 2017, 186, 139–146. [Google Scholar] [CrossRef]
- Ishfaq, M.; Kiran, A.; ur Rehman, H.; Farooq, M.; Ijaz, N.H.; Nadeem, F.; Azeem, I.; Li, X.; Wakeel, A. Foliar nutrition: Potential and challenges under multifaceted agriculture. Environ. Exp. Bot. 2022, 200, 104909. [Google Scholar] [CrossRef]
- He, J.; Hu, W.; Li, Y.; Zhu, H.; Zou, J.; Wang, Y.; Meng, Y.; Chen, B.; Zhao, W.; Wang, S.; et al. Prolonged drought affects the interaction of carbon and nitrogen metabolism in root and shoot of cotton. Environ. Exp. Bot. 2022, 197, 104839. [Google Scholar] [CrossRef]
- Zhou, H.; Kang, S.; Li, F.; Du, T.; Shukla, M.K.; Li, X. Nitrogen application modified the effect of deficit irrigation on tomato transpiration, and water use efficiency in different growth stages. Sci. Hortic. 2020, 263, 109112. [Google Scholar] [CrossRef]
- Si, Z.; Zain, M.; Mehmood, F.; Wang, G.; Gao, Y.; Duan, A. Effects of nitrogen application rate and irrigation regime on growth, yield, and water-nitrogen use efficiency of drip-irrigated winter wheat in the North China Plain. Agric. Water Manag. 2020, 231, 106002. [Google Scholar] [CrossRef]
- Li, H.; Liu, H.; Gong, X.; Li, S.; Pang, J.; Chen, Z.; Sun, J. Optimizing irrigation and nitrogen management strategy to trade off yield, crop water productivity, nitrogen use efficiency and fruit quality of greenhouse grown tomato. Agric. Water Manag. 2021, 245, 106570. [Google Scholar] [CrossRef]
- Zhang, S.; Chen, S.; Hu, T.; Geng, C.; Liu, J. Optimization of irrigation and nitrogen levels for a trade-off: Yield, quality, water use efficiency and environment effect in a drip-fertigated apple orchard based on TOPSIS method. Sci. Hortic. 2023, 309, 111700. [Google Scholar] [CrossRef]
- Plett, D.C.; Ranathunge, K.; Melino, V.J.; Kuya, N.; Uga, Y.; Kronzucker, H.J.; Xu, G. The intersection of nitrogen nutrition and water use in plants: New paths toward improved crop productivity. J. Exp. Bot. 2020, 71, 4452–4468. [Google Scholar] [CrossRef]
- Bwambale, E.; Abagale, F.K.; Anornu, G.K. Smart irrigation monitoring and control strategies for improving water use efficiency in precision agriculture: A review. Agric. Water Manag. 2022, 260, 107324. [Google Scholar] [CrossRef]
- Lu, J.; Shao, G.; Gao, Y.; Zhang, K.; Wei, Q.; Cheng, J. Effects of water deficit combined with soil texture, soil bulk density and tomato variety on tomato fruit quality: A meta-analysis. Agric. Water Manag. 2021, 243, 106427. [Google Scholar] [CrossRef]
- English, M.; Raja, S.N. Perspectives on deficit irrigation. Agric. Water Manag. 1996, 32, 1–14. [Google Scholar] [CrossRef]
- Tarkalson, D.D.; King, B.A.; Bjorneberg, D.L. Maize grain yield and crop water productivity functions in the arid Northwest U.S. Agric. Water Manag. 2022, 264, 107513. [Google Scholar] [CrossRef]
- Igbadun, H.E.; Tarimo, A.K.P.R.; Salim, B.A.; Mahoo, H.F. Evaluation of selected crop water production functions for an irrigated maize crop. Agric. Water Manag. 2007, 94, 1–10. [Google Scholar] [CrossRef]
- Jensen, M.E. Water consumption by agricultural plants. Water Deficits Plant Growth 1968, 2, 1–22. [Google Scholar]
- Minhas, B.S.; Parikh, K.S.; Srinivasan, T.N. Toward the structure of a production function for wheat yields with dated inputs of irrigation water. Water Resour. Res. 1974, 10, 383–393. [Google Scholar] [CrossRef]
- Rao, N.H.; Sarma, P.B.S.; Chander, S. A simple dated water-production function for use in irrigated agriculture. Agric. Water Manag. 1988, 13, 25–32. [Google Scholar] [CrossRef]
- Blank, H.G. Optimal Irrigation Decisions with Limited Water; Colorado State University: Fort Collins, CO, USA, 1976. [Google Scholar]
- Stewart, J.I.; Cuenca, R.H.; Pruitt, W.O.; Hagan, R.M.; Tosso, J. Determination and Utilization of Water Production Functions for Principal California Crops; University of California: Davis, CA, USA, 1977. [Google Scholar]
- Singh, P.; Wolkewitz, H.; Kumar, R. Comparative performance of different crop production functions for wheat (Triticum aestivum L.). Irrig. Sci. 1987, 8, 273–290. [Google Scholar] [CrossRef]
- Letey, J.; Dinar, A.; Knapp, K.C. Crop-Water Production Function Model for Saline Irrigation Waters. Soil Sci. Soc. Am. J. 1985, 49, 1005–1009. [Google Scholar] [CrossRef]
- Li, F.; Zhang, H.; Li, X.; Deng, H.; Chen, X.; Liu, L. Modelling and Evaluation of Potato Water Production Functions in a Cold and Arid Environment. Water 2022, 14, 2044. [Google Scholar] [CrossRef]
- Shi, R.; Tong, L.; Du, T.; Shukla, M.K. Response and Modeling of Hybrid Maize Seed Vigor to Water Deficit at Different Growth Stages. Water 2020, 12, 3289. [Google Scholar] [CrossRef]
- Chen, J.; Kang, S.; Du, T.; Guo, P.; Qiu, R.; Chen, R.; Gu, F. Modeling relations of tomato yield and fruit quality with water deficit at different growth stages under greenhouse condition. Agric. Water Manag. 2014, 146, 131–148. [Google Scholar] [CrossRef]
- Saseendran, S.A.; Ahuja, L.R.; Ma, L.; Trout, T.J.; McMaster, G.S.; Nielsen, D.C.; Ham, J.M.; Andales, A.A.; Halvorson, A.D.; Chávez, J.L.; et al. Developing and normalizing average corn crop water production functions across years and locations using a system model. Agric. Water Manag. 2015, 157, 65–77. [Google Scholar] [CrossRef]
- Sapino, F.; Pérez-Blanco, C.D.; Gutiérrez-Martín, C.; García-Prats, A.; Pulido-Velazquez, M. Influence of crop-water production functions on the expected performance of water pricing policies in irrigated agriculture. Agric. Water Manag. 2022, 259, 107248. [Google Scholar] [CrossRef]
- Foster, T.; Brozović, N. Simulating Crop-Water Production Functions Using Crop Growth Models to Support Water Policy Assessments. Ecol. Econ. 2018, 152, 9–21. [Google Scholar] [CrossRef]
- Sarai Tabrizi, M.; Homaee, M.; Babazadeh, H.; Kaveh, F.; Parsinejad, M. Modeling Basil (Ocimum basilicum L.) Response to Simultaneous Salinity and Nitrogen Deficit Stresses. J. Water Soil Sci. 2015, 19, 45–58. [Google Scholar] [CrossRef]
- Saeidi, R.; Sotoodehnia, A.; Ramezani Etedali, H. Modelling the relationships between the yield and evapotranspiration of maize under salinity stress and nitrogen deficiency. Irrig. Drain. 2022, 71, 1225–1239. [Google Scholar] [CrossRef]
- Wu, X.; Shi, J.; Zhang, T.; Zuo, Q.; Wang, L.; Xue, X.; Ben-Gal, A. Crop yield estimation and irrigation scheduling optimization using a root-weighted soil water availability based water production function. Field Crops Res. 2022, 284, 108579. [Google Scholar] [CrossRef]
- Yuan, C.; Xiong, F. Calculating the water salt production function parameters of seed maize under water salt combination stress. IOP Conf. Ser. Earth Environ. Sci 2019, 330, 042006. [Google Scholar] [CrossRef]
- Zhang, X.; Yang, H.; Shukla, M.K.; Du, T. Proposing a crop-water-salt production function based on plant response to stem water potential. Agric. Water Manag. 2023, 278, 108162. [Google Scholar] [CrossRef]
- Fan, M.; Qin, Y.; Jiang, X.; Cui, N.; Wang, Y.; Zhang, Y.; Zhao, L.; Jiang, S. Proper Deficit Nitrogen Application and Irrigation of Tomato Can Obtain a Higher Fruit Quality and Improve Cultivation Profit. Agronomy 2022, 12, 2578. [Google Scholar] [CrossRef]
- Zhiguo, L.; Pingping, L.; Jizhan, L.J.I.A. Effect of mechanical damage on mass loss and water content in tomato fruits. Int. Agrophys. 2011, 25, 77–83. [Google Scholar]
- Ochoa-Velasco, C.E.; Valadez-Blanco, R.; Salas-Coronado, R.; Sustaita-Rivera, F.; Hernández-Carlos, B.; García-Ortega, S.; Santos-Sánchez, N.F. Effect of nitrogen fertilization and Bacillus licheniformis biofertilizer addition on the antioxidants compounds and antioxidant activity of greenhouse cultivated tomato fruits (Solanum lycopersicum L. var. Sheva). Sci. Hortic. 2016, 201, 338–345. [Google Scholar] [CrossRef]
- Chen, R.; Kang, S.; Hao, X.; Li, F.; Du, T.; Qiu, R.; Chen, J. Variations in tomato yield and quality in relation to soil properties and evapotranspiration under greenhouse condition. Sci. Hortic. 2015, 197, 318–328. [Google Scholar] [CrossRef]
- Hooshmand, M.; Albaji, M.; Boroomand nasab, S.; Alam zadeh Ansari, N. The effect of deficit irrigation on yield and yield components of greenhouse tomato (Solanum lycopersicum) in hydroponic culture in Ahvaz region, Iran. Sci. Hortic. 2019, 254, 84–90. [Google Scholar] [CrossRef]
- Buttaro, D.; Santamaria, P.; Signore, A.; Cantore, V.; Boari, F.; Montesano, F.F.; Parente, A. Irrigation Management of Greenhouse Tomato and Cucumber Using Tensiometer: Effects on Yield, Quality and Water Use. Agric. Agric. Sci. Procedia 2015, 4, 440–444. [Google Scholar] [CrossRef]
- Constantinescu, D.; Vercambre, G.; Génard, M.; Bertin, N. A virtual fruit model to simulate water deficit effects on water and solutes accumulation in the fruit and the consequences on fruit quality. In Proceedings of the XXXI International Horticultural Congress (IHC2022): International Symposium on Integrative Approaches to Product Quality in Fruits and Vegetables, Angers, France, 14–20 August 2022; pp. 109–118. [Google Scholar]
- Bai, C.; Zuo, J.; Watkins, C.B.; Wang, Q.; Liang, H.; Zheng, Y.; Liu, M.; Ji, Y. Sugar accumulation and fruit quality of tomatoes under water deficit irrigation. Postharvest Biol. Technol. 2023, 195, 112112. [Google Scholar] [CrossRef]
- Wu, Z.; Fan, Y.; Qiu, Y.; Hao, X.; Li, S.; Kang, S. Response of yield and quality of greenhouse tomatoes to water and salt stresses and biochar addition in Northwest China. Agric. Water Manag. 2022, 270, 107736. [Google Scholar] [CrossRef]
- Kishorekumar, R.; Bulle, M.; Wany, A.; Gupta, K.J. An overview of important enzymes involved in nitrogen assimilation of plants. Nitrogen Metab. Plants Methods Protoc. 2020, 2057, 1–13. [Google Scholar]
- Kafle, A.; Khatri, S.; Budhathoki, B.; Bipana, K.C.; Bhusal, T.N. Graded level of nitrogen and mulching effect on growth and yield parameters of tomato in Arghakhanchi, Nepal. Arch. Agric. Environ. Sci. 2023, 8, 68–74. [Google Scholar] [CrossRef]
- Parisi, M.; Burato, A.; Pentangelo, A.; Ronga, D. Towards the Optimal Mineral N Fertilization for Improving Peeled Tomato Quality Grown in Southern Italy. Horticulturae 2022, 8, 697. [Google Scholar] [CrossRef]
- Pavlou, M.; Ambler, G.; Seaman, S.; De Iorio, M.; Omar, R.Z. Review and evaluation of penalised regression methods for risk prediction in low-dimensional data with few events. Stat. Med. 2016, 35, 1159–1177. [Google Scholar] [CrossRef] [PubMed]
- Wang, Y.; Kang, S.; Li, F.; Zhang, X. Modified water-nitrogen productivity function based on response of water sensitive index to nitrogen for hybrid maize under drip fertigation. Agric. Water Manag. 2021, 245, 106566. [Google Scholar] [CrossRef]
- Xiao, Z.; Jiang, W.; Yu, H.; Wang, M.; Li, P.J.A.H. Substrate Water Content and Nitrogen Interactions in Growing Media: Yield, Fruit Quality, Water Consumption and Water Use Efficiency on Tomato. Acta Hortic 2009, 843, 57–64. [Google Scholar] [CrossRef]
- Jiang, X.; Zhao, Y.; Wang, R.; Zhao, S. Modeling the Relationship of Tomato Yield Parameters with Deficit Irrigation at Different Growth Stages. HortScience 2019, 54, 1492–1500. [Google Scholar] [CrossRef]


| Irrigation (mm) | Nitrogen (g/m2) | Evapotranspiration (mm) | |||||||||||
|---|---|---|---|---|---|---|---|---|---|---|---|---|---|
| Transplant | Stage I | Stage II | Stage III | Total | Stage I | Stage II | Total | Stage I | Stage II | Stage III | Total | ||
| First season | T1(CK) | 20.0 (1) | 10.0 (1) | 180.0 (6) | 50.0 (2) | 260.0 (10) | 2.7 (1) | 12.0 (2) | 14.7 (3) | 55.61 ± 3.07 a | 164.09 ± 1.38 a | 79.71 ± 1.58 a | 299.41 ± 0.11 a |
| T2 | 20.0 (1) | 10.0 (1) | 180.0 (6) | 50.0 (2) | 260.0 (10) | 1.8 (1) | 8.0 (2) | 9.8 (3) | 55.46 ± 2.54 a | 157.51 ± 1.84 b | 88.02 ± 1.66 b | 300.99 ± 2.72 a | |
| T3 | 20.0 (1) | 10.0 (1) | 180.0 (6) | 50.0 (2) | 260.0 (10) | 0.9 (1) | 4.0 (2) | 4.9 (3) | 53.73 ± 3.44 a | 153.47 ± 2.11 bc | 81.24 ± 2.35 b | 288.44 ± 3.68 ab | |
| T4 | 20.0 (1) | 10.0 (1) | 180.0 (6) | 50.0 (2) | 260.0 (10) | - | - | 0.0 (0) | 56.13 ± 0.46 a | 150.11 ± 2.84 c | 76.08 ± 2.56 b | 282.33 ± 4.95 b | |
| T5 | 20.0 (1) | 6.7 (1) | 120.0 (6) | 33.3 (2) | 180.0 (10) | 2.7 (1) | 12.0 (2) | 14.7 (3) | 54.68 ± 4.41 a | 125.40 ± 1.88 d | 65.72 ± 3.02 c | 245.79 ± 9.31 c | |
| T6 | 20.0 (1) | 6.7 (1) | 120.0 (6) | 33.3 (2) | 180.0 (10) | 1.8 (1) | 8.0 (2) | 9.8 (3) | 52.50 ± 1.01 a | 123.82 ± 3.40 d | 66.93 ± 1.54 c | 243.26 ± 3.94 c | |
| T7 | 20.0 (1) | 6.7 (1) | 120.0 (6) | 33.3 (2) | 180.0 (10) | 0.9 (1) | 4.0 (2) | 4.9 (3) | 58.03 ± 0.24 a | 119.54 ± 2.33 d | 62.33 ± 0.16 c | 239.89 ± 2.74 c | |
| T8 | 20.0 (1) | 6.7 (1) | 120.0 (6) | 33.3 (2) | 180.0 (10) | - | - | 0.0 (0) | 54.11 ± 1.43 a | 109.15 ± 0.99 e | 61.78 ± 0.93 c | 225.05 ± 1.37 d | |
| T9 | 20.0 (1) | 3.5 (1) | 63.0 (6) | 16.7 (2) | 103.2 (10) | 2.7 (1) | 12.0 (2) | 14.7 (3) | 57.05 ± 1.07 a | 94.50 ± 1.69 f | 53.05 ± 1.50 d | 204.59 ± 2.11 e | |
| T10 | 20.0 (1) | 3.5 (1) | 63.0 (6) | 16.7 (2) | 103.2 (10) | 1.8 (1) | 8.0 (2) | 9.8 (3) | 52.81 ± 1.47 a | 93.04 ± 0.18 f | 44.98 ± 2.12 e | 190.83 ± 3.41 f | |
| T11 | 20.0 (1) | 3.5 (1) | 63.0 (6) | 16.7 (2) | 103.2 (10) | 0.9 (1) | 4.0 (2) | 4.9 (3) | 55.16 ± 0.71 a | 84.96 ± 0.95 g | 41.15 ± 0.17 e | 181.28 ± 1.49 fg | |
| T12 | 20.0 (1) | 3.5 (1) | 63.0 (6) | 16.7 (2) | 103.2 (10) | - | - | 0.0 (0) | 51.99 ± 2.22 a | 82.36 ± 0.30 g | 39.42 ± 0.80 e | 173.77 ± 2.72 g | |
| Second season | T1(CK) | 20.0 (1) | 20.0 (2) | 100.0 (5) | 40.0 (2) | 180.0 (10) | 9.3 (1) | 11.4 (3) | 20.7 (4) | 66.01 ± 0.36 a | 116.42 ± 0.07 a | 57.37 ± 3.05 a | 239.80 ± 3.33 a |
| T2 | 20.0 (1) | 20.0 (2) | 100.0 (5) | 40.0 (2) | 180.0 (10) | 9.3 (1) | 7.6 (3) | 16.9 (4) | 64.50 ± 1.98 a | 110.89 ± 0.55 a | 54.20 ± 0.92 ab | 229.59 ± 0.51 ab | |
| T3 | 20.0 (1) | 20.0 (2) | 100.0 (5) | 40.0 (2) | 180.0 (10) | 9.3 (1) | 3.8 (3) | 13.1 (4) | 62.27 ± 4.62 a | 109.59 ± 3.11 a | 53.59 ± 0.24 b | 225.45 ± 7.49 b | |
| T4 | 20.0 (1) | 20.0 (2) | 100.0 (5) | 40.0 (2) | 180.0 (10) | 9.3 (1) | - | 9.3 (1) | 65.14 ± 0.14 a | 99.11 ± 2.09 b | 47.61 ± 0.34 c | 212.01 ± 2.43 c | |
| T5 | 20.0 (1) | 14.0 (2) | 70.0 (5) | 32.0 (2) | 136.0 (10) | 8.2 (1) | 11.4 (3) | 19.6 (4) | 66.80 ± 0.89 a | 90.10 ± 2.06 bc | 49.55 ± 0.12 c | 206.46 ± 1.06 c | |
| T6 | 20.0 (1) | 14.0 (2) | 70.0 (5) | 32.0 (2) | 136.0 (10) | 8.2 (1) | 7.6 (3) | 15.8 (4) | 61.26 ± 3.82 a | 95.69 ± 3.58 bc | 49.74 ± 0.04 c | 206.69 ± 0.20 c | |
| T7 | 20.0 (1) | 14.0 (2) | 70.0 (5) | 32.0 (2) | 136.0 (10) | 8.2 (1) | 3.8 (3) | 12.0 (4) | 69.44 ± 2.02 a | 93.30 ± 1.26 c | 42.77 ± 1.20 d | 205.51 ± 0.44 c | |
| T8 | 20.0 (1) | 14.0 (2) | 70.0 (5) | 32.0 (2) | 136.0 (10) | 8.2 (1) | - | 8.2 (1) | 60.63 ± 3.37 a | 81.54 ± 4.96 d | 41.39 ± 0.93 d | 183.56 ± 7.40 d | |
| T9 | 20.0 (1) | 8.0 (2) | 40.0 (5) | 16.0 (2) | 84.0 (10) | 8.2 (1) | 11.4 (3) | 19.6 (4) | 66.84 ± 6.06 a | 76.67 ± 3.31 d | 39.65 ± 1.14 de | 183.16 ± 8.23 d | |
| T10 | 20.0 (1) | 8.0 (2) | 40.0 (5) | 16.0 (2) | 84.0 (10) | 8.2 (1) | 7.6 (3) | 15.8 (4) | 65.08 ± 1.35 a | 76.04 ± 2.10 d | 36.63 ± 0.65 e | 177.75 ± 2.80 d | |
| T11 | 20.0 (1) | 8.0 (2) | 40.0 (5) | 16.0 (2) | 84.0 (10) | 8.2 (1) | 3.8 (3) | 12.0 (4) | 64.96 ± 1.56 a | 75.06 ± 1.23 d | 36.75 ± 0.38 e | 176.77 ± 2.41 d | |
| T12 | 20.0 (1) | 8.0 (2) | 40.0 (5) | 16.0 (2) | 84.0 (10) | 8.2 (1) | - | 8.2 (1) | 67.39 ± 0.62 a | 62.40 ± 0.21 e | 31.71 ± 0.85 f | 161.49 ± 0.44 e | |
| Equation | S-CWPFs: f(ETi) | Form 2: f(ETi·Ni) | Equation | Form 3: f(ETi)·f(N) |
|---|---|---|---|---|
| Jensen | Sigmoid | |||
| Minhas | Log | |||
| Rao | Exp | |||
| Blank | Root | |||
| Stewart | Line (1) | |||
| Singh | Sqrt (2) |
| First Season | Second Season | |||||||
|---|---|---|---|---|---|---|---|---|
| Treatment | Yield (t·ha−1) | Q (a.u.) | SAR (ratio) | Lyc (mg·kg−1) | Yield (t·ha−1) | Q (a.u.) | SAR (ratio) | Lyc (mg·kg−1) |
| T1(CK) | 66.09 a | 0.344 | 10.54 d | 26.40 a | 59.92 a | 0.404 | 11.76 d | 46.08 a |
| T2 | 66.46 a | 0.392 | 14.01 cd | 24.00 a | 57.55 ab | 0.446 | 15.09 bc | 44.01 ab |
| T3 | 65.33 a | 0.403 | 16.53 bcd | 22.03 a | 54.32 ab | 0.464 | 12.65 d | 40.83 abc |
| T4 | 58.79 ab | 0.182 | 12.93 cd | 17.11 a | 56.97 ab | 0.353 | 13.76 cd | 30.06 bc |
| T5 | 68.28 a | 0.388 | 15.83 bcd | 23.76 a | 49.36 abc | 0.470 | 11.46 d | 35.10 abc |
| T6 | 63.84 a | 0.421 | 15.34 bcd | 20.20 a | 56.86 ab | 0.575 | 15.62 abc | 37.12 abc |
| T7 | 48.23 bc | 0.364 | 20.00 bc | 18.46 a | 51.77 abc | 0.598 | 15.15 bc | 35.67 abc |
| T8 | 47.98 bc | 0.445 | 21.97 ab | 20.70 a | 42.14 bc | 0.414 | 16.46 ab | 31.39 abc |
| T9 | 40.23 c | 0.599 | 18.90 bc | 20.84 a | 53.85 abc | 0.641 | 17.83 a | 29.25 bc |
| T10 | 38.48 c | 0.770 | 22.59 ab | 27.20 a | 56.79 ab | 0.563 | 16.94 ab | 30.84 bc |
| T11 | 35.08 c | 0.438 | 18.35 bc | 17.01 a | 41.46 bc | 0.510 | 17.89 a | 29.97 bc |
| T12 | 34.32 c | 0.513 | 28.63 a | 13.63 a | 38.00 c | 0.401 | 16.46 ab | 27.86 c |
| Object | Model | Coefficient | R2 | Sig. | |||||
|---|---|---|---|---|---|---|---|---|---|
| a/b/λ/K1 | a/b/λ/K2 | a/b/λ/K3 | d/a | e/b | f/c | ||||
| Y | F1: BQ | −8.31 | 0.46 | 2.44 | 14.02 | −2.65 | −4.87 | 0.44 | 0.02 * |
| F1: CF | 103.50 | −140.07 | 46.33 | 0.89 | 0.00 ** | ||||
| −172.39 | 228.68 | −73.20 | |||||||
| 70.92 | −92.00 | 29.23 | |||||||
| F2: Jensen | 0.12 | 0.07 | 0.22 | 0.41 | 0.06 ns | ||||
| F2: Minhas | 1.52 | 0.16 | 0.58 | 0.41 | 0.06 ns | ||||
| F2: Rao | 0.08 | 0.09 | 0.33 | 0.55 | 0.01 * | ||||
| F2: Blank | 0.74 | 0.05 | 0.24 | 0.53 | 0.01 * | ||||
| F2: Stewart | 0.10 | 0.08 | 0.31 | 0.57 | 0.00 ** | ||||
| F2: Singh | 0.20 | 0.15 | 0.63 | 0.57 | 0.00 ** | ||||
| F3: Rao-Sig | −0.33 | 1.17 | −1.34 | 3.05 | 1.17 | 0.48 | 0.75 | 0.00 ** | |
| F3: Rao-Log | −0.31 | 1.16 | −1.30 | 0.82 | 2.14 | −0.07 | 0.75 | 0.00 ** | |
| F3: Rao-Exp | −0.33 | 1.17 | −1.35 | 0.33 | −0.31 | 0.00 | 0.75 | 0.00 ** | |
| F3: Rao-Rot | −0.29 | 1.14 | −1.26 | 0.49 | 0.52 | 0.74 | 0.00 ** | ||
| F3: Rao-1 | −0.32 | 1.16 | −1.32 | 0.31 | 0.71 | 0.75 | 0.00 ** | ||
| F3: Rao-2 | −0.34 | 1.17 | −1.36 | 0.08 | 0.19 | 0.74 | 0.75 | 0.00 ** | |
| F3: Sin-Sig | −0.04 | 1.15 | −0.79 | 8.99 | 1.02 | 0.43 | 0.73 | 0.00 ** | |
| F3: Sin-Log | −0.16 | 3.92 | −2.65 | 0.58 | 2.00 | −0.03 | 0.72 | 0.00 ** | |
| F3: Sin-Exp | −0.03 | 0.85 | −0.59 | 0.59 | 0.27 | 2.09 | 0.73 | 0.00 ** | |
| F3: Sin-Rot | −0.04 | 0.87 | −0.58 | 1.71 | 2.29 | 0.72 | 0.00 ** | ||
| F3: Sin-1 | −0.48 | −0.48 | 1.19 | −0.07 | 4.27 | 0.43 | 0.02 * | ||
| F3: Sin-2 | −0.03 | 0.92 | −0.64 | 0.64 | 0.24 | 3.40 | 0.73 | 0.00 ** | |
| Q | F1: BQ | 20.44 | −2.98 | −6.14 | −33.36 | 10.36 | 12.67 | 0.38 | 0.03 * |
| F1: CF | 338.19 | −441.53 | 117.19 | 0.97 | 0.00 ** | ||||
| −590.94 | 770.48 | −206.38 | |||||||
| 252.71 | −328.09 | 89.37 | |||||||
| F2: Jensen | −1.17 | −0.02 | −0.46 | 0.52 | 0.03 * | ||||
| F2: Minhas | −8.45 | −0.09 | −1.37 | 0.38 | 0.07 ns | ||||
| F2: Rao | −1.11 | −0.05 | −0.68 | 0.10 | 0.32 ns | ||||
| F2: Blank | 2.47 | −0.10 | −1.13 | 0.04 | 0.51 ns | ||||
| F2: Stewart | −1.25 | −0.04 | −0.76 | 0.12 | 0.28 ns | ||||
| F2: Singh | 3.30 | 0.01 | −2.09 | 0.01 | 0.80 ns | ||||
| F3: Rao-Sig | −0.69 | 1.00 | −3.84 | 1.03 | 2.25 | 6.77 | 0.81 | 0.00 ** | |
| F3: Rao-Log | −0.85 | 1.16 | −4.81 | 1.84 | 1.47 | −0.15 | 0.78 | 0.00 ** | |
| F3: Rao-Exp | −0.86 | 1.19 | −4.96 | 0.03 | 3.09 | −21.66 | 0.77 | 0.00 ** | |
| F3: Rao-Rot | −0.85 | 1.16 | −4.81 | 1.09 | −0.06 | 0.79 | 0.00 ** | ||
| F3: Rao-1 | −0.86 | 1.19 | −4.96 | 0.66 | 0.38 | 0.77 | 0.00 ** | ||
| F3: Rao-2 | −0.64 | 1.03 | −4.02 | −1.23 | 2.36 | −0.11 | 0.80 | 0.00 ** | |
| F3: Sin-Sig | 1.52 | −0.31 | −0.60 | 1.97 | 7.45 | 19.76 | 0.59 | 0.00 ** | |
| F3: Sin-Log | 0.07 | −0.01 | −0.03 | 21.17 | −8.85 | 43.42 | 0.59 | 0.00 ** | |
| F3: Sin-Exp | 3.70 | 4.66 | −6.85 | 0.02 | 3.02 | −20.08 | 0.40 | 0.03 * | |
| F3: Sin-Rot | 0.61 | 0.70 | −1.07 | 4.56 | 0.75 | 0.43 | 0.02 * | ||
| F3: Sin-1 | −0.52 | −0.52 | 1.29 | −0.07 | 3.95 | 0.03 | 0.62 ns | ||
| F3: Sin-2 | 3.34 | −1.03 | −0.95 | −1.96 | 3.18 | −0.36 | 0.57 | 0.00 ** | |
| SAR | F1: BQ | 6.86 | −1.46 | 1.62 | −16.48 | 0.41 | 10.17 | 0.57 | 0.00 ** |
| F1: CF | −6.62 | 72.05 | −45.86 | 0.90 | 0.00 ** | ||||
| −15.98 | −82.99 | 62.46 | |||||||
| 16.39 | 20.94 | −19.39 | |||||||
| F2: Jensen | −0.40 | −0.03 | −0.71 | 0.67 | 0.01 * | ||||
| F2: Minhas | −5.34 | −0.08 | −2.09 | 0.66 | 0.01 * | ||||
| F2: Rao | −0.14 | −0.09 | −1.03 | 0.59 | 0.00 ** | ||||
| F2: Blank | 2.76 | −0.16 | −1.43 | 0.15 | 0.22 ns | ||||
| F2: Stewart | −0.22 | −0.08 | −1.13 | 0.61 | 0.00 ** | ||||
| F2: Singh | 4.25 | −0.03 | −3.07 | 0.38 | 0.03 * | ||||
| F3: Rao-Sig | −1.16 | 0.53 | −2.16 | 0.99 | −109.29 | −64.83 | 0.71 | 0.00 ** | |
| F3: Rao-Log | −1.44 | 0.64 | −2.73 | 0.56 | 3.10 | −0.31 | 0.77 | 0.00 ** | |
| F3: Rao-Exp | −1.44 | 0.64 | −2.73 | 0.02 | 2.23 | −8.44 | 0.77 | 0.00 ** | |
| F3: Rao-Rot | −1.44 | 0.63 | −2.71 | 0.27 | 0.73 | 0.77 | 0.00 ** | ||
| F3: Rao-1 | −1.44 | 0.64 | −2.73 | 0.16 | 0.84 | 0.77 | 0.00 ** | ||
| F3: Rao-2 | −1.29 | 0.50 | −2.32 | −0.60 | 0.99 | 0.59 | 0.78 | 0.00 ** | |
| F3: Sin-Sig | 1.26 | −0.10 | −0.68 | 2.48 | −87.07 | −84.48 | 0.54 | 0.01 * | |
| F3: Sin-Log | 0.05 | 0.02 | −0.05 | 3.8 × 10⁶ | −1.5 × 10⁶ | 62.27 | 0.54 | 0.01 * | |
| F3: Sin-Exp | 5.80 | 2.55 | −6.37 | 0.00 | 2.57 | −12.56 | 0.52 | 0.01 * | |
| F3: Sin-Rot | 1.10 | 0.48 | −1.21 | 0.34 | 2.80 | 0.52 | 0.01 * | ||
| F3: Sin-1 | −0.39 | −0.39 | 0.96 | −0.09 | 5.30 | 0.53 | 0.01 * | ||
| F3: Sin-2 | 1.32 | −0.63 | −0.24 | −3.52 | 4.97 | 0.94 | 0.60 | 0.00 ** | |
| Lyc | F1: BQ | 1.69 | −0.40 | −0.49 | −2.09 | 1.39 | 0.87 | 0.50 | 0.01 * |
| F1: CF | −17.44 | 34.09 | −14.15 | 0.99 | 0.00 ** | ||||
| 21.32 | −43.59 | 19.37 | |||||||
| −6.51 | 13.93 | −6.02 | |||||||
| F2: Jensen | 0.77 | −0.03 | 0.83 | 0.94 | 0.00 ** | ||||
| F2: Minhas | 6.09 | 0.04 | 2.46 | 0.84 | 0.00 ** | ||||
| F2: Rao | 0.79 | −0.04 | 0.84 | 0.73 | 0.00 ** | ||||
| F2: Blank | 0.14 | −0.04 | 0.85 | 0.76 | 0.00 ** | ||||
| F2: Stewart | 0.74 | −0.03 | 0.79 | 0.73 | 0.00 ** | ||||
| F2: Singh | −1.18 | −0.03 | 2.09 | 0.54 | 0.01 * | ||||
| F3: Rao-Sig | −0.12 | 0.52 | 0.33 | 0.93 | 3.96 | 15.09 | 0.88 | 0.00 ** | |
| F3: Rao-Log | −0.16 | 0.64 | 0.20 | 0.31 | 2.12 | 0.06 | 0.86 | 0.00 ** | |
| F3: Rao-Exp | −0.15 | 0.64 | 0.21 | 0.05 | 0.96 | −1.80 | 0.86 | 0.00 ** | |
| F3: Rao-Rot | −0.16 | 0.64 | 0.21 | 0.22 | 0.73 | 0.86 | 0.00 ** | ||
| F3: Rao-1 | −0.15 | 0.64 | 0.21 | 0.13 | 0.82 | 0.86 | 0.00 ** | ||
| F3: Rao-2 | 0.07 | 0.45 | 0.42 | −0.74 | 1.15 | 0.51 | 0.88 | 0.00 ** | |
| F3: Sin-Sig | −0.23 | 0.79 | −0.22 | 2.68 | 0.08 | 4.22 | 0.73 | 0.00 ** | |
| F3: Sin-Log | −0.04 | 0.16 | −0.05 | 342.40 | −109.84 | 7.99 | 0.73 | 0.00 ** | |
| F3: Sin-Exp | −1.70 | 7.70 | −3.36 | 0.01 | 1.98 | −6.95 | 0.72 | 0.00 ** | |
| F3: Sin-Rot | −0.20 | 0.88 | −0.36 | 1.22 | 1.70 | 0.72 | 0.00 ** | ||
| F3: Sin-1 | −0.59 | −0.59 | 1.47 | −0.06 | 3.46 | 0.55 | 0.01 * | ||
| F3: Sin-2 | −0.37 | 1.27 | −0.34 | −0.72 | 1.41 | 0.92 | 0.73 | 0.00 ** | |
| Object | Index | BQ | CF | Jensen | Minhas | Rao | Blank | Stewart | Singh | Rao-Sig | Rao-Log | Rao-Exp | Rao-Rot | Rao-1 | Rao-2 | Sin-Sig | Sin-Log | Sin-Exp | Sin-Rot | Sin-1 | Sin-2 |
|---|---|---|---|---|---|---|---|---|---|---|---|---|---|---|---|---|---|---|---|---|---|
| Y | R2 | 0.65 | 0.02 | 0.30 | 0.19 | 0.29 | 0.13 | 0.27 | 0.33 | 0.52 | 0.50 | 0.52 | 0.37 | 0.51 | 0.53 | 0.68 | 0.67 | 0.69 | 0.52 | 0.69 | 0.71 |
| MAE | 0.18 | 0.35 | 0.15 | 0.28 | 0.15 | 0.26 | 0.16 | 0.18 | 0.13 | 0.13 | 0.13 | 0.17 | 0.13 | 0.12 | 0.10 | 0.10 | 0.10 | 0.13 | 0.14 | 0.10 | |
| RMSE | 0.21 | 0.59 | 0.18 | 0.36 | 0.18 | 0.33 | 0.19 | 0.22 | 0.15 | 0.16 | 0.15 | 0.20 | 0.15 | 0.15 | 0.12 | 0.12 | 0.12 | 0.16 | 0.17 | 0.11 | |
| RE | 0.26 | 0.56 | 0.48 | 0.61 | 0.20 | 0.29 | 0.20 | 0.21 | 0.15 | 0.16 | 0.15 | 0.21 | 0.16 | 0.15 | 0.13 | 0.13 | 0.13 | 0.17 | 0.21 | 0.13 | |
| GPI | 12 | 20 | 17 | 18 | 15 | 19 | 16 | 14 | 7 | 9 | 6 | 13 | 8 | 5 | 3 | 4 | 2 | 10 | 11 | 1 | |
| Q | R2 | 0.45 | 0.09 | 0.03 | 0.05 | 0.04 | 0.14 | 0.03 | 0.48 | 0.27 | 0.25 | 0.26 | 0.19 | 0.26 | 0.21 | 0.21 | 0.41 | 0.27 | 0.17 | 0.33 | 0.14 |
| MAE | 0.66 | 1.20 | 2.28 | 178.64 | 1.20 | 0.49 | 0.96 | 0.26 | 0.55 | 0.52 | 0.47 | 0.61 | 0.47 | 0.62 | 0.59 | 0.23 | 0.34 | 0.45 | 0.57 | 0.65 | |
| RMSE | 0.89 | 2.32 | 3.47 | 330.68 | 1.56 | 0.58 | 1.21 | 0.33 | 0.67 | 0.62 | 0.56 | 0.76 | 0.56 | 0.78 | 0.74 | 0.33 | 0.42 | 0.59 | 0.79 | 0.93 | |
| RE | 0.60 | 0.97 | 1.94 | 112.76 | 1.23 | 0.51 | 0.98 | 0.32 | 0.44 | 0.41 | 0.35 | 0.50 | 0.35 | 0.51 | 0.49 | 0.23 | 0.25 | 0.35 | 0.42 | 0.57 | |
| GPI | 5 | 7 | 14 | 6 | 18 | 20 | 19 | 2 | 11 | 12 | 8 | 17 | 9 | 16 | 15 | 1 | 3 | 10 | 4 | 13 | |
| SAR | R2 | 0.57 | 0.23 | 0.23 | 0.07 | 0.33 | 0.00 | 0.33 | 0.26 | 0.61 | 0.41 | 0.42 | 0.26 | 0.42 | 0.10 | 0.62 | 0.52 | 0.43 | 0.35 | 0.49 | 0.01 |
| MAE | 0.38 | 0.68 | 1.09 | 55.28 | 0.34 | 0.68 | 0.33 | 0.45 | 0.48 | 0.55 | 0.54 | 0.58 | 0.54 | 0.63 | 0.40 | 0.42 | 0.45 | 0.47 | 0.92 | 0.64 | |
| RMSE | 0.49 | 0.96 | 1.67 | 107.96 | 0.47 | 0.84 | 0.44 | 0.53 | 0.57 | 0.64 | 0.64 | 0.70 | 0.64 | 0.77 | 0.50 | 0.51 | 0.55 | 0.57 | 1.15 | 0.87 | |
| RE | 0.22 | 0.42 | 0.57 | 23.97 | 0.22 | 0.35 | 0.21 | 0.25 | 0.26 | 0.30 | 0.30 | 0.32 | 0.30 | 0.34 | 0.21 | 0.22 | 0.24 | 0.25 | 0.48 | 0.34 | |
| GPI | 2 | 17 | 15 | 14 | 7 | 20 | 6 | 12 | 3 | 10 | 8 | 16 | 9 | 19 | 1 | 4 | 5 | 11 | 13 | 18 | |
| Lyc | R2 | 0.57 | 0.29 | 0.32 | 0.23 | 0.46 | 0.36 | 0.51 | 0.26 | 0.51 | 0.34 | 0.33 | 0.42 | 0.33 | 0.50 | 0.54 | 0.26 | 0.43 | 0.51 | 0.13 | 0.53 |
| MAE | 0.15 | 0.23 | 0.36 | 0.46 | 0.41 | 0.31 | 0.61 | 0.30 | 0.27 | 0.10 | 0.10 | 0.10 | 0.10 | 0.16 | 0.18 | 0.15 | 0.14 | 0.16 | 0.21 | 0.17 | |
| RMSE | 0.21 | 0.35 | 0.44 | 0.57 | 0.48 | 0.36 | 0.75 | 0.39 | 0.36 | 0.15 | 0.15 | 0.16 | 0.15 | 0.20 | 0.23 | 0.19 | 0.18 | 0.20 | 0.27 | 0.21 | |
| RE | 0.21 | 0.31 | 0.40 | 0.50 | 0.55 | 0.48 | 0.86 | 0.61 | 0.37 | 0.12 | 0.12 | 0.13 | 0.12 | 0.20 | 0.24 | 0.19 | 0.17 | 0.21 | 0.28 | 0.21 | |
| GPI | 6 | 13 | 17 | 20 | 15 | 14 | 18 | 16 | 12 | 8 | 10 | 1 | 9 | 4 | 7 | 11 | 5 | 3 | 19 | 2 |
Disclaimer/Publisher’s Note: The statements, opinions and data contained in all publications are solely those of the individual author(s) and contributor(s) and not of MDPI and/or the editor(s). MDPI and/or the editor(s) disclaim responsibility for any injury to people or property resulting from any ideas, methods, instructions or products referred to in the content. |
© 2024 by the authors. Licensee MDPI, Basel, Switzerland. This article is an open access article distributed under the terms and conditions of the Creative Commons Attribution (CC BY) license (https://creativecommons.org/licenses/by/4.0/).
Share and Cite
Jiang, X.; Fan, M.; Wang, T.; Gong, S.; Hao, W.; Ye, Y.; Zhao, Y.; Cui, N.; Zhao, H.; Zhao, L. Modeling Tomato Yield and Quality Responses to Water and Nitrogen Deficits with a Modified Crop Water Production Function. Horticulturae 2024, 10, 898. https://doi.org/10.3390/horticulturae10090898
Jiang X, Fan M, Wang T, Gong S, Hao W, Ye Y, Zhao Y, Cui N, Zhao H, Zhao L. Modeling Tomato Yield and Quality Responses to Water and Nitrogen Deficits with a Modified Crop Water Production Function. Horticulturae. 2024; 10(9):898. https://doi.org/10.3390/horticulturae10090898
Chicago/Turabian StyleJiang, Xuelian, Mengying Fan, Tianci Wang, Shuai Gong, Wenya Hao, Yingxin Ye, Yueling Zhao, Ningbo Cui, Huan Zhao, and Lu Zhao. 2024. "Modeling Tomato Yield and Quality Responses to Water and Nitrogen Deficits with a Modified Crop Water Production Function" Horticulturae 10, no. 9: 898. https://doi.org/10.3390/horticulturae10090898