Article

Chlorine Dioxide Delays Enzymatic Browning in Postharvest Cherimoya and Enables Establishment of Kinetics Substrate Model

1
College of Light Industry and Food Engineering, Guangxi University, Nanning 530004, China
2
Guangxi Key Laboratory of Clean Pulp & Papermaking and Pollution Control, Nanning 530004, China
3
College of Material Science and Chemical Engineering, Chuzhou University, Chuzhou 239099, China
*
Authors to whom correspondence should be addressed.
Horticulturae 2024, 10(9), 901; https://doi.org/10.3390/horticulturae10090901
Submission received: 26 July 2024 / Revised: 20 August 2024 / Accepted: 23 August 2024 / Published: 26 August 2024

Abstract

:
Cherimoya (Annona squamosa L.) is a nutrient-rich fruit. However, it is not easy to store because of its susceptibility to browning. In order to prolong the storage period of cherimoya, the fruit was treated with chlorine dioxide (ClO2) at different concentrations (20, 40, 60, 80, and 100 mg L−1) and stored at 15 °C for 8 days. The quality and biochemical indexes of the fruit were investigated using a chromameter, high-performance liquid chromatography and scanning electron microscopy, etc. The results showed that all the treatments with various concentrations of ClO2 could delay the increase in the browning index, loss of weight, and decrease in hardness. Meanwhile, ClO2 treatment effectively reduced the consumption of starch, titratable acids, and phenolics as well as inhibited the polyphenol oxidase (PPO) activity and enzymatic oxidation. It can be seen from the Fourier transform infrared spectrum (FTIR) that the C=O stretching peak at 1731 cm−1 disappeared at a ClO2 concentration of 60 mg L−1. We think the ClO2 treatment may inhibit the oxidation of phenol to quinone. According to the Arrhenius formula, the values of the apparent activation energy (Ea) for enzymatic browning reaction were estimated. The Ea with catechol in cherimoya pericarp and flesh were 67.00 and 47.83 kJ mol−1, respectively. It was found that the phenolic enzyme reaction with catechol has a much smaller Ea and a higher affinity for PPO. Therefore, treatment with ClO2 at a suitable concentration for cherimoya stored at 15 °C could effectively maintain fruit quality and prolong the storage period; the most appropriate concentration is 60 mg L−1.

1. Introduction

The cherimoya is an edible fruit tree of the genus Annona belonging to the family Annonaceae. It is mostly present in tropical and subtropical world regions [1]. In China, it is mainly planted in Guangdong, Guangxi Province, among others; the total production is about 700,000 tons per year. This fruit contains large amounts of soluble sugars, organic acids, carbohydrates, and other nutrients. It is an important crop because of its high medicinal value. However, due to strong respiration and metabolism after harvesting, this fruit has a shelf life of only 2–3 days at 26–33 °C, after which the scales turn black, the stems fall off, and the flesh deteriorates. As a tropical fruit, cherimoya is highly sensitive to low temperatures. The optimum temperature for mid-ripening fruit is 15–18 °C, at which the shelf life can be extended to 5–6 days to maintain color, firmness, and flavor. Postharvest cherimoya respiration is related to quality and biochemical indexes such as firmness, organic acid, and phenolic compound content [2]. The firmness of cherimoya is very high at harvest. At maturity, the firmness begins to decrease; these increases in titratable acidity and sugar levels are observed during ripening, with fructose and glucose as the main sugars [2]. The hydrolysis of the starch during ripening is the principal source of the sugars. The total soluble solids’ concentration in the fruit is increased during this process. With fruit ripening, the total polyphenol content, ascorbic acid content and pH value decrease, and the browning degree increases. In fleshy fruit, chlorophyll breakdown is induced at the onset of ripening and its content may be negatively correlated with the degree of browning [3].
Enzymatic browning is mainly caused by PPO oxidizing endogenous phenols to quinones, which further polymerize to form melanin leading to blackening [4]. It is estimated that approximately 50% of fruits and vegetables are wasted each year due to enzymatic browning caused by PPO [5]. About 28 to 35% of cherimoya is lost annually due to enzymatic browning. Techniques such as modified atmosphere packaging, complex coating, oxalic acid coating, and chitosan coating have been reported to slow cherimoya browning and reduce quality degradation [6]. The chitosan-based edible coating containing ascorbic acid could delay the deterioration of cherimoya quality by maintaining high titratable acidity, moisture content and antioxidant enzyme activities [7]. However, the existing information on postharvest ripening and preservation methods for cherimoya is limited, and developing appropriate technologies to reduce fruit browning is a challenge in postharvest research.
With the advantages of broad-spectrum, strong oxidation and green credentials, ClO2 is recognized by the World Health Organization (WHO) and Agriculture Organization (FAO) as a new multi-purpose disinfectant [8]. Furthermore, ClO2 is categorized by WHO as a Class A1 safe and efficient disinfectant because it does not produce organic chlorides and other harmful substances [8,9,10]. ClO2 can also reduce browning and prolong shelf life by reducing fruit pathogens and inhibiting the activities of key enzymes involved in crucial metabolic processes. Moreover, ClO2 can react with oxygenated compounds or proteins, resulting in oxidative damage to the cell membrane, and improving antioxidant capacity. Currently, aqueous ClO2 (powder, food grade) at concentrations of 50–200 mg L−1 is widely used to wash fruits and vegetables [11]. It can effectively reduce the counts of natural or inoculated microorganisms. The excellent performance of ClO2 in browning inhibition has been demonstrated for various fruit. Mulberry fruit were immersed in 20, 60, and 80 mg L−1 ClO2 solutions, to see if it could maintain the content of flavonoid, ascorbic acid, reducing sugar, and titratable acid. The shelf life of the samples treated with 60 mg L−1 ClO2 for 15 min was extended to 14 days [12]. Fresh-cut asparagus lettuce was treated with 10, 40, and 100 mg L−1 ClO2, and stored at 4 °C. The activities of PPO and peroxidase were reduced by ClO2, and the degradation of color was also delayed [13]. In grapes, repeated application of ClO2 during storage significantly decreased rachis browning [14]. In contrast, higher concentrations of ClO2 result in the bleaching of fresh fruit and vegetables. For example, after 8 days of storage at 2 °C, white damage was observed on the skin of ClO2-treated strawberries; it deteriorated the visual quality of fruit in terms of color and overall appearance [15].
Based on previous studies, a solution with different ClO2 concentrations (0–100 mg L−1) was prepared. The cherimoya was soaked and stored at the optimal temperature (15 °C) for 8 days. The objectives of this study were to (i) investigate the effects of ClO2 at 15 °C on the quality and biochemical changes in cherimoya toward a reduction in fruit browning and an increase in shelf life for this fruit; (ii) study the kinetics model to reveal the reaction substrates for enzymatic browning in cherimoya.

2. Materials and Methods

2.1. Plant Materials and Treatments

Cherimoya at the mid-ripening (green and firm) stage was purchased from Guangxi Nanning Hai Jixing Fruit Wholesale Market and selected Daimoku Cherimoya fruit. Measured quantities of 600, 1200, 1800, 2400, and 3000 mg of ClO2 powder (active ingredient 10%, Eslab Technology Development Co., Suzhou, China) were taken and dissolved in deionized water, fixed to 3 L, and prepared to the corresponding concentration. Fresh fruit of the same size and color, free of physical defects and mechanical damage, with an average weight of about 450 g (about 20% pericarp, 75% flesh, 5% seeds), were divided into six groups, and immersed in 20, 40, 60, 80, or 100 mg L−1 ClO2 for 20 min, while the control group was soaked in deionized water for 20 min. After removal from the solution, all fruits were dried at 25 °C for 25 min in air and stored at 15 °C (80 ± 5% RH, simulating the ripening period of cherimoya in September) for 8 days. During storage time, three fruits were taken every other day from the control group and each of five treatment groups. Each fruit was randomly sampled three times. The pericarp and flesh were cut into regular pieces, frozen in liquid nitrogen, and then kept at −40 °C for biochemical analysis. All experiments were repeated three times for each index and averaged.

2.2. Appearance

On days 0, 2, 4, 6, and 8, three fruits from each group were randomly selected for evaluation of pericarp color with a chromameter (Konica Minolta CR-400, Tokyo, Japan). The L* (brightness), a* (redness), and b* (yellowness) values of the cherimoya surface were measured, and the browning index (BI) was calculated using Equations (1) and (2).
X = a * + 1.75 L * / 5.645 L * + a * 3.012 b *
B I = 100 ( X 0.31 ) / 0.172

2.3. Weight Loss and Firmness

Each group has fifteen fruits; they were marked with labels. Three fruits were selected from each group and weighed every day. The weight loss was calculated and averaged. Weight loss was calculated using Equation (3).
W e i g h t   l o s s % = I n i t i a l   w e i g h t f i n a l   w e i g h t I n i t i a l   w e i g h t × 100
The fruit firmness of cherimoya was determined using the GY-4 Digital Fruit Firmness Tester (Lvbo Instruments Co., Ltd., Hangzhou, China). The measure was performed on the central zone of the sample with an 11 mm probe. Firmness was estimated from the mean of three different points. It was displayed automatically and expressed as Newton (N).

2.4. Starch and Total Sugar Content Measurements

All of the following measurements were repeated three times using samples at different locations on the fruit. Then the average was calculated as the final result.
The starch content was determined by the iodine colorimetric method. The total sugar content was determined using a 721E UV–Vis spectrophotometer 107 (Shanghai Guangpu Instruments Co., Ltd., Shanghai, China), according to the method of Jangir et al. [16] with some adjustments. A standard curve was drawn with glucose solutions of known concentrations. A piece of cherimoya flesh weighing 1 g was taken accurately and added to a 15 mL centrifuge tube, then 10 mL of deionized water was added and it was heated for 20 min in a boiling water bath. Then the mixture was centrifuged for 10 min (2200× g). The supernatant was extracted twice. All extracted supernatant was put into 50 mL volumetric flasks. This solution is marked solution A.
A sample of 100 µL of solution A and 3 mL of anthrone were taken respectively. Then they were mixed and heated for 10 min in a boiling water bath. After cooling, the absorbance at 620 nm was recorded. Total sugars were expressed as percentages and calculated using Equation (4).
T o t a l   s u g a r % = C × V A × W × 10 6 × 100
where C is the amount of sugar calculated from the standard curve (μg); V is the total volume of sample extract (mL); A is the amount of sample solution taken for chromogenic reaction (mL); W is the fresh weight of the sample (g).

2.5. Titratable Acid (TA) Content Measurements

The TA content was determined according to the method of Lin et al. [17]. A 2 g sample of pericarp with a thickness of about 3 mm was taken and put into a centrifuge tube. It was mixed with 10 mL of deionized water and placed in an ultrasonic bath for 30 min and then centrifuged at 14,800× g for 20 min. After filtering, 10 mL of 0.1 mol L−1 NaOH solution was titrated and 2 to 3 drops of phenolphthalein were added. When the solution turned pink and kept for 30 s, the amount of NaOH solution was recorded. The TA content of the pericarp was calculated using Equation (5). The TA content of flesh was calculated in the same way.
T A % = A × 0.1 × C × K W × D × 100 %
where A is the amount of NaOH consumed (mL); C is the total dilution (mL); K is the conversion of total acids to specific organic acid coefficients (Table 1); W is the weight of the sample (g); and D is the measured sample volume (mL).

2.6. Phenolic Compound Content Measurements

The phenolic compound content was determined using the method of Feumba Dibanda et al. [18], with a few modifications. The pericarp and flesh were taken as 1 g samples. They were mixed with 5 mL of a methanol/deionized water (70:30, v/v) solution, placed in an ultrasonic bath for 60 min, and centrifuged at 14,800× g for 10 min at 8 °C, respectively. The final extract was filtered through a 0.45 µm micropore membrane and stored at −20 °C for analyses. The extract was analyzed by high-performance liquid chromatography (HPLC 1200, Agilent Technologies, Santa Clara, CA, USA) and the separation was conducted using a column (5 µm, C18, 250 × 4.6 mm) operating at a flow rate of 1 mL min−1 at 30 °C. A chromatogram was obtained at 272 nm. The retention times and total areas under the peaks of standard substances (neohesperidin, epicatechin, p-hydroxybenzoic acid, and catechol) were used to identify and quantify each phenolic compound. The standard curves of the monophenol standards are shown in Table 2.

2.7. PPO Activity Assay

The pericarp and flesh samples were taken, 1 g of each. They were homogenized with 0.1 g of polyvinylpyrrolidone in 5 mL of 0.1 mmol L−1 phosphate buffer (pH = 6.5) and centrifuged at 10,000× g for 30 min at 4 °C. The supernatant was collected under 4 °C for analyses. The crude enzyme solution of PPO was obtained from the supernatant.
Enzyme activity was determined using a 721E UV–Vis spectrophotometer (Shanghai Guangpu Instruments Co., Ltd., Shanghai, China) according to Batista et al. [19]. Measures of 3.9 mL of phosphate buffer and 1 mL of 0.1 mol L−1 catechol solution were added to a test tube and heated for 10 min in a water bath at 37 °C. Then 0.1 mL of crude enzyme solution was added. After shaking well, it was poured into a colorimetric dish. The value of absorbance 410 was adjusted to zero. The absorbance values at the beginning and 3 min later were recorded.
One unit of PPO activity was defined as a 0.01 absorbance value change per minute at 410 nm under the assay conditions. The enzyme activity was calculated using Equation (6).
P P O   a c t i v i t y U g 1 h 1 F W = A 0.01 × T × W × V V 0
where ∆A is the change value of absorbance from 0 to 3 min; W is the fresh weight of the sample (g); T is the reaction time (min); V is the total volume of the extract (mL); V0 is the amount of enzyme solution to be measured (mL).

2.8. Morphological Observation and FTIR

To investigate the structures of the cherimoya pericarp and flesh, scanning electron microscopy (SEM) was used (JSM-6510, JEOL, Tokyo, Japan) at 20 kV. The unit of wavenumber is cm−1.
The pericarps treated with 0 and 60 mg L−1 ClO2 were characterized using an FTIR spectrometer (Nicolet 6700, Thermo Fisher, Waltham, MA, USA). For each sample, spectral data was collected in the 4000–400 cm−1 range.

2.9. Kinetic Model Statistical Analyses

The 5 mL of p-Hydroxybenzoic acid and catechol standards were homogeneously mixed with the PPO crude enzyme solution from the cherimoya pericarp and flesh, respectively, in test tubes and placed at 5, 10, 15, 20, 25, and 37 °C for simulated in vitro phenolic enzyme reactions. The reaction rate constant, k0, and k1, was estimated according to zero-order and first-order kinetic models, as described by Remini et al. [20]. The Arrhenius equation was used to calculate the Ea, and the main browning substrate in cherimoya pericarp and flesh was determined by comparing the activation energy values. The zero-order dynamics and first-order dynamics were calculated using Equations (7) and (8) respectively. The Arrhenius equation is shown in Equation (9) [20].
C = C 0 + k 0 t
C = C 0 e x p ( k 1 t )
k = A e E a R T
where C is the measurement of the index at any time; C0 is the starting value of the index; t is the reaction time (min); k0 and k1 are the reaction rate constants of zero-order kinetics and first-order kinetics, respectively; k is the reaction rate constant; A is a constant; Ea is the activation energy of the reaction (kJ mol−1); R is the gas constant with value of 8.314 (J mol−1 K−1); T is the reaction temperature (K).

2.10. Statistical Analysis

All experiments were replicated three times. Data were analyzed using SPSS version 22.0, expressed as means ± standard deviations, and examined using one-way analysis of variance (ANOVA). The means were separated using the Duncan multiple range test. Differences were considered statistically significant at p < 0.05. Graphs were generated using the Origin 2018 software (Origin Lab, Northampton, MA, USA).

3. Results

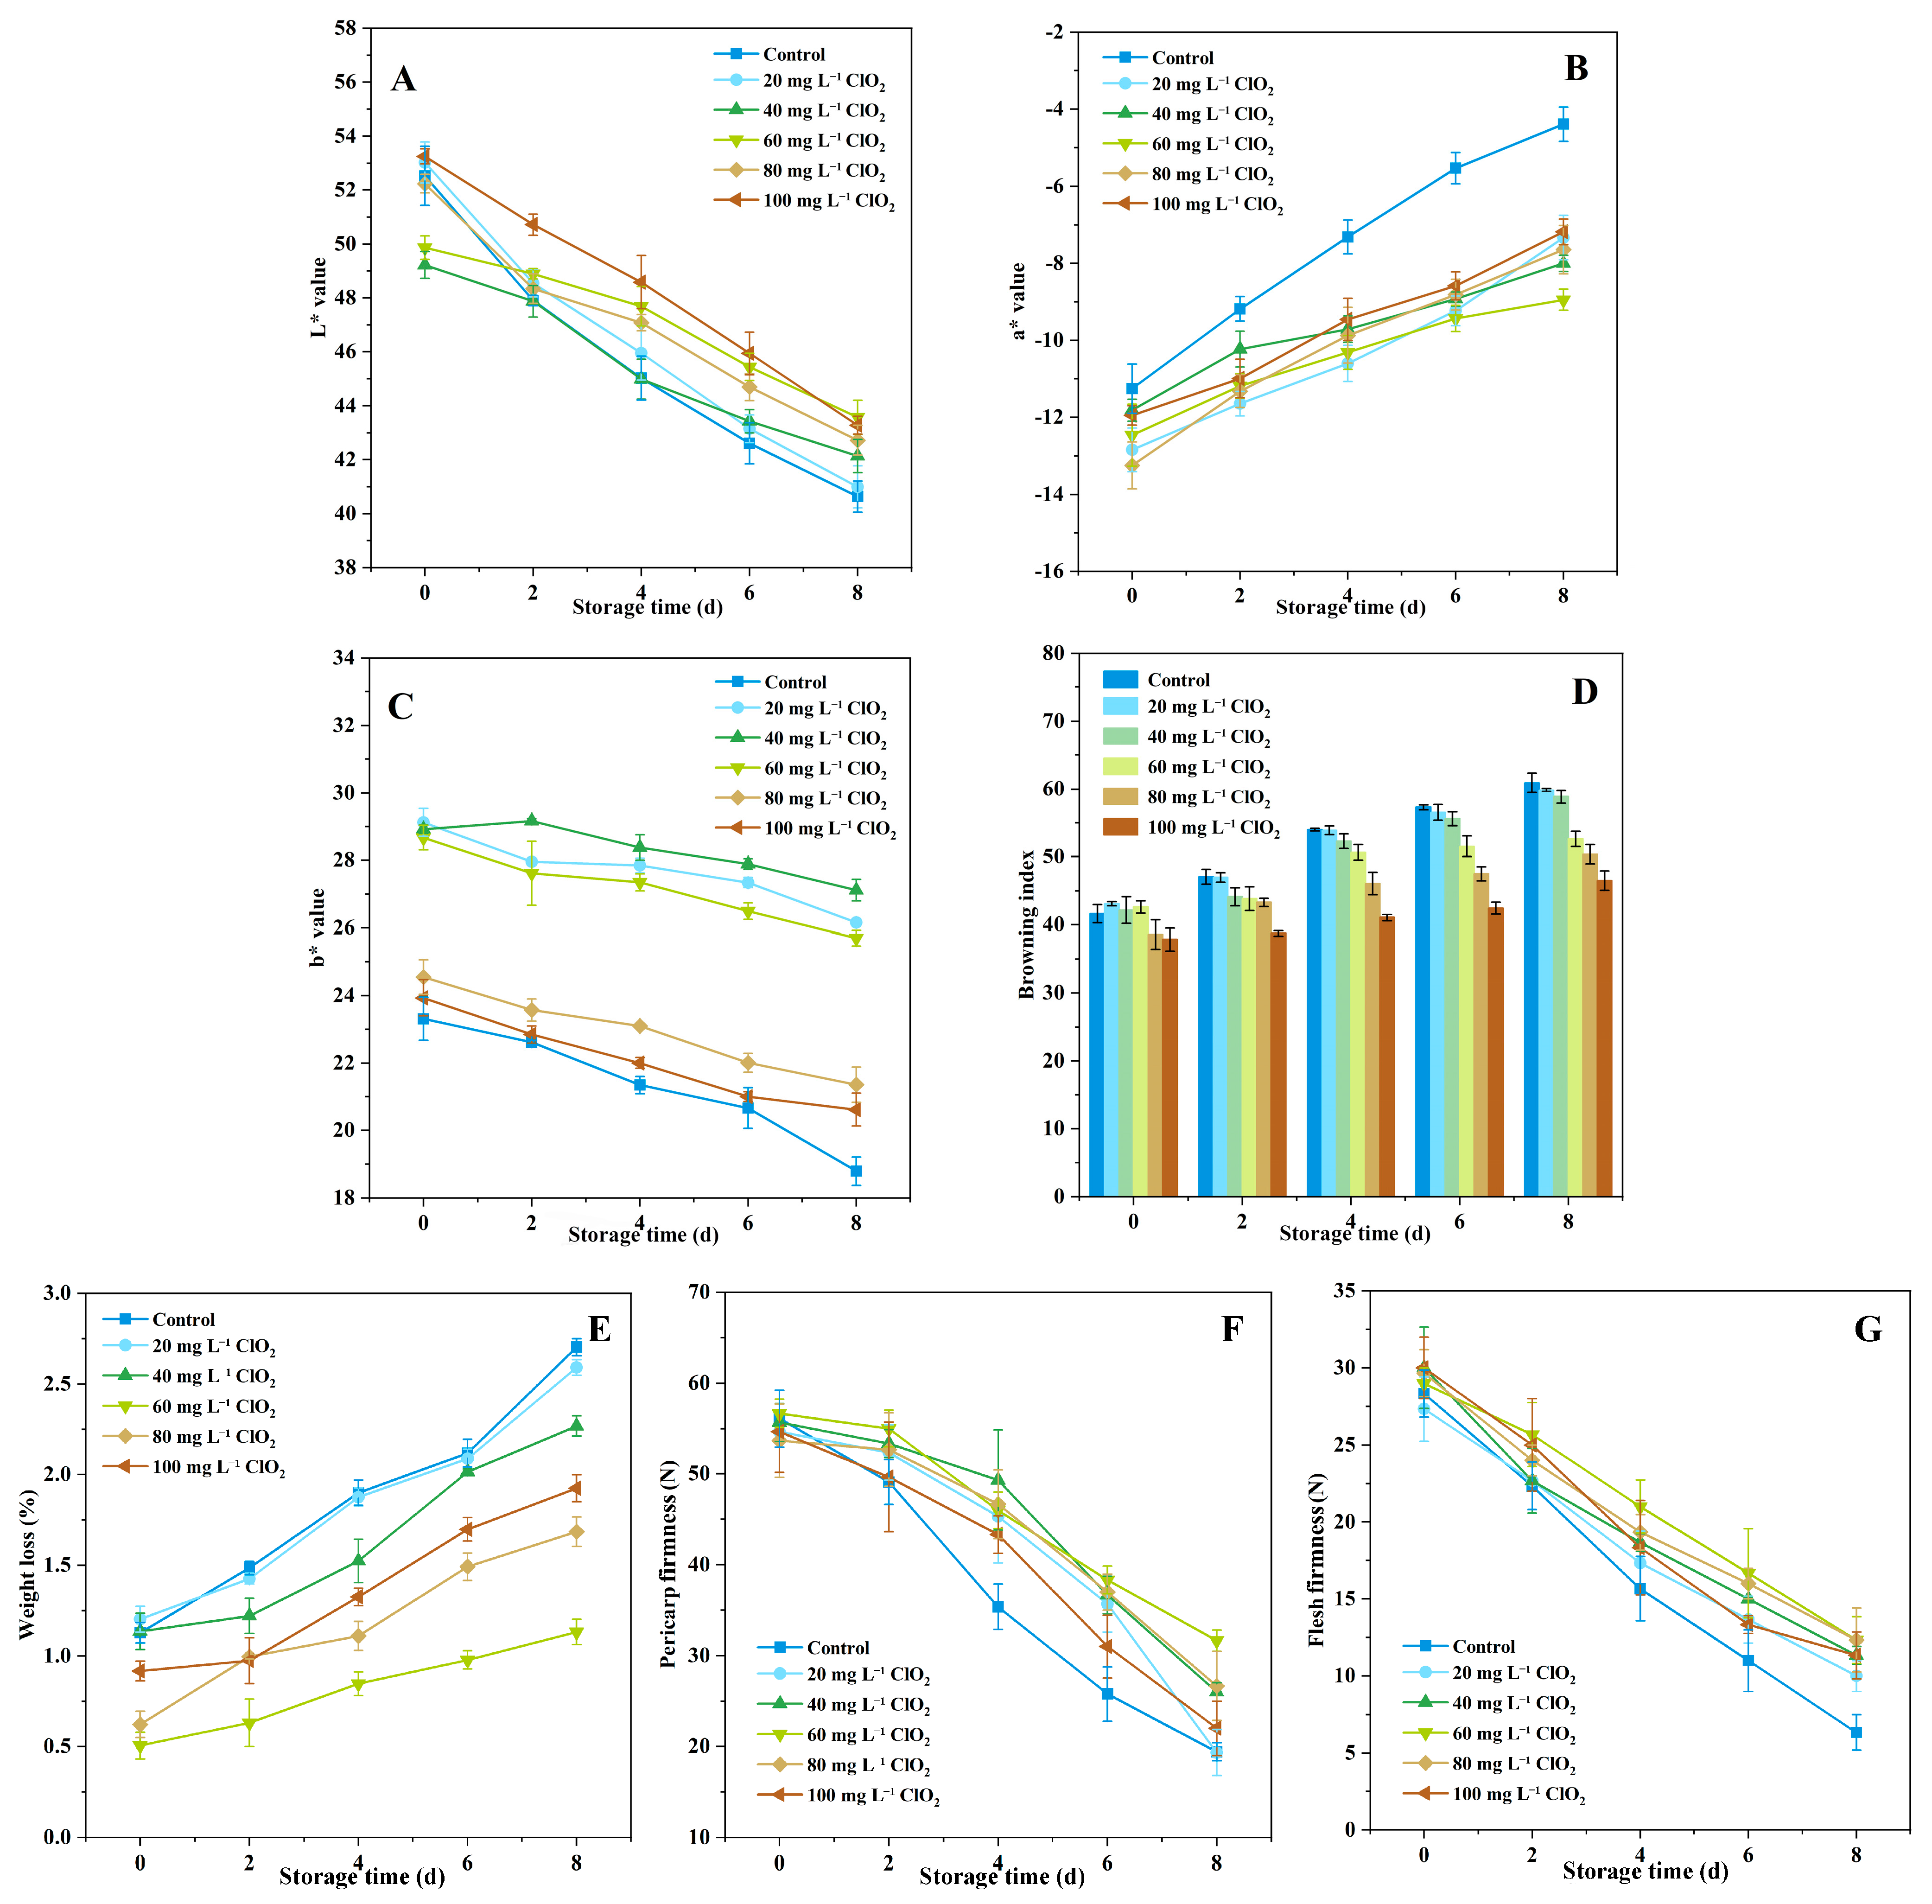
3.1. Cherimoya Appearance

As shown in Figure 1, the color of the cherimoya pericarp gradually changed from green to yellow and finally to brown. From Figure 1, we can see the fruit did not change significantly in appearance from day 0 to 2 and remained green, and little browning was observed; from day 4, each group began to show various degrees of browning. Browning began in the untreated sample (control) after day 4, while the pericarp turned significantly black on day 6 in the ClO2-treated group. When the sample was treated with 60 mg L−1 ClO2, the browning was not obvious (Figure 1D). In contrast, the samples treated with high concentrations (80 and 100 mg L−1) of ClO2 became lighter or white after day 4, and gradually increased with storage time (Figure 1E,F). This is due to the bleaching. Therefore, we think the 60 mg L−1 ClO2 was the best concentration to maintain the appearance of the fruit as observed by the naked eye (Figure 1D).
L* means brightness, a* means redness and greenness, while b* means yellowness and blueness. When L* and b* of the fruit decrease and a* gradually increases, it indicates that the pericarp is darkening and starting to yellow. As shown in Figure 2, the L* values of all samples, including that of the control, tended to decrease from the beginning of storage and the cherimoya darkened in color (Figure 2A). However, the ClO2-treated fruit showed higher L* values than that of the control during storage. The a* values during storage increased rapidly in the control sample and relatively slowly in the treated fruit (Figure 2B). Treated fruit had lower a* values than control fruit during storage. The b* values in all treatments showed a small decrease after day 8 of storage in comparison with the initial values (Figure 2C). The increase in the a* value and decrease in the b* value correspond to a change from green to yellow on the surface of the cherimoya over the storage time. BI reflects the degree of fruit browning. When the value is higher, the color change is more severe, indicating a decrease in fruit quality. The BI of all treatments was relatively stable during the first four days of storage and then gradually increased until the end of storage (Figure 2D). After day 8, the BI of the 60 mg L−1 ClO2-treated group was 13.53% lower than that of the control. However, the changes in L*, b*, a*, and BI were not obvious in the samples with high ClO2 concentrations (80 and 100 mg L−1), which relate to the bleaching phenomenon.

3.2. Weight Loss and Firmness Changes

The weight-loss results are shown in Figure 2E. For the six cherimoya groups, the rate of weight loss increased with storage time. Weight loss in fruit primarily occurs because of water loss through transpiration. The fruit treated with ClO2 lost a significantly smaller amount of weight than that of the control, particularly in the 60 mg L−1 ClO2-treatment group. After day 8 of storage, the rate of weight loss of the sample treated with 60 mg L−1 ClO2 was only 1.03 ± 0.09%, much lower than the others. So, we think the treatment with ClO2 could reduce water loss and respiratory rate.
As shown in Figure 2F,G, the firmness of the pericarp and flesh decreased for all treatments during storage. From day 2 to 8, the control group showed a tendency to decrease considerably, lower than that of the ClO2-treated fruit. This is thought to be related to ClO2 protecting the fruit. In particular, compared with day 0, the firmness of the pericarp and flesh of the 60 mg L−1 ClO2-treated group decreased by 44.64 and 58.62% after day 8, respectively.

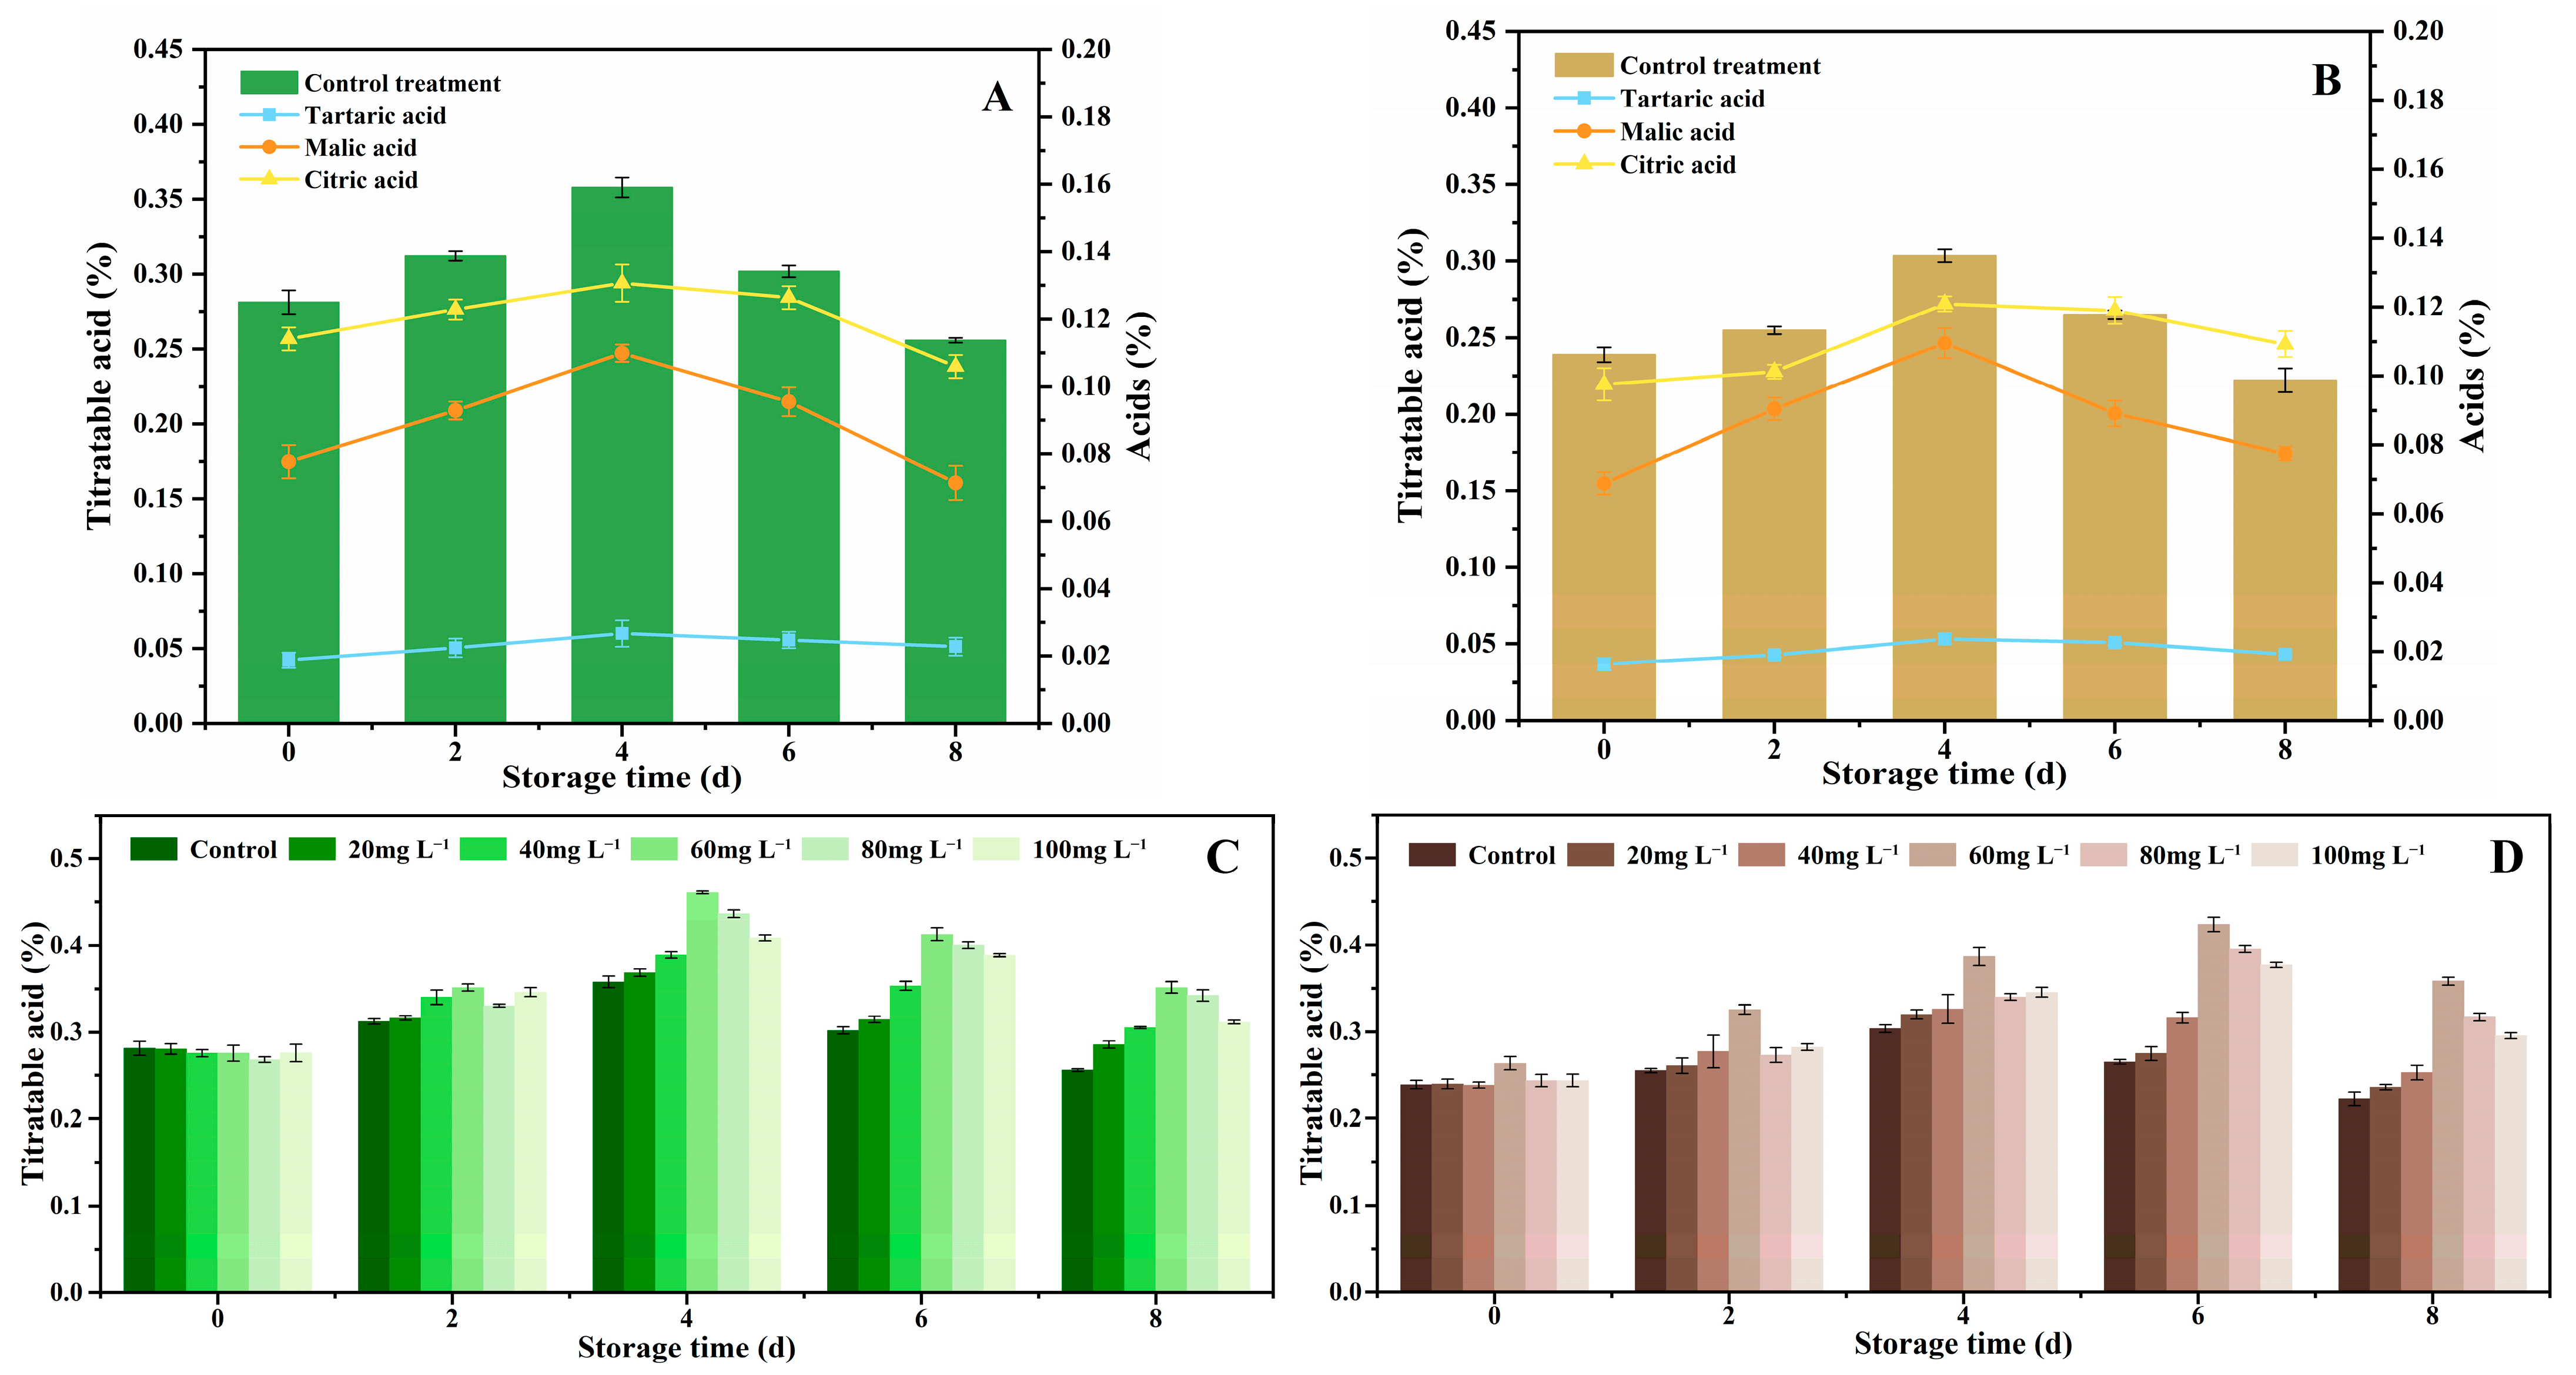
3.3. TA Content, Starch, and Total Sugar Changes

When cherimoya was stored at 15 °C for 8 days, the TA content first increased and then decreased and the maximum amount of acidity was reached in the pericarp and flesh at the ready-to-eat stage (Figure 3A,B). The determination of acids showed that citric acid and malic acid were the main organic acids of the cherimoya, and their content increased during ripening. After day 4 of storage, the citric acid declined slowly, while malic acid was more depleted. TA was observed in both the pericarp and flesh of the cherimoya, but its content was very low from harvest to ripening to the final stage (Figure 3A,B).
The TA content in the pericarp and flesh of the cherimoya indicated that from the beginning of storage, all treatments were relatively stable, then increased in the pericarp on day 4 and in the flesh on day 6, after which it decreased until the end of storage (Figure 3C,D). All treated fruit had a higher acid content than the control during the storage period. After day 8 of storage, the TA content in the pericarp and flesh of cherimoya treated with 60 mg L−1 ClO2 were 0.35 ± 0.0069 and 0.36 ± 0.0045%, respectively, while the control samples contained 0.26 ± 0.0016 and 0.22 ± 0.0076%, respectively (Figure 3C,D). Compared to the other group, 60 mg L−1 of ClO2 significantly reduced the TA content loss during cherimoya storage.
During ripening, starch is transformed into soluble sugar by the action of amylase, so the starch could show the degree of ripeness of the cherimoya [21]. As shown in Figure 4A, both ClO2 treatment and control followed a gradual decrease in starch content with the increase in storage days. The slow decrease in the treatment group indicates that ClO2 could reduce starch transformation to a certain extent, with the 60 mg L−1 concentration showing the smallest decrease (Figure 4A).
Total sugar content accumulated in unripe fruit and peaked at ripening, after which depletion began (Figure 4B). The total sugar in the flesh in the control group increased from 11.09 ± 0.19% on day 0 to 23.08 ± 1.06% on day 4 and then decreased to 11.9 ± 0.33% on day 8. When ClO2 concentration was higher than 60 mg L−1, the total sugar accumulated the most on day 6. At the end of storage, ClO2-treated fruit showed less reduction in total sugar. In particular, the level in the 60 mg L−1 ClO2-treated group was much higher than in the others, the value was 18.89 ± 0.85%, probably because it decreased the activity of hydrolytic enzymes (Figure 4B).

3.4. Phenolic Compounds Content Changes

The phenolic contents of the pericarp and flesh treated with different concentrations of ClO2 are shown in Table 3 and Table 4, respectively. The phenolic compounds in the pericarp and flesh were different considerably after treatment with the various concentrations of ClO2.
From Table 3 and Table 4, we can see the contents of four phenolic compounds in the pericarp were substantially higher than those of the flesh. Generally, they increased from day 0 to 6 and then decreased on day 8. At same time, we found the greatest total content of four phenolics was found in the pericarp and flesh treated with 60 mg L−1 ClO2 at day 6 (466.66 ± 17.74 and 148.03 ± 6.66 mg kg−1, respectively). Among the four phenolic compounds, p-hydroxybenzoic acid and catechol showed the greatest change. They were reduced by 35.49 and 37.19% in the pericarp, and 39.18 and 43.66% in the flesh, respectively. Therefore, we think that catechol or p-hydroxybenzoic acid plays an important role in cherimoya browning.

3.5. PPO Activity Change

As a natural oxidoreductase, PPO can catalyze the oxidation of phenols to benzoquinone. Browning is primarily initiated by PPO [4]. The PPO activities in the pericarp and flesh of cherimoya after treatment with different concentrations of ClO2 are shown in Figure 5. During storage, PPO activity in the pericarp was higher than that in the flesh for all treatments. From day 1 to day 8, the activity of PPO decreased first and then gradually increased. In all cases, the minimum PPO activity was observed on day 4 or 6. Figure 5 indicates that the lowest PPO activity occurred in pericarp and flesh treated with 60 mg L−1 ClO2 at day 6 (26.52 ± 2.66 and 56.25 ± 3.38 U g−1h−1 FW, respectively). This result suggests that ClO2 could inhibit PPO activity to reduce phenolic oxidation and enhance antioxidant capacity.

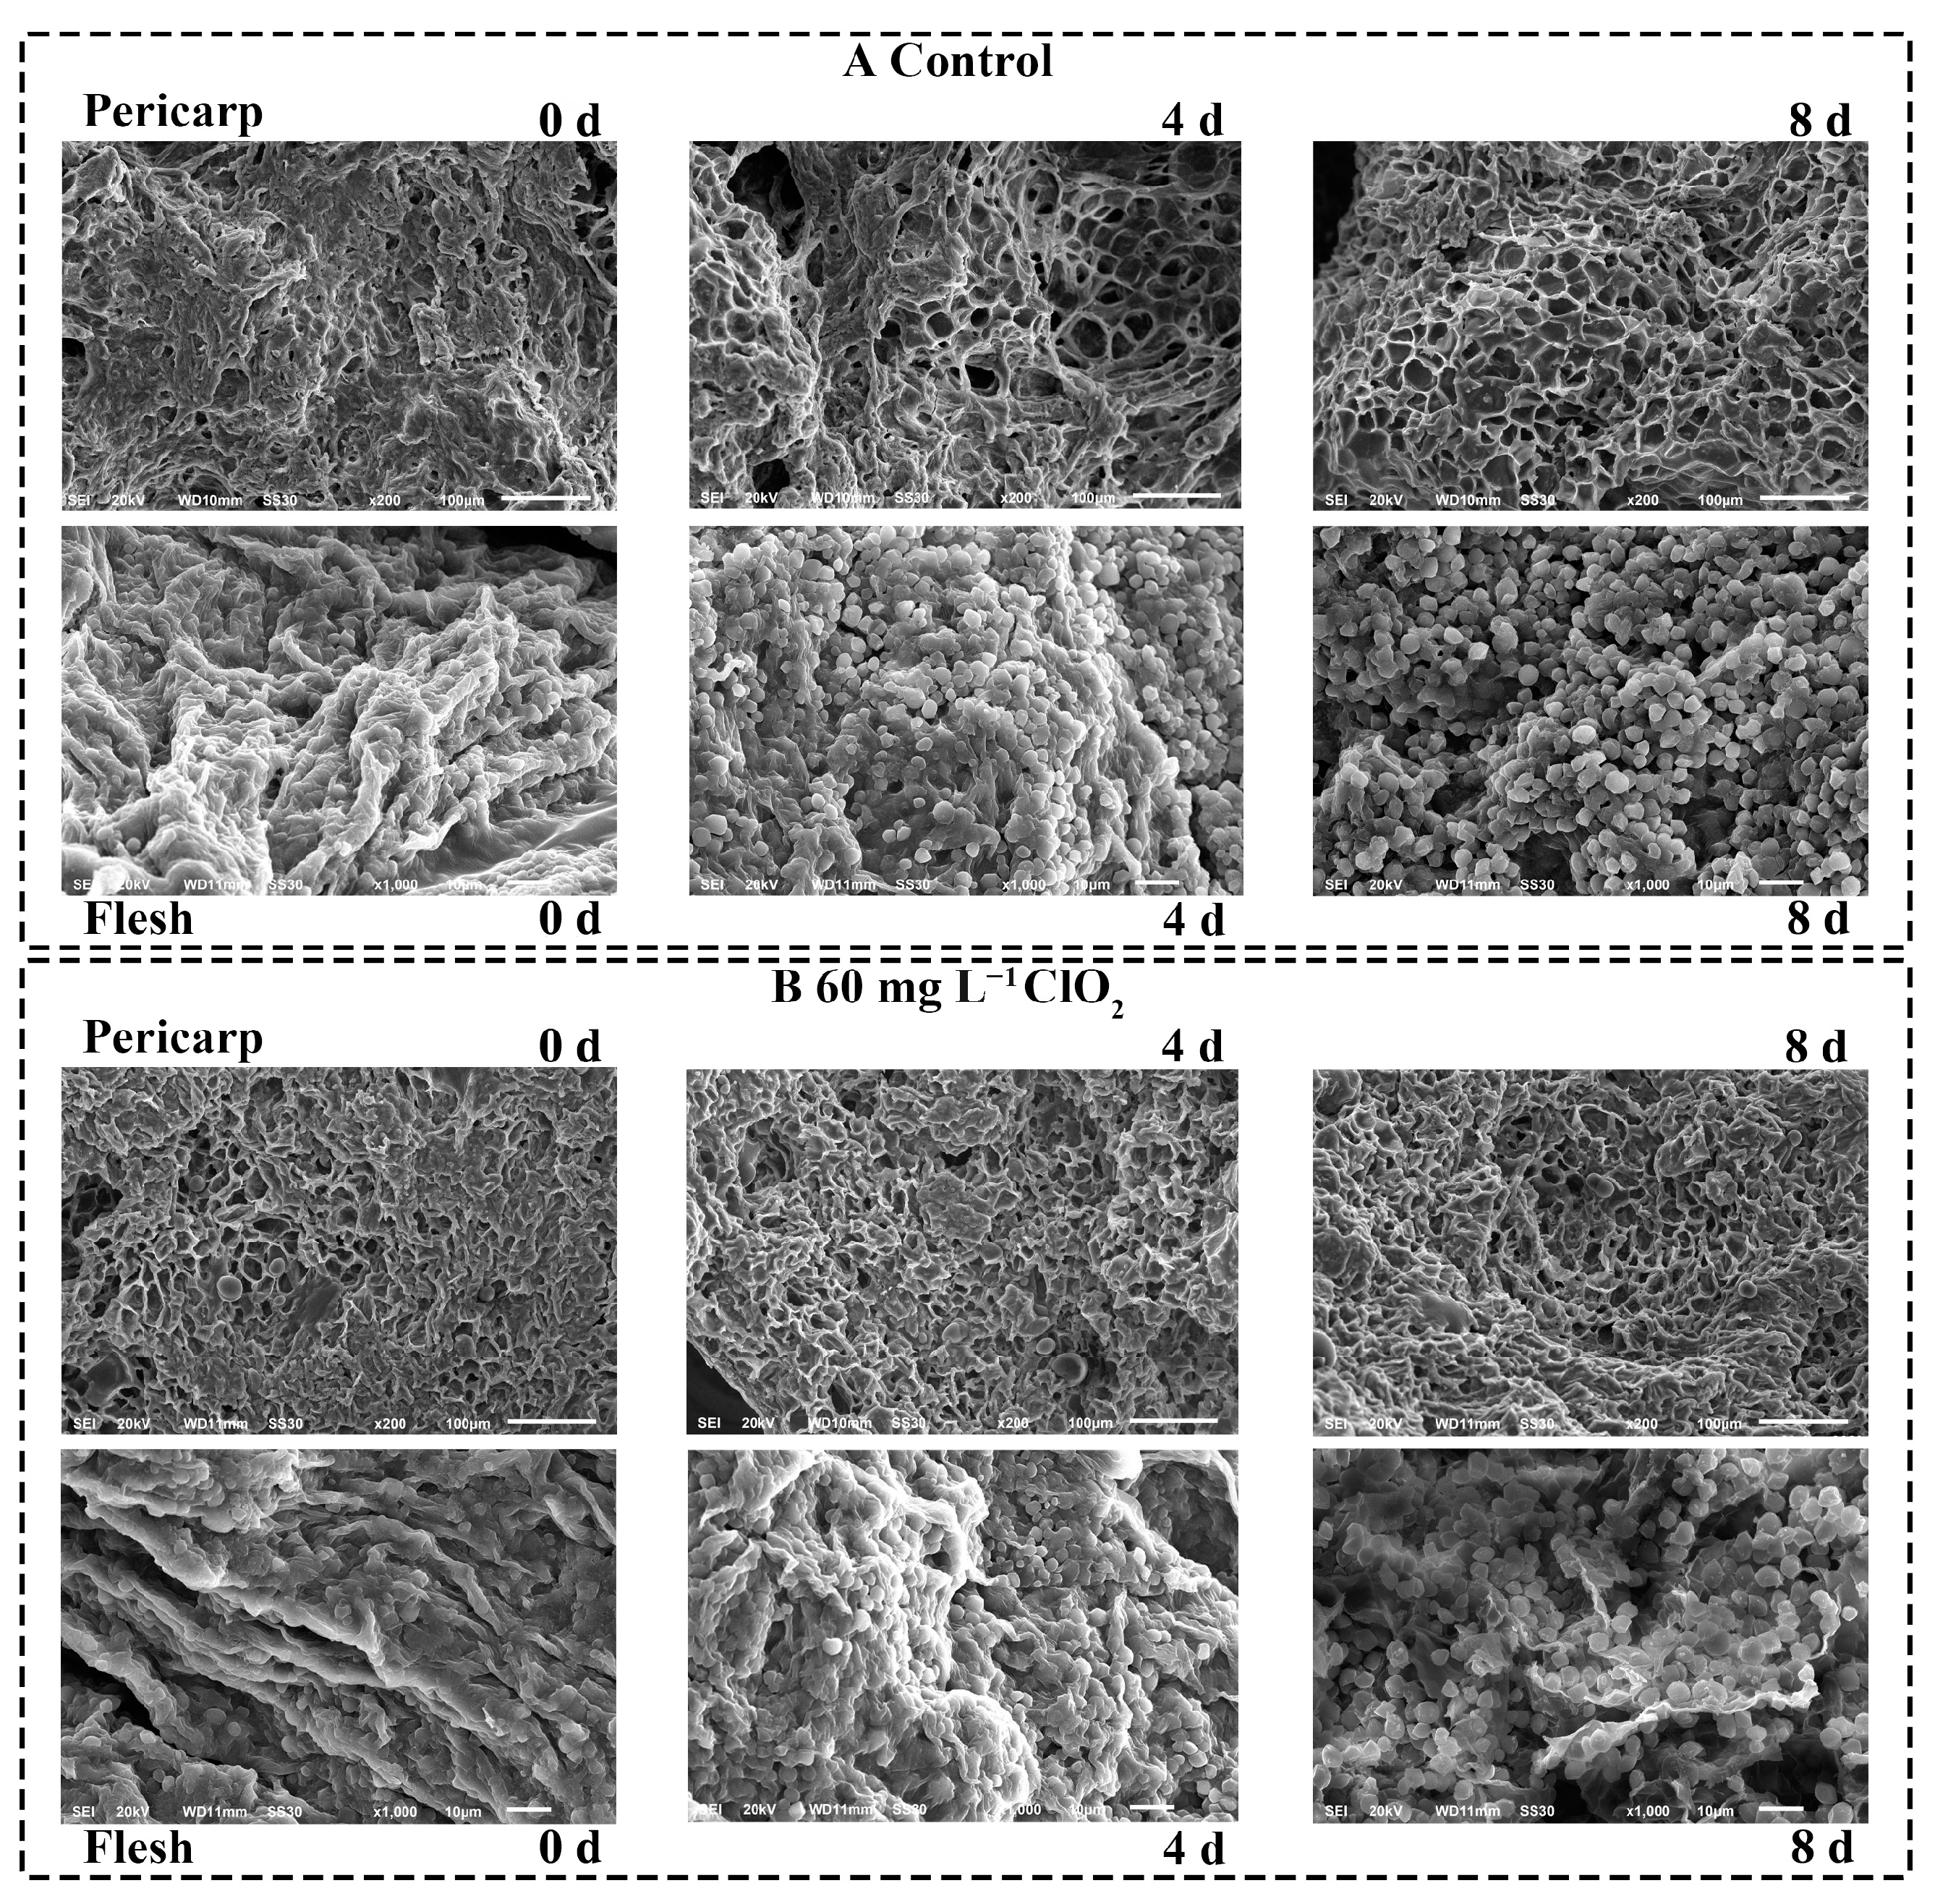
3.6. Morphological Observation of Cherimoya
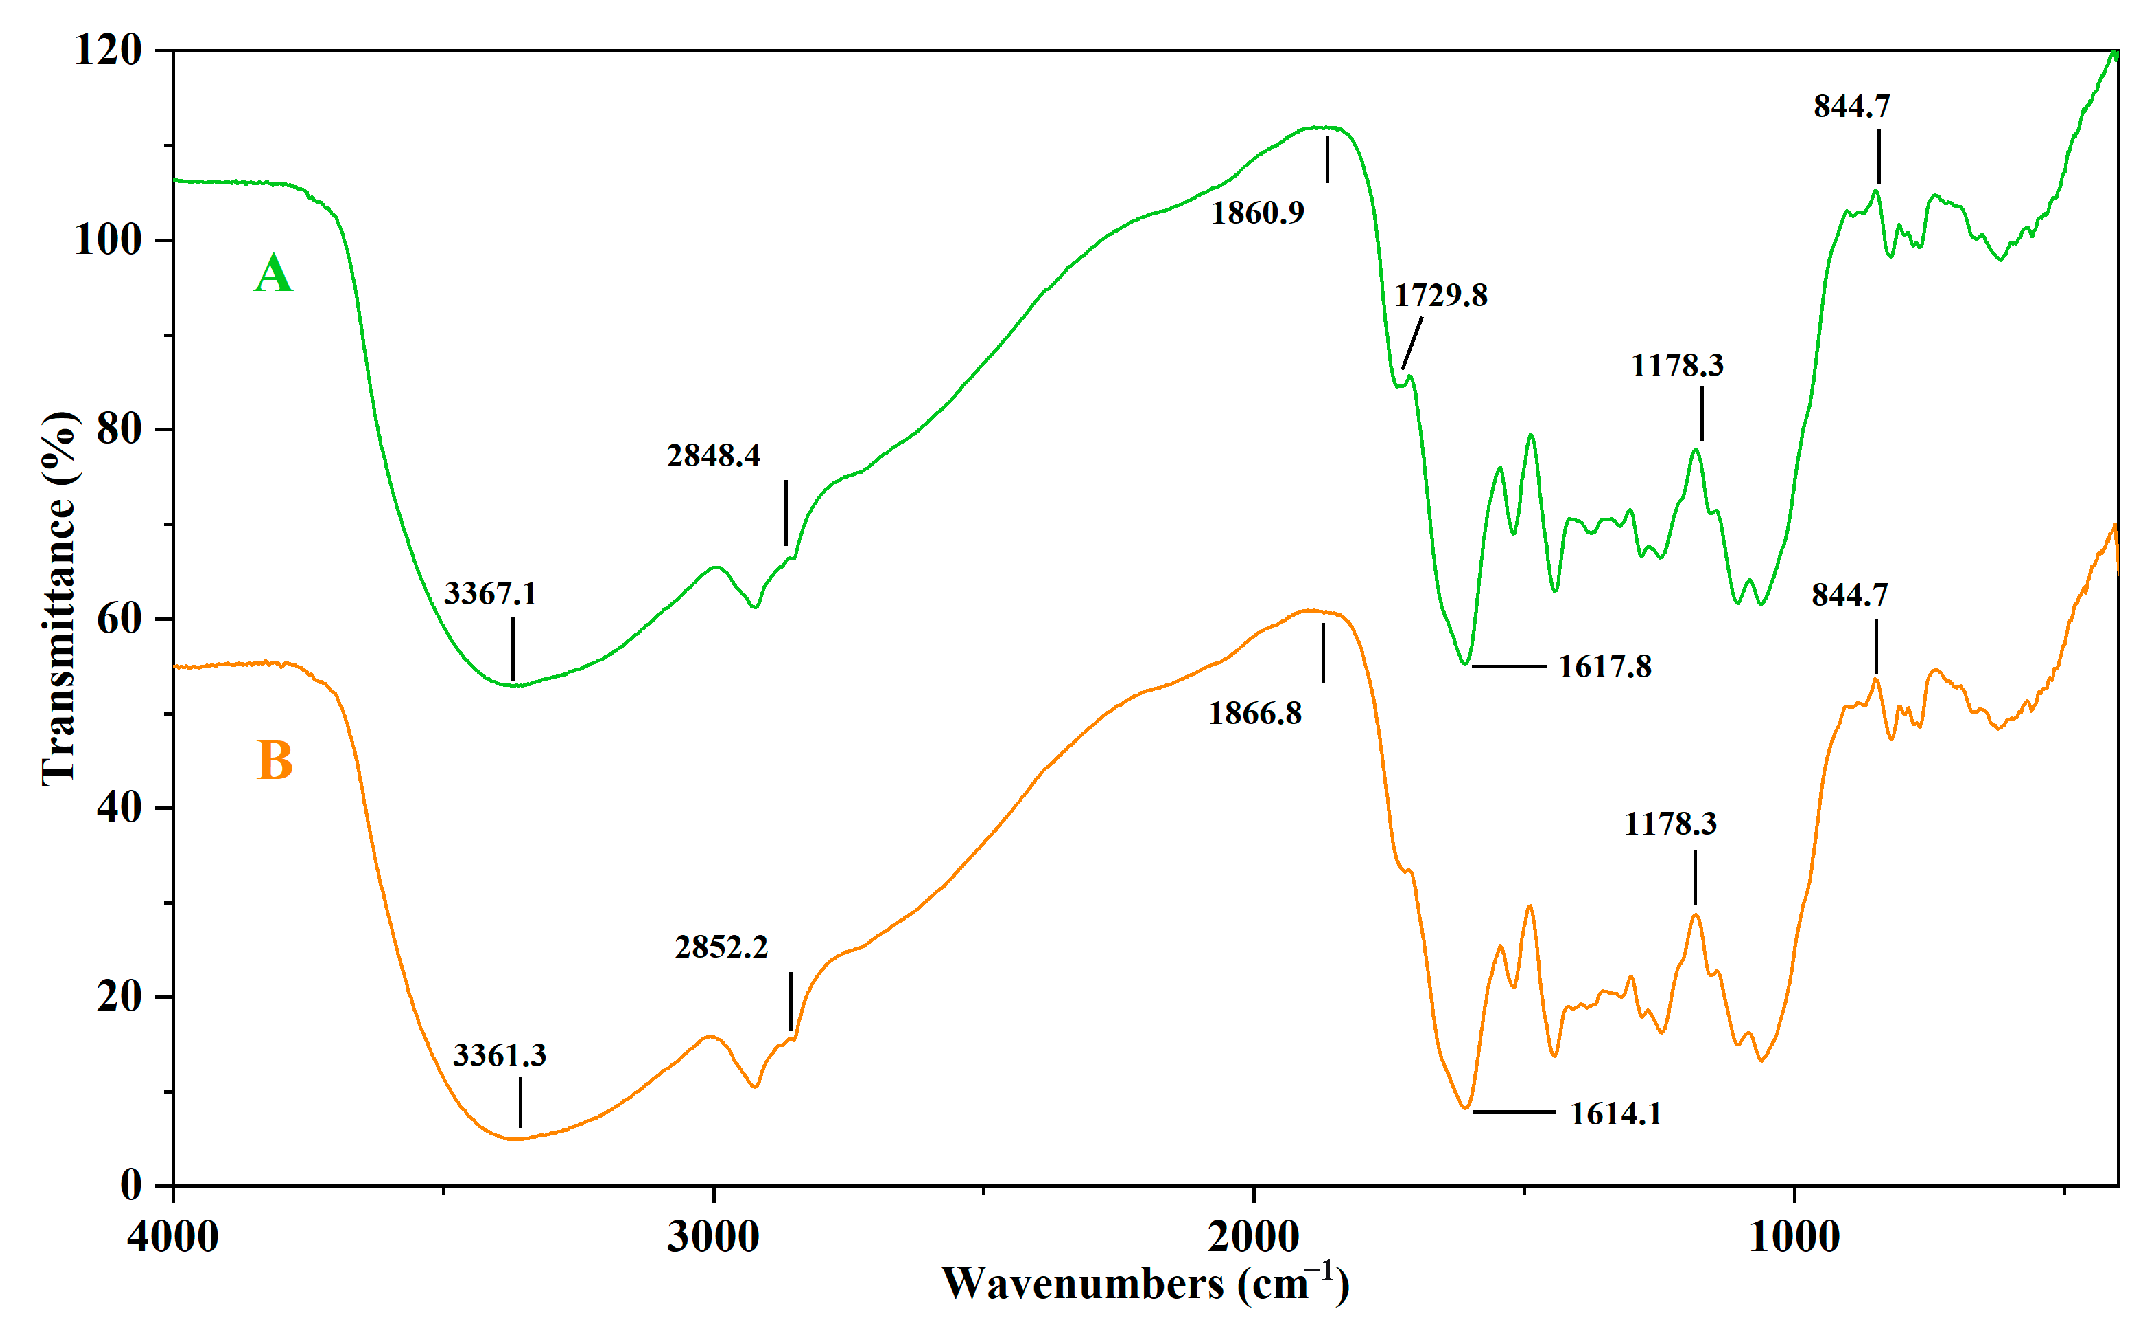
Figure 6 presents the SEM images of the pericarp and flesh treated with 0 and 60 mg L−1 ClO2.
The fruit cells of freshly harvested cherimoya during the initial storage period had a regular shape and were closely arranged, which may be attributable to the stability of the internal components. After day 4, the irregularly shaped cells gradually increased in size. Figure 6A shows that the porosity of the cells significantly increased after day 4, suggesting that the cell structure became loosely connected. In contrast, as shown in Figure 6B, the structure of the ClO2-treated fruit was close with no large cell pores. At the end of storage, the control pericarp showed a large honeycomblike pore size with uniform distribution, while the granularity of the flesh tissue increased; the pore size of the pericarp in the ClO2-treated group was small compared to the control group. The results revealed that 60 mg L−1 of ClO2 could effectively slow cell dilation and retain cherimoya firmness, whereas the corresponding untreated structure softened and collapsed easily.

3.7. FTIR Analysis

The FTIR spectra of pericarps treated with ClO2 at concentrations of 0 and 60 mg L−1 are shown in Figure 7. The FTIR spectra of cherimoya collected during ripening were dominated by peaks that were attributed mostly to water (3367 cm−1 -OH stretching and 1617 cm−1 -OH bending) and the coupled C-O and C-C stretching vibration of sugar absorption bands in the range of 1178–844 cm−1, which are likely those of fructose, glucose, and sucrose. Figure 7 shows a large gap between 2852 and 1860 cm−1 since the principal components of the cherimoya pericarp lack triple bonds. A C=O stretching peak was evident at 1729 cm−1 when the concentration of ClO2 was 0 mg L−1. This fact is consistent with the presence of benzoquinone. This peak disappeared in fruit treated with ClO2 of 60 mg L−1. Therefore, we believe ClO2 could inhibit browning and reduce benzoquinone synthesis.

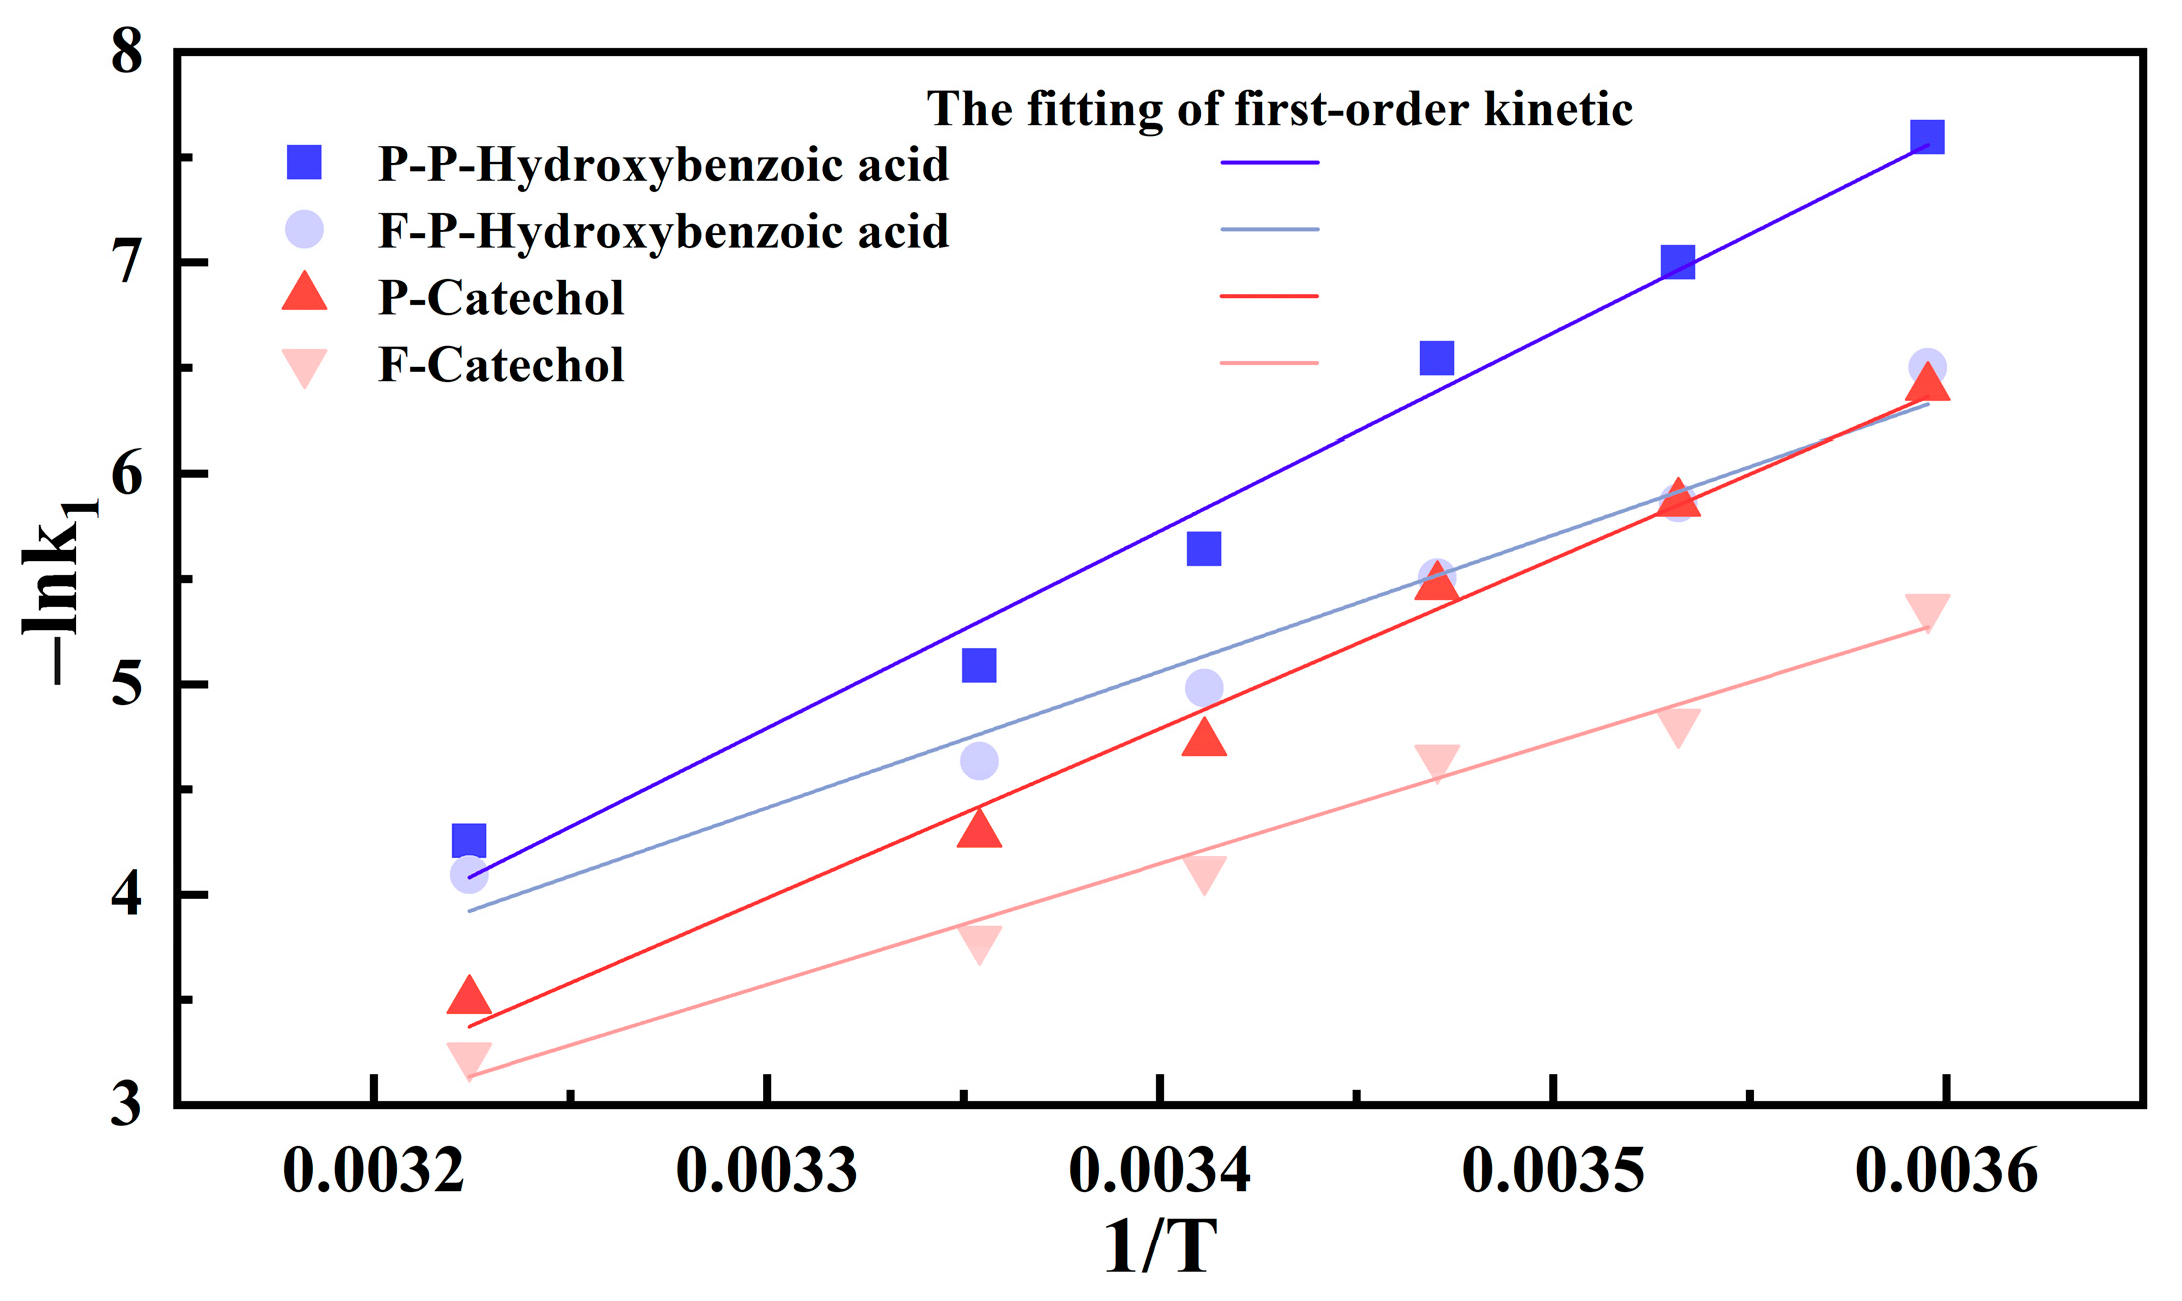
3.8. Kinetics of Enzymatic Browning

From Table 3 and Table 4, we found that the consumption of p-hydroxybenzoic acid and catechol was much more than those of others. At the same time, the contents of p-hydroxybenzoic acid and catechol were accumulated significantly because PPO activity was inhibited and browning was reduced with treated by ClO2.
In order to determine the substrate specificity of the browning reaction in the pericarp and flesh of cherimoya, the crude enzyme solutions were extracted from different tissues and reacted with monophenol standards. The browning reactions in the different tissues of the cherimoya were better fitted to the first-order kinetic model, and the correlation coefficients R2 were larger than those of the zero-order model (Table 5). The Ea were estimated from the Arrhenius plots based on the first-order rate equation (Table 6). Figure 8 shows that the Ea of p-hydroxybenzoic acid and catechol in cherimoya pericarp were 77.92 and 67.00 kJ mol−1, respectively, and in flesh were 53.90 and 47.83 kJ mol−1. Therefore, we consider that catechol is the main reaction substrate for the enzymatic browning of cherimoya, which is susceptible to oxidative polymerization, leading to the formation of melanin.

4. Discussion

Postharvest techniques such as low-temperature storage, modified atmosphere packaging, and ethylene inhibitors are extensively used to slow the respiratory rate, delay browning, and retain the quality of cherimoya. In this study, the safe and efficient food preservative ClO2 was used on cherimoya to determine its effect during storage at 15 °C. A fruit’s appearance is recognized as one of the most vital factors of quality and the main determining factor in consumer purchase decisions. In the study, ClO2 treatment reduced the browning of cherimoya; however, at high concentrations (80 and 100 mg L−1) bleaching occurred (Figure 1). It is widely known that ClO2 is a strong fungicide and oxidant. This result indicates that a high concentration of ClO2 can easily cause oxidative damage and secondary bacterial infection, which is not conducive to the preservation of cherimoya. These findings are consistent with those of Chiabrando et al. [15], who reported that strawberries treated with ClO2 underwent white bleaching after 8 days of storage at 2 °C. Oxidation of oligosaccharides, such as cellulose and hemicellulose, and chlorophyll, has been hypothesized as the possible cause of bleaching in fresh produce [22,23]. The fruit appearance is closely related to the pericarp color, and the shift from green to yellow indicates ripeness [24]. During storage, the decrease in L*, b*, BI and the increase in a* values (Figure 2) were likely related to chlorophyll degradation by chlorophyllase. The contents of carotenoids and xanthophyll gradually increased, which caused the green color to be replaced by yellow [25]. The ClO2-treated cherimoya showed higher L*, b*, and BI values and lower a* values than the control. Our results corroborate those of Chen et al. [14] with grapes and Saengnil et al. [26] with longans, in which ClO2 treatment delayed color alteration and retained quality. Weight loss is an adverse physiological phenomenon caused by transpiration and respiration during the transportation and storage of post-harvest fruit [27]. In the present study, the reduction in the weight loss of fruit treated with ClO2 may be attributed to transpiration inhibition and water loss (Figure 2E). Less weight loss in ClO2-treated berries is associated with 50% closed stomata during storage at low temperatures [28]. The main reason for fruit softening is the degradation of pectin, which plays a supporting role in the cell wall, leading to cell wall degradation and cell dilation [29]. The pore size of a cell affects its texture, with a higher porosity corresponding to a softer fruit [30]. In our study, the appropriate concentration of ClO2 maintained greater firmness (Figure 2F,G) and reduced the increase in cell pore size and porosity among the cherimoya fruit cells (Figure 6), thereby delaying pectin degradation and extending the shelf life of the fruit.
Due to the decrease in pericarp cell membrane permeability caused by ClO2, the entry of air is reduced. Moreover, the activity of amylase was inhibited by ClO2, causing the starch transformation process to be slower. During storage, the starch in fruit would be converted to soluble sugars and organic acids, which is consistent with the increase in total sugars (Figure 4B) and titratable acids (Figure 3C,D). Most fruits use organic acids as substrates for respiration. During the ripening process of cherimoya, the change in malic acid content was more than others. So we considered malic acid as the main substrate for the respiratory transition in cherimoya. The treatment with ClO2 could slow the metabolic activities and decrease the rate of respiratory, causing a reduction in organic acid consumption. Similar results have been reported in strawberries [31]. For enzymatic browning, the main influencing factors are phenolic substrates, oxygen, and enzymes. The content and type of phenolic compounds in different parts of the plant are varied based on genetic and external factors. In this study, from the results of the HPLC analysis, we found that the phenolic compounds in the cherimoya pericarp were more abundant than those in the flesh. It is in agreement with the results of Yi et al. [32] for lotus roots. As shown in Table 3 and Table 4, the phenolic compound content in the ClO2-treated samples was higher than that of the control, corresponding to a reduction in the consumption of phenolic compounds. This is explained by the fact that the accumulation of phenolic oxidation products is effectively controlled by ClO2. Phenols are the key substrates of PPO, with substrate ranges mainly including monophenols, diphenols, catechins, tannins, and flavonoids, etc., [33]. Although catechol is considered as the most reactive substrate, epicatechin, chlorogenic acid, p-hydroxybenzoic acid, caffeic acid are also commonly studied [33]. The phenolic substances that cause browning vary among plants and their parts; for example, catechol is evident in allium [34], while chlorogenic acid is more prominent in apricots [35]. In our study, p-hydroxybenzoic acid and catechol were the main phenolic substances (Table 3 and Table 4). Moreover, p-hydroxybenzoic acid belongs to the monophenol group. PPO is a key enzyme involved in browning reaction. As we know, ClO2 may oxidize amino acids, such as histidine and cysteine, at the active site of the enzyme [36]. So it can inhibit enzymatic oxidation and improve the antioxidant capacity of the fruit. These results agree with Saengnil et al. [26] and Fu et al. [37]. Enzymatic browning is mainly caused by the oxidation of phenolic compounds, catalyzed by PPO, into corresponding quinones in damaged tissues [38]. Quinones are generally colorless; however, a relatively fast oxidation reaction results in colored quinones. Subsequently, the reactions of quinones lead to the accumulation of melanin, which is the brown or black pigment associated with fruit and vegetable browning [39]. Based on the FTIR spectra of cherimoya collected during ripening, the C=O stretching vibration of o-quinone occurs in the absorption bands at 1731–1729 cm−1. The absorption peak of cherimoya treated with ClO2 was not found (Figure 7). Therefore, it is evident that ClO2 controlled the phenol catalysis to reduce quinone production by inhibiting PPO activity.
In order to determine substrate specificity, the values of the apparent Ea for the browning reaction were estimated. Kinetic equations were established. Our results showed that the change in the phenolic compound content in the model agreed with those of the first-order kinetic model (Table 5) in allium [34], strawberry [40], and pear [41], which established kinetic models (particularly first-order kinetic models) to analyze physiological changes and browning reactions. The activation energies of p-hydroxybenzoic acid and catechol in cherimoya pericarp were 77.92 and 67.00 kJ mol−1, respectively, and in the flesh were 53.90 and 47.83 kJ mol−1 (Table 6). The Ea of the reaction between catechol and PPO was smaller. This revealed that the browning substrate of cherimoya was mainly catechol.

5. Conclusions

Compared with the control, at low temperatures, ClO2 was able to slow down the transformation and loss of starch, total sugar, organic acid, and phenolics of cherimoya, and inhibit PPO activity to improve the antioxidant capacity, thus reducing melanin production. The different ClO2 concentrations had various effects during storage, with 60 mg L−1 showing the best preservation effect. Moreover, the browning reaction kinetics indicated that catechol was the major browning substrate of cherimoya. Based on these findings, an efficient approach could be devised for prolonging the storage period of cherimoya and improving its commercialization.

Author Contributions

Conceptualization, T.Z.; methodology, T.Z.; software, T.Z. and H.H.; validation, T.Z., C.H. and X.J.; formal analysis, T.Z.; investigation, T.Z. and R.D.; resources, C.H.; data curation, T.Z. and J.F.; writing—original draft preparation, T.Z.; writing—review and editing, C.H.; visualization, T.Z.; supervision, X.J.; project administration, X.J.; funding acquisition, C.H. All authors have read and agreed to the published version of the manuscript.

Funding

This research was funded by the National Natural Science Foundation of China (32260591); The Natural Science Foundation of Guangxi Province (2019GXNSFDA245036).

Data Availability Statement

The original contributions presented in the study are included in the article, further inquiries can be directed to the corresponding author.

Conflicts of Interest

The authors declare no conflicts of interest.

References

  1. Perrone, A.; Yousefi, S.; Salami, A.; Papini, A.; Martinelli, F. Botanical, genetic, phytochemical and pharmaceutical aspects of Annona cherimola Mill. Sci. Hortic. 2022, 296, 110896. [Google Scholar] [CrossRef]
  2. Manríquez, D.; Muñoz-Robredo, P.; Gudenschwager, O.; Robledo, P.; Defilippi, B. Development of flavor-related metabolites in cherimoya (Annona cherimola Mill.) fruit and their relationship with ripening physiology. Postharvest Biol. Technol. 2014, 94, 58–65. [Google Scholar] [CrossRef]
  3. Barry, C.S. The stay-green revolution: Recent progress in deciphering the mechanisms of chlorophyll degradation in higher plants. Plant Sci. 2009, 176, 325–333. [Google Scholar] [CrossRef]
  4. Sui, X.; Meng, Z.; Dong, T.; Fan, X.; Wang, Q. Enzymatic browning and polyphenol oxidase control strategies. Curr. Opin. Biotechnol. 2023, 81, 102921. [Google Scholar] [CrossRef]
  5. Iqbal, A.; Murtaza, A.; Hu, W.; Ahmad, I.; Ahmed, A.; Xu, X. Activation and inactivation mechanisms of polyphenol oxidase during thermal and non-thermal methods of food processing. Food Bioprod. Process. 2019, 117, 170–182. [Google Scholar] [CrossRef]
  6. Chen, Z.; Gong, X.; Liu, Y.; Zhou, W.; Wei, X.; Li, J.; Lin, M. Review of Biological Characteristics and Research Progress of Annona squamosa. Farm Prod. Process. 2018, 15, 85–88+93. [Google Scholar]
  7. Wang, L.; Peng, H.; Liu, C.; Li, C.; Qu, J.; Geng, X.; Zhu, Z. Effect of chitosan-ascorbic acid composite coating on postharvest quality of Custard apple (Annona squamosa). Process Biochem. 2023, 129, 76–85. [Google Scholar] [CrossRef]
  8. Zhang, Y.; Qiu, J.; Yang, K.; Lu, Y.; Xu, Z.; Yang, H.; Zhong, T. Generation, mechanisms, kinetics, and effects of gaseous chlorine dioxide in food preservation. Compr. Rev. Food Sci. Food Saf. 2023, 22, 3105–3129. [Google Scholar] [CrossRef]
  9. Liu, S.; Zheng, Y.; Wang, R.; Shi, Y.; Cai, W.; Xu, T.; Zuo, J. Chlorine dioxide affects metabolism of harvested sweet corn. Postharvest Biol. Technol. 2024, 211, 112834. [Google Scholar] [CrossRef]
  10. Zhu, X.; Hui, S.; Huang, H.; Liu, R.; Wang, S.; Huang, C. Antimicrobial mechanism of chlorine dioxide and its impacts on postharvest management in horticultural produce: A review. Postharvest Biol. Technol. 2024, 213, 112921. [Google Scholar] [CrossRef]
  11. World Health Organization (WHO); Food and Agriculture Organization of the United Nations (FAO). Benefits and risks of the use of chlorine-containing disinfectants in food production and food processing. In Proceedings of the FAO/WHO Expert Meeting, Ann Arbor, MI, USA, 27–30 May 2008. [Google Scholar]
  12. Chen, Z.; Zhu, C.; Han, Z. Effects of aqueous chlorine dioxide treatment on nutritional components and shelf-life of mulberry fruit (Morus alba L.). J. Biosci. Bioeng. 2011, 111, 675–681. [Google Scholar] [CrossRef]
  13. Chen, Z.; Zhu, C.; Zhang, Y.; Niu, D.; Du, J. Effects of aqueous chlorine dioxide treatment on enzymatic browning and shelf-life of fresh-cut asparagus lettuce (Lactuca sativa L.). Postharvest Biol. Technol. 2010, 58, 232–238. [Google Scholar] [CrossRef]
  14. Chen, S.; Wang, H.; Wang, R.; Fu, Q.; Zhang, W. Effect of gaseous chlorine dioxide (ClO2) with different concentrations and numbers of treatments on controlling berry decay and rachis browning of table grape. J. Food Proces. Preservat. 2018, 42, 13662. [Google Scholar] [CrossRef]
  15. Chiabrando, V.; Giuggioli, N.; Maghenzani, M.; Peano, C.; Giacalone, G. Improving Storability of Strawberries with Gaseous Chlorine Dioxide in Perforated Clamshell Packaging. Pol. J. Food Nutr. Sci. 2018, 68, 141–148. [Google Scholar] [CrossRef]
  16. Jangir, B.; Pilania, S.; Saharan, V.; Lakhawat, S.S.; Prajapat, D.; Meena, M.; Kumar Tak, J. A Comprehensive Study of Hexanal Formulation on Extending Shelf Life of Custard Apple (Annona squamosa L.). Curr. J. Appl. Sci. Technol. 2021, 40, 30–37. [Google Scholar] [CrossRef]
  17. Lin, X.; Zhang, H.; Guo, X.; Qin, Y.; Shen, P.; Peng, Q. A Novel Sodium Alginate-Carnauba Wax Film Containing Calcium Ascorbate: Structural Properties and Preservative Effect on Fresh-Cut Apples. Molecules 2023, 28, 367. [Google Scholar] [CrossRef]
  18. Feumba Dibanda, R.; Panyoo Akdowa, E.; Rani, P.A.; Metsatedem Tongwa, Q.; Mbofung, F.C. Effect of microwave blanching on antioxidant activity, phenolic compounds and browning behaviour of some fruit peelings. Food Chem. 2020, 302, 125308. [Google Scholar] [CrossRef]
  19. Batista, K.; Batista, G.; Alves, G.; Fernandes, K. Extraction, partial purification and characterization of polyphenol oxidase from Solanum lycocarpum fruits. J. Mol. Catal. B Enzym. 2014, 102, 211–217. [Google Scholar] [CrossRef]
  20. Remini, H.; Mertz, C.; Belbahi, A.; Achir, N.; Dornier, M.; Madani, K. Degradation kinetic modelling of ascorbic acid and colour intensity in pasteurised blood orange juice during storage. Food Chem. 2015, 173, 665–673. [Google Scholar] [CrossRef]
  21. Medina-Santamarina, J.; Guillén, F.; Ilea, M.I.M.; Ruiz-Aracil, M.C.; Valero, D.; Castillo, S.; Serrano, M. Melatonin Treatments Reduce Chilling Injury and Delay Ripening, Leading to Maintenance of Quality in Cherimoya Fruit. Int. J. Mol. Sci. 2023, 24, 3787. [Google Scholar] [CrossRef]
  22. Chen, Z.; Zhu, C. Combined effects of aqueous chlorine dioxide and ultrasonic treatments on postharvest storage quality of plum fruit (Prunus salicina L.). Postharvest Biol. Technol. 2011, 61, 117–123. [Google Scholar] [CrossRef]
  23. Malka, S.K.; Park, M.-H. Fresh Produce Safety and Quality: Chlorine Dioxide’s Role. Front. Plant Sci. 2022, 12, 775629. [Google Scholar] [CrossRef]
  24. Jaeger, S.; Lund, C.; Lau, K.; Harker, F. In Search of the “Ideal” Pear (Pyrus spp.): Results of a Multidisciplinary Exploration. J. Food Sci. 2003, 68, 1108–1117. [Google Scholar] [CrossRef]
  25. Öz, A.; Ali, A. Retaining overall quality of fresh figs by postharvest hexanal vapor treatment during cold storage. Postharvest Biol. Technol. 2023, 205, 112539. [Google Scholar] [CrossRef]
  26. Saengnil, K.; Chumyam, A.; Faiyue, B.; Uthaibutra, J. Use of chlorine dioxide fumigation to alleviate enzymatic browning of harvested ‘Daw’ longan pericarp during storage under ambient conditions. Postharvest Biol. Technol. 2014, 91, 49–56. [Google Scholar] [CrossRef]
  27. Ayranci, E.; Tunc, S. A method for the measurement of the oxygen permeability and the development of edible films to reduce the rate of oxidative reactions in fresh foods. Food Chem. 2003, 80, 423–431. [Google Scholar] [CrossRef]
  28. Wang, Z.; Narciso, J.; Biotteau, A.; Plotto, A.; Baldwin, E.; Bai, J. Improving Storability of Fresh Strawberries with Controlled Release Chlorine Dioxide in Perforated Clamshell Packaging. Food Bioprocess Technol. 2014, 7, 3516–3524. [Google Scholar] [CrossRef]
  29. Zhang, L.; Huang, C.; Zhao, Y.; Zheng, C.; Hu, C. Post-ripening and senescence behavior of atemoya (Annona cherimola × A. squamosa) under two typical storage temperatures. Postharvest Biol. Technol. 2023, 200, 112336. [Google Scholar] [CrossRef]
  30. Hou, J.; Sun, Y.; Chen, F.; Yu, L.; Mao, Q.; Wang, L.; Guo, X.; Liu, C. Analysis of microstructures and macrotextures for different apple cultivars based on parenchyma morphology. Microsc. Res. Tech. 2016, 79, 304–312. [Google Scholar] [CrossRef]
  31. Li, Y.; Ren, D.; Xu, D. Preparation of Coated Corrugated Box for Controlled-Release of Chlorine Dioxide and Its Application in Strawberry Preservation. Coatings 2020, 10, 242. [Google Scholar] [CrossRef]
  32. Yi, Y.; Sun, J.; Xie, J.; Min, T.; Wang, L.; Wang, H. Phenolic Profiles and Antioxidant Activity of Lotus Root Varieties. Molecules 2016, 21, 863. [Google Scholar] [CrossRef]
  33. Panadare, D.; Rathod, V.K. Extraction and purification of polyphenol oxidase: A review. Biocat. Agric. Biotech. 2018, 14, 431–437. [Google Scholar] [CrossRef]
  34. Arslan, O.; Temur, A.; Tozlu, İ. Polyphenol Oxidase from Allium sp. Agric. Food Chem. 1997, 45, 2861–2863. [Google Scholar] [CrossRef]
  35. Radi, M.; Mahrouz, M.; Jaouad, A.; Tacchini, M.; Aubert, S.; Hugues, M.; Amiot, M. Phenolic composition, browning susceptibility, and carotenoid content of several apricot cultivars at maturity. HortScience 1997, 32, 1087–1091. [Google Scholar] [CrossRef]
  36. Chomkitichai, W.; Chumyam, A.; Rachtanapun, P.; Uthaibutra, J.; Saengnil, K. Reduction of reactive oxygen species production and membrane damage during storage of ‘Daw’ longan fruit by chlorine dioxide. Sci. Hortic. 2014, 170, 143–149. [Google Scholar] [CrossRef]
  37. Fu, Y.; Zhang, K.; Wang, N.; Du, J. Effects of aqueous chlorine dioxide treatment on polyphenol oxidases from Golden Delicious apple. LWT-Food Sci. Technol. 2007, 40, 1362–1368. [Google Scholar] [CrossRef]
  38. Remorini, D.; Landi, M.; Tardelli, F.; Lugani, A.; Massai, R.; Graziani, G.; Fogliano, V.; Guidi, L. Effect of Chlorine Dioxide and Ascorbic Acid on Enzymatic Browning and Shelf Life of Fresh-Cut Red Delicious and Granny Smith Apples. J. Food Process. Preserv. 2015, 39, 2925–2934. [Google Scholar] [CrossRef]
  39. Toivonen, P.; Brummell, D. Biochemical bases of appearance and texture changes in fresh-cut fruit and vegetables. Postharvest Biol. Technol. 2008, 48, 1–14. [Google Scholar] [CrossRef]
  40. Méndez-Galarraga, M.; Van de Velde, F.; Piagentini, A.; Pirovani, M. Kinetic modeling of the changes in bioactive compounds and quality attributes of fresh-cut strawberries stored in controlled atmospheres with high oxygen alone or with carbon dioxide. Postharvest Biol. Technol. 2022, 190, 111947. [Google Scholar] [CrossRef]
  41. Quevedo, R.; Díaz, O.; Caqueo, A.; Ronceros, B.; Aguilera, J. Quantification of enzymatic browning kinetics in pear slices using non-homogenous L* color information from digital images. LWT-Food Sci. Technol. 2009, 42, 1367–1373. [Google Scholar] [CrossRef]
Figure 1. Appearance changes of cherimoya under 0 (A), 20 (B), 40 (C), 60 (D), 80 (E), and 100 (F) mg L−1 ClO2 during storage time.
Horticulturae 10 00901 g001
Figure 2. Effects of ClO2 on L* value (A), a* value (B), b* value (C), BI (D) of cherimoya during storage. Effects of ClO2 on weight loss (E) and firmness of the pericarp (F) and flesh (G) of cherimoya. Vertical bars indicate standard deviations.
Horticulturae 10 00901 g002
Figure 3. Titratable acidity and acid changes during storage in cherimoya pericarp (A) and flesh (B) of the control group. The bar chart represents titratable acidity, while the line chart represents three specific organic acids. Effects of ClO2 on titratable acid of cherimoya pericarp (C) and flesh (D) during storage. Vertical bars indicate standard deviations.
Horticulturae 10 00901 g003
Figure 4. Effects of ClO2 on starch (A) and total sugar content (B) in cherimoya flesh. Vertical bars indicate standard deviations.
Horticulturae 10 00901 g004
Figure 5. Effects of ClO2 on PPO on cherimoya pericarp (A) and flesh (B) during storage. Vertical bars indicate standard deviations.
Horticulturae 10 00901 g005
Figure 6. Morphology of cherimoya pericarp and flesh under 0 (A) and 60 mg L−1 (B) of ClO2 at days 0, 4, and 8 of storage.
Horticulturae 10 00901 g006
Figure 7. FTIR analysis of cherimoya pericarp under 0 (A) and 60 mg L−1 (B) of ClO2.
Horticulturae 10 00901 g007
Figure 8. Arrhenius curves of phenolic compounds and polyphenol oxidase reactions.
Horticulturae 10 00901 g008
Table 1. Specific organic acid coefficients.
Specific Organic AcidTartaric AcidMalic AcidCitric Acid
Coefficient0.0750.0670.064
Table 2. Standard curves for monophenols.
Phenolic CompoundStandard CurveR2
Neohesperidiny = 24366x + 2.64140.9999
Epicatechiny = 26474x + 4.06690.9979
p-Hydroxybenzoic acidy = 32669x + 21.3240.9984
Catecholy = 45826x + 19.5230.9999
Table 3. Phenolic compound content (mg kg−1 FW) in cherimoya pericarp with all treatments.
Fruit PartClO2
Concentration
Phenolic
Compound
Content (mg kg−1 FW)
0 d2 d4 d6 d8 d
Pericarp0 mg L−1Neohesperidin45.97 ± 2.94 ab46.97 ± 1.87 ab50.84 ± 4 a46.83 ± 1.95 ab43.38 ± 2.68 b
Epicatechin84.38 ± 4.35 b88.16 ± 5.47 b96.68 ± 6.12 a88.2 ± 1.56 b81.17 ± 2.06 b
p-Hydroxybenzoic acid119.6 ± 2.08 b128.19 ± 2.91 b148.66 ± 5.77 a119.43 ± 6.03 b95.9 ± 6.03 c
Catechol93.28 ± 5.17 b101.02 ± 8.51 b117.5 ± 4.85 a94.77 ± 6.66 b73.81 ± 5.13 c
20 mg L−1Neohesperidin41.31 ± 5.36 a42.06 ± 5.76 a45.13 ± 8.79 a42.35 ± 4.32 a40.27 ± 5.51 a
Epicatechin86.42 ± 5.16 b89.71 ± 0.55 ab96.03 ± 4.78 a90.16 ± 0.84 ab85.73 ± 5.94 b
p-Hydroxybenzoic acid122.78 ± 5.51 b132.8 ± 9.56 b149.5 ± 2.14 a123.67 ± 7.3 b100.74 ± 5.68 c
Catechol107.63 ± 3.68 c116.72 ± 4.3 b133.06 ± 2.55 a109.06 ± 3.85 c84.84 ± 3.94 d
40 mg L−1Neohesperidin41.31 ± 1.77 b41.94 ± 3.25 ab44.89 ± 1.81 ab46.3 ± 1.22 a42.83 ± 3.29 ab
Epicatechin86.42 ± 5.16 b88.28 ± 6.71 ab92.8 ± 4.52 ab98.99 ± 2.09 a90.16 ± 8.94 ab
p-Hydroxybenzoic acid122.78 ± 5.51 c128.49 ± 5.27 c145.95 ± 4.59 b168.27 ± 1.93 a140.99 ± 2.62 b
Catechol97.57 ± 5.36 c102.81 ± 4.2 c118.3 ± 1.51 b136.25 ± 3.36 a116.69 ± 4.48 b
60 mg L−1Neohesperidin40.64 ± 2.82 a41.27 ± 1.32 a44.88 ± 5.1 a47.39 ± 3.77 a45.87 ± 4.12 a
Epicatechin83.13 ± 2.67 c85.46 ± 4.56 bc90.72 ± 4.52 ab95.73 ± 2.44 a92.34 ± 3.56 ab
p-Hydroxybenzoic acid124.39 ± 2.54 d131.05 ± 1.15 c149.5 ± 5.53 b171.06 ± 4.09 a149.95 ± 3.13 b
Catechol104.36 ± 4.35 c109.76 ± 2.64 c129.83 ± 1.45 b152.48 ± 4.34 a133.54 ± 3.47 b
80 mg L−1Neohesperidin41.31 ± 1.77 c42.09 ± 2.25 bc45.38 ± 0.85 ab47.38 ± 2.56 a44.1 ± 1.97 abc
Epicatechin73.09 ± 2.05 d75.85 ± 1.1 cd80.95 ± 6.08 bc87.6 ± 2.99 a82.93 ± 0.55 ab
p-Hydroxybenzoic acid122.78 ± 3.51 d129.73 ± 1.62 c145.52 ± 3.62 b169.21 ± 1.03 a143.26 ± 4.45 b
Catechol107.63 ± 4.85 c114.86 ± 2.03 c131.58 ± 2.21 b153.8 ± 6.31 a127.67 ± 2.57 b
100 mg L−1Neohesperidin38.97 ± 1.48 c39.6 ± 0.45 c42.09 ± 2.24 c45.08 ± 1.49 a42.74 ± 1.44 b
Epicatechin79.76 ± 1.51 b83.16 ± 4.59 b88.19 ± 3.80 a93.68 ± 3.47 a87.04 ± 4.58 a
p-Hydroxybenzoic acid122.78 ± 3.51 c130.91 ± 4.81 c151.76 ± 5.02 b173.75 ± 2.35 a149.84 ± 3.56 b
Catechol107.63 ± 0.73 d113.71 ± 2.88 c130.65 ± 4.09 b149.37 ± 1.53 a127.06 ± 1.49 b
Different letters in the same row indicate significant differences (p < 0.05).
Table 4. Phenolic compound content (mg kg−1 FW) in cherimoya flesh with all treatments.
Fruit PartClO2
Concentration
Phenolic
Compound
Content (mg kg−1 FW)
0 d2 d4 d6 d8 d
Flesh0 mg L−1Neohesperidin20.88 ± 3 a22.65 ± 4.57 a25.21 ± 4.9 a23.16 ± 1.66 a20.69 ± 1.4 a
Epicatechin21.17 ± 1.77 a22.97 ± 5.26 a26.19 ± 6.98 a24.55 ± 3.86 a22.09 ± 4.72 a
p-Hydroxybenzoic acid29.17 ± 1.05 b32.34 ± 5.8 ab37.24 ± 3.66 a29.82 ± 1.69 b22.65 ± 2.79 c
Catechol30.04 ± 2.66 b33.34 ± 4.09 ab39.07 ± 2.6 a31.3 ± 4.09 b22.01 ± 2.95 c
20 mg L−1Neohesperidin17.71 ± 1.52 a19.08 ± 4.61 a20.88 ± 3.86 a19.3 ± 2.62 a18.01 ± 1.57 a
Epicatechin22.41 ± 2.95 a24.23 ± 3.72 a26.41 ± 2.9 a24.97 ± 3.57 a22.75 ± 1.43 a
p-Hydroxybenzoic acid24.59 ± 2.34 b28.43 ± 5.63 ab32.73 ± 5.71 a27.93 ± 1.71 ab23.28 ± 2.51 b
Catechol32.17 ± 3.39 ab36.66 ± 6.57 ab41.36 ± 3.2 a34.87 ± 4.18 ab27.3 ± 5.9 b
40 mg L−1Neohesperidin17.71 ± 1.52 a18.38 ± 3.06 a19.48 ± 2.22 a21.88 ± 2.48 a20.79 ± 2.12 a
Epicatechin22.41 ± 2.95 a23.09 ± 1.88 a24.5 ± 3.14 a26.24 ± 4.02 a24.32 ± 4.13 a
p-Hydroxybenzoic acid24.59 ± 1.74 b26.46 ± 4.51 b30.05 ± 4.57 ab33.39 ± 2.08 a28.83 ± 1.94 ab
Catechol32.17 ± 3.39 d35.55 ± 1.42 cd40.76 ± 1.54 b45.71 ± 3.51 a39.37 ± 2.52 bc
60 mg L−1Neohesperidin21.1 ± 1.91 b22.05 ± 0.55 ab23.86 ± 1.41 ab25.43 ± 3.66 a24.25 ± 0.34 ab
Epicatechin24.01 ± 6.36 a25.05 ± 2.69 a27.18 ± 1.23 a28.92 ± 2.64 a26.96 ± 3.26 a
p-Hydroxybenzoic acid32.74 ± 1.51 c36.01 ± 2.99 bc40.77 ± 3.11 b47.35 ± 2.45 a40.7 ± 2.3 b
Catechol33.84 ± 5.42 c36.5 ± 3.81 bc40.88 ± 3.2 ab46.33 ± 2.63 a39.36 ± 1.16 bc
80 mg L−1Neohesperidin17.71 ± 1.52 b18.36 ± 0.98 b20.1 ± 2.3 ab22.19 ± 2.72 a20.9 ± 1.81 ab
Epicatechin15.74 ± 1.47 b16.58 ± 1.48 ab17.91 ± 2.21 ab19.76 ± 0.73 a18.73 ± 3.15 ab
p-Hydroxybenzoic acid24.59 ± 1.74 d27.16 ± 1.41 cd30.24 ± 1.56 bc36.8 ± 3.1 a30.95 ± 1.34 b
Catechol32.17 ± 3.39 c35.47 ± 2.4 bc39.93 ± 2.07 b46.63 ± 2.51 a39.53 ± 4.5 b
100 mg L−1Neohesperidin17.71 ± 1.52 a18.94 ± 3.7 a20.66 ± 1.45 a22.97 ± 4 a22.08 ± 2.82 a
Epicatechin22.41 ± 2.95 a23.01 ± 1.01 a24.21 ± 2.03 a25.37 ± 2.07 a24.53 ± 0.88 a
p-Hydroxybenzoic acid24.59 ± 1.74 c28.16 ± 3.46 c32.63 ± 1.95 b37.94 ± 2.67 a33.05 ± 1.74 b
Catechol32.17 ± 1.96 d36.37 ± 1.52 c41.33 ± 2.06 b48.81 ± 3.03 a42.42 ± 1.46 b
Different letters in the same row indicate significant differences (p < 0.05).
Table 5. Kinetic parameters of the reactions between phenolic compounds and PPO.
Kinetic ModelReaction Substrate R a d j 2
Zero-orderP-p-hydroxybenzoic acid0.97692
F- p-hydroxybenzoic acid0.96164
P- catechol0.97506
F- catechol0.96177
First-orderP-p-hydroxybenzoic acid0.98241
F-p-hydroxybenzoic acid0.97276
P-catechol0.9876
F-catechol0.98227
P: pericarp; F: flesh.
Table 6. Kinetic equation and related parameters of phenolase reaction in pericarp and flesh.
Phenolic CompoundFirst-Order Kinetic Equationk1
(min−1)
Ea
(kJ mol−1)
P-p-hydroxybenzoic acidy = 0.3982e(−0.00446x)0.0044580977.91
F-p-hydroxybenzoic acidy = 0.3982e(−0.00694x)0.0069366953.90
P-catecholy = 0.2495e(−0.01026x)0.010258867.00
F-catecholy = 0.2495e(−0.0168x)0.0168021147.83
Disclaimer/Publisher’s Note: The statements, opinions and data contained in all publications are solely those of the individual author(s) and contributor(s) and not of MDPI and/or the editor(s). MDPI and/or the editor(s) disclaim responsibility for any injury to people or property resulting from any ideas, methods, instructions or products referred to in the content.

