Abstract
Papilionoideae is the most species-rich subfamily of the third largest angiosperm family Fabaceae. One constituent large group, the inverted-repeat-lacking clade (IRLC), is well-known for the broad loss of one IR copy. Accumulating observations of massive plastomic disparities have made IRLC a well-suited model for exploring plastome evolution. However, there is still a large amount left to explore. The present study focused on the plastid tRNA (pttRNA) evolution within Papilionoideae, employing the currently densest sampling strategies for both the IRLC (156) and non-IRLC (109) lineages. Strikingly, our results revealed abundant inter-lineage variabilities in both tRNA sequences and structures, including a 3 nt difference in the average size of trnS-UGA, the consensus sequence disparities across 29 tRNAs, the distinct 3 nt indels in trnA-UGC, and an impressive 248 nt intron loss of IRLC trnI-GAU (potential markers). Additionally, there was unequal stability of the atypical secondary structures in trnS-GGA and trnS-UGA, as well as significantly diverse compositions of substitution events in all compared tRNAs (p < 0.05). Ultimately, these findings not only demonstrate the significant differences and unique markers of IRLC pttRNAs compared to other non-IRLC Papilionoideae, but also draw an important conclusion that the large losses of one IR potentially promote highly diverse evolutionary patterns of IRLC, which could partly compensate for the potential IR-lacking impacts.
Keywords:
Leguminosae; Faboideae; IRLC; plastid tRNA; intron; tRNA secondary structure; base substitution 1. Introduction
The third largest angiosperm family Fabaceae, or Leguminosae, contains approximately 800 genera and 23,000 species with a global distribution [1,2,3]. Legumes, possessing unprecedented significance in agriculture, economy, and ecology, have been a long-term focus in evolutionary and phylogenetic analyses [4]. Since the 19th century, based on the intrafamilial classification by Bentham [5], a three-subfamily system has been established and traditionally recognized worldwide for a long period, i.e., Caesalpinioideae, Mimosoideae, and Papilionoideae [5,6,7]. However, as tremendous progress has been made under more extensive samplings, uncertainties have gradually emerged, such as the persistent paraphyly of Caesalpinioideae [8,9] and some unresolved Mimosoideae genera [10]. Most remarkably, in 2017, LPWG [11] proposed a groundbreaking and community-endorsed re-classification of Fabaceae into the following six subfamilies: Detarioideae, Cercidoideae, Duparquetioideae, and Dialioideae (all segregated from the former Caesalpinioideae), Caesalpinioideae (included the former Mimosoideae), and Papilionoideae (the only unrevised traditionally recognized subfamily).
Regardless of taxonomic discrimination, Papilionoideae is always the most species-rich and widespread subfamily, with approximately 14,000 taxa from 501 genera [11,12]. It is noted that the papilionoid legumes consistently constitute a stable monophyletic lineage under phylogenetic scrutiny [8,9,13,14,15,16]. In contrast to the subfamily rank, unexpectedly, the internal phylogenetically scattered members from the polyphyletic “primitive” tribes, e.g., Sophoreae [17] and Swartzieae [18], have posed a main obstacle to disentangling affinities within Papilionoideae [4,13]. Even after such a long-standing phylogenetic exploration by sampling taxa as densely as possible, with data resources ranging from single plastomic markers (e.g., rbcL [8,19] and matK [4,11,12,13,20,21,22,23]) to multigene [14,24,25] or whole plastomes [24], our current insights into Papilionoideae phylogenies remain a progress report. Another topical issue is the extensive plastomic rearrangements embodied by this subfamily, such as large-scale inversions [26,27], and disparities in gene order [28,29,30] and gene/intron content [31,32,33]. Notably, one of the most quintessential examples is the broad loss of one inverted repeat (IR), which is shared by a robustly monophyletic clade designated as the “IR-lacking clade” or IRLC [34].
The widely recognized IRLC clade is a large group comprising nearly one-third of the Papilionoideae taxa, with an estimated 4000 species from 56 genera [25]. Based on advances in phylogeny, this diverse group has been further subdivided into seven tribes, involving both monophyletic (Cicereae, Fabeae, and Wisterieae) and non-monophyletic tribes (Carmichaelieae, Galegeae, Hedysareae, and Trifolieae) [11,25,35,36,37,38,39]. Notably, the academic attention and significance of the IRLC group cannot be overstated, not only for its numerous economically important constituent species (e.g., beans, clovers, and peas) [1,40] but also for the existence of extensive variations among their plastomes. Within the IRLC clade, the surge in sequence data has revealed remarkable genomic disparities, including horizontal gene transfer (plastid-to-nuclear) [29,41,42], intron loss events [31,43], large inversions [44,45], and even an unusual reemergence of IR [44]. These findings and other ongoing explorations collectively underscore that IRLC is well-suited for the in-depth exploration of plastome evolution.
Despite recent progress, several issues require further exploration in IRLC plastome research. Limited sampling in past studies, focusing on single genera [43,46,47,48] or tribes [49,50], and with broader surveys often lacking sufficient sample size [29,51,52], necessitates more comprehensive approaches. In addition, these studies frequently employed the closest IR-containing relatives for comparisons, typically limited to only a few representatives, restricting the scope of analysis. Fortunately, the abundant GenBank data for IRLC (150 taxa) and other Papilionoideae (110 taxa) position Papilionoideae as an ideal model for understanding the impact of IR-loss on IRLC plastomic evolution. Furthermore, plastid DNA, a powerful tool for plant evolutionary history (as a “super-barcode”) [53,54,55], offers extensive information for further exploration [53,54,55,56]. Recent studies have highlighted the taxonomic significance of sequence and structural variations in plastomes, including indels of intron, codon usage and aversion patterns, IR junction migration, and atypical tRNA structures [57,58,59,60,61,62]. While existing contributions have established basic IRLC plastome structures, gene content, and organization, there remains significant potential for a deeper understanding.
Plastid transfer RNAs (pttRNAs) play a vital role in plastome expression and exhibit conserved characteristics in size (approximately 75–95 nt) and a clover-shaped secondary structure [63,64,65]. The following two distinct classes of tRNAs have been identified across organisms: continuous (intron-absent) and disrupted (intron-containing, split, and permuted) tRNAs. Notably, the most common are the intron-absent and intron-containing types [66,67,68,69,70]. As remarkably versatile macromolecules, tRNAs are involved in both translation and various biosynthetic pathways, thereby influencing cellular function [71,72,73]. Despite their versatility, tRNAs are surprisingly well-conserved across species [74]. Recent research has shed light on the phylogenetic significance of pttRNAs. One notable case study is our previous large-scale investigation of pttRNAs among 208 Saxifragales species, which revealed a substantial number of specific structures at different taxonomic levels [59]. Other studies have also investigated interspecific variations in pttRNAs, such as intron, consensus sequence, and substitution rate [63,65,74,75]. Importantly, these findings collectively suggest that the accumulated pttRNAs variations can provide valuable insights into the evolution of a lineage. However, there have been no systematical and comprehensive analyses focusing on the pttRNA evolution of IRLC clade or subfamily Papilionoideae. Consequently, it warrants further scrutiny.
In this study, our concern is with two primary questions. First, is there a significant difference between the pttRNAs of IRLC clade and other Papilionoideae taxa with two canonical IRs? Second, after losing the IRs, what influences might have been exerted on the evolutionary patterns of IRLC pttRNAs? To address these questions, we retrieved the currently available 265 Papilionoideae plastomes, with extensive sampling for both the IRLC (156) and non-IRLC (109) lineages. We then conducted comprehensive comparisons of pttRNAs to achieve the following: (1) disentangle the conserved and variable genomic features among Papilionoideae, (2) investigate the unique intron indels, (3) examine the secondary structural variations, and (4) evaluate the different patterns of substitution events. Ultimately, we aimed to provide a new look at the evolutionary patterns of the IRLC and papilionoid legumes.
2. Materials and Methods
2.1. Taxon Sampling and Annotation of pttRNAs
Our sampling strategies covered plastome sequences of 265 Papilionoideae taxa from the NCBI database. Among these, 156 species from the IRLC represented six of the seven constituent tribes, while the remaining 109 non-IRLC species belonged to ten other tribes or major clades of Papilionoid legumes (Table S1). To ensure accurate identification, we re-annotated all the tRNAs from these acquired plastomes through multiple software by BLASTn v.2.12.0 [76], CPGAVAS2 (command-line version) [77], GeSeq v.2.03 [78], and tRNAscan-SE v.2.0.3 [79]. We then compared the numbers and isoacceptor types of pttRNAs among all the involved 265 taxa. Additionally, we examined the detected loss events using EasyFig v.2.2.5 [80] for the visualization of sequence alignments.
2.2. Comprehensive Identification of Sequence and Structural Variations
To thoroughly investigate sequence and structural variations, we classified all obtained pttRNAs into two groups—IRLC and other Papilionoideae taxa. Within each group, we further sorted tRNAs by isotypes and anticodons. We used tRNAscan-SE v.2.0.3 [79] with the bacterial source model to predict the secondary structures of pttRNAs. Based on these predicted structures, we extracted and individually aligned specific regions of each tRNA using MultAlin v.5.4.1 [81]. These regions contained loops (anticodon (ANC-), D-, and Ψ-loop) and arms (acceptor (AC-), ANC-, D-, and Ψ-arm) as well as a variable (V-) region. With the consensus value set as 90% for high and 50% for low, the consensus sequences were estimated for each region within each type of tRNA and subsequently compared between the two groups.
In addition, we extracted all the pttRNA intron sequences and individually aligned them using MAFFT v.7.505 [82]. To improve the accuracy of indel identification, the generated alignments were further manually modified following the principles of Borsch et al. [83]. We applied Bioedit [84] to assess the size and GC content of introns. Moreover, the secondary structures of the introns were predicted using the documented references in the Comparative RNA Website (CRW) database [85].
2.3. Overall Evaluation of the Substitution Frequencies
To investigate substitution patterns in pttRNAs, we constructed consensus sequences for each tRNA type in both IRLC and non-IRLC species. These sequences, representing the most frequent base at each position within a specific tRNA type, serve as a reference for substitution analysis. We then analyzed substitution events in pttRNAs at two levels. First, we examined the overall tRNA level. For each alignment, we compared the sequences to the generated reference and calculated the substitution frequencies using the method proposed by Sen et al. [86]. These frequencies were further divided into transitions (ti) and transversions (tv). Second, we focused on separate structural regions. Based on the alignments mapped to the secondary structures, we extracted all the loop and stem region sequences for independent substitution explorations. Notably, within the stem regions, the point mutations were categorized as compensatory and non-compensatory, based on whether the substitutions occurred within a base pair or at a single base, respectively. Afterwards, the frequencies of all the recognized ti and tv were evaluated accordingly for comparisons.
3. Results
3.1. Gene Content and Size of pttRNAs in Papilionoideae
From the 265 Papilionoideae plastomes investigated, a total of 7942 tRNA genes were annotated and finally identified. These pttRNAs were categorized into two main classes for further comparison, i.e., IRLC and non-IRLC classes. Both classes exhibited a generally similar tRNA gene content, with approximately 30 tRNA types encoding all 20 standard amino acids (AA) (Table 1). However, each of the non-IRLC species contained seven or eight, typically seven, more tRNAs compared to that of IRLC taxa. These additional tRNAs were located in the IR region and included trnA-UGC, trnI-CAU, trnI-GAU, trnL-CAA, trnN-GUU, trnR-ACG, and trnV-GAC.

Table 1.
Distribution of tRNA isotypes and size variations among Papilionoideae plastomes.
Our study revealed a striking pattern of tRNA loss events in Papilionoideae pttRNAs (Table 1). Notably, eight tRNA genes were missing, with a clear bias towards the IRLC class. Six losses occurred in IRLC taxa, with two in trnI-CAU, and one in each of trnA-UGC, trnI-GAU, trnT-UGU, and trnV-GAC, respectively. In contrast, the non-IRLC class only occupied losses in the trnH-GUG gene (twice). To further untangle these loss events, meticulous alignments were conducted combining both sequences and annotations. Notably, the results indicated three various causes that might lead to the tRNA losses, as illustrated in Figure 1. Deletion events accounted for the most cases, including the absence of trnA-UGC and trnI-GAU from Glycyrrhiza asymmetrica (each missing an exon), and trnV-GAC from Vicia sativa. However, the losses of trnT-UGU in Vicia sativa, as well as of trnI-CAU in Vicia cracca and Callerya dielsiana, involved more complex mechanisms as follows: deletion–insertion and deletion–rearrangement events, respectively. It is important to note that the losses of trnH-GUG appeared to be due to incomplete sequencing, especially reflected by the annotated fragmented IR regions.
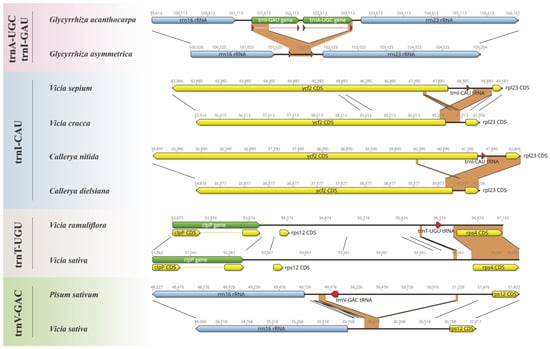
Figure 1.
Illustration of the loss events in the plastomic tRNAs among Papilionoideae. For each loss, we compared the lost tRNA and its adjacent genes with the corresponding regions of the closely related species without such a loss.
Among the pttRNAs investigated, the overall sizes averaged at 76 nt and ranged from 65 (trnH-GUG) to 94 (trnS-UGA) nt. The vast majority of isotypes fell within a narrow range of 72–74 nt. Exceptions included the relatively longer tRNALeu (ca. 83 nt), tRNATyr (ca. 84 nt), and tRNASer (ca. 89 nt), as well as shorter tRNACys (71 nt) (Table 1). In general, the pttRNAs from both the IRLC and non-IRLC classes displayed high size similarities. The sole exception was trnS-UGA, which displayed an average difference of about 3 nt, mainly due to a 4 nt deletion observed in some IRLC species.
3.2. Remarkable Variations in Conserved Sequences between IRLC and Non-IRLC Clade pttRNAs
In this study, we conducted individual consensus sequence analyses for all 30 isoacceptor tRNAs. Notably, the consensus sequences of the Papilionoideae pttRNAs were well established for each single isoacceptor type (Figure 2). Interestingly, trnR-ACG was found to be the only completely identical pttRNA across Papilionoideae. Conversely, some tRNAs, such as trnC-GCA, trnV-GAC, trnF-GAA, and trnL-CAA, exhibited greater interspecific diversity.
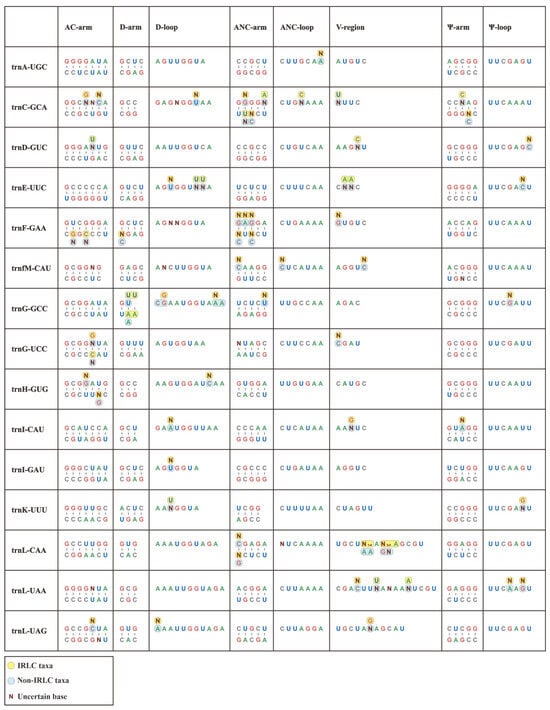
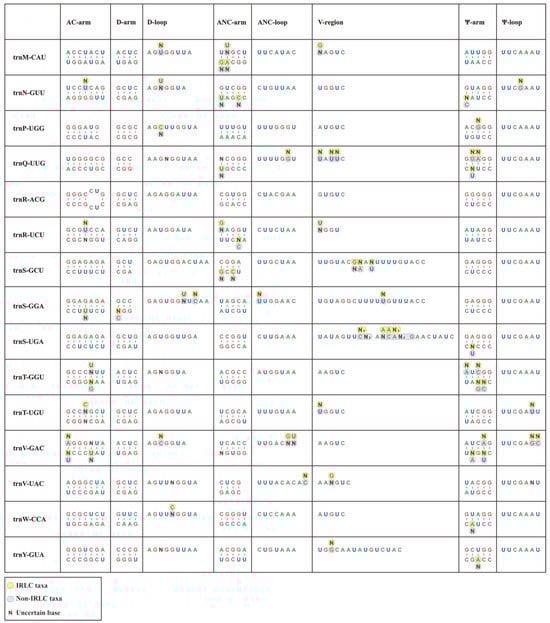
Figure 2.
Conserved consensus sequences of 30 isoacceptor tRNAs of IRLC and non-IRLC chloroplasts. All the calculated consensus sequences were mapped to secondary structural regions.
Overall, the consensus sequences that were mapped to secondary structures revealed a clear pattern of conservation, with the Ψ-loop being the only highly conserved region. This region featured a UUCxAxU consensus sequence. Outside of this loop, we identified limited conservation, with isolated and single-site conserved nucleotides at specific positions. The first position of the AC-arm was mostly occupied by a G base, except for trnM, trnN, trnQ, and trnV with A, U, U, and A, respectively. The D-loop conservatively comprised an A base at both the first and last positions, except for trnC-GCA, trnG-GCC, trnI-CAU, trnL-UAG, trnS-GCU, and trnS-GGA. Similarly, a terminal A nucleotide was also identified in most ANC-loops.
In addition, we compared individual consensus sequences of pttRNAs between the IRLC and non-IRLC classes. Significantly, the results showed that inter-lineage variations occurred across all tRNAs, with the only exception of trnR-ACG (Figure 2). Almost all these variations emerged at single base positions, spanning the stems and loops at the secondary structural level. To quantify these variations, we calculated the mutation rates for various structural regions. This involved dividing the number of mutated position positions by the total sequence size of the corresponding region (Table S2a). Notably, the pttRNAs of IRLC and non-IRLC taxa varied most greatly in trnC-GCA (0.1549), followed by trnV-GAC (0.1528) and trnF-GAA (0.1233). Among the eight structural regions of tRNA, the V-regions accounted for most of the inter-lineage pttRNA differences, with mutation rates significantly higher than other regions (p < 0.05) (Table S2b). Interestingly, a more detailed analysis of the mutated positions indicated a substitution bias in IRLC pttRNAs toward A or U bases (54.90%) compared to non-IRLC pttRNAs (46.25%). Additionally, the IRLC group contained approximately twice the number of uncertain bases as “other clade”.
3.3. Intron Analyses Revealed Substantial Inter-Lineage Structural Disparities and Informative Indels
Within the Papilionoideae pttRNAs investigated, six tRNAs (trnA-UGC, trnG-UCC, trnI-GAU, trnK-UUU, trnL-UAA, and trnV-UAC) were found to contain intronic regions. Overall, the annotated pttRNA introns displayed a high level of disparity in length, ranging from 239 to 2764 bp. The introns of trnK-UUU were considerably longer than others, with a mean ± SD value of 2522.76 ± 52.03 (Table S3). In contrast, the introns of the six genes were relatively more conserved in GC content among Papilionoideae, with an average of around 30%, except for trnA-UGC and trnI-GAU, which featured 49.53% and 47.81%, respectively (Table S3).
At the inter-lineage level, we observed varying degrees of divergence in intron size between IRLC and non-IRLC pttRNAs (Table 2 and Figure 3). The most striking intronic differences were found in trnI-GAU, where the intron sizes of IRLC genes were significantly smaller than those of the non-IRLC taxa (Figure 3). To further investigate these differences, we analyzed the consensus intronic sequences of IRLC and non-IRLC trnI-GAU and predicted their secondary structures. As shown in Figure 4, a comprehensive comparison revealed several highly informative inter-lineage variations. Specifically, compared to the trnI-GAU intron of non-IRLC taxa, IRLC exhibited 16 single-nucleotide polymorphisms (SNPs), as well as two deletions, a small 21 nt and a large 248 nt. Notably, among the SNPs, 12 mutations were C to U or G to A, one was U to A, and three were U to C (all indicated the mutations from non-IRLC to IRLC taxa). The majority (13 loci) were located in loops. Most importantly, our results clearly demonstrated that the 248 nt insertion resulted in five extra arms in non-IRLC compared to IRLC taxa, leading to the largest inter-lineage difference in trnI-GAU intronic structures.
Table 2.
General features of the tRNA introns among Papilionoideae plastomes.
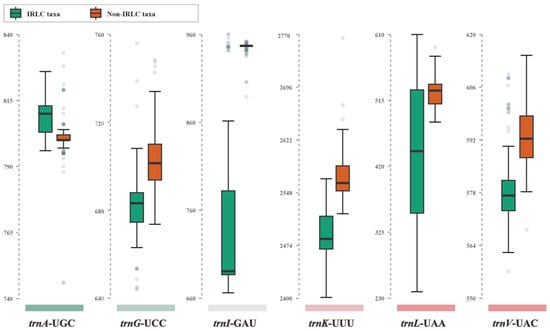
Figure 3.
Boxplot of intron sizes of six isoacceptor tRNAs between IRLC and non-IRLC chloroplasts. The upper and lower bounds of each box represented the Q3 and Q1 quartiles. The thick line in each box indicated the median value. The horizontal lines extending from the top and bottom of the box represent the maximum and minimum values. The dots denoted the outliers.
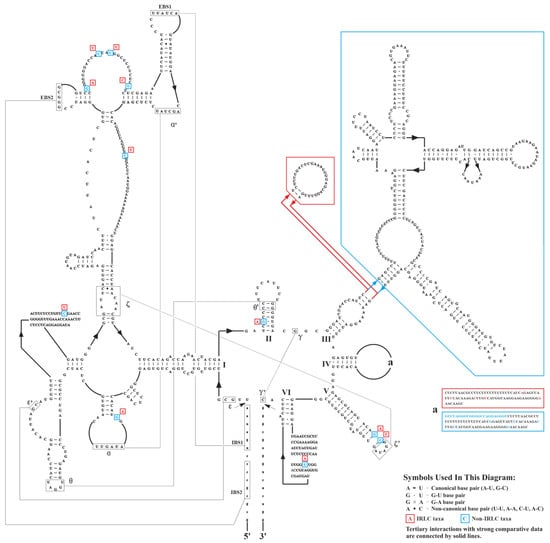
Figure 4.
Predicted secondary structures of the consensus sequences of IRLC and non-IRLC trnI-GAU introns. The variations were highlighted with red boxes for IRLC group and blue boxes for non-IRLC group. Note that IBS = internal binding site and EBS = external binding site.
For all 265 Papilionoideae taxa, the indel events were assessed individually within the six genic introns. In total, the alignment matrixes illustrated 94 informative indels, with distributions across the introns as follows: trnV-UAC (2), trnL-UAA (10), trnI-GAU (10), trnA-UGC (19), trnG-UCC (23), and trnK-UUU (30), respectively. (Table S4). Interestingly, over half (63, 67.02%) were insertions, while the rest (31, 32.98%) were deletions. Indel sizes ranged from 1 to 385 nt, with no insertions exceeding 30 nt. In contrast, the deletion events possessed wider length fluctuations of 3–385 nt, with the longest two identified in trnL-UAA (385 and 280 nt), followed by 273 nt deletion from trnK-UUU. Furthermore, numerous lineage-specific indels were revealed at both genus (41) and tribe/clade (27) levels (Table S4). Most importantly, the identified No. 18 indel (see Table S4), one 3 nt deletion from trnA-UGC introns, could clearly distinguish the whole large IRLC group from other Papilionoideae taxa.
3.4. Atypical Structures Identified in Papilionoideae pttRNAs
Secondary structure prediction revealed considerable atypical structures differing from the classical cloverleaf shape in 10 isoacceptor pttRNAs across Papilionoideae (Figure 5). Specifically, they were found in various regions, including the AC-arms of trnR-ACG and trnT-UGU (each with an extra loop); ANC-loops of trnL-UAA and trnV-UAC (both with expanded loop); V-regions of trnL-CAA, trnS-GCU, trnS-GGA, trnS-UGA, and trnY-GUA (with bulky stems and loops); as well as Ψ-arm of trnC-GCA (with an extra loop).
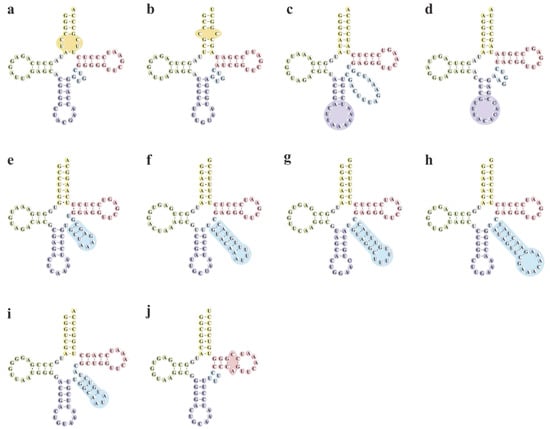
Figure 5.
Putative secondary structures of atypical pttRNAs in Papilionoideae taxa. The specific non-typical structures were marked with circles. (a) trnR-ACG. (b) trnT-UGU. (c) trnL-UAA. (d) trnV-UAC. (e) trnL-CAA. (f) trnS-GCU. (g) trnS-GGA. (h) trnS-UGA. (i) trnY-GUA. (j) trnC-GCA.
To assess the stability of the atypical structures predicted in our study, we calculated their minimum free energies (MFE ΔG) and compared them to those of typical pttRNAs. The average ΔG values ranged from –33.02 to –24.20 kcal/mol (Table S5), with seven atypical pttRNAs showing lower ΔG than typical ones (average ΔG = –25.50 kcal/mol), including trnL-UAA (–26.54 kcal/mol), trnR-ACG (–26.80 kcal/mol), etc. (Table 3). These findings suggested that the structural changes in these tRNAs possibly improved their general stability. However, there were also three classes of atypical structures (trnC-GCA, trnL-CAA, and trnV-UAC) found to be less stable than typical ones. Most noteworthily, the inter-lineage differences converged upon two particular pttRNAs, trnS-GGA and trnS-UGA. Within these two pttRNAs, the IRLC group exhibited significantly lower MFE compared to non-IRLC taxa (p < 0.05), suggesting flexible structures in the IRLC group.
Table 3.
Calculated minimal free energies of the tRNAs with atypical structures.
3.5. Hyper-Variable Patterns of Nucleotide Substitutions in pttRNAs at the Inter-Lineage Level
We conducted substitution analyses separately for the IRLC and non-IRLC groups. Using multiple alignments of 30 isoacceptor pttRNAs, we identified a total of 4410 substitution events within Papilionoideae, with 3120 in IRLC and 1290 in non-IRLC (Table S6a). In general, IRLC tRNAs had considerably higher substitution and transition rates (ti) (p < 0.05) but only moderately higher transversion rates (tv). As shown in Table 4, for ti, the two lineages showed the greatest variation in trnQ-UUG (2.00% for IRLC and 0.41% for non-IRLC), followed by trnV-GAC (1.96% vs. 0.50%) and trnE-UUC (0.25% vs. 1.43%). Similarly, the highest variability in tv ratio was traced in trnS-GCU (0.89% vs. 0.08%), then trnfM-CAU (0.53% vs. 0.01%) and trnL-UAA (0.12% vs. 0.61%). Moreover, for both groups, most ti/tv ratios exceed 1 (1.09–59.00), except for trnL-UAA (0.81) and trnS-GCU (0.21) in IRLC, as well as trnM-CAU (0.50), trnQ-UUG (0.86), trnR-UCU (0.86), and trnS-UGA (0.94) in non-IRLC (Table 4).
Table 4.
Substitution frequencies in tRNAs among Papilionoideae plastomes.
We further analyzed the specific types of substitutions (A–G, C–U, A–C, C–G, G–U, and U–A) at both whole-tRNA and isoacceptor-tRNA levels (Table S6a). At the whole-tRNA level, only slight variations were observed between IRLC and non-IRLC taxa, with C–U transitions being more frequent in both lineages. However, when analyzed at the isoacceptor–tRNA level, abundant hyper-variable substitution patterns were detected (Figure 6a). According to the Chi-squared statistic, the proportions of each of the six substitution types significantly differed between the two lineages in all 28 comparable tRNAs (with all p < 0.05).
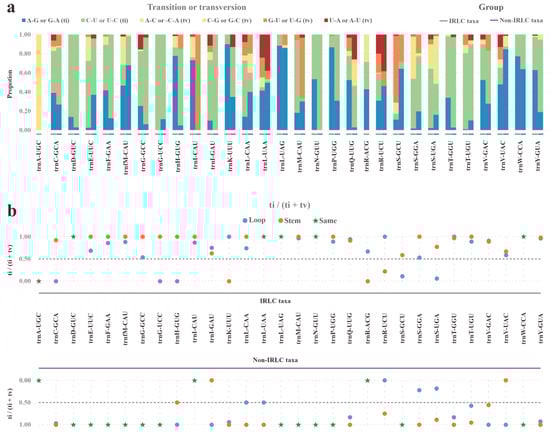
Figure 6.
Substitution events of IRLC and non-IRLC pttRNAs. (a) The proportions of six substitution types in 30 isoacceptor pttRNAs. The IRLC and non-IRLC groups were marked with grey and purple boxes respectively. (b) Ratio of ti to (ti + tv) of loop- and stem-located substitutions. The blue and orange dots denoted loops and stems respectively. The pentagrams indicated the case that the loop- and stem-located substitutions possessed the same values of ti/(ti + tv).
Given the stable tRNA secondary structures, we mapped the substitutions to loop and stem regions and then comprehensively compared them. The first comparison focused on the stem-located substitutions, which were further divided into compensatory and non-compensatory types. Noteworthily, in both the IRLC and non-IRLC taxa, non-compensatory substitutions were around 20 times more frequent than compensatory ones (Table S6b). Another comparison examined the variability between loops and stems substitutions. To facilitate the ti and tv assessments, only non-compensatory substitutions in stems were compared to those in loops. Our results showed stems accumulated more substitutions than loops in both lineages. More importantly, the overall ti/(ti + tv) ratio was significantly higher for stem substitutions than for loops, with values of 0.92 and 0.76 in IRLC and 0.97 and 0.71 in non-IRLC (Figure 6b and Table S6b). This suggested that transversions were possibly more prone to elimination than transitions in stems.
4. Discussion
In this work, we made a relatively dense sampling comprising 156 IRLC and 109 non-IRLC Papilionoideae species, focusing on the comprehensive explorations of 7942 pttRNAs. We examined their general genomic characteristics, secondary structures, intronic regions, and substitution rates. Collectively, we were dedicated to the following: (1) untangling the unique features of the IRLC pttRNAs compared to non-IRLC taxa that with two canonical IR copies and (2) reaching a better understanding of pttRNA evolution in the IRLC group and the subfamily Papilionoideae.
Known as ancient macromolecules, tRNAs play multiple cellular roles, with translation being their most emblematic function [73]. The degenerate canonical genetic code contains 61 codons encoding 20 essential AAs [87,88,89]. Excitingly, previous studies have revealed the 21st and 22nd AAs, Pyrrolysine (Pyl) and selenocysteine (Sec), decoded by reassigned codons UAG and UGA, respectively [90,91,92,93]. While tRNAPyl is rare, found only in a few archaea and bacteria [94], tRNASec is present in both prokaryotes and eukaryotes [90]. This study identified tRNAs for all 20 standard AAs in Papilionoideae plastomes but lacked tRNASec. Their absence is consistent with prior findings in Gossypium [74], Adoxaceae [65], monocot [95], gymnosperm plants [75], and a recent large-scale study involving 5959 species [96]. This suggests that these tRNAs are generally absent from plastomes.
Traditionally, 32 tRNAs were thought necessary to decode the genetic code [97]. However, Percudani’s relaxed wobble rules have allowed one tRNA to decode four possible codons [98]. Photosynthetic plastomes typically possess 30 tRNA species, with isoacceptor pattern variations [99]. Our study identified 30 pttRNA isoacceptor types in the Papilionoideae taxa, demonstrating similarities between the IRLC and non-IRLC groups. Interestingly, an anticodon table of 215,966 pttRNAs from multiple lineages revealed the most frequent isoacceptor tRNAs for each isotype [96], consistent with our findings on the composition of Papilionoideae pttRNA pools. Inspired by insights from Moriyama and Powell [100], this consistency may result from strong selective pressure. Translation processes are primarily influenced by tRNA availability, and changes in isoacceptor pattern impact codon bias [100]. Most importantly, this theory sheds light on the putative evolutionary differences between the translations of IRLC and other Papilionoideae taxa with classical two IR copies. Although their isoacceptor patterns are similar, IRLC taxa have lost seven IR-located pttRNAs, leading to reduced tRNA availability and influencing optimal codon choice during IRLC plastid evolution [100,101].
Due to functional constraints, tRNAs display high mutational intolerance and are evolutionarily conserved [95,102]. Notably, nucleotide-composition patterns significantly impact tRNAs structure and function [103]. We analyzed conserved sequences within Papilionoideae pttRNAs (whole subfamily, IRLC, and non-IRCL) to identify both similarities and variabilities, providing valuable insights into their evolutionary history.
Firstly, regarding similarities, the Ψ-loop (U1-U2-C3-x4-A5-x6-U7) emerged as the only highly conserved region across all investigated tRNAs, consistent with observations in Adoxaceae [65], monocots [95], and Cyanobacteria [104]. This conserved pattern may result from the key role of Ψ-loop nucleotides in forming and stabilizing the tertiary L-shape structure of tRNAs through interactions with the D-arm [105]. Chan et al. [106] attribute the functions of the Ψ-loop to specific nucleotides, with U and A at positions 1 and 5 closing the loop structure, pyrimidine and purine at 2 and 4 forming base-stacks, as well as a conserved cytidine at position 3 stabilizing the bond between loops by pairing with the G1 and G2 of D-loop.
Secondly, concerning variabilities, the most striking difference was observed in trnC-GCA consensus sequences at 11 of 71 positions between IRLC and non-IRLC isoacceptor pttRNAs. Interestingly, trnC-GCA is an essential gene for plant cell development, as demonstrated by Legen et al. [107], who showed that its knockout leads to incomplete leaf laminas and abnormal plastid development. The presence of mutated nucleotides in the Papilionoideae pttRNA sequence (IRLC vs. non-IRLC) can influence both structure and function, ultimately mirroring different evolutionary patterns. Moreover, another important inter-lineage variation was identified as the overwhelmingly more un-consensus bases of IRLC than non-IRLC pttRNAs. As suggested by Schmeing et al. [108], mutations in tRNAs may result in more flexible structures or stabilize interactions within the A/T state, ultimately leading to miscoding [108]. Based on this, we propose that high diversities might cause significant compensation for the effects of lost IR-located tRNAs from IRLC chloroplasts. In conclusion, this study’s analysis of consensus tRNA sequences reveals not only the obvious similarities and differences between the IRLC and non-IRLC pttRNAs but also offers new insights into IRLC evolutionary patterns.
The tRNA genes with intervening sequences (IVS, or introns) are detected across all kingdoms of organisms [109]. Compared to coding regions, the IVSs generally embody more diversities [110]. In particular, plastid introns have been recognized as a great resource for understanding lineage evolution [111,112,113]. Nevertheless, there are currently no in-depth explorations for IVSs of Papilionoideae pttRNAs. The present work identified a total of 1588 intron-containing tRNAs from 265 Papilionoid legumes, which were assigned to six isoacceptor types. While tRNA IVSs are typically small [109], the trnK-UUU intron was an exception, with an average size of 2522.76 bp. Notably, the trnK IVS harbors a large open reading frame, encoding a maturase-like protein [114]. This suggests an important function for this unusually large intron. Moreover, selection pressures might be acting on specific IVSs during evolution, as evidenced by the study in Drosophila [115]. Interestingly, one notable discovery in this study was the dramatic variations in trnI-GAU IVSs between IRLC and non-IRLC taxa. In comparison to the non-IRLC taxa, the IRLC trnI-GAU IVSs almost all lack a bulky, highly structured region. Similar variability has also been reported in peanut plastomes [116], suggesting a rapid evolutionary process affecting both sequence and structure of this intron. Meanwhile, given that the IVS can function on both the DNA- and RNA-levels [109], the significant inter-lineage variations could result in significant transcript and splicing differences between IRLC and non-IRLC taxa. Most importantly, this trnI-GAU intronic difference as well as the 3 nt deletion in trnA-UGC introns could collectively serve as unique markers for IRLC discrimination.
The tRNA family is known for its consistent secondary and tertiary structures [75], which are crucial for interactions with multiple molecules [117]. Despite this stability, flexibility within these structures is needed. Recent studies in various taxa have shown a growing interest in some particular secondary structures that differ from the canonical cloverleaf model [58,59,60,63,65,74,75]. These atypical structures might hold highly informative evolutionary significances. In our work, we systematically examined the secondary structures of Papilionoideae pttRNAs and discovered abundant atypical extra loops (AC-, ANC-, and Ψ-regions) and a large V-region. The latter was documented in 1976 [118] and used to classify tRNAs into two groups based on V-region sizes. Type I has a small loop (4–5 nt), while type II embodies a bulkier loop (3–5 nt) and stem (3–7 bp). Interestingly, type II tRNAs for leucine, serine, and tyrosine show high evolutionary conservation [119]. Consistent with this, our analyses in Papilionoideae identified five type-II isoacceptor pttRNAs from trnL, trnS, and trnY.
The MFE reflects RNA stability and is used for structure prediction [120,121,122,123]. Unusual structures in gymnosperm chloroplast tRNAs significantly alter MFE, impacting stability [75]. In Papilionoideae, the atypical bulky V-regions in most pttRNAs (except trnL-CAA) considerably decrease the putative free energies, implying an increased stability level. The large V-region in type II tRNA plays a crucial role in the catalytic reaction by facilitating a more planar L-shape and maintaining high catalytic efficiency [119,124]. The high stabilities of type II tRNAs contribute to their binding with the ribosome. Conversely, the increased MFE and redundant loop in Ψ-arms indicate a less stable shape. As documented, the Ψ-arm acts is crucial for stabilizing the overall tRNA structures by connecting with the D-arm to form the molecular core [117,125], and its disruption might cause fluctuations in the surrounding regions [126]. The predicted structural changes in the Ψ-arm would anticipatedly reduce the stability of the Papilionoideae trnC-GCA genes.
Molecular clock theory suggests that molecular sequence changes strongly reflect lineage evolutionary rates [127]. It is also important to note that substitution rates can vary within and between genome levels, impacted by factors such as the DNA repair system and chromosomal location [104]. Our comprehensive comparisons of IRLC and non-IRLC substitutions in Papilionoideae revealed significantly higher substitution frequencies in IRLC pttRNAs, indicating that the IRLC taxa may have experienced a weaker purifying selection than the non-IRLC species [86]. Both lineages showed a bias towards transitions, potentially reflecting weaker effects on tRNA function compared to transversions [86,128,129,130]. This bias may be attributed to selective constraints on tRNA structures [86,131]. Moreover, it has been proposed that the substitution rates of pttRNAs could vary among different angiosperms [65]. Here, the ti/tv value of IRLC pttRNAs (3.56) was slightly higher than that of the non-IRLC taxa (3.31) and notably higher than the reported values for Adoxaceae (3.13, investigated among five species) [65] and monocot (2.86, investigated among seven species) [95], indicating varying substitution rates among different angiosperm lineages.
Our comparisons also emphasize compensatory and non-compensatory substitutions in stem regions. Previous RNA studies reported two main findings as follows: (1) higher frequencies of compensatory than non-compensatory types in mammalian mt-rRNA, mt-tRNAs [132], and bacterial rRNAs [133]; and (2) the opposite case in bacterial tRNAs [86]. Consistent with the second finding, our Papilionoideae pttRNAs data show a preference for non-compensatory substitutions, maybe due to their lower stability requirements, as proposed by Sen et al. [86]. Furthermore, in comparison with loop regions, the stems of Papilionoideae pttRNAs comprised less proportions of tv events. This can be most likely attributed to the more deleterious effects of transversions on stem structures than loops. Overall, most notably, all the above findings in this research not only give a detailed assessment of the Papilionoideae pttRNA substitutions but also provide important insights into the evolutionary processes of this lineage.
5. Conclusions
This work presents the first investigation of pttRNA variability and evolution within Papilionoideae, using dense samplings for both IRLC (156) and non-IRLC (109) lineages. We comprehensively examined differences in tRNA genomic features, consensus sequences, intron sequences and structures, secondary structures, and substitution events. Our findings displayed a generally conserved pattern in Papilionoideae pttRNAs, including gene content, GC content, and size, with the only exception of the 3 nt difference in average length of trnS-UGA. However, the tRNA consensus sequences showed high variation, especially across the isoacceptors, with the highest mutation rates in trnC-GCA, trnV-GAC, and trnF-GAA, and the V-regions displayed the most divergence in secondary structure. Additionally, this study identified unique markers for IRLC discrimination, including a 248 nt loss in the intron of trnI-GAU and a 3 nt deletion in trnA-UGC. The study also found that ten pttRNAs had atypical secondary structures, with IRLC trnS-GGA and trnS-UGA having significantly lower MFE than non-IRLC (p < 0.05). Finally, despite a similar trend of transition bias, the specific substitution compositions of all compared pttRNAs varied considerably at the inter-lineage level (with all p < 0.05). The non-compensatory substitutions were nearly 20 times more than the compensatory types. Our in-depth comparisons suggested that the tv seems to be more prone to elimination than ti in tRNA stems. In conclusion, this study identified unique markers for IRLC lineages within Papilionoideae and suggests that the IRLC tRNAs exhibit higher diversity in sequences and structures compared to the non-IRLC taxa, potentially compensating for the loss of an IR copy. Although the present dataset is still insufficient, considering the extremely high species richness of this family, the findings presented here will certainly be instructive for understanding the evolution of Papilionoideae and pttRNAs, especially for those evolved diversities between the IRLC and non-IRLC taxa.
Supplementary Materials
The following supporting information can be downloaded at: https://www.mdpi.com/article/10.3390/horticulturae10090932/s1, Table S1: Investigated plastomes of Papilionoideae taxa; Table S2a: The mutation rates identified from the consensus sequences of IRLC and non-IRLC pttRNAs; Table S2b: The one-way analysis of variance (ANOVA) among the calculated mutation rates; Table S3: Size and GC content of tRNA introns among Papilionoideae plastomes; Table S4: List of microstructural changes that were marked from the indel matrix; Table S5: Structural variations and minimal free energies of pttRNAs among Papilionoideae; Table S6a: Specific transitions and transversions in Papilionoideae plastomic tRNAs; Table S6b: Transitions and transversions that mapped to secondary structures in Papilionoideae plastomic tRNAs.
Author Contributions
Conceptualization, X.K.; methodology, S.H.; software, S.Z. and J.Y.; validation, W.G.; formal analysis, S.H.; investigation, H.P. and H.W.; resources, W.G.; data curation, S.H.; writing—original draft preparation, S.H.; writing—review and editing, X.K.; supervision, X.K.; project administration, B.Z. and X.K.; funding acquisition, C.D., B.Z. and X.K. All authors have read and agreed to the published version of the manuscript.
Funding
This research was funded by the Science and Technological Project of Wuhu, grant number 2023yf077.
Data Availability Statement
This research generated no new data. All the analyzed sequences were retrieved from the NCBI database.
Acknowledgments
We are grateful for computation resources from the High-Performance Computing System at National Engineering Laboratory of Soil Pollution Control and Remediation Technologies, CAS Key Laboratory of Soil Environment and Pollution Remediation, Institute of Soil Science, Chinese Academy of Sciences.
Conflicts of Interest
The authors declare no conflicts of interest.
References
- Group, L.P.W.; Bruneau, A.; Doyle, J.J.; Herendeen, P.; Hughes, C.; Kenicer, G.; Lewis, G.; Mackinder, B.; Pennington, R.T.; Sanderson, M.J. Legume phylogeny and classification in the 21st century: Progress, prospects and lessons for other species-rich clades. Taxon 2013, 62, 217–248. [Google Scholar]
- Lewis, G.P.; Schrire, B.D.; Mackinder, B.A.; Rico, L.; Clark, R. A 2013 linear sequence of legume genera set in a phylogenetic context—A tool for collections management and taxon sampling. S. Afr. J. Bot. 2013, 89, 76–84. [Google Scholar] [CrossRef]
- Yahara, T.; Javadi, F.; Onoda, Y.; de Queiroz, L.P.; Faith, D.P.; Prado, D.E.; Akasaka, M.; Kadoya, T.; Ishihama, F.; Davies, S. Global legume diversity assessment: Concepts, key indicators, and strategies. Taxon 2013, 62, 249–266. [Google Scholar] [CrossRef]
- Cardoso, D.; De Queiroz, L.P.; Pennington, R.T.; De Lima, H.C.; Fonty, É.; Wojciechowski, M.F.; Lavin, M. Revisiting the phylogeny of papilionoid legumes: Naew insights from comprehensively sampled early-branching lineages. Am. J. Bot. 2012, 99, 1991–2013. [Google Scholar] [CrossRef] [PubMed]
- Bentham, G. Leguminosae; Frid. Fleischer in Komm: Munich, Germany, 1865. [Google Scholar]
- Käss, E.; Wink, M. Phylogenetic relationships in the Papilionoideae (family Leguminosae) based on nucleotide sequences of cpDNA (rbcL) and ncDNA (ITS 1 and 2). Mol. Phylogenet. Evol. 1997, 8, 65–88. [Google Scholar] [CrossRef] [PubMed]
- Taubert, P. Leguminosae. In Die Natürlichen Pflanzenfamilien; Engler, A., Anton, K., Eds.; W. Engelmann: Leipzig, Germany, 1891; pp. 70–396. [Google Scholar]
- Kajita, T.; Ohashi, H.; Tateishi, Y.; Bailey, C.D.; Doyle, J.J. rbcL and legume phylogeny, with particular reference to Phaseoleae, Millettieae, and allies. Syst. Bot. 2001, 26, 515–536. [Google Scholar]
- Doyle, J.J.; Chappill, J.A.; Bailey, C.D.; Kajita, T. Towards a comprehensive phylogeny of legumes: Evidence from rbcL sequences and non-molecular data. In Advances in Legume Systematics; Herendeen, P.S., Bruneau, A., Eds.; Royal Botanic Gardens: Kew, Australia, 2000; Volume 9, pp. 1–20. [Google Scholar]
- Luckow, M.; White, P.; Bruneau, A. Relationships among the basal genera of mimosoid legumes. In Advances in Legume Systematics; Herendeen, P.S., Bruneau, A., Eds.; Royal Botanic Gardens: Kew, Australia, 2000; Volume 9, pp. 165–180. [Google Scholar]
- Azani, N.; Babineau, M.; Bailey, C.D.; Banks, H.; Barbosa, A.R.; Pinto, R.B.; Boatwright, J.S.; Borges, L.M.; Brown, G.K.; Bruneau, A. A new subfamily classification of the Leguminosae based on a taxonomically comprehensive phylogeny: The Legume Phylogeny Working Group (LPWG). Taxon 2017, 66, 44–77. [Google Scholar] [CrossRef]
- Wojciechowski, M.F.; Lavin, M.; Sanderson, M.J. A phylogeny of legumes (Leguminosae) based on analysis of the plastid matK gene resolves many well-supported subclades within the family. Am. J. Bot. 2004, 91, 1846–1862. [Google Scholar] [CrossRef]
- Cardoso, D.; Pennington, R.T.; de Queiroz, L.P.; Boatwright, J.S.; Van Wyk, B.-E.; Wojciechowski, M.; Lavin, M. Reconstructing the deep-branching relationships of the papilionoid legumes. S. Afr. J. Bot. 2013, 89, 58–75. [Google Scholar] [CrossRef]
- McMahon, M.M.; Sanderson, M.J. Phylogenetic supermatrix analysis of GenBank sequences from 2228 papilionoid legumes. Syst. Biol. 2006, 55, 818–836. [Google Scholar] [CrossRef]
- Lavin, M.; Herendeen, P.S.; Wojciechowski, M.F. Evolutionary rates analysis of Leguminosae implicates a rapid diversification of lineages during the tertiary. Syst. Biol. 2005, 54, 575–594. [Google Scholar] [CrossRef]
- da Silva, F.G.; de Moraes Filho, R.M.; Martins, L.S.S.; da Silva Ramos, R.; Silva, G.C. Plastid marker-based phylogeny reveals insights into relationships among Papilionoideae species. Genet. Resour. Crop. Evol. 2023, 71, 439–454. [Google Scholar] [CrossRef]
- Pennington, R.T.; Lavin, M.; Ireland, H.; Klitgaard, B.; Preston, J.; Hu, J.-M. Phylogenetic relationships of basal papilionoid legumes based upon sequences of the chloroplast trnL intron. Syst. Bot. 2001, 26, 537–556. [Google Scholar]
- Herendeen, P.S. Phylogenetic relationships of the tribe Swartzieae. In Advances in Legume Systematics, Part 7, Phylogeny; Crisp, M.D., Doyal, J.J., Eds.; Royal Botanic Gardens: Kew, Australia, 1995; pp. 123–132. [Google Scholar]
- Doyle, J.J.; Doyle, J.L.; Ballenger, J.A.; Dickson, E.E.; Kajita, T.; Ohashi, H. A phylogeny of the chloroplast gene rbcL in the Leguminosae: Taxonomic correlations and insights into the evolution of nodulation. Am. J. Bot. 1997, 84, 541–554. [Google Scholar] [CrossRef] [PubMed]
- Cardoso, D.; São-Mateus, W.M.; da Cruz, D.T.; Zartman, C.E.; Komura, D.L.; Kite, G.; Prenner, G.; Wieringa, J.J.; Clark, A.; Lewis, G. Filling in the gaps of the papilionoid legume phylogeny: The enigmatic Amazonian genus Petaladenium is a new branch of the early-diverging Amburaneae clade. Mol. Phylogenet. Evol. 2015, 84, 112–124. [Google Scholar] [CrossRef] [PubMed]
- Castellanos, C.; Steeves, R.; Lewis, G.P.; Bruneau, A. A settled sub-family for the orphan tree: The phylogenetic position of the endemic Colombian genus Orphanodendron in the Leguminosae. Brittonia 2017, 69, 62–70. [Google Scholar] [CrossRef]
- de Queiroz, L.P.; São-Mateus, W.; Delgado-Salinas, A.; Torke, B.M.; Lewis, G.P.; Dorado, Ó.; Ardley, J.K.; Wojciechowski, M.F.; Cardoso, D. A molecular phylogeny reveals the Cuban enigmatic genus Behaimia as a new piece in the Brongniartieae puzzle of papilionoid legumes. Mol. Phylogenet. Evol. 2017, 109, 191–202. [Google Scholar] [CrossRef]
- Ramos, G.; de Lima, H.C.; Prenner, G.; de Queiroz, L.P.; Zartman, C.E.; Cardoso, D. Molecular systematics of the Amazonian genus Aldina, a phylogenetically enigmatic ectomycorrhizal lineage of papilionoid legumes. Mol. Phylogenet. Evol. 2016, 97, 11–18. [Google Scholar] [CrossRef]
- Choi, I.S.; Cardoso, D.; de Queiroz, L.P.; de Lima, H.C.; Lee, C.; Ruhlman, T.A.; Jansen, R.K.; Wojciechowski, M.F. Highly resolved papilionoid legume phylogeny based on plastid phylogenomics. Front. Plant. Sci. 2022, 13, 823190. [Google Scholar] [CrossRef]
- Wojciechowski, M.F.; Sanderson, M.J.; Steele, K.P.; Liston, A. Molecular phylogeny of the “temperate herbaceous tribes” of papilionoid legumes: A supertree approach. In Advances in Legume Systematics; Herendeen, P.S., Bruneau, A., Eds.; Royal Botanic Gardens: Kew, Australia, 2000; Volume 9, pp. 277–298. [Google Scholar]
- Doyle, J.J.; Doyle, J.L.; Ballenger, J.; Palmer, J. The distribution and phylogenetic significance of a 50-kb chloroplast DNA inversion in the flowering plant family Leguminosae. Mol. Phylogenet. Evol. 1996, 5, 429–438. [Google Scholar] [CrossRef]
- Charboneau, J.L.; Cronn, R.C.; Liston, A.; Wojciechowski, M.F.; Sanderson, M.J. Plastome structural evolution and homoplastic inversions in Neo-Astragalus (Fabaceae). Genome Biol. Evol. 2021, 13, evab215. [Google Scholar] [CrossRef] [PubMed]
- Martin, G.E.; Rousseau-Gueutin, M.; Cordonnier, S.; Lima, O.; Michon-Coudouel, S.; Naquin, D.; de Carvalho, J.F.; Aïnouche, M.; Salmon, A.; Aïnouche, A. The first complete chloroplast genome of the Genistoid legume Lupinus luteus: Evidence for a novel major lineage-specific rearrangement and new insights regarding plastome evolution in the legume family. Ann. Bot. 2014, 113, 1197–1210. [Google Scholar] [CrossRef] [PubMed]
- Sabir, J.; Schwarz, E.; Ellison, N.; Zhang, J.; Baeshen, N.A.; Mutwakil, M.; Jansen, R.; Ruhlman, T. Evolutionary and biotechnology implications of plastid genome variation in the inverted-repeat-lacking clade of legumes. Plant Biotechnol. J. 2014, 12, 743–754. [Google Scholar] [CrossRef] [PubMed]
- Palmer, J.D.; Thompson, W.F. Chloroplast DNA rearrangements are more frequent when a large inverted repeat sequence is lost. Cell 1982, 29, 537–550. [Google Scholar] [CrossRef]
- Jansen, R.K.; Wojciechowski, M.F.; Sanniyasi, E.; Lee, S.-B.; Daniell, H. Complete plastid genome sequence of the chickpea (Cicer arietinum) and the phylogenetic distribution of rps12 and clpP intron losses among legumes (Leguminosae). Mol. Phylogenet. Evol. 2008, 48, 1204–1217. [Google Scholar] [CrossRef]
- Schwarz, E.N.; Ruhlman, T.A.; Sabir, J.S.; Hajrah, N.H.; Alharbi, N.S.; Al-Malki, A.L.; Bailey, C.D.; Jansen, R.K. Plastid genome sequences of legumes reveal parallel inversions and multiple losses of rps16 in papilionoids. J. Syst. Evol. 2015, 53, 458–468. [Google Scholar] [CrossRef]
- Gu, Y.; Xing, S.; He, C. Genome-wide analysis indicates lineage-specific gene loss during Papilionoideae evolution. Genome Biol. Evol. 2016, 8, 635–648. [Google Scholar] [CrossRef]
- Wojciechowski, M.F.; Sanderson, M.J.; Hu, J.-m. Evidence on the monophyly of Astragalus (Fabaceae) and its major subgroups based on nuclear ribosomal DNA ITS and chloroplast DNA trnL intron data. Syst. Bot. 1999, 24, 409–437. [Google Scholar] [CrossRef]
- Endo, Y.; Ohashi, H. Cladistic analysis of phylogenetic relationships among tribes Cicereae, Trifolieae, and Vicieae (Leguminosae). Am. J. Bot. 1997, 84, 523–529. [Google Scholar] [CrossRef]
- Heenan, P. Phylogenetic analysis of the Carmichaelia complex, Clianthus, and Swainsona (Fabaceae), from Australia and New Zealand. N. Z. J. Bot. 1998, 36, 21–40. [Google Scholar]
- Hu, J.-m.; Lavin, M.; Wojciechowski, M.F.; Sanderson, M.J. Phylogenetic analysis of nuclear ribosomal ITS/5.8 S sequences in the tribe Millettieae (Fabaceae): Poecilanthe-Cyclolobium, the core Millettieae, and the Callerya group. Syst. Bot. 2002, 27, 722–733. [Google Scholar]
- Duan, L.; Wen, J.; Yang, X.; Liu, P.-L.; Arslan, E.; Ertuğrul, K.; Chang, Z.-Y. Phylogeny of Hedysarum and tribe Hedysareae (Leguminosae: Papilionoideae) inferred from sequence data of ITS, matK, trnL-F and psbA-trnH. Taxon 2015, 64, 49–64. [Google Scholar] [CrossRef]
- Compton, J.; Lane, C. Wisteria: The Complete Guide; RHS Media: London, UK, 2019. [Google Scholar]
- Lewis, G.; Schrire, B.; MacKinder, B.; Lock, M. (Eds.) Legumes of the World; Royal Botanic Gardens: Kew, Australia, 2005. [Google Scholar]
- Magee, A.M.; Aspinall, S.; Rice, D.W.; Cusack, B.P.; Semon, M.; Perry, A.S.; Stefanovic, S.; Milbourne, D.; Barth, S.; Palmer, J.D.; et al. Localized hypermutation and associated gene losses in legume chloroplast genomes. Genome Res. 2010, 20, 1700–1710. [Google Scholar] [CrossRef]
- Cai, Z.; Guisinger, M.; Kim, H.-G.; Ruck, E.; Blazier, J.C.; McMurtry, V.; Kuehl, J.V.; Boore, J.; Jansen, R.K. Extensive reorganization of the plastid genome of Trifolium subterraneum (Fabaceae) is associated with numerous repeated sequences and novel DNA insertions. J. Mol. Evol. 2008, 67, 696–704. [Google Scholar] [CrossRef]
- Xia, M.Q.; Liao, R.Y.; Zhou, J.T.; Lin, H.Y.; Li, J.H.; Li, P.; Fu, C.X.; Qiu, Y.X. Phylogenomics and biogeography of Wisteria: Implications on plastome evolution among inverted repeat-lacking clade (IRLC) legumes. J. Syst. Evol. 2022, 60, 253–265. [Google Scholar] [CrossRef]
- Choi, I.-S.; Jansen, R.; Ruhlman, T. Lost and found: Return of the inverted repeat in the legume clade defined by its absence. Genome Biol. Evol. 2019, 11, 1321–1333. [Google Scholar] [CrossRef] [PubMed]
- Son, O.; Choi, K.S. Characterization of the Chloroplast Genome Structure of Gueldenstaedtia verna (Papilionoideae) and Comparative Analyses among IRLC Species. Forests 2022, 13, 1942. [Google Scholar] [CrossRef]
- Choi, I.S.; Jansen, R.; Ruhlman, T. Caught in the act: Variation in plastid genome inverted repeat expansion within and between populations of Medicago minima. Ecol. Evol. 2020, 10, 12129–12137. [Google Scholar] [CrossRef]
- Tian, C.; Li, X.; Wu, Z.; Li, Z.; Hou, X.; Li, F.Y. Characterization and comparative analysis of complete chloroplast genomes of three species from the genus Astragalus (Leguminosae). Front. Genet. 2021, 12, 705482. [Google Scholar] [CrossRef]
- Moghaddam, M.; Wojciechowski, M.F.; Kazempour-Osaloo, S. Characterization and comparative analysis of the complete plastid genomes of four Astragalus species. PLoS. ONE 2023, 18, e0286083. [Google Scholar] [CrossRef]
- Feng, J.; Xiong, Y.; Su, X.; Liu, T.; Xiong, Y.; Zhao, J.; Lei, X.; Yan, L.; Gou, W.; Ma, X. Analysis of complete chloroplast genome: Structure, phylogenetic relationships of Galega orientalis and evolutionary inference of Galegeae. Genes 2023, 14, 176. [Google Scholar] [CrossRef] [PubMed]
- Keys, R.; Smith, S.; Mogensen, H.L.; Small, E. Microgametophytic plastid nucleoid content and reproductive and life history traits of tribe Trifolieae (Fabaceae). Plant. Syst. Evol. 1995, 196, 89–98. [Google Scholar] [CrossRef]
- Moghaddam, M.; Kazempour-Osaloo, S. Extensive survey of the ycf4 plastid gene throughout the IRLC legumes: Robust evidence of its locus and lineage specific accelerated rate of evolution, pseudogenization and gene loss in the tribe Fabeae. PLoS. ONE 2020, 15, e0229846. [Google Scholar] [CrossRef] [PubMed]
- Wang, Z.-X.; Wang, D.-J.; Yi, T.-S. Does IR-loss promote plastome structural variation and sequence evolution? Front. Plant. Sci. 2022, 13, 888049. [Google Scholar] [CrossRef]
- Zhang, Z.; Zhang, Y.; Song, M.; Guan, Y.; Ma, X. Species identification of Dracaena using the complete chloroplast genome as a super-barcode. Front. Pharmacol. 2019, 10, 1441. [Google Scholar] [CrossRef] [PubMed]
- Chen, X.; Zhou, J.; Cui, Y.; Wang, Y.; Duan, B.; Yao, H. Identification of Ligularia herbs using the complete chloroplast genome as a super-barcode. Front. Pharmacol. 2018, 9, 695. [Google Scholar] [CrossRef]
- Xia, Y.; Hu, Z.; Li, X.; Wang, P.; Zhang, X.; Li, Q.; Lu, C. The complete chloroplast genome sequence of Chrysanthemum indicum. Mitochondrial DNA A 2016, 27, 4668–4669. [Google Scholar] [CrossRef]
- Daniell, H.; Lin, C.-S.; Yu, M.; Chang, W.-J. Chloroplast genomes: Diversity, evolution, and applications in genetic engineering. Genome Biol. 2016, 17, 134. [Google Scholar] [CrossRef]
- Ding, H.; Han, S.; Ye, Y.; Bi, D.; Zhang, S.; Yi, R.; Gao, J.; Yang, J.; Wu, L.; Kan, X. Ten Plastomes of Crassula (Crassulaceae) and Phylogenetic Implications. Biology 2022, 11, 1779. [Google Scholar] [CrossRef]
- Han, S.; Bi, D.; Yi, R.; Ding, H.; Wu, L.; Kan, X. Plastome evolution of Aeonium and Monanthes (Crassulaceae): Insights into the variation of plastomic tRNAs, and the patterns of codon usage and aversion. Planta 2022, 256, 35. [Google Scholar] [CrossRef]
- Han, S.; Ding, H.; Bi, D.; Zhang, S.; Yi, R.; Gao, J.; Yang, J.; Ye, Y.; Wu, L.; Kan, X. Structural Diversities and Phylogenetic Signals in Plastomes of the Early-Divergent Angiosperms: A Case Study in Saxifragales. Plants 2022, 11, 3544. [Google Scholar] [CrossRef]
- Han, S.; Wang, R.; Hong, X.; Wu, C.; Zhang, S.; Kan, X. Plastomes of Bletilla (Orchidaceae) and Phylogenetic Implications. Int. J. Mol. Sci. 2022, 23, 10151. [Google Scholar] [CrossRef] [PubMed]
- Bi, D.; Han, S.; Zhou, J.; Zhao, M.; Zhang, S.; Kan, X. Codon Usage Analyses Reveal the Evolutionary Patterns among Plastid Genes of Saxifragales at a Larger-Sampling Scale. Genes 2023, 14, 694. [Google Scholar] [CrossRef]
- Yang, J.; Ye, Y.; Yi, R.; Bi, D.; Zhang, S.; Han, S.; Kan, X. A new perspective on codon usage, selective pressure, and phylogenetic implications of the plastomes in the Telephium clade (Crassulaceae). Gene 2023, 892, 147871. [Google Scholar] [CrossRef]
- Zhang, T.T.; Yang, Y.; Song, X.Y.; Gao, X.Y.; Zhang, X.L.; Zhao, J.J.; Zhou, K.H.; Zhao, C.B.; Li, W.; Yang, D.G.; et al. Novel structural variation and evolutionary characteristics of chloroplast tRNA in Gossypium plants. Genes 2021, 12, 822. [Google Scholar] [CrossRef]
- Goodenbour, J.M.; Pan, T. Diversity of tRNA genes in eukaryotes. Nucleic. Acids. Res. 2006, 34, 6137–6146. [Google Scholar] [CrossRef]
- Zhong, Q.Y.; Fu, X.G.; Zhang, T.T.; Zhou, T.; Yue, M.; Liu, J.N.; Li, Z.H. Phylogeny and evolution of chloroplast tRNAs in Adoxaceae. Ecol. Evol. 2021, 11, 1294–1309. [Google Scholar] [CrossRef]
- Fujishima, K.; Sugahara, J.; Kikuta, K.; Hirano, R.; Sato, A.; Tomita, M.; Kanai, A. Tri-split tRNA is a transfer RNA made from 3 transcripts that provides insight into the evolution of fragmented tRNAs in archaea. Proc. Natl. Acad. Sci. USA 2009, 106, 2683–2687. [Google Scholar] [CrossRef] [PubMed]
- Chan, P.P.; Cozen, A.E.; Lowe, T.M. Discovery of permuted and recently split transfer RNAs in Archaea. Genome Biol. 2011, 12, R38. [Google Scholar] [CrossRef]
- Soma, A.; Onodera, A.; Sugahara, J.; Kanai, A.; Yachie, N.; Tomita, M.; Kawamura, F.; Sekine, Y. Permuted tRNA genes expressed via a circular RNA intermediate in Cyanidioschyzon merolae. Science 2007, 318, 450–453. [Google Scholar] [CrossRef] [PubMed]
- Randau, L.; Münch, R.; Hohn, M.J.; Jahn, D.; Söll, D. Nanoarchaeum equitans creates functional tRNAs from separate genes for their 5′-and 3′-halves. Nature 2005, 433, 537–541. [Google Scholar] [CrossRef]
- Zuo, Z.; Peng, D.; Yin, X.; Zhou, X.; Cheng, H.; Zhou, R. Genome-wide analysis reveals origin of transfer RNA genes from tRNA halves. Mol. Biol. Evol. 2013, 30, 2087–2098. [Google Scholar] [CrossRef] [PubMed]
- Francklyn, C.S.; Minajigi, A. tRNA as an active chemical scaffold for diverse chemical transformations. FEBS. Lett. 2010, 584, 366–375. [Google Scholar] [CrossRef]
- Hurto, R.L. Unexpected functions of tRNA and tRNA processing enzymes. In RNA Infrastructure and Networks; Collins, L.J., Ed.; Springer: New York, NY, USA, 2011; pp. 137–155. [Google Scholar]
- Katz, A.; Elgamal, S.; Rajkovic, A.; Ibba, M. Non-canonical roles of tRNAs and tRNA mimics in bacterial cell biology. Mol. Microbiol. 2016, 101, 545–558. [Google Scholar] [CrossRef]
- Wang, N.; Dong, W.L.; Zhang, X.J.; Zhou, T.; Huang, X.J.; Li, B.G.; Liu, J.N.; Ma, X.F.; Li, Z.H. Evolutionary characteristics and phylogeny of cotton chloroplast tRNAs. Planta 2021, 254, 116. [Google Scholar] [CrossRef] [PubMed]
- Zhao, Y.-H.; Zhou, T.; Wang, J.-X.; Li, Y.; Fang, M.-F.; Liu, J.-N.; Li, Z.-H. Evolution and structural variations in chloroplast tRNAs in gymnosperms. BMC Genomics 2021, 22, 750. [Google Scholar] [CrossRef]
- Johnson, M.; Zaretskaya, I.; Raytselis, Y.; Merezhuk, Y.; McGinnis, S.; Madden, T.L. NCBI BLAST: A better web interface. Nucleic. Acids. Res. 2008, 36, W5–W9. [Google Scholar] [CrossRef] [PubMed]
- Shi, L.; Chen, H.; Jiang, M.; Wang, L.; Wu, X.; Huang, L.; Liu, C. CPGAVAS2, an integrated plastome sequence annotator and analyzer. Nucleic. Acids. Res. 2019, 47, W65–W73. [Google Scholar] [CrossRef]
- Tillich, M.; Lehwark, P.; Pellizzer, T.; Ulbricht-Jones, E.S.; Fischer, A.; Bock, R.; Greiner, S. GeSeq–versatile and accurate annotation of organelle genomes. Nucleic. Acids. Res. 2017, 45, W6–W11. [Google Scholar] [CrossRef]
- Chan, P.P.; Lin, B.Y.; Mak, A.J.; Lowe, T.M. tRNAscan-SE 2.0: Improved detection and functional classification of transfer RNA genes. Nucleic. Acids. Res. 2021, 49, 9077–9096. [Google Scholar] [CrossRef]
- Sullivan, M.J.; Petty, N.K.; Beatson, S.A. Easyfig: A genome comparison visualizer. Bioinformatics 2011, 27, 1009–1010. [Google Scholar] [CrossRef]
- Mitchell, C. MultAlin–multiple sequence alignment. Cabios. Soft. Rev. 1993, 9, 614–615. [Google Scholar] [CrossRef]
- Katoh, K.; Standley, D.M. MAFFT multiple sequence alignment software version 7: Improvements in performance and usability. Mol. Biol. Evol. 2013, 30, 772–780. [Google Scholar] [CrossRef] [PubMed]
- Borsch, T.; Hilu, K.; Quandt, D.; Wilde, V.; Neinhuis, C.; Barthlott, W. Noncoding plastid trnT-trnF sequences reveal a well resolved phylogeny of basal angiosperms. J. Evol. Biol 2003, 16, 558–576. [Google Scholar] [CrossRef] [PubMed]
- Hall, T.A. BioEdit: A user-friendly biological sequence alignment editor and analysis program for Windows 95/98/NT. Nucleic. Acids. Symp. Ser. 1999, 41, 95–98. [Google Scholar]
- Cannone, J.J.; Subramanian, S.; Schnare, M.N.; Collett, J.R.; D’Souza, L.M.; Du, Y.; Feng, B.; Lin, N.; Madabusi, L.V.; Müller, K.M. The comparative RNA web (CRW) site: An online database of comparative sequence and structure information for ribosomal, intron, and other RNAs. BMC Bioinform. 2002, 3, 2. [Google Scholar] [CrossRef] [PubMed]
- Sen, P.; Aziz, R.; Deka, R.C.; Feil, E.J.; Ray, S.K.; Satapathy, S.S. Stem Region of tRNA Genes Favors Transition Substitution Towards Keto Bases in Bacteria. J. Mol. Evol. 2022, 90, 114–123. [Google Scholar] [CrossRef]
- Lehman, N. Molecular evolution: Please release me, genetic code. Curr. Biol. 2001, 11, R63–R66. [Google Scholar] [CrossRef][Green Version]
- Keeling, P.J.; Doolittle, W.F. A non-canonical genetic code in an early diverging eukaryotic lineage. EMBO. J. 1996, 15, 2285–2290. [Google Scholar] [CrossRef]
- Agris, P.F.; Vendeix, F.A.; Graham, W.D. tRNA’s wobble decoding of the genome: 40 years of modification. J. Mol. Biol. 2007, 366, 1–13. [Google Scholar] [CrossRef]
- Lukashenko, N.P. Expanding genetic code: Amino acids 21 and 22, selenocysteine and pyrrolysine. Russ. J. Genet. 2010, 46, 899–916. [Google Scholar] [CrossRef]
- Bock, A.; Forchhammer, K.; Heider, J.; Baron, C. Selenoprotein synthesis: An expansion of the genetic code. Trends Biochem. Sci. 1991, 16, 463–467. [Google Scholar] [CrossRef] [PubMed]
- Srinivasan, G.; James, C.M.; Krzycki, J.A. Pyrrolysine encoded by UAG in Archaea: Charging of a UAG-decoding specialized tRNA. Science 2002, 296, 1459–1462. [Google Scholar] [CrossRef] [PubMed]
- Stadtman, T.C. Selenocysteine. Annu. Rev. Biochem. 1996, 65, 83–100. [Google Scholar] [CrossRef]
- Tharp, J.M.; Ehnbom, A.; Liu, W.R. tRNAPyl: Structure, function, and applications. RNA Biol. 2018, 15, 441–452. [Google Scholar] [CrossRef]
- Mohanta, T.K.; Khan, A.L.; Hashem, A.; Allah, E.F.A.; Yadav, D.; Al-Harrasi, A. Genomic and evolutionary aspects of chloroplast tRNA in monocot plants. BMC Plant. Biol. 2019, 19, 39. [Google Scholar] [CrossRef]
- Mohanta, T.K.; Mohanta, Y.K.; Sharma, N. Anticodon table of the chloroplast genome and identification of putative quadruplet anticodons in chloroplast tRNAs. Sci. Rep. 2023, 13, 760. [Google Scholar] [CrossRef]
- Crick, F.H. Codon—anticodon pairing: The wobble hypothesis. J. Mol. Biol. 1966, 19, 548–555. [Google Scholar] [CrossRef]
- Percudani, R. Restricted wobble rules for eukaryotic genomes. Trends Genet. 2001, 17, 133–135. [Google Scholar] [CrossRef]
- Michaud, M.; Cognat, V.; Duchene, A.M.; Marechal-Drouard, L. A global picture of tRNA genes in plant genomes. Plant. J. 2011, 66, 80–93. [Google Scholar] [CrossRef]
- Moriyama, E.N.; Powell, J.R. Codon usage bias and tRNA abundance in Drosophila. J. Mol. Evol. 1997, 45, 514–523. [Google Scholar] [CrossRef] [PubMed]
- Ikemura, T. Correlation between codon usage and tRNA content in microorganisms. In Transfer RNA in Protein Synthesis; Hatfield, D.L., Lee, B.J., Pirtle, R., Eds.; CRC Press: Boca Raton, FL, USA, 1992; pp. 87–111. [Google Scholar]
- Guy, M.P.; Young, D.L.; Payea, M.J.; Zhang, X.; Kon, Y.; Dean, K.M.; Grayhack, E.J.; Mathews, D.H.; Fields, S.; Phizicky, E.M. Identification of the determinants of tRNA function and susceptibility to rapid tRNA decay by high-throughput in vivo analysis. Genes. Dev. 2014, 28, 1721–1732. [Google Scholar] [CrossRef]
- Smit, S.; Knight, R.; Heringa, J. RNA structure prediction from evolutionary patterns of nucleotide composition. Nucleic. Acids. Res. 2009, 37, 1378–1386. [Google Scholar] [CrossRef] [PubMed]
- Mohanta, T.K.; Syed, A.S.; Ameen, F.; Bae, H. Novel genomic and evolutionary perspective of Cyanobacterial tRNAs. Front. Genet. 2017, 8, 200. [Google Scholar] [CrossRef]
- Shi, H.; Moore, P.B. The crystal structure of yeast phenylalanine tRNA at 1.93 Å resolution: A classic structure revisited. Rna 2000, 6, 1091–1105. [Google Scholar] [CrossRef] [PubMed]
- Chan, C.W.; Chetnani, B.; Mondragón, A. Structure and function of the T-loop structural motif in noncoding RNAs. Wiley Interdiscip. Rev. RNA 2013, 4, 507–522. [Google Scholar] [CrossRef]
- Legen, J.; Wanner, G.; Herrmann, R.G.; Small, I.; Schmitz-Linneweber, C. Plastid tRNA genes trnC-GCA and trnN-GUU are essential for plant cell development. Plant. J. 2007, 51, 751–762. [Google Scholar] [CrossRef]
- Schmeing, T.M.; Voorhees, R.M.; Kelley, A.C.; Ramakrishnan, V. How mutations in tRNA distant from the anticodon affect the fidelity of decoding. Nat. Struct. Mol. Biol. 2011, 18, 432–436. [Google Scholar] [CrossRef]
- Schmidt, C.A.; Matera, A.G. tRNA introns: Presence, processing, and purpose. Wiley Interdiscip. Rev. RNA 2020, 11, e1583. [Google Scholar] [CrossRef]
- Lohne, C.; Borsch, T. Molecular evolution and phylogenetic utility of the petD group II intron: A case study in basal angiosperms. Mol. Biol. Evol. 2005, 22, 317–332. [Google Scholar] [CrossRef]
- Creer, S. Choosing and using introns in molecular phylogenetics. Evol. Bioinform. 2007, 3, 99–108. [Google Scholar] [CrossRef]
- Liss, M.; Kirk, D.L.; Beyser, K.; Fabry, S. Intron sequences provide a tool for high-resolution phylogenetic analysis of volvocine algae. Curr. Genet. 1997, 31, 214–227. [Google Scholar] [CrossRef]
- Kelchner, S.A. Group II introns as phylogenetic tools: Structure, function, and evolutionary constraints. Am. J. Bot. 2002, 89, 1651–1669. [Google Scholar] [CrossRef] [PubMed]
- Neuhaus, H.; Link, G. The chloroplast tRNALys(UUU) gene from mustard (Sinapis alba) contains a class II intron potentially coding for a maturase-related polypeptide. Curr. Genet. 1987, 11, 251–257. [Google Scholar] [CrossRef] [PubMed]
- Lu, Z.; Filonov, G.S.; Noto, J.J.; Schmidt, C.A.; Hatkevich, T.L.; Wen, Y.; Jaffrey, S.R.; Matera, A.G. Metazoan tRNA introns generate stable circular RNAs in vivo. RNA 2015, 21, 1554–1565. [Google Scholar] [CrossRef] [PubMed]
- Wang, J.; Li, C.; Yan, C.; Zhao, X.; Shan, S. A comparative analysis of the complete chloroplast genome sequences of four peanut botanical varieties. PeerJ 2018, 6, e5349. [Google Scholar] [CrossRef]
- Lorenz, C.; Lunse, C.E.; Morl, M. tRNA modifications: Impact on structure and thermal adaptation. Biomolecules 2017, 7, 35. [Google Scholar] [CrossRef]
- Brennan, T.; Sundaralingam, M. Structure, of transfer RNA molecules containing the long variable loop. Nucleic. Acids. Res. 1976, 3, 3235–3252. [Google Scholar] [CrossRef]
- Dock-Bregeon, A.C.; Westhof, E.; Giege, R.; Moras, D. Solution structure of a tRNA with a large variable region: Yeast tRNASer. J. Mol. Biol. 1989, 206, 707–722. [Google Scholar] [CrossRef]
- Zarringhalam, K.; Meyer, M.M.; Dotu, I.; Chuang, J.H.; Clote, P. Integrating chemical footprinting data into RNA secondary structure prediction. PLoS. ONE 2012, 7, e45160. [Google Scholar] [CrossRef]
- Hofacker, I.L. Energy-directed RNA structure prediction. In RNA Sequence, Structure, and Function: Computational and Bioinformatic Methods; Jan, G., Walter, L.R., Eds.; Humana: Totowa, NJ, USA, 2014; pp. 71–84. [Google Scholar]
- Will, S.; Jabbari, H. Sparse RNA folding revisited: Space-efficient minimum free energy structure prediction. Algorithms. Mol. Biol. 2016, 11, 7. [Google Scholar] [CrossRef] [PubMed]
- Miklós, I.; Meyer, I.M.; Nagy, B. Moments of the Boltzmann distribution for RNA secondary structures. Bull. Math. Biol. 2005, 67, 1031–1047. [Google Scholar] [CrossRef] [PubMed]
- Holmes, W.M.; Andraos-Selim, C.; Roberts, I.; Wahab, S. Structural requirements for tRNA methylation. Action of Escherichia coli tRNA (guanosine-1) methyltransferase on tRNA (1Leu) structural variants. J. Biol. Chem. 1992, 267, 13440–13445. [Google Scholar] [CrossRef] [PubMed]
- Biela, A.; Hammermeister, A.; Kaczmarczyk, I.; Walczak, M.; Koziej, L.; Lin, T.Y.; Glatt, S. The diverse structural modes of tRNA binding and recognition. J. Biol. Chem. 2023, 299, 104966. [Google Scholar] [CrossRef]
- Kiryu, H.; Asai, K. Rchange: Algorithms for computing energy changes of RNA secondary structures in response to base mutations. Bioinformatics 2012, 28, 1093–1101. [Google Scholar] [CrossRef]
- Zuckerkandl, E. Molecular disease, evolution, and genic heterogeneity. In Horizons in Biochemistry; Kasha, M., Pullman, B., Eds.; Academic Press: New York, NY, USA, 1962; pp. 189–225. [Google Scholar]
- Gojobori, T.; Li, W.-H.; Graur, D. Patterns of nucleotide substitution in pseudogenes and functional genes. J. Mol. Evol. 1982, 18, 360–369. [Google Scholar] [CrossRef]
- Stoltzfus, A.; Norris, R.W. On the causes of evolutionary transition: Transversion bias. Mol. Biol. Evol. 2016, 33, 595–602. [Google Scholar] [CrossRef]
- Wu, C.-I.; Maeda, N. Inequality in mutation rates of the two strands of DNA. Nature 1987, 327, 169–170. [Google Scholar] [CrossRef]
- Knies, J.L.; Dang, K.K.; Vision, T.J.; Hoffman, N.G.; Swanstrom, R.; Burch, C.L. Compensatory evolution in RNA secondary structures increases substitution rate variation among sites. Mol. Biol. Evol. 2008, 25, 1778–1787. [Google Scholar] [CrossRef]
- Jow, H.; Hudelot, C.; Rattray, M.; Higgs, P. Bayesian phylogenetics using an RNA substitution model applied to early mammalian evolution. Mol. Biol. Evol. 2002, 19, 1591–1601. [Google Scholar] [CrossRef]
- Higgs, P.G. RNA secondary structure: Physical and computational aspects. Q. Rev. Biophys. 2000, 33, 199–253. [Google Scholar] [CrossRef] [PubMed]


Disclaimer/Publisher’s Note: The statements, opinions and data contained in all publications are solely those of the individual author(s) and contributor(s) and not of MDPI and/or the editor(s). MDPI and/or the editor(s) disclaim responsibility for any injury to people or property resulting from any ideas, methods, instructions or products referred to in the content. |
© 2024 by the authors. Licensee MDPI, Basel, Switzerland. This article is an open access article distributed under the terms and conditions of the Creative Commons Attribution (CC BY) license (https://creativecommons.org/licenses/by/4.0/).