Article

Climate Influence on Leaf Appearance and Ligustroflavone and Rhoifolin Compounds of Turpinia arguta (Lindl.) Seem. from Different Chinese Habitats

1
Jiangxi Key Laboratory of Horticultural Crops Breeding, Vegetable and Flower Institute, Jiangxi Academy of Agricultural Sciences, Nanchang 330200, China
2
College of Forestry, Jiangxi Agricultural University, Nanchang 330022, China
3
Key Laboratory of Traditional Chinese Medicine Germplasm Selection and Breeding, Jiangxi Province Academy of Traditional Chinese Medicine, Nanchang 330046, China
4
Crops Research Institute, Jiangxi Academy of Agricultural Sciences, Nanchang 330200, China
5
Institute of Forest Medicine and Food, Jiangxi Academy of Forestry, Nanchang 330032, China
*
Authors to whom correspondence should be addressed.
These authors contributed equally to this work.
Horticulturae 2024, 10(9), 935; https://doi.org/10.3390/horticulturae10090935
Submission received: 16 July 2024 / Revised: 26 August 2024 / Accepted: 30 August 2024 / Published: 1 September 2024
(This article belongs to the Section Medicinals, Herbs, and Specialty Crops)

Abstract

:
The dry leaf of Turpinia arguta (Lindl.) Seem. is used in traditional Chinese medicine as a quick-acting product for sore throat and pharyngitis relief. Samples of T. arguta were collected from 40 different habitats mostly located in Jiangxi Province, and leaf appearance traits and dry matter yield were analyzed. HPLC was used to quantify ligustroflavone and rhoifolin, the pharmacological-quality markers for this species, according to the 2020 Edition of Chinese Pharmacopoeia. The correlations between leaf-measurable traits, ligustroflavone and rhoifolin contents, and climate factors were subsequently assessed using Pearson’s two-tailed correlation test and redundancy analysis. The highest dry matter yields were found in locations S(G-mt), Q(J-t), and A(X-t). Ligustroflavone and rhoifolin contents ranged from 0.023% to 1.336% and 0.008% to 0.962%, respectively; the highest levels of ligustroflavone and rhoifolin compounds were found in locations A(X-t) and Y(B-mt). Leaf morphology was influenced by the mean temperature of the warmest quarter, while leaf thickness was affected by the minimum temperature of the coldest month, precipitation seasonality, and solar radiation. Larger and thicker leaves predicted higher yields of ligustroflavone and rhoifolin compounds in T. arguta under Chinese southern conditions, such as those in Anyuan and Quannan counties. Our findings suggest that enhancing the mean diurnal temperature range and implementing appropriate shading during cultivation can enhance the ligustroflavone and rhoifolin compounds of T. arguta.

1. Introduction

Turpinia arguta (Lindl.) Seem. is an evergreen shrub or small tree plant belonging to the Staphyleaceae family [1,2], and was included in the 2020 edition of the Chinese Pharmacopoeia [3]. Its dried leaves contain various compounds such as flavonoids, ursolic acids, glycosides, and fenic acids [4]. Recognized for its bitter taste and cold-natured properties, T. arguta has interesting effects on human health: heat-clearing, detoxification, reduction of throat swelling, promotion of blood circulation, and pain relief are some documented effects [5]. This plant is commonly used for treating tonsillitis and throat arthralgia, sore throat, ulcers swollen poison, and traumatic injuries [6]. Moreover, it serves as a primary raw material for Shanxiangyuan buccal lozenge pieces and granules. Ligustroflavone and rhoifolin are flavonoid compounds; ligustroflavone is predominantly found in Ligustrum lucidum [7] and T. arguta, being a potent antioxidant that can inhibit free-radical-induced hemolysis of red blood cells, prevent osteoporosis [8], and exhibit anti-aging, antitumor, and anticancer effects [9]. Rhoifolin, mainly derived from T. arguta and plants of Rutaceae [10], is an antioxidant with antitumor and antihypertensive effects. Both secondary metabolites were obtained from T. arguta dried leaves [11] and have been selected as marker compounds for the quality control of this herb. According to the last edition of the Chinese Pharmacopoeia, their contents should be not less than 0.30% and 0.10%, respectively [3].
While the number of Chinese patent medicine products derived from Chinese herbal medicine keeps rising continuously, the wild resources of T. arguta are scarce, far from meeting the volume demanded by domestic and foreign markets. Currently, local pharmaceutical companies require over 2000 tons of T. arguta’s dried leaves annually. However, the annual supply of wild leaves reaches only 100 to 200 tons, generating a severe imbalance between the supply and demand of wild material [2]. The abundance of T. arguta resources and their extensive natural distribution in Jiangxi Province indicate that this Chinese province possesses favorable environmental conditions and unique advantages for developing the artificial cultivation of this plant.
In recent years, under the institutional support of Jiangxi Province to promote the traditional Chinese medicine industry and the forest economy, the T. arguta industry had an unprecedentedly favorable opportunity for development. Farmers, cooperatives, and enterprises in Jiangxi Province are currently cultivating T. arguta, with an increase at a rate of 20–30 ha per year. A number of large-scale demonstration bases have been established and have radiated to neighboring provinces such as Guangxi, Hunan, Hubei, and Zhejiang. The average annual yield increment exceeds USD 50 per ha, and the development trend is encouraging. However, it is essential to select excellent source material and a suitable cultivation environment.
Previous reports document a significant variation in leaf morphology [12], as well as notable differences in the content of ligustroflavone and rhoifolin among leaves originating from different regions [13]. It has been indicated that the morphological structure of medicinal plants and their secondary metabolite profile are directly influenced by the diverse natural environments across the different regions where they grow [14]. Climate factors determine the ecological environment, encompassing precipitation, temperature, solar radiation, frost-free period, and other variables. Medicinal plants usually exhibit varying degrees of sensitivity to climatic conditions. For instance, regional disparities in atractylenolideIII content in Atractylodes macrocephala were attributed to variations in precipitation and sunshine [15]. The average annual precipitation is the primary influencing factor on linarin content in Chrysanthemum [16]. Humidity and light play pivotal roles as climatic factors affecting the quality of Artemisia annua [17]. The annual temperature range, annual precipitation, precipitation in the wettest month, precipitation seasonality, and precipitation in the coldest quarter were identified as dominant climatic factors associated with high centellosides content in Centella asiatica [18]. Furthermore, the accumulation of tanshinone IIA in Salvia miltiorrhiza was significantly correlated with April’s and May’s precipitations as well as with October’s maximum temperature and standard deviation of temperature seasonality [19]. The annual relative humidity and sunshine period have also been pointed out as key climate factors impacting Astragaloside and Astragalus polysaccharides accumulation [20]. Therefore, conducting systematic studies on the appearance and qualitative traits of medicinal herbs, along with their responses to climate factors, is crucial for elucidating the ecological quality of these materials.
Until now, most studies in T. arguta have focused on the chemical composition, optimization of the extraction methods to obtain bioactive compounds, pharmacological effects [5,21], and seedling cultivation [22]. Recent relevant research has addressed novel Turpinia applications such as feed for animals [23,24], ointment [25], mosquito repellent [26], hand sanitizer [27], etc. However, significant issues exist in the production of T. arguta, encompassing uneven germplasm resources, simplistic and extensive planting management, and challenging quality control. Moreover, there is a dearth of relevant research, particularly regarding the impact of environmental and climatic factors on its morphological traits and quality attributes. In this work, leaf traits and ligustroflavone and rhoifolin concentrations in T. arguta leaves collected from various Chinese locations were analyzed and compared, and the relationships among leaf shape, chemical composition, and climate factors were explored. The aim of this study was to screen out the superior and high-quality resources of T. arguta sinense and identify the primary climatic influencing factors. The research findings could offer a theoretical foundation for the breeding of, and provide valuable insights for improving quality control practices and identifying suitable cultivation environments for, this relevant medicinal plant.

2. Materials and Methods

2.1. Instruments and Reagents

HPLC was conducted using an Ultra High-Performance Liquid Chromatograph (Waters Co., Ltd., Beijing, China) with a TUV Detector (Waters Co., Ltd., Beijing, China). An LA-S flat panel, touch blade area instrument (Wanshen Testing Technology Co., Ltd., Hangzhou, China), and 573–601 digital display vernier caliper (Tengshang Technology Co., Ltd., Hangzhou, China, accuracy 0.02 mm) were utilized for the analysis. Ligustroflavone and rhoifolin (Desit Technology Co., Ltd., Chengdu, China), with batch numbers DST200913-007 and DSTDY005301, respectively, having both a purity of ≥98%, were employed as marker compounds. Deionized water was used throughout the experiments, and methanol of chromatographic purity (batch number WXBD8692V, Merck Co., Shanghai, China) was used as the solvent. All other reagents used were of analytical grade (Merck Co., Shanghai, China).

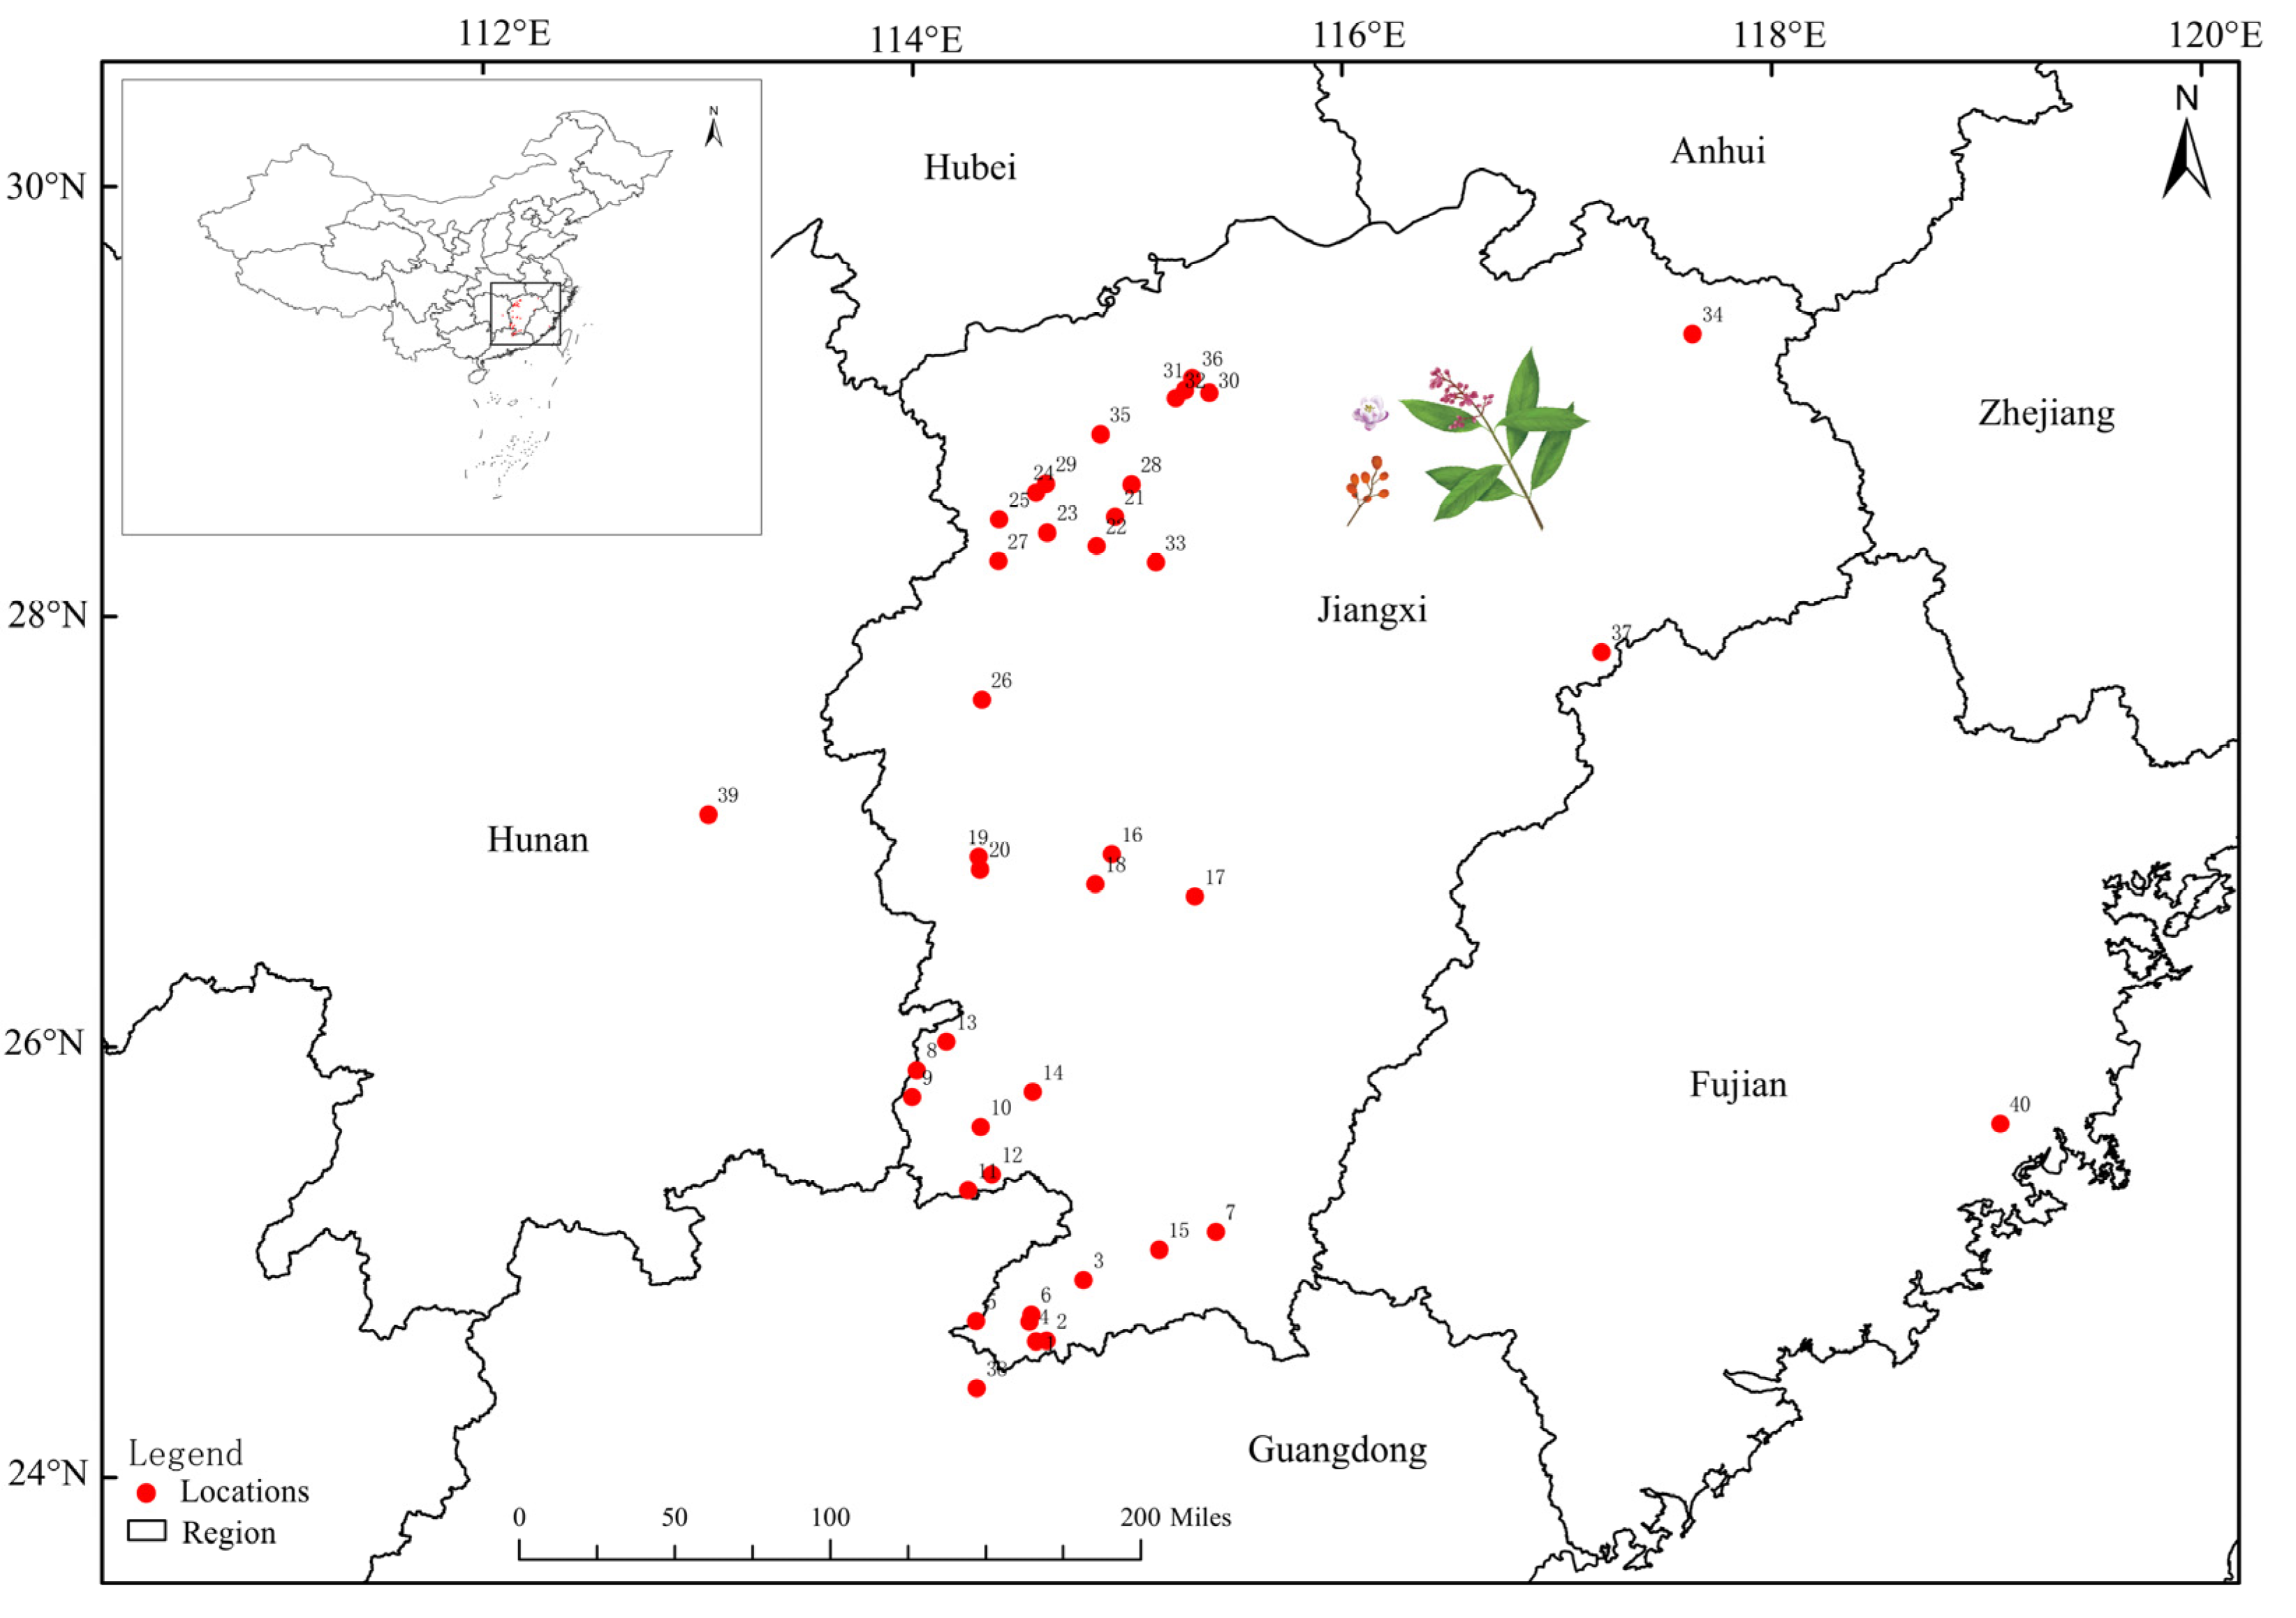
2.2. Sampling of Plant Material

Most samples were collected in Jiangxi Province considering the preferences of pharmaceutical companies and farmers regarding medicinal materials and the outcomes of previous studies on the pharmacodynamic components of T. arguta [11,13]. The sampling time was determined based on the harvest season (summer and autumn) stipulated in the Chinese Pharmacopoeia [3]. A total of 306 wild samples were collected from 40 Chinese habitats between September and November 2020. As many samples as possible were picked for each site in accordance with the sampling requirements, plants with a diameter of approximately 2.0 cm and a height of 1.2 m were carefully selected, and 20 fully developed mature leaves free from pests and diseases were randomly chosen, ensuring no less than three samples from each site. All samples were authenticated as Turpinia arguta (Lindl.) seem by Professor Jinbao Yu (Jiangxi Academy of Traditional Chinese Medicine). The coordinates of each location and dates of sampling are provided in Table 1. Table S1 indicates the complete names of the locations, and the map in Figure 1 shows their distribution.
The morphology of the collected leaves was studied in detail to record the morphotypic variation. The leaf area (LA), length (LL), and width (LW) were measured using a plate-touch leaf area meter, while the leaf thickness (LT) was determined using a digital vernier caliper. Leaf volume (LV) was calculated by multiplying the leaf area with the corresponding LT. A portion of the leaves was subjected to drying at a constant temperature (65 ℃) for 48 hours until reaching a constant mass, and leaf dry weight (LDW) was recorded. Leaf tissue density (LTD) was then calculated as the ratio of dry weight (g) to volume (cm3). Specific leaf area (SLA) was determined by dividing the leaf area (cm2) by the corresponding dry weight (g). Leaf length/width ratio (L-L/W) was determined by dividing the LL by the corresponding LD.

2.3. HPLC Quantification of Ligustroflavone and Rhoifolin

2.3.1. Chromatographic Conditions

The dried leaves were pulverized and sieved through a 50-mesh sieve to yield a fine powder. Then, the identification of the marker compounds ligustroflavone (C33H40O18) and rhoifolin (C27H30O14) was carried out using high-performance liquid chromatography, as indicated in General Chapter 0512 of the Guideline by the National Pharmacopoeia Commission, 2020 [3]. A C18 column (100 mm × 2.1 mm, 1.7 μm) at a temperature of 30 °C, with a mobile phase consisting of methanol 0.5% in phosphoric acid aqueous solution (43:57) at a volume flow rate of 1.0 mL·min−1, was used. Detection was performed at a wavelength of 336 nm.

2.3.2. Preparation of the Standards and Working Solutions

Ligustroflavone and rhoifolin (10 mg each) standards were individually subjected to pressure drying using P2O5 for 24 h, followed by dilution with 50% methanol to obtain final volumes of 100 mL. Subsequently, 25 mL of the ligustroflavone solution and 10 mL of the rhoifolin solution were combined in a single vial and further diluted with 50% methanol to achieve a total volume of 50 mL. The resulting mixture was vigorously shaken, yielding mass concentrations of 50 μg·mL−1 ligustroflavone and 20 μg·mL−1 rhoifolin.
Leaf sample powders (0.3 g) were placed in 100 mL conical bottles and diluted in 50% methanol to reach 50 mL. The mass was measured before subjecting the diluted samples to ultrasonic treatment at a power of 250 W and frequency of 25 kHz for 1 h. After cooling, the mass was measured again. Subsequently, the mixture was shaken with 50% methanol and filtered to obtain the filtrate.

2.3.3. Linearity of the Standard Solution

Aliquots of 2, 4, 6, 8, 10, and 15 μL of the standard mix were injected, and the peak area was measured under the aforementioned chromatographic conditions to obtain the standard curves of the marker compounds. Well-fitted linear relationships, with a regression equation of Y = 7710X − 3880 (R2 = 0.9999) within a linear range of 0.1–0.75 μg for ligustroflavone and Y = 4410X − 1580 (R2 = 0.9999) within a linear range of 0.04–0.3 μg for rhoifolin, were obtained.

2.3.4. Methodology

The injection of the mixed standard solution (described in Section 2.3.2) was repeated six times, with injections of 10 μL, resulting in a relative standard deviation (RSD) of the peak area of 0.9% (ligustroflavone) and 1.1% (rhoifolin). Three replicates of the eighth sample taken from location Y(M-mt) (thereafter called sample YH8) were analyzed. The contents of ligustroflavone and rhoifolin in these samples were 0.46% and 0.53%, respectively, with a peak area of RSDs for ligustroflavone and rhoifolin consistently at a value of 0.7% throughout different time points after preparation (1, 2, 4, 8, 12, 24, 36, and 48 h). Six replicates of sample YH8 weighing 0.15 g each were prepared by adding 7 mL of a ligustroflavone and rhoifolin standard solution (0.1 mg·mL−1) to each replicate, followed by the addition of 50% methanol up to a total volume of 50 mL. HPLC analysis was performed after weighing and processing the samples as described in Section 2.3.2. The average recoveries were 98.4% (ligustroflavone) and 99.5% (rhoifolin), with RSD values of 1.0% for both measurements. These results indicate that the precision, repeatability, stability, and recovery rate met the requirements for quantitative analysis.
The prepared sample solutions of various origins were subjected to chromatographic analysis under the conditions already described. The peak areas were then correlated with the standard curve to obtain ligustroflavone and rhoifolin contents in the samples based on their dry weight. Figure 2 illustrates the HPLC chromatograms obtained.

2.4. Climatic Factors

Climate data were acquired from the WorldClim Database (http://www.worldclim.org/) accessed on 21 December 2021 for the period 1970–2000, encompassing 11 temperature parameters (bio1–bio11), eight precipitation parameters (bio12–bio19), and the mean solar radiation of each month (srad1–srad12) (Table S2).

2.5. Statistical Analysis

The experimental data were processed using Microsoft Excel 2010 and IBM SPSS Statistics 27. The coefficient of variation (CV = SD/mean) was employed to quantify the degree of data dispersion. Non-parametric Shapiro–Wilk test was utilized to assess the normality of data distribution. One-way ANOVA was applied to examine differences in parameters among different origins. Tamhane’s T2 test was conducted for significance testing. Pearson’s two-tailed correlation test was conducted to analyze the relationships between climatic factors and T. arguta appearance traits. Detrended correspondence analysis (DCA) was performed on the mean values of leaf phenotype and quality traits from various regions. The gradient length of all four axes was less than 3, indicating that redundancy analysis (RDA) was the appropriate method to analyze the link of leaf appearance and quality traits with climatic factors across samples from different geographic origins using Canoco 5.0. Fuzzy mathematics membership function method was adopted to evaluate the yield and quality of leaves, with the formula X = (Xi − Xmin)/(Xmax − Xmin), where Xi (i = 1, 2, 3, …, n) represents the measured value of index I, and Xmax and Xmin refers to the maximum and minimum values of index I. The mapping process was carried out using Origin 2021 software.

3. Results

3.1. Leaf Appearance and Ligustroflavone and Rhoifolin Compounds across Different Habitats

3.1.1. Leaf Appearance

The coefficient of variation for leaf appearance ranged from 12.5% to 23.4% (Figure 2A). Differences in leaf area resulted from disparities in leaf length and leaf width, which also affected length-to-width ratios, indicating considerable variability in leaf shape. According to the analysis of the correlation between the length/width ratio and leaf shape [8], the leaf morphology in this species varied from lanceolate strips to oval strips, ovals, or wide ovals. Considering the average values recorded across all geographic origins (Figure 2B), the largest leaf areas were detected in W(F-t), location 34 (5191 mm2), and in A(X-t), location 7 (4850 mm2), while the greatest leaf thickness (1.09 mm) was observed in A(X-t), location 7. The highest dry weight values were found in S(G-mt), location 1; Q(J-t), location 6; and A(X-t), location 7: 0.53 g, 0.51 g, and 0.47 g, respectively.

3.1.2. Ligustroflavone and Rhoifolin Compounds

The HPLC chromatograms of ligustroflavone and rhoifolin were obtained (Figure 3). It was observed that ligustroflavone contents ranged from 0.023% to 1.336% (CV = 54.2%), achieving a qualification rate of 66.7%, whereas the content of rhoifolin ranged from 0.008% to 0.962% (CV = 66.9%) and had a qualification rate of 75.8% (Figure 4A). Despite that the amounts of ligustroflavone and rhoifolin in T. arguta leaf samples significantly varied across geographical origins (p < 0.05) (Figure 4B), in the majority of the locations sampled (33/40), ligustroflavone content exceeded that prescribed by the latest Chinese Pharmacopoeia. The minimum level was not met in the samples from seven locations (bars under the blue dotted line). The samples from A(X-t), location 7; and L(Y-vg), location 2; displayed the highest ligustroflavone concentrations: 0.972% and 0.713%, respectively. Similarly, rhoifolin content requirements set by the Chinese Pharmacopoeia 2020 were met in most locations, 35/40. The samples from Y(B-mt), location 19, exhibited the highest mass fraction of rhoifolin, at 0.407%, followed by those from W(S-mt), location 36; and Y(S-t), location 22; with 0.376% and 0.350%, respectively.

3.1.3. Comprehensive Ranking

Moreover, the fuzzy mathematical membership function method was used to rank the 40 locations sampled based on the mean values for leaf area, leaf thickness, leaf dry weight, ligustroflavone content, and rhoifolin content (Table 2). The top five producing areas in terms of comprehensive ranking were A(X-t) (location 7) > Q(J-t) (location 6) > Yf(S-t) (location 22) > Y(B-mt) (location 19) > S(F-mt) (location 13), in line with the results already shown, all of them in Jiangxi Province. Particularly in the samples from the two first locations, the yield and quality of T. arguta were highest.
The 40 Chinese locations assessed were ranked based on their punctuation (on a scale from 0 to 1) for the most relevant T. arguta morphological leaf traits, leaf dry yield, and quality indexes. In bold are indicated the top five producing areas (comprehensive ranking).

3.2. Correlation between Leaf Appearance and Ligustroflavone and Rhoifolin Compounds

A bivariate correlation analysis was used to examine the relationships between index components (Lig and Rho) concentrations and leaf appearance traits and also among leaf appearance traits (Figure 5). Pearson’s correlation coefficients were generally stronger between leaf traits than between index components and leaf traits. Ligustroflavone content showed a positive association with leaf thickness but a negative association with leaf tissue density (both p < 0.05), and no significant correlation was observed between rhoifolin content and any leaf appearance trait. Additionally, there was a positive correlation between leaf length and width (p < 0.01). A significant positive relationship between dry weight and leaf area (p < 0.01) was detected, whereas no significant correlation was found with leaf thickness, suggesting that leaf dry weight in T. arguta primarily depends on its area; in other words, larger leaves (rather than thicker leaves) are expected to yield higher dry mass. Ligustroflavone content tended to correlate positively with rhoifolin content without reaching statistical significance (correlation coefficient: 0.17).

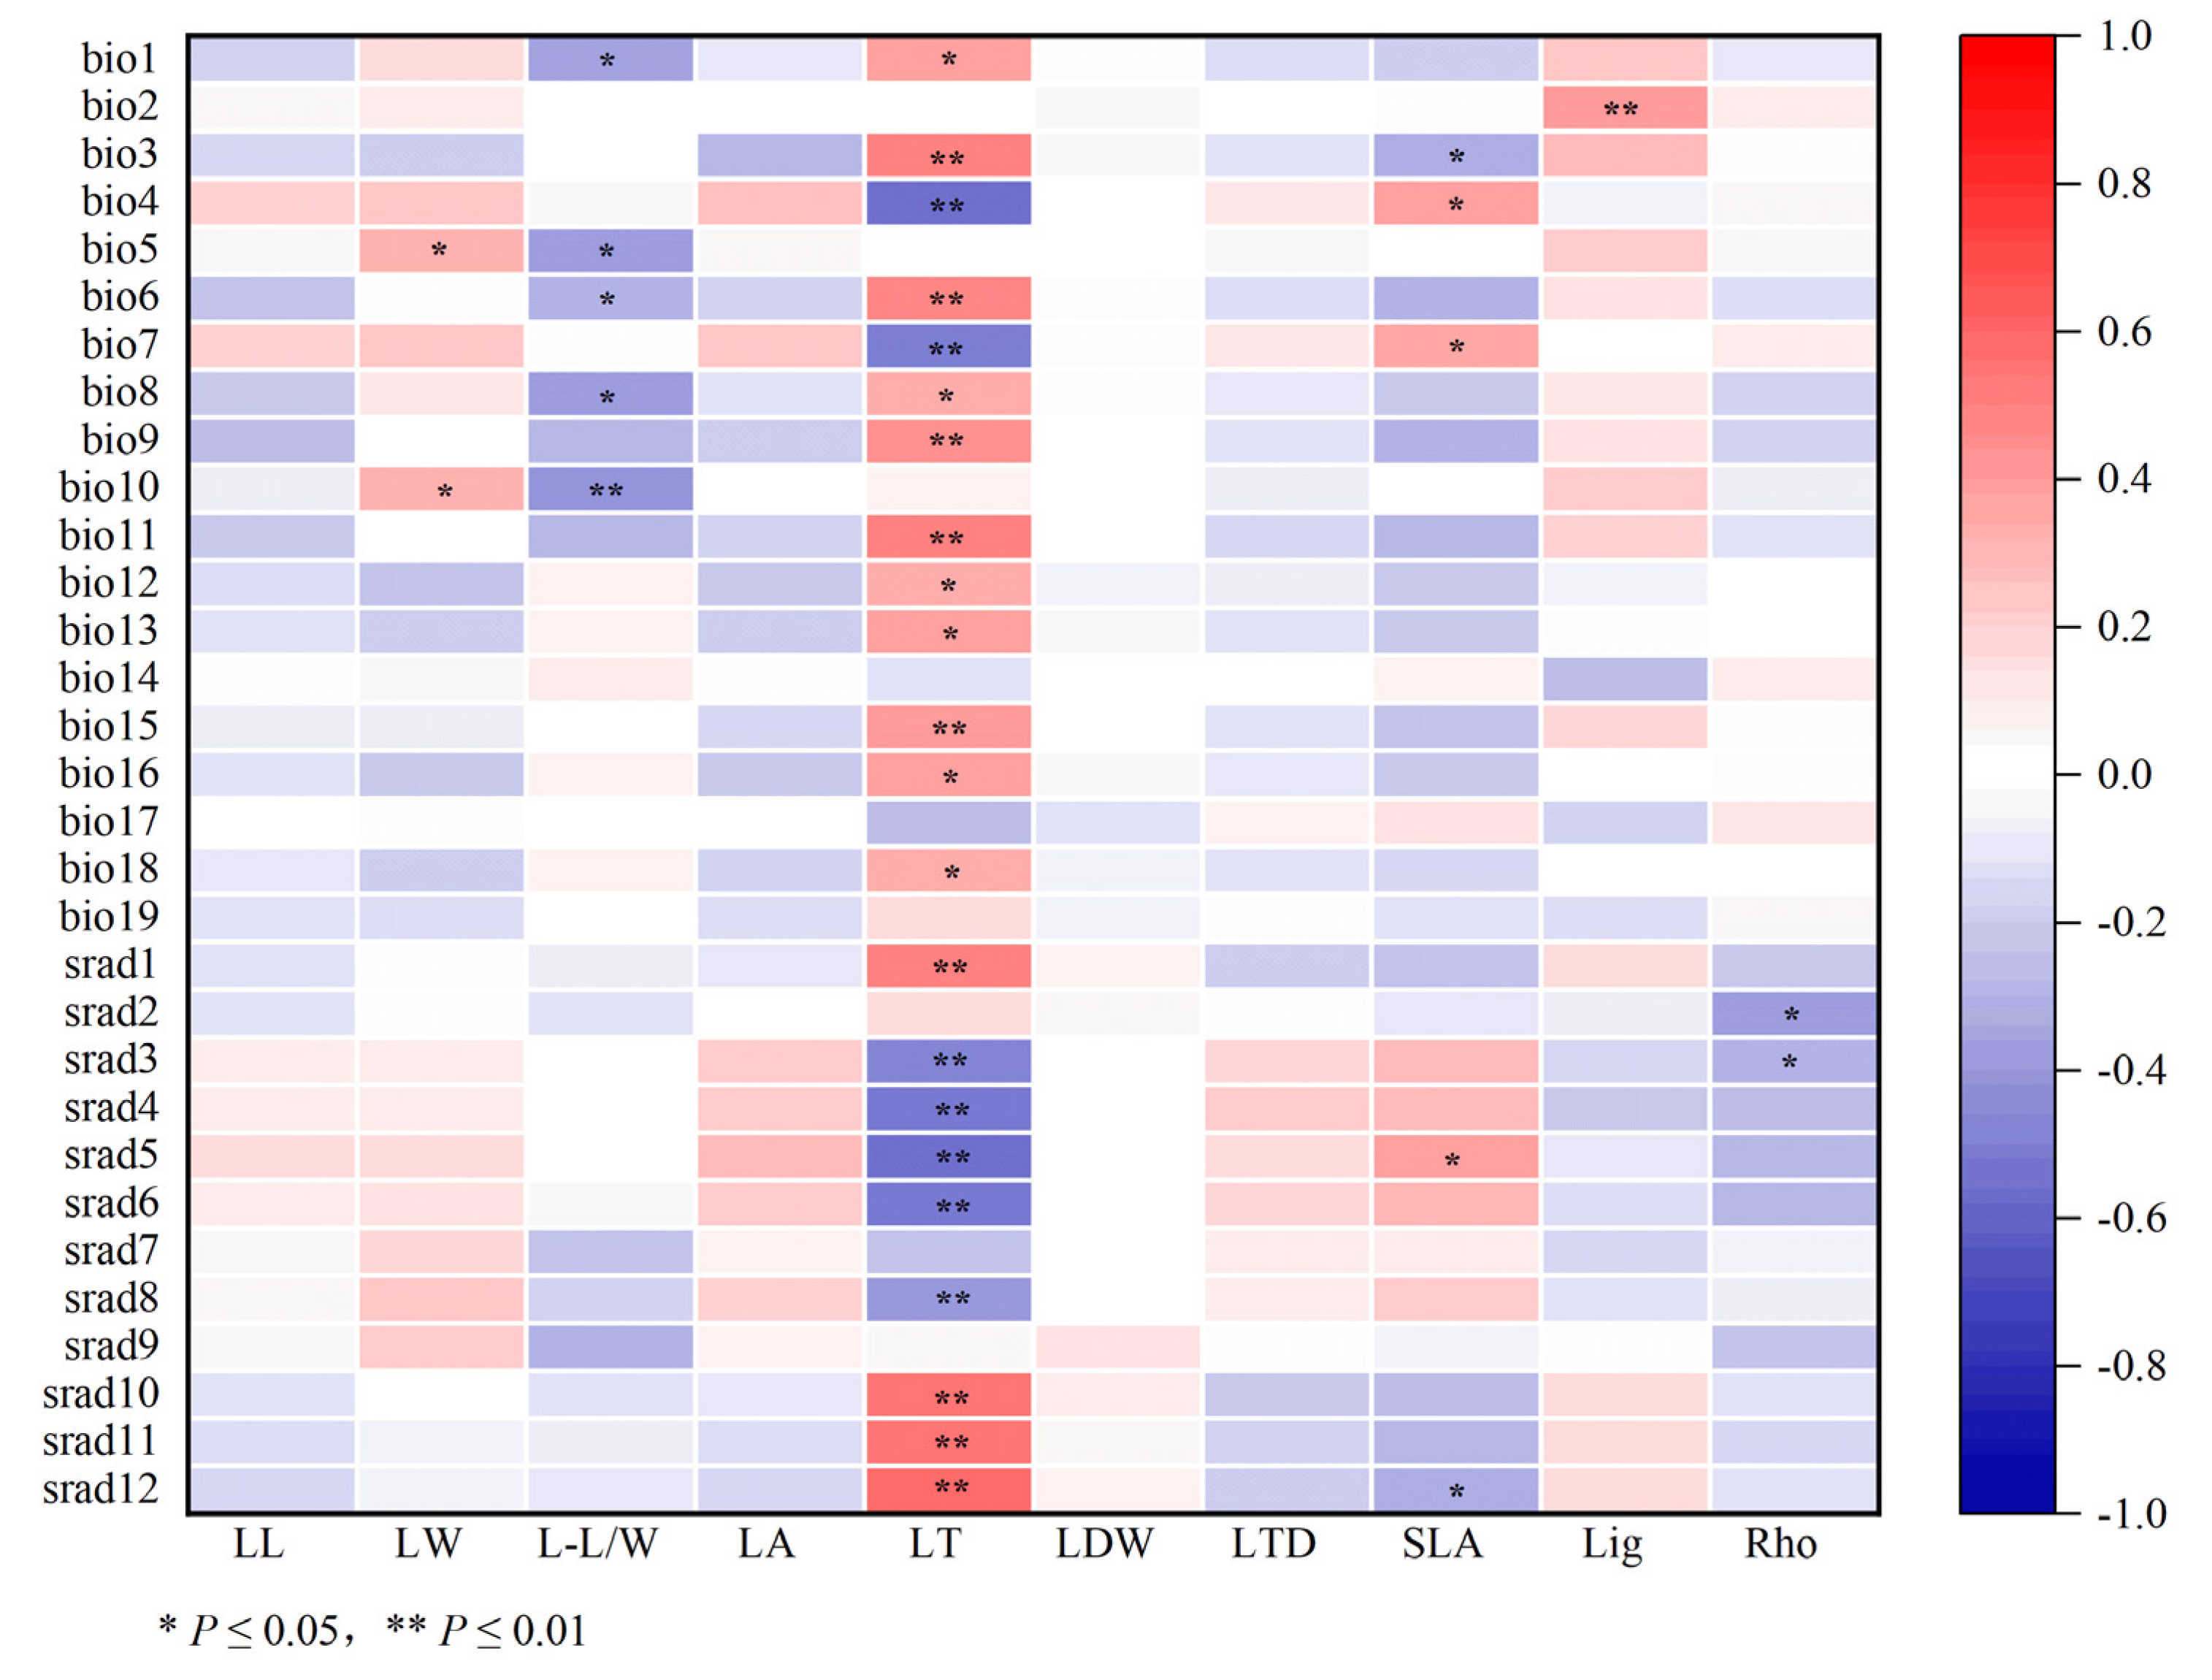
3.3. Correlation among Leaf Appearance, Ligustroflavone and Rhoifolin Compounds, and Climatic Factors

Pearson’s correlation coefficients were calculated to identify which climatic factors may be more definitory of leaf dimensions and ligustroflavone and rhoifolin compounds (Figure 6). As it may be noticed, leaf thickness was the appearance trait most influenced by climatic factors. It displayed significant positive correlations with bio3, bio6, bio9, bio11, and bio15 (p < 0.01), and significant negative correlations with bio4 and bio7 (p < 0.01). Also, it correlated positively with srad1 and srad10–12 (p < 0.01) but negatively with srad3–6 and srad8 (p < 0.01). Additionally, leaf length, leaf dry matter, and leaf tissue density exhibited no significant correlation with climatic factors, whereas leaf width demonstrated a significant positive correlation with bio5 and bio10 (p < 0.05), and leaf length/width was negatively correlated with several thermal parameters.
As shown in Figure 6, the sole significant correlation found between ligustroflavone content and climate variables was a significant positive correlation with the mean diurnal temperature range (bio2) (p < 0.01). Rhoifolin content showed no significant correlation with temperature or precipitation but displayed negative associations with solar radiation in February and March (p < 0.05).

3.4. Redundancy Analysis of Climatic Factors as Determinants of T. arguta Leaf Appearance and Ligustroflavone and Rhoifolin Compounds

Redundancy analysis (RDA) is a valuable tool to detect which predictor variables are most strongly associated with response variables. The first and second axes together explained 71.86% and 80.71% of the leaf appearance traits (Figure 7A) and quality traits (Figure 7B) variability, respectively. Bio7, bio3, and srad5 were identified as relevant climate factors affecting overall phenotypic traits of leaves, with explanatory levels of 8.9%, 8.7%, and 8.0%, respectively. Higher values for bio7, bio4, and srad3–srad8 and lower values for bio3 and srad10–srad12 and srad1 corresponded to higher leaf area and specific leaf area but lower leaf thickness (locations 34, 12, and 32). Leaf area and leaf dry weight were the key factors influencing locations’ distribution based on appearance traits, with locations 6, 7, 13, 14, 22, and 33 clustering together, vs. locations 2, 3, 5, 11, 15, 16, 20, 23, 24, and 37, which had the highest vs. lowest scores, respectively (Figure 7A), it is consistent with the results of Ward cluster analysis in Figure S1A.
Relevant climate factors affecting the concentration of the two quality markers included bio2 and bio3, with explanatory variables of 14.l% and 6.5%, respectively (Figure 7B). Higher values of these temperature parameters and lower values of rad2–srad9 were associated with higher ligustroflavone and rhoifolin contents (locations 22, 19, and 1), while the influence of bio14, bio17, srad1, and srad10–12 was opposite. Ligustroflavone content was the quality marker most important to define locations’ grouping, with locations 2, 3, 5, 6, 7, 11, 16, 22, and 38 clustering together, and locations 8, 14, 15, 37, and 40 clustering aside as those in which climate factors had the highest and lowest impact, respectively; similar clustering outcomes are depicted in Figure S1B.

4. Discussion

4.1. Variability of Leaf Appearance and Quality Indices in T. arguta across Chinese Regions

T. arguta has witnessed an expansion in artificial cultivation areas in recent years, ensuring high-quality origin selection, and stringent quality control measures have become pivotal factors. A thorough analysis of T. arguta leaf appearance and ligustroflavone and rhoifolin compounds in samples obtained from 40 Chinese locations was conducted, covering the territory from 24°24′46″ to 29°18′53″ N and from 113°02′52″ to 119°03′52″ E. It showed that the coefficients of variation were relatively high, particularly for ligustroflavone and rhoifolin contents, which reveals significant differences in the performance of T. arguta as a medicinal herb among different producing areas, aligning with previous findings [12,13]. In line with previous reports [28], our RDA analysis suggests that factors other than territorial distribution and climate conditions would determine the clustering of locations; possibly, genetic factors resulting from gene exchange can impact T. arguta phenotype and quality [28,29]. Previous research on medicinal plants has indicated that cryptotanshinone content and the ratio of cryptotanshinone/tanshinone IIA in the lobular type of Salvia miltiorrhiza differed significantly from those of the prototype, ruffle-leaf type, and single-leaf type [30]. Moreover, there is a considerable variation in total flavonoid content among individuals of Erigeron breviscapus growing in the same habitat. Paclitaxel content varied among different individuals within the same population of Taxus cuspidate [31,32], and a similar disparity was also identified among licorice species with distinct genetic backgrounds [33]. Substantial differences in gene expression were reported in the root bark of Paeonia suffruticosa cv. Feng Dan obtained from distinct geographical origins [34]. Considering globally the present findings and those reported by Liu et al. [13], the zone of A(X-t) (location 7) could be recommended as a high-quality main-producing area, suitable to be screened for excellent T. arguta germplasm.

4.2. Link between Leaf Appearance and Quality in T. arguta

The appearance traits and chemical composition are often regarded as crucial criteria for identifying and evaluating the quality of Chinese medicinal materials, with some degree of correlation between them [35]. Based on this, the “quality evaluation through morphological identification” theory has been recognized, and this concept was verified for several species with medicinal uses. For instance, smaller, round Gardeniae fructus tend to have higher iridoid components, while larger, elongated ones possess higher pigment components [36]. The redder, longer, and coarser the surface of Bupleurum scorzonerifolium root is, the greater the contents of volatile oil and bupleurin [37]. Angelica sinensis’ commodity grade exhibits a significantly negative correlation with its average weight and phthalein content [38]. Likewise, a significant positive correlation between active ingredient contents and plant height and root diameter was found in Polygala tenuifolia [39]. This study revealed that leaf dry weight was positively correlated with leaf area (p < 0.01), and leaf ligustroflavone content displayed a positive correlation with leaf thickness (p < 0.05). However, rhoifolin content was not influenced by leaf traits. These findings confirm that larger and thicker leaves have both higher yield mass and higher ligustroflavone content and, consequently, higher quality. Thus, leaf size and thickness can be employed as morphological traits to evaluate yield potential and quality in this important plant species.

4.3. Incidence of Climate Factors on Leaf Appearance and Quality in T. arguta

Authentic medicinal plants result from long-term interactions between specific germplasm and habitat conditions. Climatic factors such as light, temperature, water, and air not only influence the phenotypic characteristics of medicinal materials, but also play a crucial role in shaping their secondary metabolites. Selecting suitable environmental conditions for cultivating medicinal plants is essential to ensure adequate yield and quality [14,40]. By analyzing the relationships among leaf appearance, marker compound contents, and climate variables, it demonstrates that the leaf shape primarily responds to temperatures, with a greater impact exerted by high temperatures compared to those results published by Traiser [41] and Moles [42]. Generally, a low-temperature and dry environment during winter increases the leaf length-to-width ratio, resulting in narrower and thicker leaves. This morphological adaptation facilitates convective cooling, reducing heat load and total water loss [43] while also decreasing leaf area and transpiration to enhance photo assimilate accumulation. Conversely, in hot and humid summer conditions, large, broad-leaved plants are more effective at intercepting intense light energy [44]. These findings suggest that higher solar radiation levels during autumn and winter promote leaf thickening, whereas higher solar radiation intensity in spring and summer promotes leaf expansion.
In addition, the content of ligustroflavone in leaves showed a positive correlation with the mean diurnal temperature range (bio2), while the content of rhoifolin exhibited a negative correlation with solar radiation levels. These findings differ from previous data but also share some similarities. For instance, Tian found that bio2 is an important environmental factor influencing ginsenosides accumulation in Panax quinquefolium L., and reductions in this parameter can increase the total ginsenoside content [45], whereas Liu demonstrated that large temperature differences between day and night can increase total phenol and total flavone contents in Astragalus membranaceus and Codonopsis lanceolata [46]. In Centella asiatica, 70% shade promoted asiatic acid accumulation, but full sunlight increased asiaticoside accumulation [47]. According to the results of this study, a substantial difference between the maximum and minimum daily temperatures promotes ligustroflavone accumulation, whereas reduced solar radiation enhances rhoifolin accumulation.
This study considered that the superior germplasm of T. arguta detected in Anyuan and Quannan counties of southern Jiangxi Province is closely associated with the climatic conditions of these areas. Situated at the southern edge of the middle subtropical zone, this region benefits from abundant water and heat resources and a mild climate, with an annual average temperature 2–3 °C higher compared to the central and northern regions of Jiangxi province. It has warm winters and higher effective accumulated temperatures, which contribute to favorable conditions for T. arguta growth. Consequently, for practical production purposes, promoting cultivation in the south of Jiangxi is advisable, while greenhouse cultivation may be recommended for northern and central Jiangxi. Additionally, this medicinal material quality can be improved by appropriately increasing day-night temperature differences and implementing moderate shading measures to reduce solar radiation.

5. Conclusions

Secondary metabolites in medicinal plants are formed and transformed as part of a complex and dynamic process, influenced by various factors, including the ecological environment, heredity, growth duration, and phenological period. This study primarily focused on elucidating the pivotal climatic factors governing yield and quality in T. arguta. The results determined that locations A(X-t) and Q(J-t) are high-quality, main producing areas and excellent as germplasm screening zones. The leaf appearance traits and quality characteristics were found to be influenced by specific climate factors, with temperature annual range (bio7), isothermality (bio3), and solar radiation in May (srad5) primarily affecting leaf morphological traits, and mean diurnal range (bio2) and solar radiation mainly impacting quality traits. A significant difference in diurnal temperature was found to promote ligustroflavone accumulation, whereas low levels of solar radiation favored rhoifolin accumulation.
In the context of global climate change and its potential risks to plant production, the findings are particularly significant for optimizing cultivated T. arguta management and enhancing the yield and quality of this species. Selecting a production environment with a considerable temperature difference between day and night and moderately lower light intensity is more conducive to generating high-quality T. arguta leaves. A planting mode beneath the forest canopy might be the optimal scheme for the sustainable development of T. arguta at large scale. Future investigations focused on the impact of seasonality, circadian cycle, soil conditions, and genetic factors on T. arguta yield and quality will allow a more comprehensive understanding of these processes and a robust theoretical foundation to detect the optimal harvest time and guide the appropriate regionalization and standardized production of medicinal materials.

Supplementary Materials

The following supporting information can be downloaded at: https://www.mdpi.com/article/10.3390/horticulturae10090935/s1, Figure S1: Dendrogram of leaf appearance (A) and ligustroflavone and rhoifolin compounds (B) of T. arguta from different origins; Table S1: Origin of T. arguta leaf samples; Table S2: Description of the climatic variables considered.

Author Contributions

Conceptualization, formal analysis, data curation, and writing—original draft preparation, H.J. and J.C.; methodology, software, and validation, H.J., C.C. and J.Y.; investigation and resources, Y.L., X.S. and X.T.; writing—review and editing, visualization, and supervision, Y.Z.; project administration and funding acquisition, H.J. and X.T. All authors have read and agreed to the published version of the manuscript.

Funding

National Natural Science Foundation of China, Grant/Award Number: 32360409; Modern Agricultural Scientific Research Collaborative Innovation Major Project of Jiangxi Province, Grant/Award Number: JXXTCX202202; Forestry Innovation Key Project of Jiangxi Province, Grant/Award Number: Innovation Project No.1 (2023); Open Fund of National Engineering and Technology Research Center for Red Soil Improvement, Grant/Award Number: 2020NETRCRSI-12.

Data Availability Statement

The original contributions presented in the study are included in the article/Supplementary Material; further inquiries can be directed to the corresponding author.

Acknowledgments

We thank Yuelong Liang and Haihong Liao, from Jiulianshan National Nature Reserve Administration of Jiangxi Province, and Zhongsheng Luo, from Ji’an Institute of Forestry Science, for their help in sampling; Yuyuan Chen, from Jiangxi Authentic Medicinal Materials Quality Evaluation Center, for her help in sample testing; Lu Wang, College of Biology and Environment, Nanjing Forestry University, for her help in obtaining climate data; and the reviewer, for his valuable comments on this manuscript.

Conflicts of Interest

The authors declare no conflicts of interest.

References

  1. Wu, Z.; Raven, P.H.; Hong, D. Flora of China, Volume 7: Menispermaceae through Capparaceae; Science Press: Beijing, China, 2008. [Google Scholar]
  2. Tao, X.; Jiang, J.; Luo, H.; Li, D.; Luo, Y. Study on the Biological Characteristics and Container Seeding Raising Technology of Turpinia arguta fresh leaves. Jiangxi Sci. 2020, 38, 188–190. [Google Scholar] [CrossRef]
  3. Commission, N.P. Part 1. In Pharmacopoeia of the People’s Republic of CHINA (Part 1); China Medical Science and Technology Press: Beijing, China, 2020; p. 29. [Google Scholar]
  4. Li, Y.; Lei, X.; Feng, Y.; Xu, Q.; Xu, L.; Yang, S. Study on the Chemical Constituents of Terpinia arguta. Chin. Pharm. J. 2012, 47, 261–264. [Google Scholar]
  5. Ma, S.-G.; Yuan, S.-P.; Hou, Q.; Li, Y.; Chen, X.; Yu, S.-S. Flavonoid Glycosides from Leaves of Turpinia arguta and Their Anti-inflammatory Activity. China J. Chin. Mater. Medica 2013, 38, 1747–1750. [Google Scholar]
  6. Xiao, C.R.; Tu, L.F.; Zhang, R.Z.; Liu, D.P.; Luo, Y.M. Research Progress on Chemical Constituents and Biological Activities from Turpinia species. China J. Chin. Mater. Medica 2019, 44, 1295–1304. [Google Scholar] [CrossRef]
  7. Guo, X.; Xia, Z.; Song, M.; Li, C.; Wang, J.; Kang, W. Dynamic Changes of Secondary Metabolites and Antioxidant Activity of Ligustrum lucidum During Fruit Growth. Open Chem. 2018, 16, 99–107. [Google Scholar] [CrossRef]
  8. Zhang, L.; Li, J.; Yu, S.-C.; Jin, Y.; Lv, X.-W.; Zou, Y.-H.; Li, Y. Therapeutic Effects and Mechanisms of Total Flavonoids of Turpinia Arguta Seen on Adjuvant Arthritis in Rats. J. Ethnopharmacol. 2008, 116, 167–172. [Google Scholar] [CrossRef]
  9. Wu, Y.; Dong, G.; Sheng, C. Targeting Necroptosis in Anticancer Therapy: Mechanisms and Modulators. Acta Pharm. Sin. B 2020, 10, 1601–1618. [Google Scholar] [CrossRef]
  10. Yu, X.X.; Liu, Q.D.; Wu, J.W.; Liang, Z.K.; Zhao, M.Q.; Xu, X.J. Simultaneous Determination of Four Major Constituents in Citri Grandis Exocarpium by HPLC-DAD. Acta Chromatogr. 2016, 28, 129–143. [Google Scholar] [CrossRef]
  11. Li, L.; Zhao, Y.; Liu, W.; Feng, F.; Xie, N. HPLC with Quadrupole TOF-MS and Chemometrics Analysis for the Characterization of Folium Turpiniae from Different Regions. J. Sep. Sci. 2013, 36, 2552–2561. [Google Scholar] [CrossRef] [PubMed]
  12. Ou, B.; Liu, R. A Numerical Study on Variation of Vegetaeive Ovgan’s Characeers of Turpinia arguta. J.-Fujian Coll. For. 2003, 23, 371–374. [Google Scholar]
  13. Liu, D.; Li, Z.; Cheng, F.; Wen, H.; Liao, G.; Yang, X. Quality Evaluation of Turpinia arguta from Different Origins. Lishizhen Med. Mater. Medica Res. 2012, 23, 476–477. [Google Scholar]
  14. Pant, P.; Pandey, S.; Dall’Acqua, S. The Influence of Environmental Conditions on Secondary Metabolites in Medicinal Plants: A Literature Review. Chem. Biodivers. 2021, 18, e2100345. [Google Scholar] [CrossRef] [PubMed]
  15. Yang, F.; Ran, J.; Liu, H.; Song, J.; Xie, C. Geographic Variation of Functional Components and the Climatic Response Characteristics of Rheum tanguticum Maxim. Acta Ecol. Sin. 2021, 41, 3645–3655. [Google Scholar]
  16. Wei, M.; Zhang, Y.J.; Wang, T.; Guo, Q.S.; Zou, Q.J.; Chen, F.R.; Kang, Z.X.; Han, H.J.; Han, Z.Z.; Liu, H.H. Correlations between Content of Linarin in Chrysanthemum indicum and Climatic Factors in Habitats. China J. Chin. Mater. Medica 2021, 46, 2167–2172. [Google Scholar] [CrossRef]
  17. Huang, L.; Xie, C.; Duan, B.; Chen, S. Mapping the Potential Distribution of High Artemisinin-yielding Artemisia annua L. (Qinghao) in China with a Geographic Information System. Chin. Med. 2010, 5, 18. [Google Scholar] [CrossRef]
  18. Singh, S.P.; Misra, A.; Kumar, B.; Adhikari, D.; Srivastava, S.; Barik, S.K. Identification of Potential Cultivation Areas for Centelloside-specific Elite Chemotypes of Centella asiatica (L.) using Ecological Niche Modeling. Ind. Crops Prod. 2022, 188, 115657. [Google Scholar] [CrossRef]
  19. Liang, H.; Kong, Y.; Chen, W.; Wang, X.; Jia, Z.; Dai, Y.; Yang, X. The Quality of Wild Salvia miltiorrhiza from Dao Di Area in China and Its Correlation with Soil Parameters and Climate Factors. Phytochem. Anal. 2021, 32, 318–325. [Google Scholar] [CrossRef]
  20. Li, L.; Zheng, S.; Brinckmann, J.A.; Fu, J.; Zeng, R.; Huang, L.; Chen, S. Chemical and Genetic Diversity of Astragalus mongholicus Grown in Different Eco-climatic Regions. PLoS ONE 2017, 12, e0184791. [Google Scholar] [CrossRef]
  21. Sun, J.; Liu, X.; Wu, H.; Liu, K. Progress on Chemical Composition and Pharmacological Activity of Turpinia arguta Seem. Food Drug 2011, 13, 441–444. [Google Scholar]
  22. Hu, J.; Cai, J.; Hu, X.; Wang, L.; Cheng, Q.; Tao, X. Efficient In Vitro Propagation of Turpinia arguta and Quantitative Analysis of Its Ligustroflavone and Rhoifolin Content. Horticulturae 2024, 10, 587. [Google Scholar] [CrossRef]
  23. Song, W.J.; Song, Q.L.; Zou, Z.H.; Chen, X.L.; Liu, L.X.; Tan, J.; Wei, L.M.; Xiong, P.W.; Tao, X.H.; Sun, R.P. Effects of Turpiniae folium Extract on Growth Performance, Serum Immune and Antioxidant Function and Intestinal Microflora of Wenchang Chickens. Chin. J. Anim. Nutr. 2022, 34, 4380–4393. [Google Scholar] [CrossRef]
  24. Zhang, J.H.; Tao, X.H.; Wu, Y.Z.; Wang, J. A Chinese Herbal Microecological Compound Preparation for the Prevention and Treatment of Enteritis in Newborn Piglets, Its Preparation Method and Application. CN202011350102.8. 24 May 2022. [Google Scholar]
  25. Yang, X.L.; Tao, X.H.; Huang, J.; Xia, S.Q. A Ointment of Turpinia arguta and Its Preparation Method. CN202311216922.1. 10 November 2023. [Google Scholar]
  26. Zhou, J.Y.; Hu, S.; Tao, X.H.; Luo, J.; Ou, L.H.; Zhu, S.L.; Feng, J.X. The Application of Turpinia arguta and Its Extract in Mosquito Repellent Products, the Extraction Method and the Mosquito Repellent Products. CN202011159327.5. 18 October 2022. [Google Scholar]
  27. Xia, S.Q.; Tao, X.H.; Lin, H.; Yang, X.L. The Application of the Extract from Turpinia arguta in the Preparation of Hands-free Disinfectant. CN202410343494.7. 26 April 2024. [Google Scholar]
  28. Wang, X.Y.; Zhang, L.; Cao, L.; Liang, F. ISSR Analysis of Genetic Relationship and Population Structure of Turpinia arguta Fresh Leaves in Jiangxi Province. Chin. J. Exp. Tradit. Med. Formulae 2020, 24, 150–155. [Google Scholar]
  29. Flatscher, R.; Frajman, B.; Schnswetter, P.; Paun, O. Environmental Heterogeneity and Phenotypic Divergence: Can Heritable Epigenetic Variation Aid Speciation. Genet. Res. Int. 2012, 3, 698421. [Google Scholar] [CrossRef]
  30. Tang, X.Q.; Wang, K.C.; Chen, X.; Wu, J.; Yu, B.Y. Clustering Analysis on Contents of Lipophilic Components from Four Cultivars of Salvia miltiorrhiza Bge. Nat. Prod. Res. Dev. 2007, 5, 748–752. [Google Scholar] [CrossRef]
  31. Su, W.H.; Lu, J.; Zhang, G.F. Ecological and Biological Analysis of Total Flavonoids in Erigeron breviscapus. Chin. Tradit. Herb. Drugs 2001, 32, 1119–1121. [Google Scholar]
  32. Cheng, G.Y.; Gao, F.; Ge, C. Variation Regularity of Taxol Content in Natural Populations of Taxus cuspidata Sieb.et Zucc. in China. J. Beijing For. Univ. 2005, 27, 7–11. [Google Scholar]
  33. Yamazaki, M.; Sato, A.; Saito, K. Molecular Phylogeny Based on RFLP and Its Relation with Alkaloid Patterns in Lupinus plants. Biol. Pharm. Bull. 1993, 16, 1182–1184. [Google Scholar] [CrossRef] [PubMed]
  34. Xie, D.M.; Yu, N.J.; Huang, L.Q.; Peng, D.Y.; Liu, C.B.; Zhu, Y.J.; Huang, H. Next Generation Sequencing and Transcriptome Analysis of Root Bark from Paeonia suffruticosa cv. Feng Dan. China J. Chin. Mater. Medica 2017, 15, 2954–2961. [Google Scholar] [CrossRef]
  35. Huang, L.; Zhang, X.; Chen, S. Research Progress in Quality Ecology of Genuine Regional Drugs. Mod. Tradit. Chin. Med. Mater. Med.-World Sci. Technol. 2019, 21, 844–853. [Google Scholar]
  36. Rao, Z.; Zhang, F.; Dong, Y.; Wei, Y. Research Progress on “Quality Evaluation through Morphological Identification” and Cause of Quality Formation in Gardeniae Fructus. Chin. Tradit. Herb. Drugs 2023, 54, 1998–2004. [Google Scholar]
  37. Wang, W.X.; Du, X.W.; Hou, B.Y.; Zhu, H.R.; Yu, D. Correlations between Appearance Traits and Internal Quality of Bupleurum scorzonerifolium Roots based on Theory of "Quality Evaluation through Morphological Identification”. China J. Chin. Mater. Medica 2023, 48, 1815–1823. [Google Scholar] [CrossRef]
  38. Wang, Z.; Wang, D.; Huang, L. Analysis of the Correlation between Commodity Grade and Quality of Angelica sinensis by Determination of Active Compounds Using Ultraperformance Liquid Chromatography Coupled with Chemometrics. Evid.-Based Complement. Altern. Med. 2014, 1, 143286. [Google Scholar] [CrossRef] [PubMed]
  39. Zhang, L.; Yang, B.; Wang, J.; Zhang, G.; Yan, Y.; Gao, J.; Yang, X.; Hu, B.; Peng, L. Content Determination and Quality Analysis of Five Main Components in Polygala tenuifolia from Different Habitats. Chin. Tradit. Herb. Drugs 2020, 51, 1609–1616. [Google Scholar]
  40. Zhang, K.; Zhang, S.; Ebihara, A.; Zhou, X.; Fan, L.; Li, P.; Zhang, Z.; Wang, Y.; Shen, Y. The Current Research Progress of Ginseng Species: The cultivation and application. Cogent Food Agric. 2023, 9, 2216483. [Google Scholar] [CrossRef]
  41. Traiser, C.; Klotz, S.; Uhl, D.; Mosbrugger, V. Environmental Signals from Leaves—A Physiognomic Analysis of European Vegetation. New Phytol. 2005, 166, 465–484. [Google Scholar] [CrossRef] [PubMed]
  42. Moles, A.T.; Perkins, S.E.; Laffan, S.W.; Flores-Moreno, H.; Awasthy, M.; Tindall, M.L.; Sack, L.; Pitman, A.; Kattge, J.; Aarssen, L.W.; et al. Which is A Better Predictor of Plant Traits: Temperature or precipitation? J. Veg. Sci. 2014, 25, 1167–1180. [Google Scholar] [CrossRef]
  43. Givnish, T.J. Leaf and Canopy Adaptations in Tropical Forests. In Physiological Ecology of Plants of the Wet Tropics: Proceedings of an International Symposium Held in Oxatepec and Los Tuxtlas, Mexico, June 29 to July 6, 1983; Medina, E., Mooney, H.A., Vázquez-Yánes, C., Eds.; Springer: Dordrecht, The Netherlands, 1984; pp. 51–84. [Google Scholar]
  44. Peppe, D.J.; Royer, D.L.; Cariglino, B.; Oliver, S.Y.; Newman, S.; Leight, E.; Enikolopov, G.; Fernandez-Burgos, M.; Herrera, F.; Adams, J.M.; et al. Sensitivity of Leaf Size and Shape to Climate: Global Patterns and Paleoclimatic Applications. New Phytol. 2011, 190, 724–739. [Google Scholar] [CrossRef]
  45. Tian, L. The Effect of Microorganism and Climate Factors on the Quality of Panax quinquefolium L. Ph.D.thesis, Peking Union Medical College, Beijing, China, 2023. [Google Scholar]
  46. Liu, Y.; Ren, X.; Jeong, B.R. Manipulating the Difference between the Day and Night Temperatures Can Enhance the Quality of Astragalus membranaceus and Codonopsis lanceolata Plug Seedlings. Agronomy 2019, 9, 654. [Google Scholar] [CrossRef]
  47. Devkota, A.; Dall’Acqua, S.; Comai, S.; Innocenti, G.; Jha, P.K. Centella asiatica (L.) urban from Nepal: Quali-quantitative analysis of samples from several sites, and selection of high terpene containing populations for cultivation. Biochem. Syst. Ecol. 2010, 38, 12–22. [Google Scholar] [CrossRef]
Figure 1. Geographic distribution of the locations sampled for T. arguta leaf collection.
Horticulturae 10 00935 g001
Figure 2. Leaf appearance traits across different habitats. (A) Violin plots of leaf dimensions. (B) Average values for leaf area (top), leaf thickness, and leaf dry weight (bottom); vertical bars represent standard error. LL: leaf length; LW: leaf width; L-L/W: leaf length to width ratio; LT: leaf thickness; LA: leaf area; LDW: leaf dry weight. Leaf length, width, and thickness are expressed in mm, leaf area in mm2, and dry weight in g. Data were obtained from samples of T. arguta leaves collected at 40 Chinese locations. The numerical codes in the X-axes indicate the location of origin, as detailed in Table 1.
Horticulturae 10 00935 g002
Figure 3. Illustrative HPLC chromatograms of T. arguta dried leaves. 1. ligustroflavone; 2. rhoifolin. (A) Leaf sample; (B) mixed standards.
Horticulturae 10 00935 g003
Figure 4. Ligustroflavone and rhoifolin contents across different habitats. (A) Violin plots of reference ingredient contents. (B) Average contents (mass fractions) of ligustroflavone (Lig) and rhoifolin (Rho); vertical bars represent standard error. The dotted lines indicate the minimum contents required as quality standards by the Chinese Pharmacopoeia 2020. Data were obtained from samples of T. arguta leaves collected at 40 Chinese locations. The numerical codes in the X-axis indicate the location of origin, as detailed in Table 1.
Horticulturae 10 00935 g004
Figure 5. Pearson’s correlation coefficients between ligustroflavone and rhoifolin compounds and leaf appearance traits. Asterisks indicate significant correlations. In red: positive correlations; in blue: negative correlations. The intensity of the numbers indicates the strength of the correlation. Lig: ligustroflavone. Rho: rhoifolin. LL: leaf length; LW: leaf width; L-L/W: leaf length to width ratio; LT: leaf thickness; LA: leaf area; LDW: leaf dry weight; LTD: leaf tissue density; SLA: specific leaf area.
Horticulturae 10 00935 g005
Figure 6. Pearson’s correlation coefficients among leaf appearance traits, ligustroflavone and rhoifolin compounds, and climatic factors. Asterisks indicate significant correlations. In red: positive correlations; in blue: negative correlations. The intensity of the colors indicates the strength of the correlation. Lig: ligustroflavone. Rho: rhoifolin. LL: leaf length; LW: leaf width; L-L/W: leaf length to width ratio; LA: leaf area; LT: leaf thickness; LDW: leaf dry weight; LTD: leaf tissue density; SLA: specific leaf area. Climatic factors’ codes are detailed in Table S2.
Horticulturae 10 00935 g006
Figure 7. Redundancy analysis of climatic factors effects on leaf appearance traits (A) and ligustroflavone and rhoifolin compounds (B). The climatic factors considered were 11 temperature parameters (bio1– bio11, blue arrows), 8 precipitation parameters (bio12–bio19, green arrows), and 12 solar radiation mean values (srad1–srad12, orange arrows). The length of each arrow indicates the contribution of the factor to the ordination axes, and the angle between the arrows and the axes indicates the correlation between the variable and the ordination axe. The locations are represented by hollow, numbered circles, as detailed in Table 1. Lig: ligustroflavone. Rho: rhoifolin. LL: leaf length; LW: leaf width; L-L/W: leaf length to width ratio; LA: leaf area; LT: leaf thickness; LDW: leaf dry weight; LTD: leaf tissue density; SLA: specific leaf area.
Horticulturae 10 00935 g007
Table 1. Data on T. arguta collected samples.
Id. CodeOriginLongitudeLatitudeNo. of Plants SampledDate of Collection
1L(J-mt)114°34′28″24°37′51″332020.09.30
2L(Y-vg)114°37′28″24°37′53″32020.10.09
3L(A-mt)114°47′48″24°54′60″32020.10.11
4Q(T-wl)114°32′38″24°43′20″102020.09.30
5Q(F-vg)114°17′45″24°43′29″202020.10.08
6Q(J-t)114°33′12″24°45′19″72020.10.16
7A(X-t)115°24′46″25°08′18″32020.11.05
8C(Q-mt)114°01′12″25°53′26″142020.09.16
9C(C-vg)113°59′53″25°45′59″82020.09.18
10C(Y-mt)114°18′60″25°37′34″192020.09.20
11D(M-r)114°15′27″25°20′02″142020.11.06
12D(Z-t)114°22′06″25°24′27″72020.11.16
13S(F-mt)114°09′30″26°01′23″92020.11.20
14S(G-mt)114°33′31″25°47′26″32020.11.21
15X(A-ff)115°08′51″25°03′26″32020.09.15
16T(B-t)114°55′40″26°53′38″32020.09.21
17T(B-mt)115°18′54″26°41′58″62020.09.22
18T(Y-vg)114°51′01″26°45′29″32020.09.22
19Y(B-mt)114°18′21″26°53′04″72020.10.06
20Y(Q-t)114°18′46″26°49′32″52020.10.07
21Yf(Y-vg)114°56′32″28°27′52″82020.09.18
22Yf(S-ff)114°51′22″28°19′42″32020.09.18
23Yf(J-vg)114°37′35″28°23′23″52020.09.19
24Yf(G-mt)114°34′29″28°34′42″162020.09.10
25Yf(S-vg)114°24′10″28°27′05″32020.11.14
26Yc(M-mt)114°19′17″27°36′50″232020.09.02
27W(J-t)114°23′55″28°15′35″32020.11.13
28F(S-vg)115°01′08″28°36′50″32020.11.25
29Tg(H-vg)114°37′12″28°37′03″102020.10.12
30J(P-vg)115°22′49″29°02′24″32020.11.02
31J(H-cy)115°16′04″29°03′17″32020.11.02
32J(G-vg)115°13′26″29°01′02″82020.11.03
33G(X-t)115°07′56″28°15′10″102020.10.30
34Wy(F-t)117°37′54″29°18′53″32020.11.12
35Xs(H-t)114°52′27″28°50′49″52020.10.20
36Wn(S-mt)115°18′11″29°06′32″62020.11.16
37Z(M-mt)117°12′31″27°50′01″52020.11.19
38Lp(P-t)114°17′55″24°24′46″32020.10.06
39H(G-t)113°02′52″27°04′48″32020.11.01
40P(S-mt)119°03′52″25°38′33″32020.10.28
Id. code: Numeric code used to identify each location. Origin: code used to describe succinctly each location, as follows: first uppercase letter, county name (a second letter was used to differentiate counties beginning with the same letter); second uppercase letter within brackets, local name; lowercase letters within brackets, brief landscape description (mt—mountain, vg—village, t—town, ff—forest farm, cy—canyon, r—road, wl—wetland). The complete names of the locations are provided in Supporting Information Table S1.
Table 2. Comprehensive ranking of T. arguta origin locations.
Id. CodeSubordinate Function ValuesAverage Membership Function ValueRanking Position
LALTLDWLigRho
10.2180.4150.2370.4120.3940.33530
20.2310.3820.1450.6990.4240.37627
30.3630.4900.3030.5250.2750.39122
40.5810.3450.2860.4850.6050.4609
50.3350.3370.2680.4800.5400.39221
60.8410.3830.9100.4570.6040.6392
70.8701.0000.7631.0000.3160.7901
80.5260.4790.6020.0660.3750.41017
90.2890.4270.5310.1130.0980.29233
100.3880.5010.4580.3260.3530.40519
110.4120.3040.2220.4890.5200.38923
120.7850.4050.3230.2410.5230.45611
130.7330.4080.5960.3280.6100.5355
140.8640.3311.0000.1340.2550.5176
150.0000.3630.0000.1480.3270.16740
160.4110.3440.3420.4690.6930.45213
170.6590.3820.2630.3960.4490.43015
180.6390.4140.3290.3220.4350.42816
190.5620.3970.4530.2901.0000.5404
200.2350.3040.0290.2250.4040.24037
210.6180.3240.3980.2670.3810.39720
220.7720.3820.6450.5020.8450.6293
230.2830.2740.0610.3320.4660.28334
240.3460.1760.2400.4840.5510.35929
250.7220.2930.1970.4020.2710.37726
260.5490.3780.4280.3870.5230.45312
270.1630.2170.3290.2600.6800.33031
280.6380.2360.6840.4820.4440.4977
290.2700.1590.2660.2470.4680.28235
300.8300.0190.3030.4860.2600.38024
310.3580.0000.0390.3590.1000.17139
320.7110.1810.3190.3420.2950.37028
330.7070.1540.5620.2880.4570.43314
341.0000.1400.5260.3730.0000.40818
350.6760.3730.4000.1770.6630.45810
360.5910.1310.3880.3780.9150.4818
370.3980.1670.1790.0360.4020.23638
380.0890.7320.0790.4780.5120.37825
390.3860.4460.4080.2350.1240.32032
400.3120.3950.4210.0000.0740.24036
Disclaimer/Publisher’s Note: The statements, opinions and data contained in all publications are solely those of the individual author(s) and contributor(s) and not of MDPI and/or the editor(s). MDPI and/or the editor(s) disclaim responsibility for any injury to people or property resulting from any ideas, methods, instructions or products referred to in the content.

