Article

Evaluation of Canopy Growth in Rainfed Olive Hedgerows Using UAV-LiDAR

by
Susana Cantón-Martínez
1,
Francisco Javier Mesas-Carrascosa
1,*,
Raúl de la Rosa
2,
Francisca López-Granados
2,
Lorenzo León
3,
Fernando Pérez-Porras
1,
Francisco C. Páez
4 and
Jorge Torres-Sánchez
1,*
1
Department of Graphic Engineering and Geomatics, Campus de Rabanales, University of Cordoba, 14071 Córdoba, Spain
2
Institute for Sustainable Agriculture (IAS), Spanish National Research Council (CSIC), 14004 Córdoba, Spain
3
Instituto de Investigación y Formación Agraria y Pesquera (IFAPA), Center “Alameda del Obispo”, 14004 Córdoba, Spain
4
Instituto de Investigación y Formación Agraria y Pesquera (IFAPA), Center “Cabra”, 14940 Cabra, Spain
*
Authors to whom correspondence should be addressed.
Horticulturae 2024, 10(9), 952; https://doi.org/10.3390/horticulturae10090952
Submission received: 29 July 2024 / Revised: 2 September 2024 / Accepted: 3 September 2024 / Published: 6 September 2024

Abstract

:
Hedgerow cultivation systems have revolutionized olive growing in recent years because of the mechanization of harvesting. Initially applied under irrigated conditions, its use has now extended to rainfed cultivation. However, there is limited information on the behavior of olive cultivars in hedgerow growing systems under rainfed conditions, which is a crucial issue in the context of climate change. To fill this knowledge gap, a rainfed cultivar trial was planted in 2020 in Southern Spain to compare ‘Arbequina’, ‘Arbosana’, ‘Koroneiki’, and ‘Sikitita’, under such growing conditions. One of the most important traits in low-water environments is the canopy growth. Because traditional canopy measurements are costly in terms of time and effort, the use of light detection and ranging (LiDAR) sensor onboard an uncrewed aerial vehicle (UAV) was tested. Statistical analyses of data collected in November 2022 and January 2023 revealed high correlations between UAV-LiDAR metrics and field measurements for height, projected area, and crown volume, based on validation with measurements from 36 trees. These results provide a solid basis for future research and practical applications in rainfed olive growing, while highlighting the potential of UAV-LiDAR technology to characterize tree canopy structure efficiently.

1. Introduction

Olive growing systems have significantly changed in recent years from traditional to more intensive systems in both long-established and new growing areas. The main changes are primarily channeled toward optimizing productivity via strategies such as efficient crop management, irrigation, pruning, harvest mechanization, and innovative training systems, such as hedgerow orchards. This cultivation system is characterized by planting densities between 1200 and 2500 trees·ha−1, contrasting with the traditional ones ranging from 50 to 160 trees·ha−1 [1]. The evolution of this new cultivation system is driven by the potential for full mechanization of the harvest, its early bearing, and high productivity with a lower influence of the natural cycle of “on” and “off” years [1].
Most hedgerow olive orchards planted today are under irrigation [2]. However, there is an increasing trend of using this growing system in new orchards in dry farming conditions or with very low irrigation [3]. Nevertheless, there is a notable absence of the scientific literature addressing the management of high-density olive orchards in rainfed conditions; therefore, it is necessary to conduct research to define best practices regarding management decisions such as the selection of olive cultivars or the planting pattern [4]. In the selection and development of the best-suited olive cultivars for rainfed hedgerow orchards, field phenotyping is crucial. Traditional phenotyping methods, which rely on manual data collection of measurable traits, are time-intensive [5] and prone to errors, especially in the case of the olive tree, whose crown has an irregular geometry [6]. Enhancing the acquisition of crop traits, ranging from morphological attributes and flowering time to yield, remains a paramount challenge. The inefficiencies and time-prohibitive barriers of traditional phenotyping methods hinder and delay breeding program design and prediction outcomes [7]. In particular, canopy-related traits are essential in the adaptation of cultivars to water-reduced environments [8].
With respect to the acquisition of phenotypic data about canopy architecture and vegetative development, the use of 3D models created with different sensors and platforms has increased in recent years because of their accuracy and efficiency [9]. Among the different technologies used in the generation of 3D models, photogrammetric products created with cameras onboard uncrewed aerial vehicles (UAVs) have been widely reported in the scientific literature. This technology has been successfully validated in a wide range of herbaceous and woody crops including rice [10], soybean [11], sorghum [12], blueberry bush [13], and almond varieties [14]. In olive crops, UAV photogrammetry was used for phenotyping purposes in table olive cultivars in intensive and hedgerow planting patterns [6] and to assess the dwarfing effect of different rootstocks to improve the suitability of ‘Picual’ cultivar to hedgerow growing systems [15]. However, UAV photogrammetry has shortcomings when working with small trees with low heights and low leaf density; its point density and spatial resolution might not be sufficient to detect and characterize specific phenotypic traits. De Castro et al. [16] reported that accurate UAV photogrammetric point clouds were able to reconstruct olive trees in a hedgerow orchard 27 months after planting, but the accuracy of the tree reconstruction was not sufficient for phenotyping purposes when tested one year earlier.
An issue with the photogrammetric reconstruction of small trees is related to the underestimation of heights that have been observed in adult trees, due to difficulties in reconstructing thin branches that are difficult to detect in aerial images [17,18]. An alternative to the use of passive sensors in these situations is the use of active sensors, such as light detection and ranging (LiDAR) sensors, mounted on UAVs. LiDAR sensors emit laser pulses that are reflected by the crop, allowing the measurement of the distance between the sensor and the crop based on the flight time of the laser pulses. These data, along with the precise positioning and orientation of the sensor, allow for the creation of accurate 3D reconstructions of the crop that do not present the same problems associated with passive sensors in the case of thin branches. In this research area, Ref. [19] obtained accurate results using UAV-LiDAR for calculating the phenotypic traits of Eucalyptus sp. trees.
The aim of this study was to assess whether UAV-LiDAR technology can be employed to effectively extract phenotypic traits related to the crown structure of young olive trees cultivated in a rainfed hedgerow orchard. To the best of the authors’ knowledge, this is both the first time that UAV-LiDAR technology has been used and validated in an olive orchard and the first study of rainfed olive orchards with a high-density hedgerow planting pattern.

2. Materials and Methods
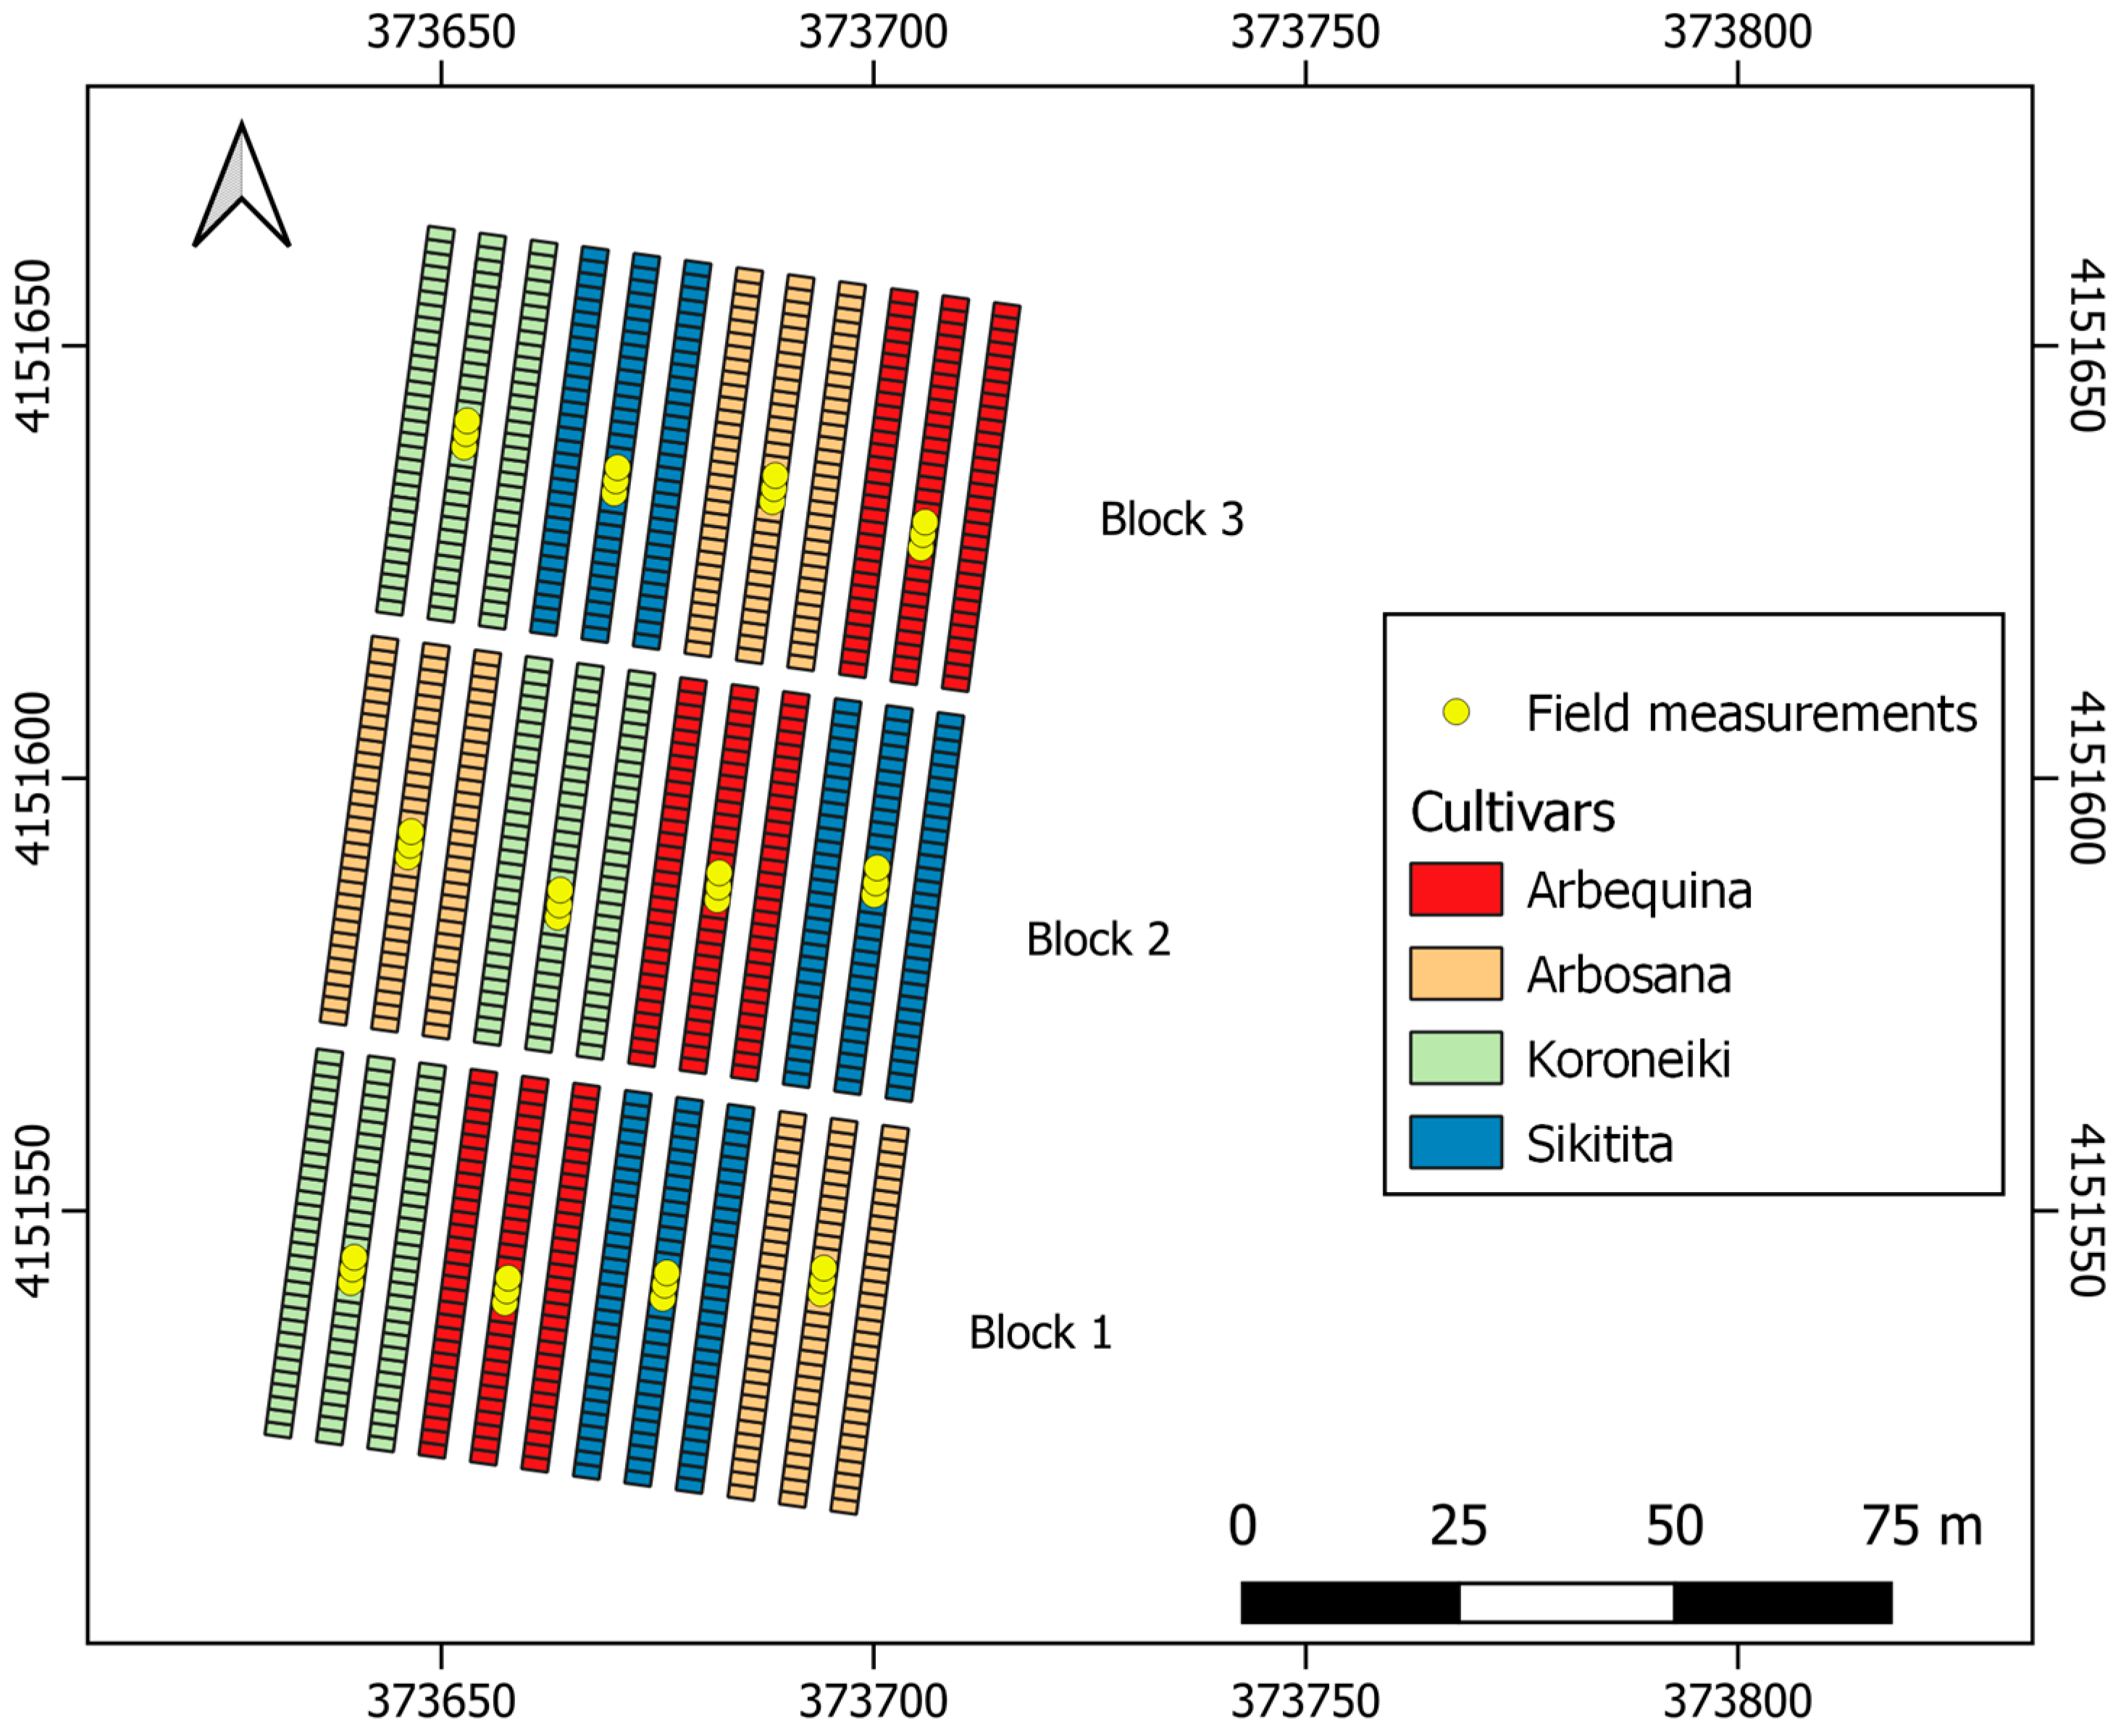
2.1. Study Site

The work was carried out on a 1.1-ha plot located at the IFAPA Center in Cabra, southern Spain (37.502619° N, 4.428879° W, WGS84). This region has an average rainfall of 582 mm·year−1; more detailed meteorological data for the period in which the work was carried out can be seen in Figure 1.
The southern half of the experimental orchard has a slight slope of about 3% with a north orientation, and the northern half has a slope of about 8% with the same orientation. The olive trees were planted in March of 2020 under rainfed conditions with a planting pattern of 6 × 1.5 m, resulting in a tree density of 1111 trees·ha−1. The trial was arranged in a design of 3 randomized blocks with elementary plots composed of 3 rows of 30 plants each (Figure 2). Four olive cultivars were selected for testing under rainfed conditions on the basis of their vigor: ‘Arbosana’ and ‘Sikitita’ (low vigor), ‘Arbequina’ (intermediate vigor), and ‘Koroneiki’ (high vigor)) [20,21].

2.2. UAV-Based LiDAR Platform and Flight Configuration

The uncrewed aerial platform used in this work was a DJI Matrice 600 Pro (DJI, Shenzhen, China). The UAV was equipped with a Velodyne Puck 16 (Velodyne, San José, CA, USA) LiDAR sensor capable of recording data up to a distance of 100 m with an accuracy of 3 cm. This sensor can register two returns of the laser pulses, has 16 channels, and has horizontal and vertical fields of a view of 360° and 30°, respectively. To complement the LiDAR sensor, an Applanix APX-15 UAV (Applanix, Richmond Hill, ON, Canada) sensor was integrated into the system. The APX-15 is a compact GNSS-Inertial module that combines a multifrequency GNSS receiver with high-performance MEMS inertial sensors. This sensor provides high-accuracy position and orientation solutions operating at a high data rate, providing position, roll, pitch, and heading outputs at 100 Hz, which is essential for accurate and efficient mapping and surveying tasks.
The UAV flights were performed at a height of 45 m above the ground and at a speed of 5.7 m/s. Flight routes were designed to have a 66% overlap between adjacent flight paths. Six flights were carried out for this work, a monthly flight from July 2022 to November 2022, and an additional flight in January 2023 after the harvest and pruning of the lower part of the crown.

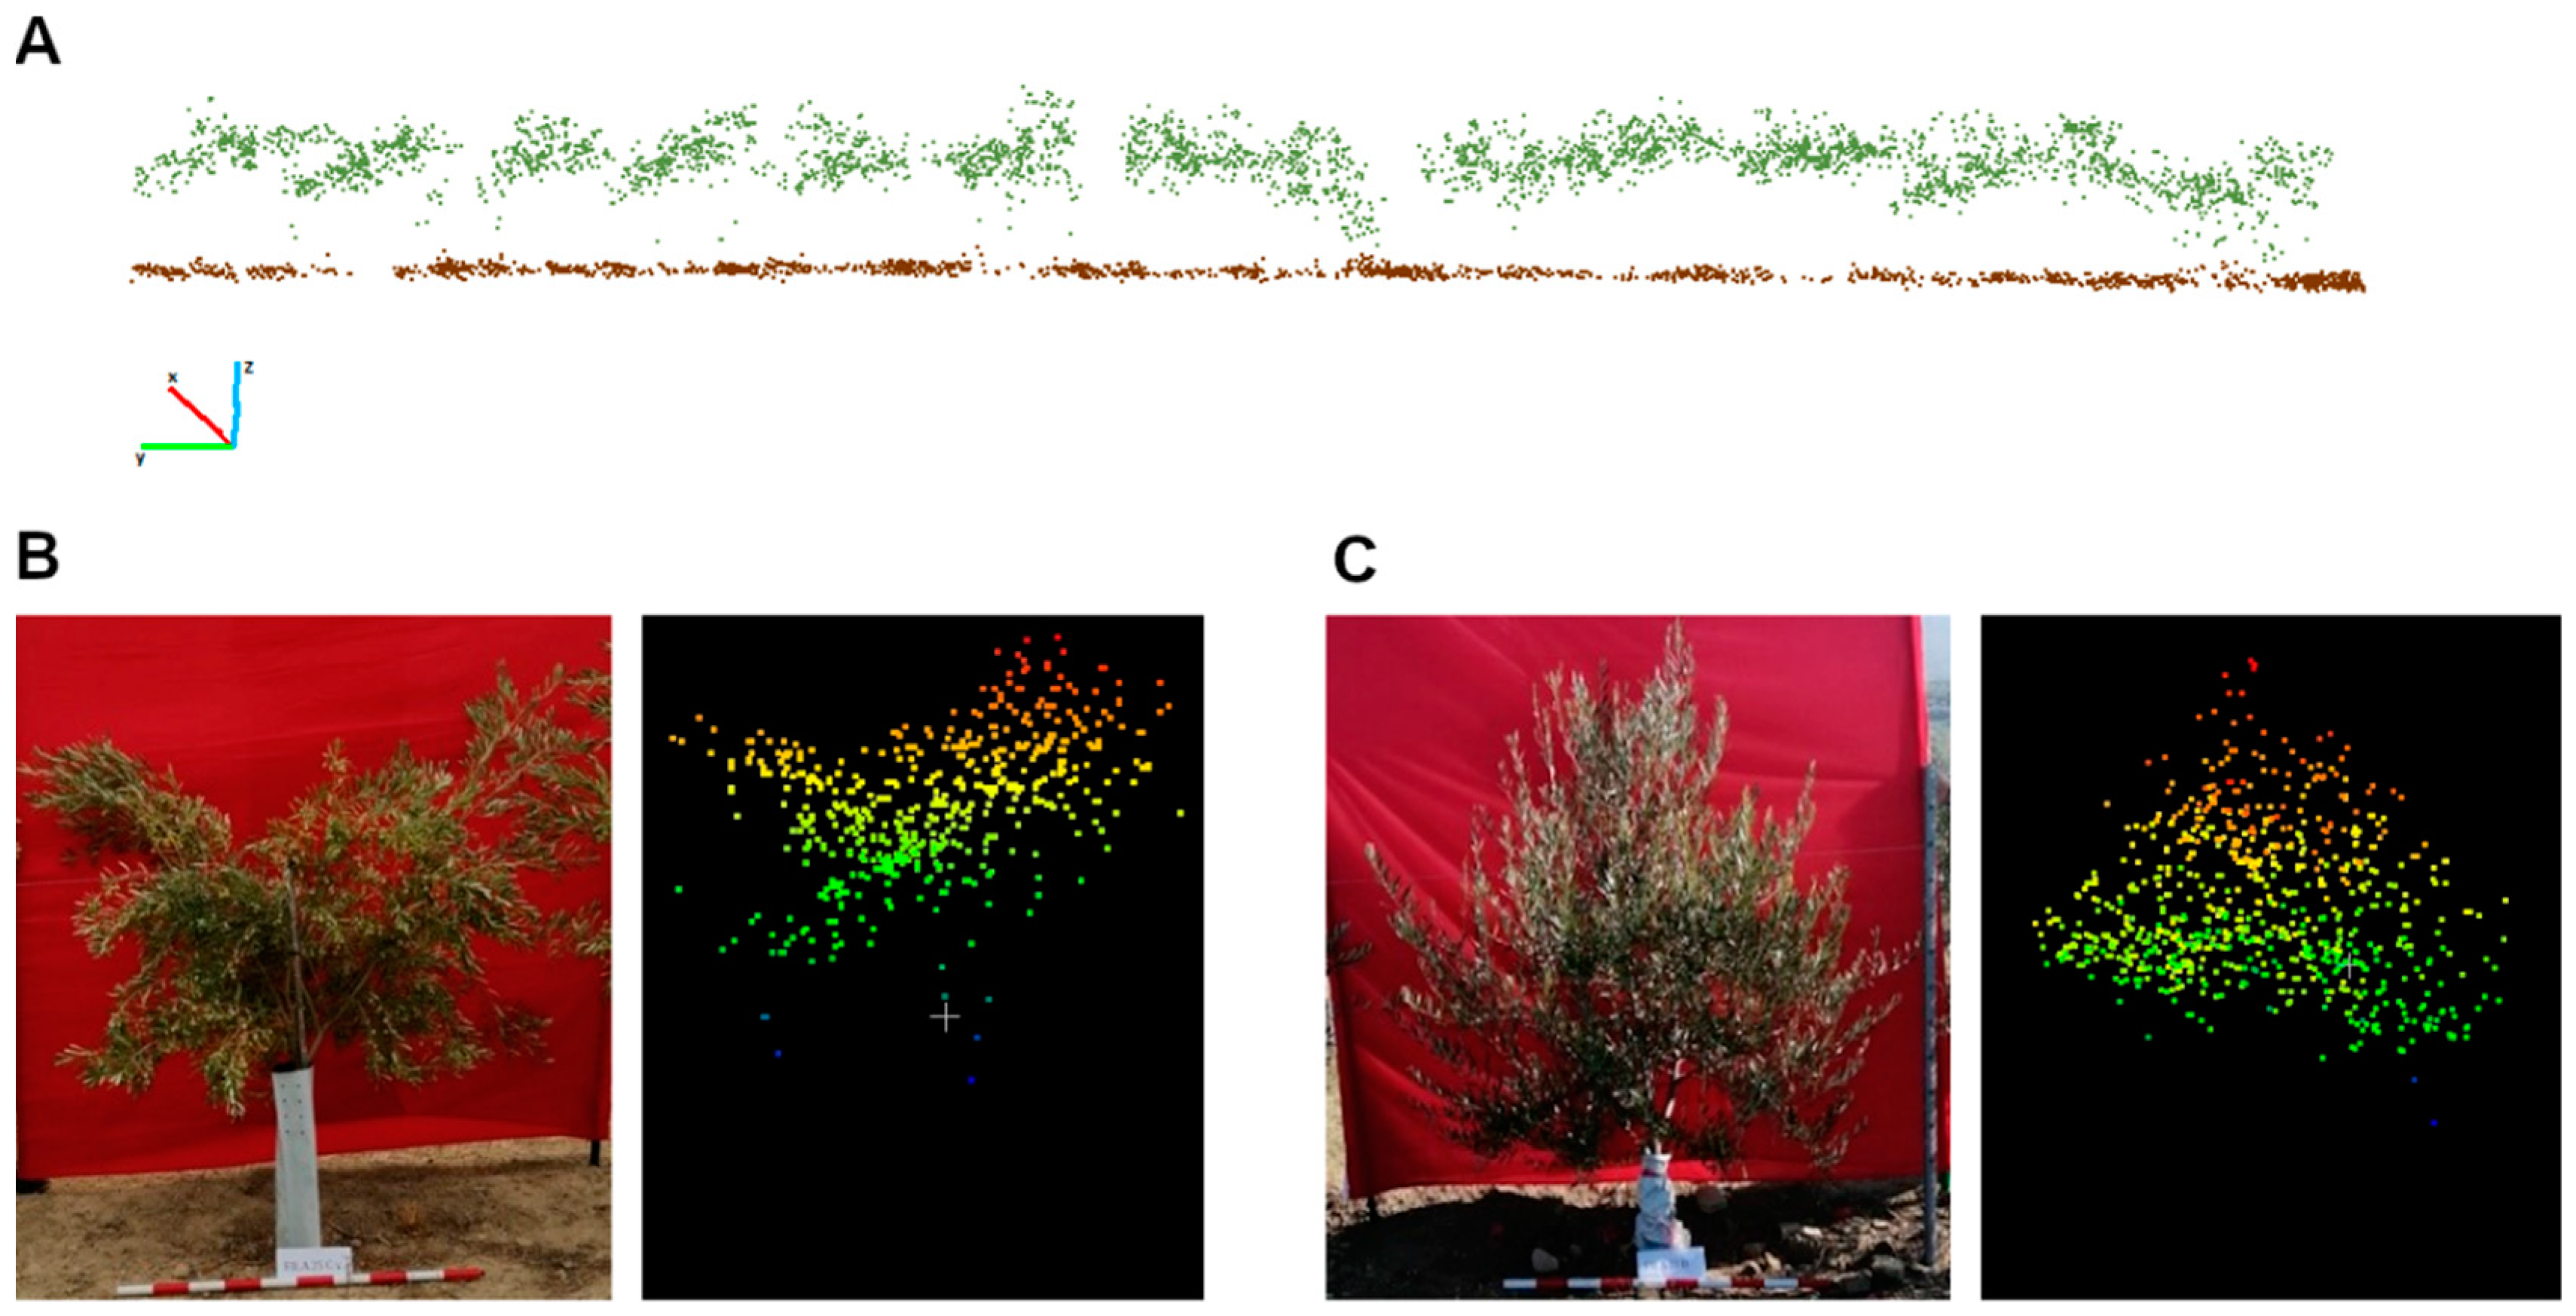
2.3. Point Cloud Generation and Individual Tree Segmentation

The workflow for the generation and analysis of the LiDAR point cloud consisted of the following main steps (Figure 3):
  • Determining the trajectory followed by the sensor;
  • Generating and cleaning the 3D point cloud;
  • Extracting and characterizing each olive tree crown;
  • Statistically analyzing the data.
Initially, the direct orientation (position and orientation) of the LiDAR sensor was processed via Applanix POSPac MMS software version 8.8 (Trimble Applanix, Richmond Hill, ON, Canada), based on the data of the inertial measurement unit (IMU) and the nearest GNSS reference station from the Andalusian positioning network. From the direct orientation and LiDAR sensor data, a raw 3D point cloud was generated via LiDAR Tools software version 3.2.0 (Headwall Photonics Inc., Bolton, MA, USA) for subsequent cleaning. Next, the raw 3D point cloud was split at the turns based on trajectory, removing those points from the flight line changes. Additionally, points with a scan angle greater than 15° were removed. The point cloud was subsequently aerotriangulated using TerraMatch version 024 (Terrasolid, Espoo, Finland) to improve spatial coherence, followed by classification using TerraScan-UAV version 024 (Terrasolid, Espoo, Finland) to distinguish between ground and vegetation points. The heights of the points classified as vegetation were normalized using ground points as a reference. Based on the planting pattern, a grid was generated where each element represented the space occupied by an individual tree using a rectangle. This grid was projected onto the normalized vegetation point cloud to individually isolate each tree. This approach allowed for the determination of tree-scale structural parameters such as height, volume, and projected area. All point cloud processing was conducted using the R Statistical Software (v4.1.2; R Core Team 2021) development environment and the rLiDAR [22] and lidR [23] packages.

2.4. Validation

Concurrent with the flights conducted in November 2022 (preharvest) and January 2023 (postharvest), manual crown measurements were performed on 36 selected trees (Figure 2). These measurements included the total height of the tree, the height of the canopy, and two crown diameters, one in the transverse orientation and another longitudinally, at three levels of the vegetative mass (1/6 of the crown height, 1/2 of the crown height, and 5/6 the of crown height) (Figure 4).
The total height of each tree was measured at the apex of the crown using a telescopic ruler. Crown diameters (horizontal projected and perpendicular widths) were acquired using a tape measure. Possible geometric representations of the crown (elliptic cylinder and ellipsoid) were calculated from the height and width measurements. For the elliptic cylinder shape, the crown was divided into three parts and the diameters measured at each height were used to calculate the volume of three elliptic cylinders; finally, the volume of the three sections was aggregated to obtain the total crown volume. For the ellipsoid shape, the height of the vegetative mass and the diameters at the central section of the crown were used to calculate the volume. The projected crown area was calculated as that of an ellipse, using the largest diameter in the longitudinal direction of the hedgerow and the largest diameter in the transverse direction. All these determinations were used as ground truths in supporting UAV cartography to validate the geometric characteristics captured with the LiDAR sensor (height, area, and volume).

2.5. Statistical Analysis

Mean comparison tests were conducted to determine the existence of significant differences at p < 0.05 between field-measured and LiDAR-derived variables. A paired samples t-test was applied to variables with a normal distribution, while a Wilcoxon test was used for those that did not meet the normality assumption.
To validate the LiDAR-derived variables, correlations between these variables and the field measurements were computed to provide a quantitative assessment of their interrelationship. Pearson’s correlation coefficient was calculated for normally distributed variables; conversely, Spearman’s correlation coefficient was used for non-normally distributed variables. All statistical analyses were conducted using R Statistical Software (v4.1.2; R Core Team 2021).

3. Results

3.1. Point Cloud Generation

After processing the UAV-LiDAR data, point clouds were obtained with densities of 1268 points·m−2 for the preharvest flight (November 2022) and 1370 points·m−2 for the postharvest flight (January 2023). Figure 5A represents a transversal section of the November 2022 point cloud showing 15 olive trees; the points are colored following the ground and vegetation classification performed in TerraScan-UAV. In contrast with point clouds generated with passive sensors, the point cloud generated with UAV-LiDAR represents the soil under the canopy. In Figure 5B,C, a comparison of two trees and their respective three-dimensional representations is shown, confirming the accurate reconstruction of the irregular crowns of the olive trees.

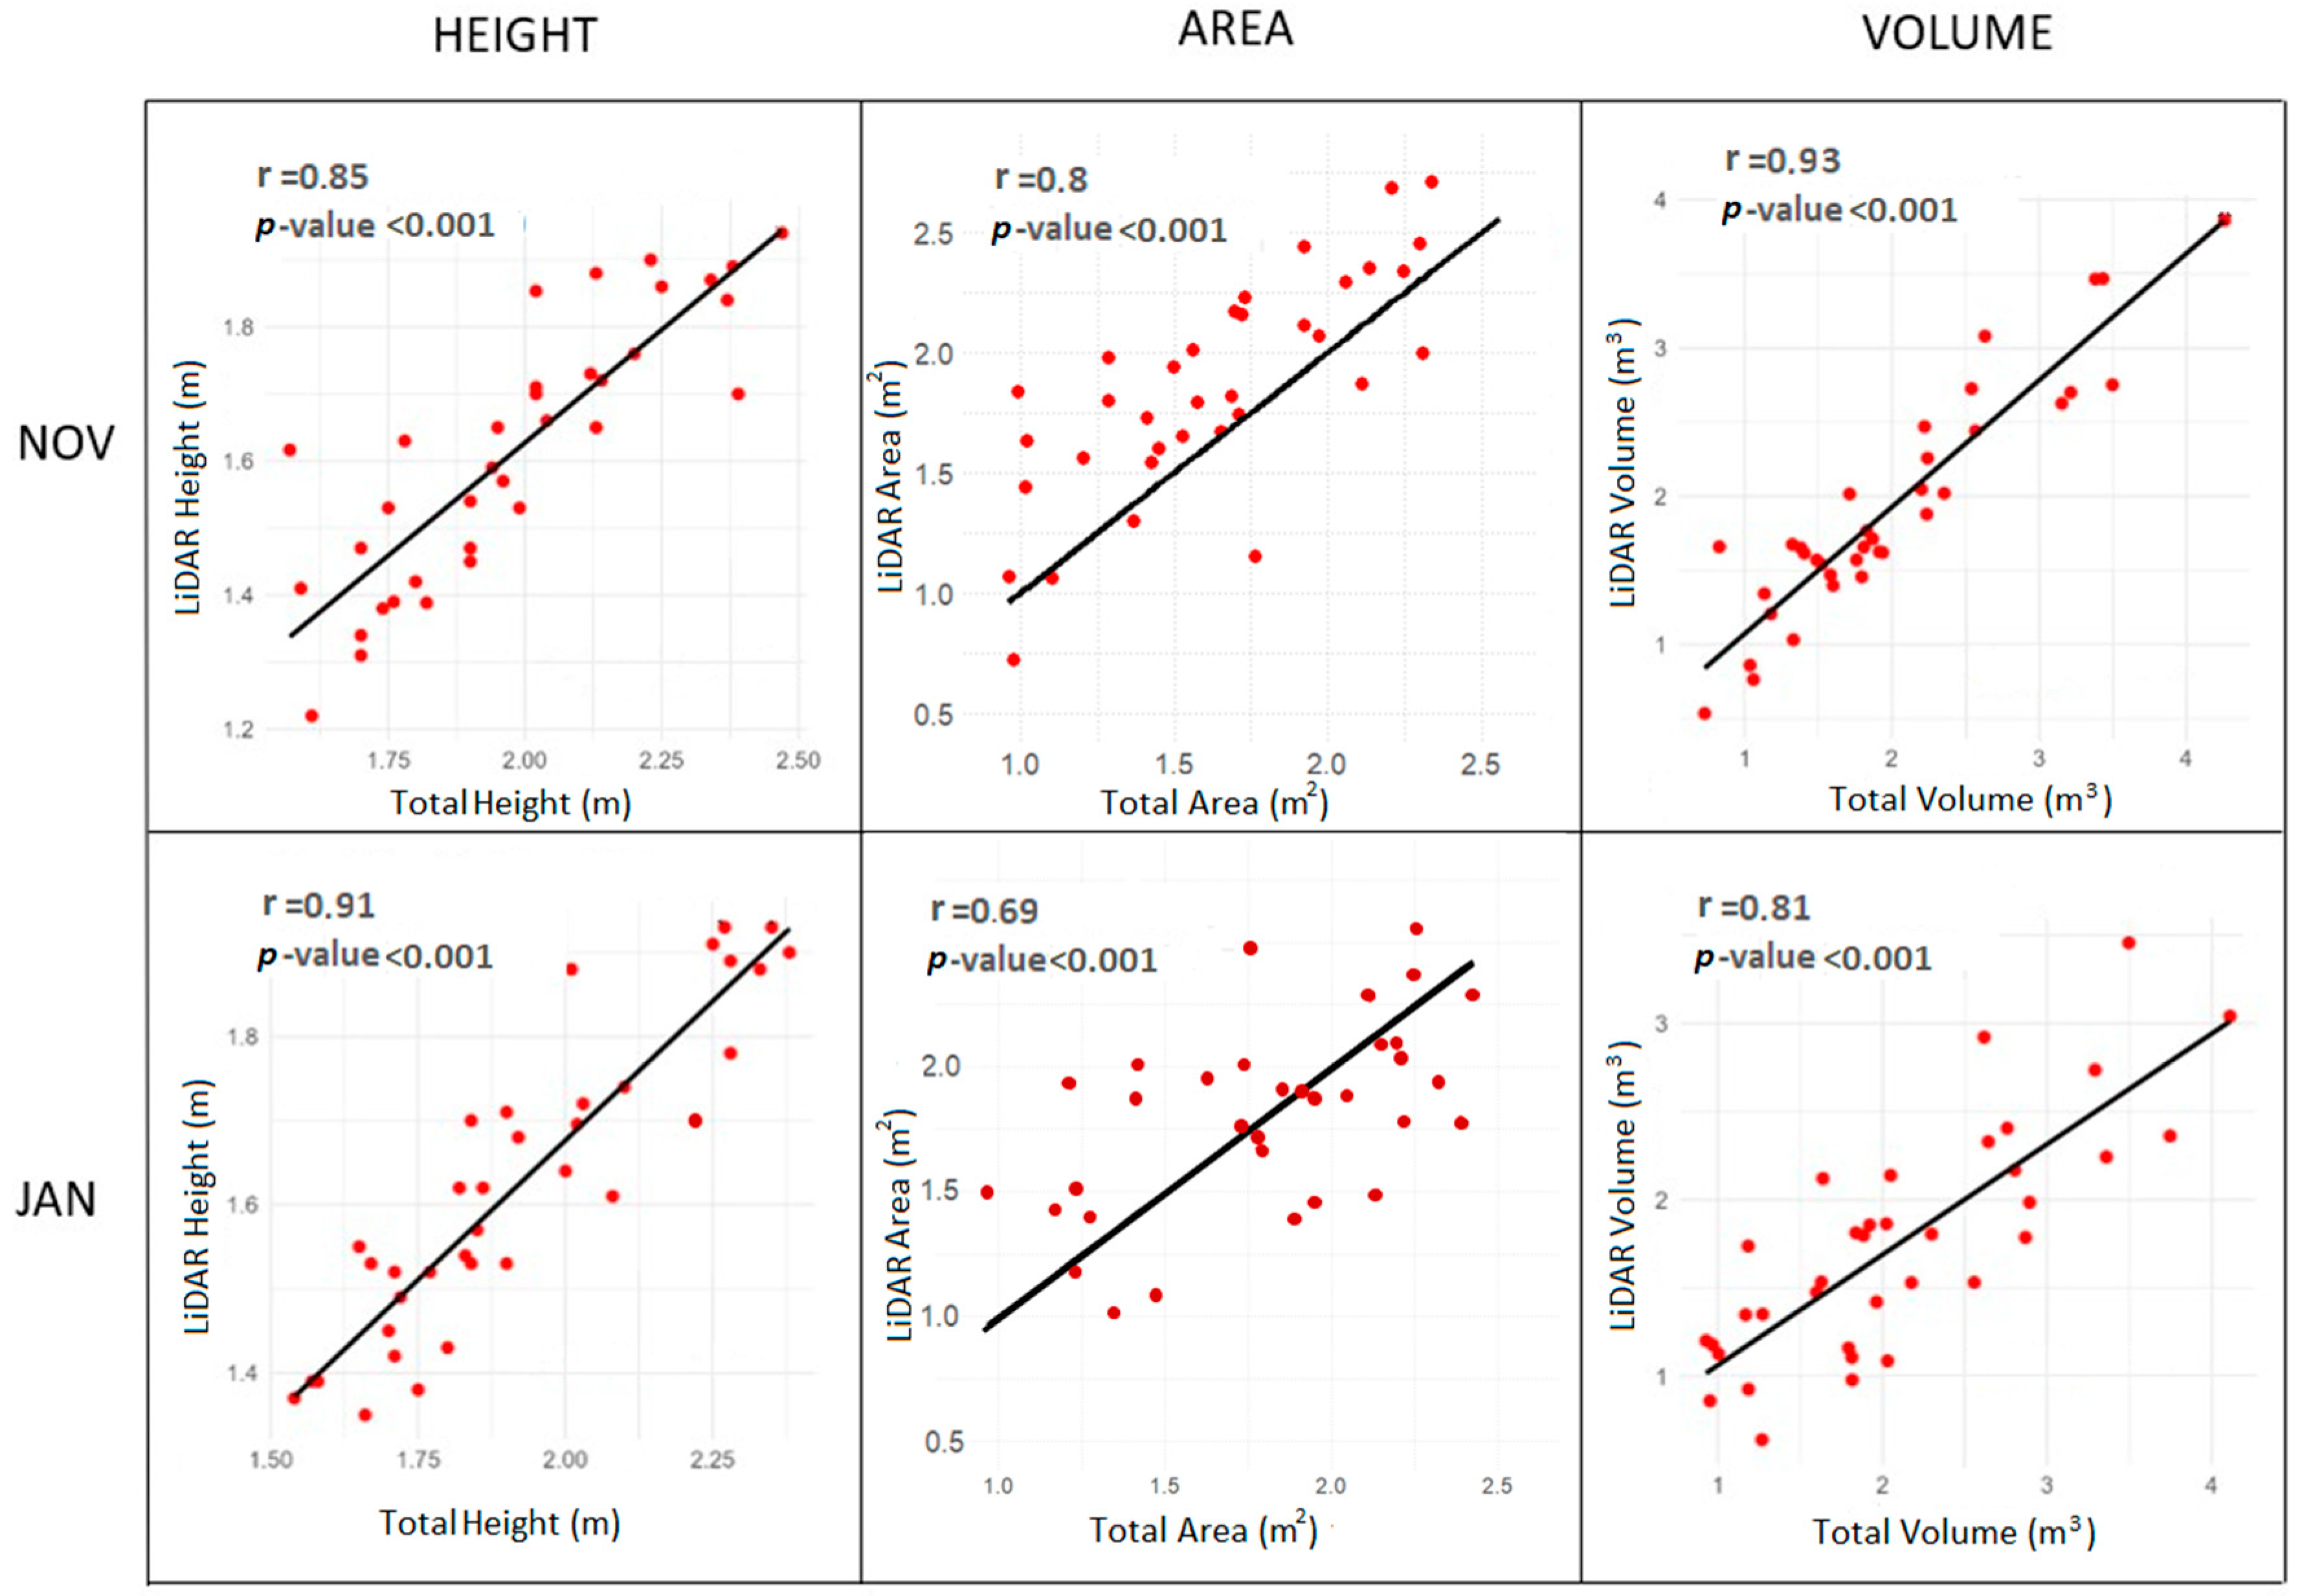
3.2. Validation of the LiDAR-Derived Crown Metrics

Table 1 presents a comparative analysis of crown parameters measured in the field and derived from LiDAR data for trees observed in November 2022 and January 2023. The LiDAR-derived tree heights were nearly equivalent in November and January, with means of 1.61 m and 1.62 m, respectively, whereas the field measurements showed a slight decrease from 1.98 m to 1.92 m. The estimated crown area from the LiDAR data remained almost unchanged between November and January. In contrast, the volume measurements from the LiDAR data decreased over the two months, from 1.93 m3 to 1.75 m3. Conversely, field measurements for the same period revealed an increase in area and volume. Field measurements were higher than those derived from LiDAR point clouds for volume assuming an elliptic cylinder shape and for height at both dates studied. On the other hand, LiDAR volume estimations were higher than the field volume calculated considering an ellipsoid shape; also, the LiDAR-based area estimations were higher than the field estimations.
The statistical analysis of the means revealed that, in November, the only variable that did not show significant differences between the field and the LiDAR estimations was the volume, when using the formula of an elliptic cylinder. In January, there were two variables with no differences associated with the measurement method: the area and the volume calculated using the formula of an ellipsoid. Due to the normality of the data, all the mean comparisons were carried out using the paired samples t-test, except for the height in November, where the Wilcoxon test was used because it did not meet the normality assumption.
Figure 6 shows the results of the study of the correlation between the LiDAR-derived and field-measured crown parameters. Due to the normality of the data, Pearson’s correlation coefficient values were calculated for most comparisons, except for the height in January 2023, for which Spearman’s coefficient was used because the data were not normally distributed. To avoid overcomplicating the figure, only the field volume with the highest correlation coefficient was included in the scatter plots. All correlation coefficients were statistically significant at a significance level of p < 0.001, and there were no extreme values that could have exaggerated or dampened the strength of the correlation. The best correlation coefficients for volume estimation were achieved when the UAV-LiDAR volume was compared with the volume of the elliptic cylinder (0.93 in November 2022 and 0.81 in January 2023); the correlation coefficients with the ellipsoid volume were 0.91 and 0.77 for November and January, respectively. Except for the crown area in January 2023 (0.69), all the correlation coefficients were greater than 0.80, reaching 0.93 for the crown volume in November 2023. The correlation coefficients of the other crown parameters decreased on the second flight date, except for the crown height, which increased from 0.85 to 0.91.

3.3. LiDAR Data Extraction in the Experimental Orchard

After validating the LiDAR technology with data from 36 trees over two months, the proposed workflow for extracting phenotypic traits was applied to the remaining trees. This allowed us to quantify the height, volume, and projected area of 1080 trees. Figure 7 represents a map showing the values of the three canopy-related traits studied in this work for the entire experimental crop. The first notable observation from the spatial distribution maps of the analyzed variables is that the trees exhibit greater development in the southern part of the plot. Regarding the differences between varieties, although their analysis is beyond the scope of this work, it can be observed that the ’Sikitita’ cultivar consistently shows lower values for the studied canopy parameters.

4. Discussion

The point cloud densities achieved in this study were comparable to those obtained with the same LiDAR sensor by Camarretta et al. [19] although they performed a cross-strip flight path at lower speed and flight height. The configuration used by [19] should have rendered a higher point density, but the authors chose to retain only the first-return points, whereas, in the present work, all the returns were considered in the generation of the point cloud.
The underestimation of tree height could be attributed to the fact that field height measurements were taken at the upper leaves of the trees, which, in young trees of the studied experimental orchard, are usually located in a thin branch. Given the low leaf and branch densities of young olive trees under rainfed conditions, it is challenging to obtain a laser pulse return that coincides with the top leaf where the height is measured in the field. The discrepancies in area and volume between the LiDAR and field datasets are probably also related to the same reason, as well as the fact that field data are estimations rather than actual measurements. In these estimations, the olive trees are considered to have a geometric shape that does not match the actual tree shape (see Figure 5) and introduces errors that affect the correlation with the UAV-LiDAR data.
The mean and maximum heights estimated from the LiDAR point cloud were almost identical in November 2022 and January 2023. Given that harvesting and pruning in the orchard did not affect the height, it can be stated that LiDAR measurements are consistent and reproducible. The mean LiDAR-derived projected area was also almost constant. In contrast, the crown volume extracted from the LiDAR data decreased by approximately 9% on the second date, which could be related to damage to the side branches caused by the harvester machine and to pruning. A decrease in crown volume caused by over-the-row harvesters in hedgerow olive orchards has been previously reported via the use of LiDAR sensors installed on tractors [24]. Field estimates of area and volume showed an increase in these values, although it was minimal in the case of the volume. These increases are not consistent with the field operations carried out in the orchard and are likely related to inaccuracies in the field measurements of crown diameters and the use of formulas that assume the olive crown to be a geometric solid.
The high values of the correlation coefficients achieved for the crown parameters studied on both validation dates are indicative of the accuracy and repeatability of the proposed workflow based on UAV-LiDAR data. The repeatability of LiDAR measurements has also been demonstrated in previous experiments using a terrestrial platform in almond orchards [25]. The fact that the UAV-LiDAR volume correlated better with an elliptic cylinder than with an ellipsoid could be explained by the division of the crown into three sections applied in the cylinder volume calculation, which allowed for a better fit to the irregularities of the olive crown. The decrease in the correlation coefficient for volume and area in January could be related to potential issues in the field measurements previously mentioned. The field-measured values for these crown parameters were higher in January 2023 than in November 2022, which is improbable considering that the olives were harvested and pruned between these dates.
Previous studies using UAV photogrammetry in olive orchards [15,16] have demonstrated high precision in extracting phenotypic traits associated with crown architecture. However, the incorporation of a LiDAR sensor in this study has enabled the attainment of high accuracy in the same task for olive trees shorter than 2 m for the first time. The ability to achieve a detailed reconstruction of the olive tree crown at this early developmental stage is crucial, as during these initial stages, the olive trees exhibit their growth habits. Beyond this point, in hedgerow orchards, the shape and growth pattern of trees are largely influenced by pruning and hedgerow management. Consequently, the high cost of a LiDAR sensor, in comparison with the cameras employed in photogrammetry, is justified by the benefits of monitoring the crown architecture and growth pattern from the inception of the olive orchard.
As demonstrated in Figure 7, the proposed workflow paves the way to produce extensive and accurate datasets for the phenotyping of olive cultivars during their initial stages of field development. Accurate measurements of more than 1000 trees via traditional manual methods would not have been possible, but the efficiency of the proposed workflow made it feasible. This enhanced ability to evaluate a larger number of trees in a more efficient manner will enable the extraction of more robust conclusions about the cultivars evaluated in phenotyping experiments. Thus, for example, an index of heterogeneity in the growth of different cultivars could be calculated from measurements of all individual trees. This is a significant improvement over conclusions derived from smaller datasets, which are often constrained by the availability of the workforce in traditional field measurements. Although the analysis of differences between varieties is beyond the scope of this work and will be addressed in future publications, it has been observed that the ’Sikitita’ cultivar, developed for use in hedgerow cultivation [26], has shown less vegetative growth compared to the other studied varieties. At the plot level, the differences observed between the northern and southern areas are likely related to the lower slope of the southern area mentioned in the description of the experimental orchard.

5. Conclusions

This study demonstrated that UAV-LiDAR technology provides significant precision in extracting phenotypic traits associated with the crown architecture of olive trees. This precision has been achieved for the first time for olive trees shorter than 2 m, a crucial developmental stage where the trees exhibit their growth habits. Although the LiDAR data underestimated height and volume compared with field measurements, the correlations between LiDAR-derived and field-measured crown parameters are high, indicating the accuracy of the proposed UAV-LiDAR data-based workflow. To the best of the authors’ knowledge, this is the first study that employed UAV-LiDAR technology to explore olive tree phenotyping, and it is also the first work about phenotyping in a rainfed hedgerow olive orchard. Since the methodology has shown its ability to characterize individual cultivar performance in detail with respect to tree architecture, future work is focused on the agronomic evaluation of the plethora of data generated in the studied field, including yield data. These results support the decision making of olive breeding programs whose main objective is to select the cultivars that are best adapted to the particularities of the rainfed hedgerow system.

Author Contributions

Conceptualization, F.J.M.-C., R.d.l.R., F.L.-G., L.L., and J.T.-S.; Data curation, S.C.-M., F.J.M.-C., F.L.-G., F.P.-P., F.C.P., and J.T.-S.; Funding acquisition, F.J.M.-C., R.d.l.R., F.L.-G., and L.L.; Methodology, S.C.-M., F.J.M.-C., and J.T.-S.; Project administration, F.J.M.-C., R.d.l.R., F.L.-G., and L.L.; Software, S.C.-M., F.J.M.-C., and J.T.-S.; Validation, F.J.M.-C., F.C.P., and J.T.-S.; Writing—original draft, S.C.-M. and J.T.-S.; Writing—review and editing, F.J.M.-C., R.d.l.R., F.L.-G., and L.L. All authors have read and agreed to the published version of the manuscript.

Funding

This research was financed by projects PID2020-113229RB-C44 (Retos-Sociedad, MCIN/AEI/10.13039/501100011033) and AVA23.INV2023.016/TRA23.TRA2023.003 (Proyectos de Investigación y Transferencia del IFAPA, cofinanciados al 80% por el Fondo Europeo de Desarrollo Regional, FEDER).

Data Availability Statement

The datasets presented in this article are not readily available because they are part of an ongoing study. Requests for access to the datasets should be directed to the corresponding authors.

Conflicts of Interest

The authors declare no conflicts of interest.

References

  1. Fernández-Escobar, R.; Gil-Ribes, J.A.; Quesada-Moraga, E.; Trapero, A.; Msallem, M. Evolution and Sustainability of the Olive Production Systems. Options Mediterr. 2013, 106, 11–42. [Google Scholar]
  2. Hueso, A.; González-García, C.; Atencia, L.K.; Nowack, J.C.; Gómez-Del-Campo, M. Methodology of Stem Water Potential Measurement on Hedgerow Olive Orchards. Span. J. Agric. Res. 2023, 21, e0902. [Google Scholar] [CrossRef]
  3. ESYRCE Encuesta sobre Superficies y Rendimientos Cultivos. Available online: https://www.mapa.gob.es/es/estadistica/temas/estadisticas-agrarias/agricultura/esyrce/ (accessed on 8 July 2024).
  4. Junta de Andalucía. Decree 103/2015, of March 10, approving the Master Plan for Olive Grove. Official Gazzete of the Junta de Andalucía. 2015. Available online: https://www.juntadeandalucia.es/boja/2015/54/2 (accessed on 8 July 2024).
  5. Madec, S.; Baret, F.; de Solan, B.; Thomas, S.; Dutartre, D.; Jezequel, S.; Hemmerlé, M.; Colombeau, G.; Comar, A. High-Throughput Phenotyping of Plant Height: Comparing Unmanned Aerial Vehicles and Ground LiDAR Estimates. Front. Plant Sci. 2017, 8, 2002. [Google Scholar] [CrossRef]
  6. Rallo, P.; de Castro, A.I.; López-Granados, F.; Morales-Sillero, A.; Torres-Sánchez, J.; Jiménez, M.R.; Jiménez-Brenes, F.M.; Casanova, L.; Suárez, M.P. Exploring UAV-Imagery to Support Genotype Selection in Olive Breeding Programs. Sci. Hortic. 2020, 273, 109615. [Google Scholar] [CrossRef]
  7. Zaman-Allah, M.; Vergara, O.; Araus, J.L.; Tarekegne, A.; Magorokosho, C.; Zarco-Tejada, P.J.; Hornero, A.; Albà, A.H.; Das, B.; Craufurd, P.; et al. Unmanned Aerial Platform-Based Multi-Spectral Imaging for Field Phenotyping of Maize. Plant Methods 2015, 11, 35. [Google Scholar] [CrossRef]
  8. Marques, P.; Pádua, L.; Sousa, J.J.; Fernandes-Silva, A. Assessing the Water Status and Leaf Pigment Content of Olive Trees: Evaluating the Potential and Feasibility of Unmanned Aerial Vehicle Multispectral and Thermal Data for Estimation Purposes. Remote Sens. 2023, 15, 4777. [Google Scholar] [CrossRef]
  9. Paulus, S. Measuring Crops in 3D: Using Geometry for Plant Phenotyping. Plant Methods 2019, 15, 103. [Google Scholar] [CrossRef]
  10. Kawamura, K.; Asai, H.; Yasuda, T.; Khanthavong, P.; Soisouvanh, P.; Phongchanmixay, S. Field Phenotyping of Plant Height in an Upland Rice Field in Laos Using Low-Cost Small Unmanned Aerial Vehicles (UAVs). Plant Prod. Sci. 2020, 23, 452–465. [Google Scholar] [CrossRef]
  11. Borra-Serrano, I.; De Swaef, T.; Quataert, P.; Aper, J.; Saleem, A.; Saeys, W.; Somers, B.; Roldán-Ruiz, I.; Lootens, P. Closing the Phenotyping Gap: High Resolution UAV Time Series for Soybean Growth Analysis Provides Objective Data from Field Trials. Remote Sens. 2020, 12, 1644. [Google Scholar] [CrossRef]
  12. Watanabe, K.; Guo, W.; Arai, K.; Takanashi, H.; Kajiya-Kanegae, H.; Kobayashi, M.; Yano, K.; Tokunaga, T.; Fujiwara, T.; Tsutsumi, N.; et al. High-Throughput Phenotyping of Sorghum Plant Height Using an Unmanned Aerial Vehicle and Its Application to Genomic Prediction Modeling. Front. Plant Sci. 2017, 8, 421. [Google Scholar] [CrossRef]
  13. Patrick, A.; Li, C. High Throughput Phenotyping of Blueberry Bush Morphological Traits Using Unmanned Aerial Systems. Remote Sens. 2017, 9, 1250. [Google Scholar] [CrossRef]
  14. López-Granados, F.; Torres-Sánchez, J.; Jiménez-Brenes, F.M.; Arquero, O.; Lovera, M.; de Castro, A.I. An Efficient RGB-UAV-Based Platform for Field Almond Tree Phenotyping: 3-D Architecture and Flowering Traits. Plant Methods 2019, 15, 160. [Google Scholar] [CrossRef]
  15. Torres-Sánchez, J.; de la Rosa, R.; León, L.; Jiménez-Brenes, F.M.; Kharrat, A.; López-Granados, F. Quantification of Dwarfing Effect of Different Rootstocks in ‘Picual’ Olive Cultivar Using UAV-Photogrammetry. Precis. Agric. 2022, 23, 178–193. [Google Scholar] [CrossRef]
  16. de Castro, A.I.; Rallo, P.; Suárez, M.P.; Torres-Sánchez, J.; Casanova, L.; Jiménez-Brenes, F.M.; Morales-Sillero, A.; Jiménez, M.R.; López-Granados, F. High-Throughput System for the Early Quantification of Major Architectural Traits in Olive Breeding Trials Using UAV Images and OBIA Techniques. Front. Plant Sci. 2019, 10, 1472. [Google Scholar] [CrossRef]
  17. Hobart, M.; Pflanz, M.; Weltzien, C.; Schirrmann, M. Growth Height Determination of Tree Walls for Precise Monitoring in Apple Fruit Production Using UAV Photogrammetry. Remote Sens. 2020, 12, 1656. [Google Scholar] [CrossRef]
  18. Jayathunga, S.; Owari, T.; Tsuyuki, S. Evaluating the Performance of Photogrammetric Products Using Fixed-Wing UAV Imagery over a Mixed Conifer–Broadleaf Forest: Comparison with Airborne Laser Scanning. Remote Sens. 2018, 10, 187. [Google Scholar] [CrossRef]
  19. Camarretta, N.; Harrison, P.A.; Lucieer, A.; Potts, B.M.; Davidson, N.; Hunt, M. From Drones to Phenotype: Using UAV-LiDAR to Detect Species and Provenance Variation in Tree Productivity and Structure. Remote Sens. 2020, 12, 3184. [Google Scholar] [CrossRef]
  20. de la Rosa, R.; León, L.; Guerrero, N.; Rallo, L.; Barranco, D. Preliminary Results of an Olive Cultivar Trial at High Density. Aust. J. Agric. Res. 2007, 58, 392–395. [Google Scholar] [CrossRef]
  21. Tous, J.; Romero, A.; Plana, J.; Hermoso, J.F. Olive Oil Cultivars Suitable for Very-High Density Planting Conditions. Acta Hortic. 2008, 791, 403–408. [Google Scholar] [CrossRef]
  22. Silva, C.; Klauberg, C.; Mohan, M.; Bright, B. LiDAR Analysis in R and rLiDAR for Forestry Applications. Lidar Remote Sens. Environ. Monit 2018, 404, 1–90. [Google Scholar]
  23. Roussel, J.-R.; Auty, D.; Coops, N.C.; Tompalski, P.; Goodbody, T.R.H.; Meador, A.S.; Bourdon, J.-F.; de Boissieu, F.; Achim, A. lidR: An R Package for Analysis of Airborne Laser Scanning (ALS) Data. Remote Sens. Environ. 2020, 251, 112061. [Google Scholar] [CrossRef]
  24. Pérez-Ruiz, M.; Rallo, P.; Jiménez, M.R.; Garrido-Izard, M.; Suárez, M.P.; Casanova, L.; Valero, C.; Martínez-Guanter, J.; Morales-Sillero, A. Evaluation of Over-The-Row Harvester Damage in a Super-High-Density Olive Orchard Using On-Board Sensing Techniques. Sensors 2018, 18, 1242. [Google Scholar] [CrossRef] [PubMed]
  25. Underwood, J.P.; Hung, C.; Whelan, B.; Sukkarieh, S. Mapping Almond Orchard Canopy Volume, Flowers, Fruit and Yield Using Lidar and Vision Sensors. Comput. Electron. Agric. 2016, 130, 83–96. [Google Scholar] [CrossRef]
  26. Rallo, L.; Barranco, D.; de la Rosa, R.; León, L. ‘Chiquitita’ Olive. HortScience 2008, 43, 529–531. [Google Scholar] [CrossRef]
Figure 1. Meteorological data of the study area for the period in which the work was carried out.
Horticulturae 10 00952 g001
Figure 2. Map showing the distribution of the olive trees and cultivars in the experimental field together with the positions of the trees measured in the field (Coordinate Reference System: WGS84, UTM 30N).
Horticulturae 10 00952 g002
Figure 3. Workflow of the generation and analysis of LiDAR point clouds.
Horticulturae 10 00952 g003
Figure 4. Field measurements were obtained for each tree to calculate the volume assuming the shape of an elliptic cylinder (A) and an ellipsoid (B): ht (total height of the tree), hc (height of the tree crown), and the diameters measured at different heights of the tree crown.
Horticulturae 10 00952 g004
Figure 5. Results of the point cloud generation process. (A) Transversal section of one of the hedgerows in November with points classified as vegetation (green) or soil (brown). (B,C) Field vs. LiDAR comparison of two different trees (points were colored blue for lower values and red for higher values using a color ramp covering the height range of each crop).
Horticulturae 10 00952 g005
Figure 6. Scatter plots showing the relationships between LiDAR-derived and field-measured crown parameters.
Horticulturae 10 00952 g006
Figure 7. Map showing the spatial distribution of height (A), projected area (B), and volume (C) of all the trees in the experimental field in November 2022 (Coordinate Reference System: WGS84, UTM 30N).
Horticulturae 10 00952 g007
Table 1. Summary of the field-measured and LiDAR-derived crown parameters for the matched trees.
Data OriginDateCrown ParameterMeanMaximumMinimumStandard Deviation
LiDARNovember 2022Height (m)1.611.941.220.20
Area (m2)1.893.020.720.49
Volume (m3)1.933.860.540.77
January 2023Height (m)1.621.931.350.18
Area (m2)1.882.831.010.43
Volume (m3)1.753.460.640.65
FieldNovember 2022Height (m)1.982.471.570.25
Area (m2)1.752.880.960.50
Volume (elliptic cyl.) (m3)2.094.260.730.90
Volume (ellipsoid) (m3)1.683.440.370.63
January 2023Height (m)1.922.381.540.25
Area (m2)1.852.880.970.50
Volume (elliptic cyl.) (m3)2.104.110.930.84
Volume (ellipsoid) (m3)1.703.120.550.61
Disclaimer/Publisher’s Note: The statements, opinions and data contained in all publications are solely those of the individual author(s) and contributor(s) and not of MDPI and/or the editor(s). MDPI and/or the editor(s) disclaim responsibility for any injury to people or property resulting from any ideas, methods, instructions or products referred to in the content.

