Abstract
Rhododendron, a globally popular ornamental flower, is nevertheless limited in our understanding of the mechanisms underlying its fragrance formation. Notably, terpenoids are the most prevalent volatile metabolite produced by plants. In this study, gas chromatography–mass spectrometry (GC–MS), liquid chromatography–mass spectrometry (LC–MS) and transcriptomics sequencing were conducted to analyze the synthesis mechanisms of terpenoid fragrance compounds of petals in fragrant R. fortunei Lindl. (YJ) and non-fragrant R. “Nova Zembla” (NW). The results identified that (-)-myrtenol, linalool, pinene, myrtenyl acetate, and terpineol were key floral aroma substances in YJ. Furthermore, an analysis of KEGG enrichment and differentially expressed genes (DEGs) revealed that the bud and decay stages exhibited the highest number of enriched DEGs among different aroma types, indicating these as critical stages for the synthesis of terpenoid floral compounds. In this study, a structural gene, denoted as RfFDPS, was identified as a negative regulatory gene for monoterpene accumulation and a positive regulatory gene for sesquiterpene accumulation in YJ. Utilizing subcellular localization technology, we determined that RfFDPS proteins are located in the cytoplasm. A functional analysis through transient expression and gene silencing of RfFDPS demonstrated its ability to regulate the accumulation of monoterpenes and sesquiterpenes. The overexpression of RfFDPS led to an increase in the expression of structural genes related to terpenoid synthesis, resulting in a decrease in monoterpenes and an increase in sesquiterpenes. Conversely, gene silencing had the opposite effect. In conclusion, RfFDPS plays a pivotal role in the synthesis and release of terpenoid volatile compounds in YJ petals, laying a solid theoretical foundation for the cultivation and enhancement of aromatic R. species.
1. Introduction
Rhododendron stands as a distinguished woody ornamental plant within the Rhododendron genus of the Ericaceae family, renowned as the “king of woody flowers” and celebrated as one of the world’s foremost ornamental blooms, widely used in landscaping and garden beautification. R. has abundant germplasm resources, with over 1200 varieties worldwide, and boasts approximately 600 of these varieties in China [1,2], but only a select few varieties exhibit aromatic qualities. R. fortunei Lindl., a member of the R. family and subgenus Evergreen Rhododendronstrum, predominantly thrives in southern China at elevations ranging from 629 to 2000 m above sea level. The flowers are large, light pink or light purple, elegantly shaped, and have a charming aroma, endowing them with high ornamental value [3]. In contrast, R. “Nova Zembla”, also belonging to the subgenus Evergreen Rhododendronstrum, features wide, funnel-shaped blossoms with purplish red petals adorned with dark brown-red spots; when flowering, there is no fragrance emitted [4], classifying it as an odorless rhododendron variant. Notwithstanding, it remains one of the top-selling alpine rhododendron cultivars presently available. While both R. fortunei Lindl. and R. “Nova Zembla” belong to the alpine rhododendron category, the former stands out as a rare aromatic rhododendron variant.
Floral aroma represents a paramount characteristic of ornamental plants [5]. Flower fragrance plays various roles in attracting pollinators and improving pollination efficiency during plant pollination [6,7]. Moreover, floral scents serve as a defense mechanism against environmental stressors [8]. For instance, (E)-β-caryophyllene, which is emitted during Arabidopsis flowering, acts as a deterrent against pathogen invasion [9], while eugenol exhibits potent antimicrobial properties [10]. Floral aroma, comprising numerous low-molecular weight, low-boiling point, and highly volatile compounds, collectively define a plant’s floral characteristics. Volatile organic compounds (VOCs) can be synthesized by various plant organs, including the roots, stems, leaves, seeds, and fruits. Presently, over 1700 VOCs have been identified [11]; the highest amount is typically contained in petals, encompassing terpenoids, benzene/phenylpropanoid compounds, fatty acid derivatives, amino acid derivatives, and other specific compounds. Numerous studies have elucidated the aroma profiles of ornamental plants [12], and in-depth research has been conducted on their release patterns and molecular regulatory mechanisms, such as roses [13], peonies [14], lilies [15,16], Osmanthus fragrans [17], dendrobiums [18], and prunus mumes [19]. However, our understanding of the transcriptional regulation underlying the synthesis and release of floral aroma substances remains limited. For rhododendrons, the current research focus is still on the relationship between anthocyanins [20,21] and their analgesic and anti-inflammatory effects [22,23,24]. Hence, investigating the genes related to the synthesis and metabolism of its floral aroma substances is beneficial for the study of the mechanism of rhododendron fragrance formation and the selection of new varieties.
Terpenoids stand as the predominant chemical constituents among the volatile compounds produced by plants [25]. Isopentenyl diphosphate (IPP) and dimethylallyl pyrophosphate (DMAPP), as the basic C5 structural units of terpene synthesis, are synthesized via two pathways—the mevalonate (MVA) pathway in the cytoplasm and the 2-C-methyl-D-erythritol 4-phosphate (MEP) pathway in the plastids [26]. Under the action of isopentenyl transferase, DMAPP synthesizes various intermediates of different lengths, including prenyl diphosphates (prenyl-PPs), such as geranyl diphosphate (GPP), farnesyl pyrophosphate (FPP), and geranylgeranyl pyrophosphate (GGPP). These intermediates serve as direct precursors for terpene synthase (TPS), which then synthesizes various complex and diverse terpene compounds with a large number of structures [27,28]. Terpenes, as the primary constituents of aromatic compounds, have garnered substantial attention in ornamental plants, such as roses and freesias. Studies have shown that monoterpenes account for up to 70% of the aroma in some roses [29], and terpene synthase exhibits specific expression patterns in freesia flowers [30]. In a study by Conart, et al. [31], it was found that geraniol, which is a fundamental characteristic of rose aroma, is synthesized through the MVA pathway from the bifunctional RCG/FPPS1, producing both GPP and FPP. The study elucidates the origin of the cytosolic GPP for geraniol production and suggests that RCG/FPPS1 plays a key role in the biosynthesis of volatile terpenoids in roses. Therefore, different structural genes may play different roles in different species.
In recent years, high-throughput omics techniques, including genomics, transcriptomics, proteomics, and metabolomics [32], have advanced rapidly. The combined analysis of metabolomics and transcriptomics has been widely used to study the relationship between secondary metabolite content in plant organs and the corresponding differentially expressed genes (DEGs) [33]. For instance, researchers have employed metabolomics and transcriptomics to dissect the antifreeze mechanism in naturally overwintering tea trees under freezing stress, analyzing their antifreeze mechanism. Meanwhile, Jiang et al. [34] conducted metabolomics and transcriptomics analyses to elucidate floral aroma composition and biosynthesis in male sterile clematis varieties. Basir et al. [35] used GC–MS and transcriptomics to determine the complete outline of terpenoid biosynthesis pathways in hoya. Similarly, Liu, et al. [36] utilized high-throughput transcriptomics and metabolomics to examine the variation in metabolite composition and related gene expression in Ginkgo biloba leaves across different developmental stages and tree ages, thereby facilitating the identification and analysis of key genes involved in terpene biosynthesis. Therefore, multi-omics joint analysis is an effective approach to exploring the mechanism of rhododendron fragrance synthesis.
The study aimed to gain deeper insights into the mechanisms that govern the formation of rhododendron fragrance during growth and development. It utilized transcriptome and metabolomics analyses on the petals of fragrant R. fortunei Lindl. and non-fragrant R. “Nova Zembla” at varying stages. The use of RNA-seq technology can help screen and identify candidate genes involved in the formation of rhododendron fragrance and analyze gene expression patterns. By applying non-targeted metabolomics detection technology, various VOCs synthesized and accumulated in the pathway are comprehensively detected, screening for key floral aroma compounds based on differential expression of metabolites in R. fortunei Lindl. Through multi-omics joint analysis, we explore the interplay between related genes, metabolites, metabolic pathways, and the production of rhododendron fragrance. This study provides novel insights into the molecular mechanism of the aromatic compound synthesis in rhododendron, thus serving as a scientific foundation for breeding new fragrant rhododendron varieties.
2. Material and Method
2.1. Plant Materials
In March 2021, two rhododendron varieties, R. fortunei Lindl. (designated as YJ) and R. “Nova Zembla” (designated as NW), were relocated and preserved in the Siming Mountain National Forest Park, located in Ningbo City, Zhejiang Province, with no human interference. The climate is a typical subtropical monsoon climate, which is cold and humid, with four distinct seasons and abundant sunshine and rainfall. The annual average temperature is 11.6~12.0 °C, the frost-free period is 203 days, and the annual precipitation is about 2000 mm. Ten plants exhibiting similar growth and vitality were randomly selected for each variety. Petals were separately collected at the following four distinct stages depicted in Figure 1: the bud stage with closed petals, the first bloom period with partially opened petals, the bloom stage with fully open petals, and the decay stage with withered petals. For metabolomics analysis, the samples were named YJ1-4 and NW1-4 respectively, with six biological replicates per stage, totaling 48 samples. For RNA-seq analysis, samples designated as YJA-D and NWA-D were utilized, with each experiment conducted in triplicate, yielding a total of 24 analyzed samples. Immediately following collection, the petals were promptly placed into sampling tubes containing liquid nitrogen and stored at −80 °C for subsequent analysis.
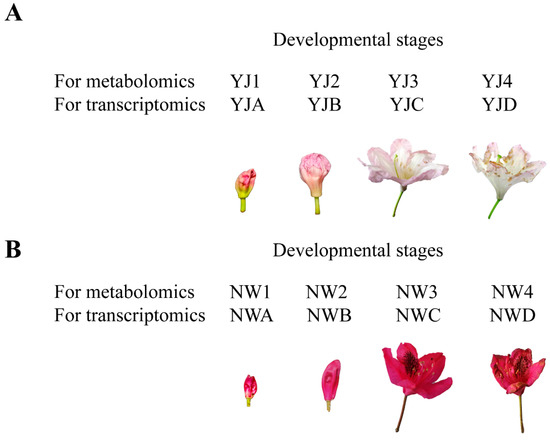
Figure 1.
The sampling scheme for flowers at the four developmental stages. (A) YJ, R. fortunei Lindl.; (B) NW, R. “Nova Zembla”.
2.2. Metabolomics Analysis
In order to screen the metabolites with significant biological significance during the development of YJ, non-targeted metabolomics analysis was carried out to detect the type and quantity of metabolites at different stages of development. For the non-targeted metabolomics analysis based on GC–MS, 100 ± 10 mg of the sample was placed into the 20 mL headspace vial, and 10 μL of 2-octanol (10 mg/L stock in dH2O) was used as an internal standard. In the SPME cycle of the PAL rail system, the incubation temperature was set at 60 °C; the preheat time was 15 min; the incubation time was 30 min; and the desorption time was 4 min. Thereafter, the GC–MS system was used to analyze the adsorbed volatile compounds using Agilent 7890A GC coupled with an Agilent 5977B MSD [37,38]. The system utilized a DB-Wax injected in Splitless Mode. Helium was used as the carrier gas, the front inlet purge flow was 3 mL min−1, and the gas flow rate through the column was 1 mL min−1. The initial temperature was kept at 40 °C for 4 min, then raised to 245 °C at a rate of 5 °C min−1 and maintained for 5 min. The injection, transfer line, ion source, and quad temperatures were 250, 250, 230, and 150 °C, respectively. The energy was −70 eV in electron impact mode. The mass spectrometry data were acquired in scan mode with a m/z range of 20–400 and a solvent delay of 0 min. All samples were pooled as quality control measures, and the measurement and analysis were carried out by Originene Co., Ltd. (Shanghai, China).
Weigh a total of 50 mg of powder, and use a grinder (JXFSTPRP-24, Shanghai Jingxin Co., Ltd., Shanghai, China) for 4 min at 35 Hz and ultrasonic for 5 min in an ice water bath. Repeat the above steps three times. Let it stand for 1 h at −40 °C, and use 1000 at 4 °C μL 75% methanol aqueous solution extraction containing an isotope-labeled internal standard mixture. After centrifugation at 12,000 rpm for 15 min, the supernatant will be collected and filtered for LC–MS non-targeted metabolomics detection. LC–MS analyses were performed using a UHPLC system (Vanquish, Thermo Fisher Scientific (China), Shanghai, China) with a UPLC HSS T3 column (2.1 mm × 100 mm, 1.8 μm) coupled with a Q Exactive HFX mass spectrometer (Orbitrap MS, Thermo Fisher Scientific (China), Shanghai, China). The mobile phase consisted of 5 mmol/L of ammonium acetate and 5 mmol/L of acetic acid in water (A) and acetonitrile (B). The auto-sampler temperature was 4 °C, and the injection volume was 3 μL. The QE HFX mass spectrometer was used for its ability to acquire MS/MS spectra on information-dependent acquisition (IDA) mode in the control of the acquisition software (Xcalibur, Thermo Fisher Scientific (China), Shanghai, China). In this mode, the acquisition software continuously evaluates the full-scan MS spectrum. The ESI source conditions were set as follows: sheath gas flow rate of 30 Arb, Aux gas flow rate of 10 Arb, capillary temperature of 350 °C, full MS resolution of 60,000, MS/MS resolution of 7500, collision energy of 10/30/60 in NCE mode, and spray voltage of 4.0 kV (positive) or −3.8 kV (negative).
2.3. The Identification and Quantification of Metabolites
Chroma TOF software (V4.3X) from LECO Corporation (San Jose, CA, USA) and Nist database were used for raw peak extraction, data baseline filtering and calibration, peak alignment, deconvolution analysis, peak identification, integration, and a spectrum match of the peak area. Quality control of the original data was implemented to ensure data accuracy. The quantification of floral volatiles was performed using the Agilent Chem Station Data Analysis Application based on the peak areas and quantity of internal standard. The floral VOCs were identified by comparing them with their mass spectra from the NIST Mass Spectral Library.
The raw data detected using LC–MS were converted to the mzXML format using ProteoWizard and processed with an in-house program, which was developed using R and based on XCMS, for peak detection, extraction, alignment, and integration. Then an in-house MS2 database (BiotreeDB) was applied for metabolite annotation, and the cutoff for annotation was set at 0.3. By comparing the retention time and annotated mass spectrum with the real standard compound, the target components were identified, and the non-volatile components in the sample were determined. The metabolites of |log2FC| > 1, p < 0.05, and VIP > 1 were identified as differentially accumulated metabolites (DAMs).
2.4. RNA Extraction and Transcriptome
RNA was isolated using a TRIzol kit (Invitrogen, Waltham, MA, USA) following the manufacturer’s protocol. RNA purity was assessed using the NanoDrop instrument (Thermo Fisher Scientific, Waltham, MA, USA), while RNA integrity was determined accurately using the Bioanalyzer 2100 system (Agilent Technologies, Santa Clara, CA, USA). Quality control, library construction, and sequencing were conducted by BGI Tech (Shenzhen, China). An RNA-seq analysis was performed on the DNBSEQ sequencing platform (BGI, Shenzhen, China).
2.5. Transcriptome Assembly, Annotation, and Differential Expression Analysis of the Genes
Clean data were obtained by removing reads containing adapters, reads containing poly-N, and low-quality reads from raw data. Simultaneously, Q20, Q30, GC-content, and sequence duplication levels of the clean data were calculated. All the downstream analyses were based on clean data with high quality. Bowtie2 was used to compare clean reads to the reference gene sequence, and then RNA-seq using expectation maximization (RSEM) was used to calculate the expression level of genes and transcripts [39]. The quantification of the gene expression levels was represented by fragments per kilobase of transcript per million fragments mapped reads (FPKM).
All assembled non-redundant and filtered single genes were annotated using BLAST software (http://ftp.ncbi.nlm.nih.gov/blast (accessed on 12 August 2021)) against the contents of the Nr, Nt, Pfam, SwissProt protein, KOG, GO, and KEGG databases. The phyper function in R software (V4.1.3) was utilized for enrichment analysis, calculating p-values, and subsequently correcting the false discovery rate (FDR) of p-values. Genes with |log2 FC|> 1, p < 0.05 and FDR < 0.05 were classified as DEGs.
2.6. Validation of Transcriptome Data
To validate the RNA-seq data, quantitative real-time PCR (qRT-PCR) was performed. Total RNA was isolated using the RNA prep Pure Polysaccharide Polyphenol Plant Total RNA Extraction Kit (TIANGEN, Beijing, China) according to the manufacturer’s instructions. cDNA was synthesized using the NovoScript Plus All-in-one 1st Strand cDNA Synthesis Super Mix (gDNA Purge) reverse transcription kit (Novoprotein, Jiangsu, China). Specific primers for the DEGs were designed using the Primer software (V6.0). qRT-PCR reactions were conducted with the Transstart Tip Green qPCR Super Mix kit (Trans Gene Biotechnology Co., Ltd., Beijing, China), using EF1α as the reference gene, and each reaction included three biological replicates. The relative expression level of genes was calculated using the 2−ΔΔCT method [40]. The primers of selected genes are listed in Additional Table S1.
2.7. Construction of Gene Silencing, Overexpression, and Subcellular Localization Vectors
Using cDNA as a template, we designed full-length cloning primer G1-FDPS and silencing fragment cloning primer S1-FDPS (Additional Table S2) to capture silent fragments of the RfFDPS gene from the SGN-VIGS online website. The full-length sequence and silent fragment of the RfFDPS gene were amplified.
The pTRV2 vector was digested with BamHI and EcoRI enzymes. Homology arm primers S-FDPS (Additional Table S2) were designed for PCR amplification. Using homologous recombination and the Golden Gate vector construction system, which is based on Type IIS restriction endonucleases, the pBWA(V)BS1302-RfFDPS-GFP vector was constructed.
After inserting and fusing the FDPS target gene into the vector, the construct was transformed into DH5α-competent cells. Digesting the recombinant plasmids with EcoRV endonuclease, the actual fragment size of the recombinant plasmid was verified to determine whether it matched the theoretical value, and the bacterial solution was then sent to Zhejiang Youkang Biotechnology Co., Ltd. (Zhejiang, China) for sequencing validation. Plasmids were extracted from bacterial solutions with correct sequencing results, and the pTRV2-RfFDPS, pTRV1, pTRV2, pBWA(V)BS1302-RfFDPS-GFP, and pBWA(V)BS1302-GFP were transformed into Agrobacterium tumefaciens strain GV3101-competent cells using the freeze–thaw method. Bacterial solutions containing positive clones were stored in 60% glycerol at −80 °C for future use.
2.8. Agrobacterium-Mediated Transient Infection
We prepared a bacterial solution with a ratio of 1:50 in LB liquid culture medium containing antibiotics and shook the bacterial solution at 200 rpm for 12 to 16 h in a shaking incubator at 28 °C. Subsequently, we centrifuged it at 5000 rpm to remove the supernatant and resuspended the bacterial cells in bacteria suspension buffer (consisting of MgCl2, 10 mM; acetosyringone, 0.1 mM; and 2-(N-morpholino) ethanesulfonic acid (MES) 10 mM) and adjusted the OD 600 value to 0.8 (at a pH of 5.8) to obtain sufficient Agrobacterium infection solution.
We randomly selected 40 flower buds and injected half of them with the bacterial solution containing pBWA(V)BS1302-RfFDPS-GFP, while the other half was injected with the bacterial solution containing pBWA(V)BS1302-GFP. At the same time, we mixed the resuspended bacterial solution containing pTRV2-RfFDPS or pTRV2 with pTRV1 resuspended bacterial solution in a 1:1 ratio and selected 20 separate flower buds for injection with this mixed solution. After incubating in opaque protective bags in the dark for three days, we removed the bags and cultivated them under natural conditions until flowering.
Having utilized the Wolfpsort online software (https://wolfpsort.hgc.jp/ (accessed on 4 March 2024)) for prediction, it was determined that RfFDPS was likely localized in the cytosol. To ascertain its protein expression site, a laser scanning confocal microscope was employed. The methodology for transient expression in tobacco epidermal cells referenced by Li et al. [41] was adopted, and images were captured using the Zeiss LSM710 fluorescence microscope.
2.9. Changes in Aromatic Compound Content after Transient Infection of RfFDPS
We extracted RNA from petals from the treatment group and the empty control group. Each group consisted of three biological replicates. The validation of RfFDPS expression changes was performed via the qRT-PCR method. The samples from various groups were ground in liquid nitrogen, and 200 mg of the powder was weighed and placed in a 20 μL headspace vial. One milliliter of saturated NaCl solution was added, using 2-octanol as a standard. The composition and relative content of VOCs in different samples were determined using HS-SPME-GC-MS (consistent with the metabolic profiling detection method).
2.10. Statistical Analysis
All experimental data were processed and analyzed using Excel 2019 and GraphPad Prism 9.0.0. Statistical analysis and analysis of variance (ANOVA) were performed using SPSS 27.0 (SPSS Inc., Chicago, IL, USA). Correlation analysis, bioinformatic analysis, and image drawing were conducted using Origin 2021 software (V 9.800200) and the OmicStudio tools (https://www.omicstudio.cn/tool (accessed on 10 April 2024))The heatmap was created using TBtools V1.100 software [42].
3. Results
3.1. Analysis of Terpenoids in Rhododendron Species with Different Aroma Types
To construct a comprehensive overview of metabolite changes in the terpenoid biosynthesis pathway of aromatic rhododendrons, we conducted an untargeted metabolome analysis comparing YJ and NW. Building upon previous research, we further examined the terpenoid compounds detected in three different detection methods (Additional Table S3). A total of 81 terpenoid metabolites were detected using GC–MS, 69 were detected using LC–MS (POS), and 14 were detected using LC–MS (NEG) in the petals of YJ and NW.
There are significant differences in the types and contents of terpenoid metabolites in the petals of two varieties at the same developmental stage. In YJ1 vs. NW1, GC–MS detected 29 DAMs, with 19 metabolites upregulated and 8 downregulated (Figure 2A). Similarly, LC–MS (POS) identified 29 DAMs, of which 17 were upregulated and 12 were downregulated (Supplementary Figure S1A). LC–MS (NEG) identified two downregulated terpenoid metabolites (Supplementary Figure S2A).
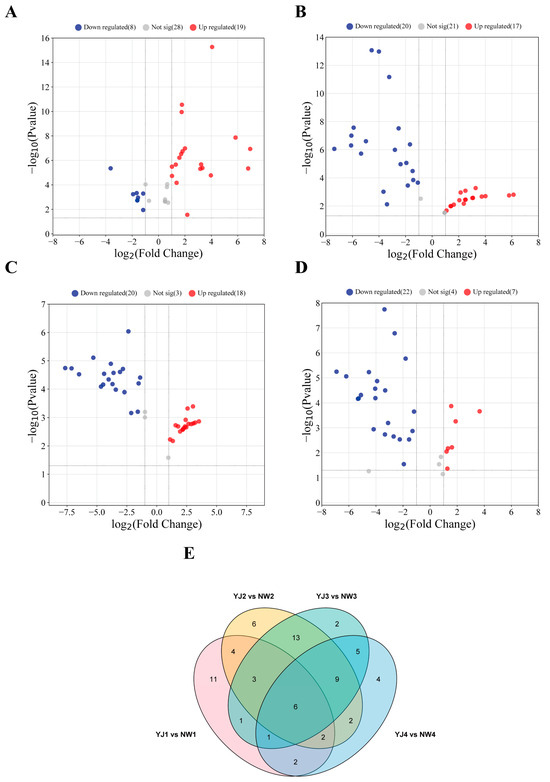
Figure 2.
Volcano plots (A) YJ1 vs. NW1; (B) YJ2 vs. NW2; (C) YJ3 vs. NW3; and (D) YJ4 vs. NW4 and Venn plot (E) of accumulated metabolites in petals of two rhododendron varieties compared at the same developmental stage detected using GC–MS.
In YJ2 vs. NW2, YJ3 vs. NW3, and YJ4 vs. NW4, GC–MS detected 37, 38, and 29 DAMs, respectively. Of these, 17, 18, and 7 were upregulated, while 20, 20, and 22 were downregulated, respectively (Figure 2B–D). Through LC–MS (POS) screening, 30, 25, and 36 DAMs were identified, with 11, 7, and 12 upregulated and 19, 18, and 24 downregulated, respectively (Supplementary Figure S1B–D). LC–MS (NEG) screened seven, six, and six DAMs, with two, three, and three upregulated, and five, three, and three downregulated, respectively (Supplementary Figure S2B–D).
Additionally, GC–MS detected 6 collective DAMs that accumulated in both rhododendron species during the same developmental period (Figure 2E), while LC–MS (POS) detected 11 collective DAMs (Supplementary Figure S1E). No collective DAMs were identified using LC–MS (NEG) screening (Supplementary Figure S2E). Notably, the largest difference in VOC detection was observed between YJ2 vs. NW2 and YJ3 vs. NW3, whereas the most significant difference in non-volatile compound detection was found between YJ2 vs. NW2 and YJ4 vs. NW4.
3.2. Analysis of Terpenoids in Petals of Fragrant YJ at Different Development Stages
Significant metabolite differences were observed in YJ at adjacent developmental stages. In YJ2 vs. YJ1, GC–MS detected 40 DAMs, with 21 upregulated and 19 downregulated (Figure 3A). Similarly, LC–MS (POS) revealed 46 DAMs, with 37 upregulated and 9 downregulated (Supplementary Figure S3A). LC–MS (NEG) revealed eight DAMs, with five upregulated and three downregulated (Supplementary Figure S4A).
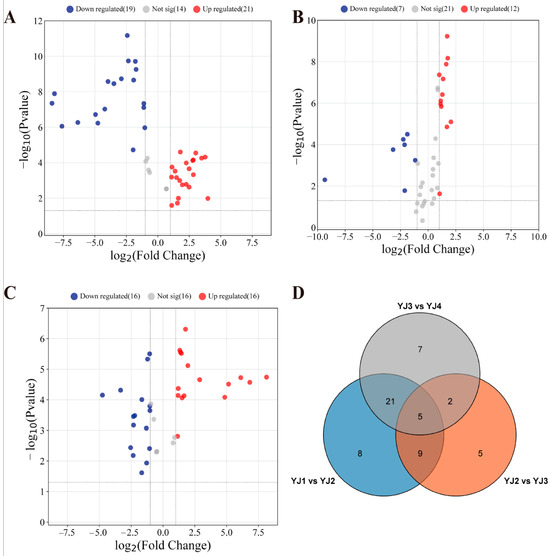
Figure 3.
Volcano plots (A) YJ2 vs. YJ1; (B) YJ3 vs. YJ2; and (C) YJ4 vs. YJ3 and a Venn plot (D) showing differentially accumulated metabolites in YJ petals, specifically at different developmental stages, detected using GC–MS.
Likewise, in YJ3 vs. YJ2 and YJ4 vs. YJ3, GC–MS detected 19 and 32 DAMs, respectively. Among these, 12 and 16 metabolites showed upregulation, while 7 and 16 metabolites were downregulated in abundance, respectively (Figure 3B,C). DAMs screened using LC–MS (POS) numbered 8 and 25, with 5 and 4 metabolites upregulated and 3 and 21 metabolites downregulated, respectively (Supplementary Figure S3B,C). LC–MS in negative mode revealed a total of one DAM upregulated in YJ3 and four DAMs downregulated in YJ4 (Supplementary Figure S4B,C).
Furthermore, using GC–MS and LC–MS (POS), we consistently detected five and four distinct metabolite differences, respectively, at three adjacent growth and development stages (Figure 3D and Supplementary Figure S3D). However, no common DAMs were detected through LC–MS (NEG) (Supplementary Figure S4D). Notably, based on the accumulation pattern of non-volatile compounds, we speculate that a large amount of terpene precursors was synthesized during the flower bud stage, and YJ2 vs. YJ1 revealed the highest number of DAMs. We further hypothesize that the period from the closed flower bud stage to the first bloom with the petals partially open represents a crucial stage for the synthesis of volatile terpenoids in YJ.
3.3. Differential Accumulation of Terpenoids
Using GC–MS, LC–MS (POS), and LC–MS (NEG), differential metabolites in the metabolic pathway were identified and screened. In YJ, VOCs accumulate from the flower bud stage, and their content progressively increases, peaking during the blooming period, followed by a gradual decline. The detected substances are primarily sesquiterpenes and monoterpenes. After screening, a visual analysis using bar charts revealed a significant accumulation of terpenoid VOCs in YJ, especially in YJ2 and YJ3, including terpineol, cis-muurola-4(15),5-diene, (-)-myrtenol, pinene, bicyclo[3.1.0]hexane, 4-methylene-1-(1-methylethyl)-, myrtenyl acetate, trans-linalool oxide (furanoid), 2,3-dehydro-1,8-cineole, and linalool. Among these, the contents of (-)-myrtenol, linalool, pinene, myrtenyl acetate, and terpineol are significantly higher than that of other terpenoids, indicating that they are key floral aroma components in YJ (Figure 4 and the chromatogram is shown in Supplementary Figure S5).
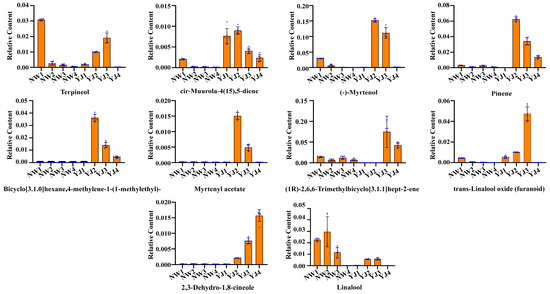
Figure 4.
Bar charts showing differential accumulation of terpenoid metabolites in petals of two rhododendron varieties at different developmental stages under GC–MS detection mode.
In LC–MS (POS), a multitude of compounds were found to accumulate in NW, particularly during the NW1 and NW4 stages, including substances such as p-mentha-1,3,8-triene, ganodermic acid TQ, maslinic acid, piperitenone, betulinic acid, and 3-trans-p-coumaroylrotundic acid. However, the expression levels of ganodermic acid TQ, juvocimene 2, maslinic acid, squamolone, betulin, piperitenone, and betulinic acid are low in NW2 and NW3. In YJ, high expression levels were observed for p-mentha-1,3,8-triene, juvocimene 2, squamolone, and betulinic acid, while ent-16a-hydroxy-17-acetoxy-19-kauranal was specifically expressed in YJ4. Conversely, betulin exhibited specifically low expression levels in YJ2 and YJ3 (Supplementary Figure S6). During the flower bud stage, YJ and NW accumulate a high count of non-volatile substances.
The LC–MS (NEG) and LC–MS (POS) patterns were consistent, indicating that a substantial quantity of metabolites accumulated predominantly in NW. For instance, 9,10-epoxyoctadecenoic acid, 6beta-hydroxyasiatic acid, ursolic acid, oleanolic acid, resveratrol, and hypogeic acid accumulated significantly in either NW1 or NW4 samples. Additionally, 10E,12Z-octadecadienoic acid and eicosapentaenoic acid accumulated in YJ2, YJ3, and YJ4 (Supplementary Figure S7). Among these metabolites, ursolic acid was particularly abundant in this detection mode. The accumulation levels of this substance are similar in the bud stages of YJ and NW flowers, but the content of ursolic acid in the YJ flower bud stage rapidly decreases.
3.4. Transcriptome Data Analysis of Different Aroma Types of Rhododendrons
In order to uncover the key genes regulating the synthesis of chemical substances during the development of rhododendrons, we employed de novo RNA-seq to compare and analyze the DEGs between YJ and NW at various stages. After a thorough evaluation, the transcriptome data revealed relatively complete sequence assembly and high-quality data acquisition [4]. Consequently, the sequencing results are deemed suitable for further analyses.
Through a KEGG enrichment analysis of metabolic pathways related to the biosynthesis of terpenoids in different aroma types of rhododendrons, we have identified the key genes that affect the differences in the aroma. The analysis reveals that genes related to terpenoid synthesis are significantly enriched in pathways such as terpenoid backbone biosynthesis (ko00900) and sesquiterpenoid and triterpenoid biosynthesis (ko00909). It is noteworthy that there is a significant enrichment of genes in the comparisons of YJA vs. NWA and YJD vs. NWD, with 213 and 130 genes enriched in ko00900 and ko00909, respectively. In the YJD vs. NWD comparison, 202 and 112 genes are enriched, whereas the number of enriched genes decreases in the YJB vs. NWB and YJC vs. NWC comparison. Furthermore, genes related to carotenoid biosynthesis (ko00906) have been significantly enriched (Figure 5). The number of differentially expressed genes related to terpenoid biosynthesis is the highest during the blooming and decay stages.
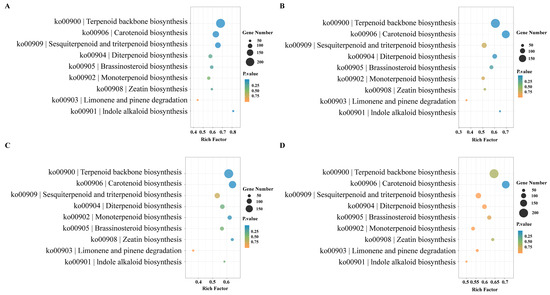
Figure 5.
KEGG enrichment pathways of terpenoid-related genes in comparisons of two rhododendron species at the same corresponding developmental stages (A) YJA vs. NWA; (B) YJB vs. NWB; (C) YJC vs. NWC; (D) YJD vs. NWD.
Perform differential gene expression analysis on the KEGG pathway related to terpenoid synthesis. In the ko00900 pathway, we observed 112, 97, 96, and 103 upregulated genes and 91, 85, 89, and 90 downregulated genes, respectively, across the four growth and development stages. Similarly, in the ko00909 pathways, we identified 55, 38, 38, and 21 upregulated genes and 73, 64, 67, and 55 downregulated genes at these four stages, respectively. Notably, the ko00906 pathway also exhibited differential expression, with 75, 90, 75, and 84 upregulated genes, and 69, 73, 74, and 78 downregulated genes observed during the four developmental stages, respectively (Figure 6).
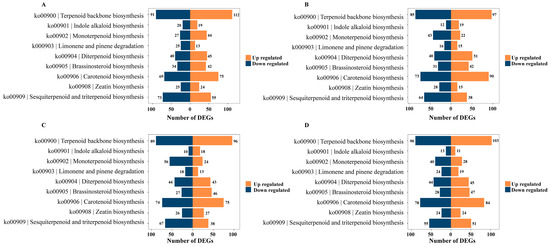
Figure 6.
KEGG enrichment pathway of terpenoid-related genes in two rhododendron species compared at the corresponding developmental stages (A) YJA vs. NWA; (B) YJB vs. NWB; (C) YJC vs. NWC; (D) YJD vs. NWD.
3.5. Transcriptome Data Analysis of YJ with Fragrance at Different Developmental Stages
We conducted a KEGG enrichment analysis on terpenoid-related genes in YJ across various growth and development stages. The results indicate that during the growth and development of YJ, the first three most significantly enriched pathways are primarily related to ko00900, ko00906, and ko00909. Specifically, in the comparison of YJ2 vs. YJ1, 85 genes are specifically enriched in ko00900, while 76 genes are enriched in ko00909. Furthermore, the diterpene biosynthesis pathway (ko00904) was significantly enriched in the comparison of YJ3 vs. YJ2 (Supplementary Figure S8). Similarly, in the comparison of YJ4 vs. YJ3, there is also a large number of genes that are significantly enriched in ko00900 and ko00909.
Concurrently, we conducted an analysis of the expression pattern of terpenoid-related genes throughout the growth and development of the YJ. In the ko00900 pathway, we identified 43, 2, and 29 upregulated genes, across the four growth and development stages, while 39, 7, and 33 genes were downregulated, respectively. Similarly, in the ko00909 pathway, we observed 51, 8, and 22 upregulated genes and 25, 6, and 24 downregulated genes, respectively. The ko00906 pathway also exhibited differential expression, with 59, 9, and 28 upregulated genes, as well as 46, 8, and 43 downregulated genes, observed during the four developmental stages, respectively (Supplementary Figure S9). Our analysis showed that the transition from flower bud to first bloom in YJ marked the stage with the greatest difference in terpenoid-related gene expression. Furthermore, the changes in metabolites were generally delayed compared to the changes in gene expression, which is consistent with the significant accumulation of terpenoid volatile metabolites observed in YJ2 and YJ3.
3.6. Screening DEGs in Terpenoid Synthesis Pathway
Based on KEGG enrichment and differential expression gene identification analysis, we observed a significant enrichment of genes related to terpenoid biosynthesis during the bud and decay stages, leading us to screen for DEGs for analysis (Figure 7). We speculate that the MVA pathway in the cytoplasm is the primary pathway for the synthesis of YJ terpenoid floral fragrances, specifically, a large number of enzyme genes highly expressed in YJ, including acetyl-CoA C-acetyltransferase (AACT), hydroxymethylglutaryl-CoA synthase (HMGS), hydroxymethylglutaryl-CoA reductase (HMGR), phosphomevalonate kinase (PMK), mevalonate decarboxylase (MVD), Isopentenyl diphosphate delta-isomerase (IDI), geranyl diphosphate synthase (GDPS), geranylgeranyl diphosphate synthase (GGPS), farnesyl diphosphate synthase (FDPS), and TPS.
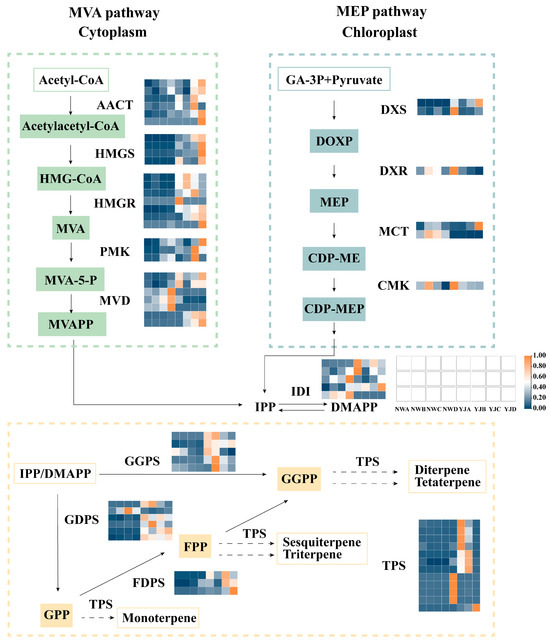
Figure 7.
Gene expression profiles of MEP and MVA synthesis pathways at different developmental stages (A, B, C, D) of two rhododendron varieties. MEP pathway, 2-methyl-D-erythritol-4-phosphate pathway; MVA pathway, mevalonate pathway; acetyl-CoA, acetyl coenzyme A; HMG-CoA, 3-hydroxy-3-methyl glutaryl coenzyme A; MVA, mevalonic acid; MVAPP, mevalonate-5-phosphate; GA-3P, glyceraldehyde-3-phosphate; DOXP, 1-deoxy-D-xylulose-5-phosphate; CDP-ME, 4-diphosphocytidyl-2-C-methyl-D-erythritol; CDP-MEP, 4-phospho-2-C-methyl-D-erythritol cytidine diphosphate; IPP, isopentenyl diphosphate; DMAPP, dimethylallyl pyrophosphate; GPP, geranyl diphosphate; FPP, farnesyl pyrophosphate; GGPP, geranylgeranyl pyrophosphate; AACT, acetyl-CoA C-acetyltransferase; HMGS, hydroxymethylglutaryl-CoA synthase; HMGR, hydroxymethylglutaryl-CoA reductase; PMK, phosphomevalonate kinase; MVD, mevalonate decarboxylase; DXS, 1-deoxy-D-xylulose-5-phosphate synthase; DXR, 1-deoxy-D-xylulose 5-phosphate reductoisomerase; MCT, 2-C-methyl-D-erythritol 4-phosphate cytidylyltransferase; CMK, 4-diphosphocytidyl-2-C-methyl-D-erythritol kinase; IDI, isopentenyl diphosphate delta-isomerase; GDPS, geranyl diphosphate synthase; GGPS, geranylgeranyl diphosphate synthase; FDPS, farnesyl diphosphate synthase; TPS, terpene synthase.
However, the number of genes annotated on the MEP pathway is relatively small, including 1-deoxy-D-xylulose-5-phosphate synthase (DXS), 1-deoxy-D-xylulose 5-phosphate reductoisomerase (DXR), 2-C-methyl-D-erythritol 4-phosphate cytidylyltransferase (MCT), and 4-diphosphocytidyl-2-C-methyl-D-erythritol kinase (CMK).
Further analysis was conducted on candidate genes involved in the MVA pathway, visualizing the expression of these genes in petals across various developmental stages through a heatmap (Figure 8). The visualization reveals that 39 of these genes exhibit higher expression in YJ compared to other conditions. The results of the transcriptome analysis are consistent with the metabolome analysis, indicating a higher abundance of terpene synthesis genes in YJ than in NW. Candidate genes exhibit diverse expression patterns at different growth and development stages. Specifically, TPS is highly expressed in YJ and lowly expressed during the decay stage. Conversely, FDPS, HMGS, MVD, and AACT are predominantly expressed during the decay stage. Meanwhile, a significant number of genes, including IDI, PMK, FDPS, HMGS, MVD, and AACT, show lower expression levels in the bud and first bloom stages. In contrast, the four genes GGPS and HMGR are specifically expressed at higher levels in the first bloom stage.
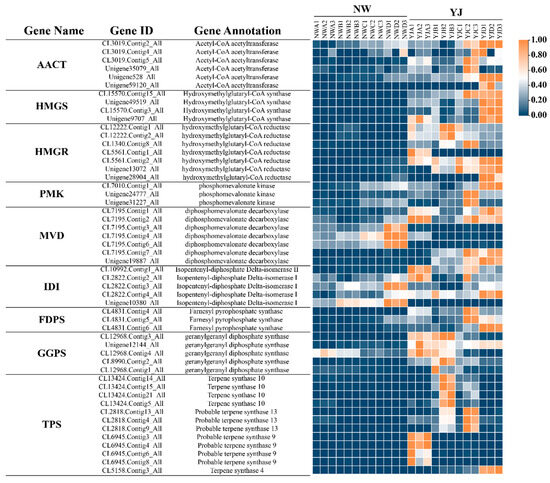
Figure 8.
Relative expression changes in candidate genes in rhododendron varieties (YJ and NW) across different developmental stages (A, B, C, D).
3.7. Joint Analysis of Transcriptome and Metabolome
To elucidate the relationship between related genes and metabolites during flowering, we conducted an analysis of terpene metabolites and nine selected genes involved in the terpene synthesis pathway. The large number of metabolites detected using GC–MS is consistent with the trend of differential gene regulation. Among them, pinene, bicyclo[3.1.0]hexane, 4-methylene-1-(1-methylethyl)-, 2,3-dehydro-1,8-cineole, trans-linalool oxide (furanoid), cis-muurola-4(15), 5-diene, myrtenyl acetate, terpineol, and (-)-myrtenol exhibited consistent expression patterns with those of TPS, FDPS, GGPS, HMGR, and AACT.
Among the groups, in YJ1 vs. NW1, trans-linalool oxide (furanoid) and cis-muurola-4 (15), 5-diene exhibited positive correlations with TPS, FDPS, and AACT (Figure 9A). In YJ2 vs. NW2, cis-muurola-4(15),5-diene showed a significant positive correlation with TPS and FDPS, while myrtenyl acetate was positively correlated with GGPS (Figure 9B). In YJ3 vs. NW3, (1R)-2,6,6-trimethylbicyclo[3.1.1]hept-2-ene was significantly positively correlated with TPS and AACT, while bicyclo[3.1.0]hexane, 4-methylene-1-(1-methylethyl)- was significantly positively correlated with HMGR and negatively correlated with HMGS. In contrast, linalool is negatively correlated with a multitude of genes. Additionally, there was a significant positive correlation between myrtenyl acetate and GGPS (Figure 9C). Finally, in YJ4 vs. NW4, a significant positive correlation was observed between numerous metabolites and HMGS (Figure 9D).
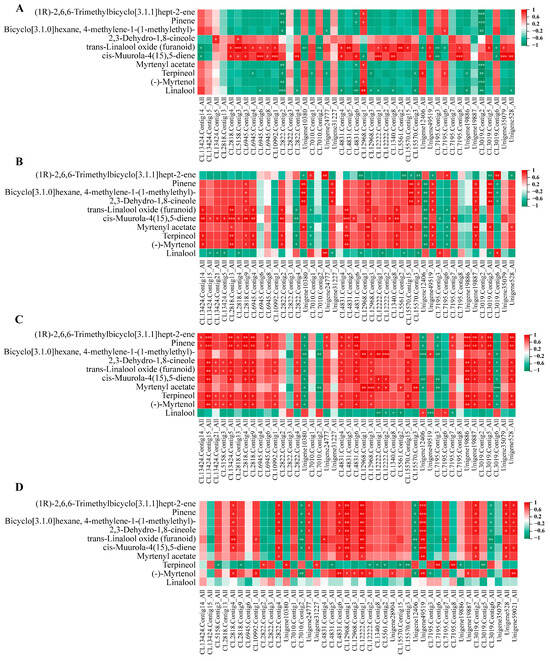
Figure 9.
Correlation analysis between candidate genes of terpenoid pathway and terpenoid metabolites under GC–MS detection mode. (A) YJA vs. NWA; (B) YJB vs. NWB; (C) YJC vs. NWC; (D) YJD vs. NWD. “*” indicates p < 0.05, “**” indicates p < 0.01, “***” indicates p < 0.001.
Among these, in the comparison between YJ2 and YJ1, the Unigene528_All in the AACT enzyme gene specifically demonstrated a positive correlation with a substantial number of volatile terpenes (Supplementary Figure S10A). In the YJ3 vs. YJ2, bicyclo[3.1.0]hexane, 4-methylene-1-(1-methylethyl)- was negatively correlated with TPS specificity, whereas myrtenyl acetate was negatively correlated with FDPS specificity (Supplementary Figure S10B). Lastly, in YJ4 vs. YJ3, all compounds except for 2,3-dehydro-1,8-cineole were positively correlated with TPS and HMGR and negatively correlated with HMGS specificity (Supplementary Figure S10C).
Through the joint analysis of the main volatile terpenoid metabolites and candidate genes, we identified significant positive correlations between key substances such as myrtenyl acetate, pinene, (-)-myrtenol, and terpineol, and FDPS during the flowering stage. A KEGG enrichment analysis revealed that ko00909 is the pivotal metabolic pathway that significantly influences the expression of different aroma types in rhododendrons. Ultimately, we determined that FDPS, the key enzyme gene for ko00909, is the key gene for regulating YJ volatile terpenoid aromatic compounds. The content of precursor non-volatile metabolites formed by similar metabolites also exhibited significant correlations, indicating their involvement in regulating YJ aroma. However, further experimental verification is required to elucidate how these key genes participate in the regulation of YJ aroma. In this study, the function of RfFDPS was validated through transient overexpression and gene silencing experiments.
3.8. Transcriptome and Metabolome Data Validation
We employed qRT-PCR to verify the expression of key genes involved in floral synthesis, including TPS, HMGS, HMGR, MVD, AACT, IDI, GGPS, PMK, and FDPS. The expression levels of these candidate genes were examined in petals during the four growth and development stages of YJ and NW. The relative expression values obtained through qRT-PCR were highly consistent with the trends observed in the RNA-seq data, affirming the accuracy of the transcriptome data for further research (Figure 10).
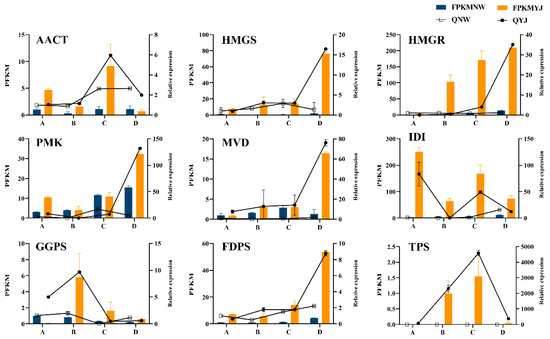
Figure 10.
Bar chart displaying the results of qRT-PCR validation for candidate genes. The lines in the chart represent the relative expression levels obtained through qRT-PCR validation results for YJ and NW samples. The transcriptome data for corresponding genes in YJ are depicted in orange, while those for NW are shown in blue. The data presented here represent the average of three replicates, with the error bars indicating the standard error (SE) (n = 3).
3.9. Changes in Relative Content of Major Volatile Compounds following Transient Overexpression and Gene Silencing of RfFDPS
In the RfFDPS RNAi line, the expression level of RfFDPS was 0.38 times lower than that of the pTRV2 control line. Except for the increased expression levels of GGPS and TPS, the expression levels of all other screened DEGs were decreased, ranging from 0.35 to 0.92 times that of the control line (Figure 11A). Additionally, an analysis of volatile compounds from the RfFDPS RNAi line revealed that the main volatile components remained largely unchanged, with a rising trend in total monoterpene content, which was 1.80 times higher than that of the control line (Figure 11C). Specifically, the contents of monoterpenes such as linalool, 1,5,7-octatrien-3-ol, 3,7-dimethyl-, and 5,9-undecadien-2-one, 6,10-dimethyl-, (E)- increased, while the content of terpinen-4-ol decreased. Specifically, the linalool content was 1.38 times that of the control line, and the terpinen-4-ol content was 0.14 times that of the control line (Figure 11D). However, the total content of sesquiterpene volatiles was 0.2 times the original (Figure 11F).
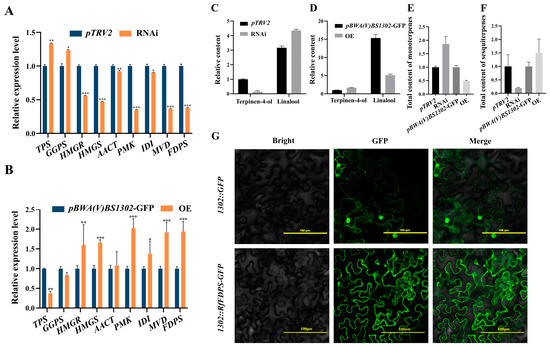
Figure 11.
Functional verification of the RfFDPS gene. (A) Relative expression of DEGs under transient gene silencing, (B) relative expression of DEGs under transient overexpression, (C) relative content of linalool and terpinen-4-ol following transient gene silencing, (D) relative content of linalool and terpinen-4-ol following transient overexpression, (E) changes in total sesquiterpene content after transient infection, (F) changes in total monoterpene content after transient infection, and (G) subcellular localization of RfFDPS. pBWA(V)BS1302-GFP: empty overexpression plasmid control group; pBWA(V)BS1302-RfFDPS-GFP: recombinant plasmid treatment group in which the RfFDPS target gene was inserted; pTRV2-RfFDPS: recombinant plasmid treatment group with the RfFDPS silencing fragment inserted; WT: wild-type control group; 1302::RfFDPS-GFP is a fusion protein comprising RfFDPS and GFP that was successfully expressed in tobacco cells; 1302::GFP represents GFP that was expressed in tobacco cells; the bright image depicts the tobacco cells; the GFP shows the fluorescence fields; and merge represents the overlap image of bright and fluorescence fields. “*” indicates p < 0.05, “**” indicates p < 0.01, “***” indicates p < 0.001.
In the RfFDPS OE line, the expression level of RfFDPS was 1.94 times higher than the pBWA(V)BS1302-GFP control line. Except for the decreased expression levels of GGPS and TPS, the expression levels of all other screened DEGs increased, ranging from 1.03 to 2.08 times that of the control line (Figure 11B). Furthermore, an analysis of the RfFDPS OE line’s volatile compounds indicated that the main volatile components remained largely unchanged, but the total monoterpene content showed a downward trend at 0.49 times that of the control line (Figure 11C). The contents of monoterpenes such as linalool, 1,5,7-octatrien-3-ol, 3,7-dimethyl-, and 5,9-undecadien-2-one, 6,10-dimethyl-, (E)- decreased, while the content of terpinen-4-ol increased. Among them, the linalool content was 0.33 times that of the control line, and the terpinen-4-ol content was 1.64 times that of the control line (Figure 11D). However, the total content of sesquiterpene volatiles increased at 1.51 times the original level (Figure 11G and data are listed in Additional Table S4).
Using Wolfpsort online software (Additional Table S5), RfFDPS was predicted to be present in the cytoplasm. To confirm its protein localization, a strong fluorescence signal was observed in the cytoplasm of the cell via laser confocal microscopy (Figure 11G), confirming that the RfFDPS protein is located in the cytoplasm.
4. Discussion
Rhododendron, a significant ornamental flower, primarily thrives in sparsely vegetated shrublands or pine forests at altitudes ranging from 500 to 1200 m. Floral aroma is a paramount characteristic of ornamental plants, as it not only enhances the economic and aesthetic value of the plants but also serves as a crucial mechanism for plants to combat various biological and abiotic stressors. In this study, we employed metabolomics and transcriptomics to scrutinize the metabolite and transcriptional alterations throughout the development of YJ, with the goal of unraveling the molecular mechanisms underlying the synthesis of aromatic terpenes in YJ.
4.1. Metabolomic Data Analysis of YJ, an Aromatic Rhododendron
With the advancement of molecular biotechnology in plant aroma research, the intricate network of flower aroma biosynthesis is gradually coming into focus. Terpenes, as the largest class of compounds in flower aroma [43], are primarily synthesized via the MEP and MVA pathways. In this study, the contribution of terpenes to flower aroma was assessed through non-targeted metabolomics. Flower fragrance is often a mixture of many compounds, and terpenoids are often the main components that affect flower fragrance. Seven types of metabolites were identified using GC–MS, LC–MS (POS), and LC–MS (NEG), with the majority being terpenes and benzene/phenylpropyl compounds. Other researchers have also obtained similar test results [44,45,46,47]. Both varieties of rhododendrons exhibited a significant number of differential metabolites under the three detection modes, indicating that the transition from flower bud to first bloom is critical for the synthesis of volatile terpenoid metabolites and their precursors. However, the NW variety continued to synthesize non-volatile terpenoid compounds, causing a buildup of these metabolites during decay and thereby influencing aroma differences
Ten volatile substances accumulate significantly in YJ, nine of which accumulate significantly in YJ2 and YJ3, including terpineol, cis-muurola-4(15),5-diene, (-)-myrtenol, pinene, bicyclo[3.1.0]hexane, 4-methylene-1-(1-methylethyl)-, myrtenyl acetate, trans-linalool oxide (furanoid), and linalool. The release and accumulation of these floral aroma substances exhibit an overall trend of initially increasing and then decreasing, which aligns with the fragrance release pattern during YJ flowering. Similarly, in the “fragrant snow palace powder” variety of plum blossoms, substantial quantities of cinnamyl acetate, cinnamyl alcohol, and benzyl alcohol are released from the petals during blooming, with the relative content of aroma substances gradually increasing throughout flower development, peaking during the blooming period [48]. During the blooming period of jasmine flowers, there is also a significant accumulation of phenylpropanoid and terpenoid compounds [49].
4.2. Key Genes for Terpeneoid Synthesis in YJ
In this study, RNA-seq technology was employed for transcriptome sequencing of YJ and NW. To identify the DEGs that contribute to floral fragrance, we conducted a KEGG pathway analysis on terpenoid metabolic pathways. Our results revealed that during the growth and development of both rhododendrons, the most enriched pathways were primarily related to ko00909. Notably, NW and YJ exhibited a higher number of DEGs during the flower bud and decay stages. It can be inferred that a large number of genes regulating the synthesis of volatile terpenoids and their precursors are expressed during the flower bud stage, and subsequently contribute to the synthesis of terpenoid VOCs in rhododendron flowers in later developmental stages. The difference in gene expression between YJ and NW during the bud stage is minimal, and this gene expression pattern corresponds to the accumulation and release pattern of metabolites.
The biosynthesis of floral fragrance is complex and dynamically changing, often regulated by multiple genes. Subsequently, further analysis was conducted on DEGs to identify the following nine candidate enzyme genes involved in terpenoid biosynthesis pathways, specifically in the MVA pathway: TPS, GGPS, FDPS, AACT, IDI, HMGS, HMGR, MVD, and PMK. The expression levels of these genes are significantly higher in YJ compared to NW, which is consistent with the higher accumulation of terpenoids in YJ. Among these, the RfFDPS gene in YJ is considered a key regulator of terpenoid synthesis in this variety.
TPS, as a key enzyme gene in terpene synthesis, is responsible for producing a range of secondary metabolites [43,50]. In our study, TPS was highly expressed in YJ and significantly positively correlated with the expression levels of multiple types of terpene compounds. Research has demonstrated that introducing the linalool synthase gene isolated from Clarkia pulchella Pursh into tomatoes substantially enhances the synthesis and release of linalool and light-based linalool in mature fruits [51]. In Zephyranthes candida, a biochemical characterization of ZcTPS02 was conducted, and it was found that ZcTPS02 can catalyze the synthesis of various products from GPP, playing a vital role in the biosynthesis of β-ocimene. This finding has also been validated in studies on Litsea cubeba, Medicago truncatula, and lilies [52,53,54,55,56,57].
As the main allyl transferase, GGPS is significantly upregulated during the decay period and positively correlated with the expression levels of various terpene compounds. Schmidt et al. [58] found that the synthase enzymes responsible for the conversion of geranyl diphosphate and geranylgeranyl diphosphate are involved in the biosynthesis of monoterpenes and diterpenes in fir oil resin. In other research, the overexpression of lbGGPS in sweet potatoes also upregulates the expression of MEP pathway genes [59]. Similarly, the study also underscores the significant role of the AACT gene in triterpene biosynthesis. Ziang et al. [60] also postulated that AACT is the main regulatory factor for the synthesis of terpenes in peonies
IDI, HMGS, and HMGR exhibited high expression levels in YJC and YJD, positively correlating with the expression of multiple terpenes. HMGS and HMGR play a crucial role in regulating the biosynthesis of terpenoids, thereby enhancing the production of secondary metabolites such as triterpenoid glycosides [61,62]. The heterologous expression of the IDI gene in Streptococcus pneumoniae in polycystis can regulate the balance ratio of DMAPP and IPP, improve the production rate and yield of isoprene, and thereby regulate the production of downstream floral fragrance substances. In 1993, Ladevèze et al. [63] proposed that the increase in ergosterol levels in brewing yeast may be specifically linked to enhanced IDI activity. Studies have shown that IDI is also a key enzyme in the biosynthesis pathway of diterpenoid alkaloids [64].
On the contrary, MVD is downregulated in YJB and YJC and negatively correlated with various terpenes, indicating its role as the final rate-limiting enzyme for the production of terpene isopentenyl pyrophosphate precursors in the MVA pathway [65]. PMK is highly expressed in YJA and YJB, but significantly negatively correlated with terpene VOC expression, indicating its role in regulating terpene biosynthesis. In Sanghuangporus baumii SbPMK, an important rate-limiting enzyme in the triterpenoid biosynthesis pathway was cloned and overexpressed. Consequently, this led to a significant increase in the content of pharmacologically active triterpenoids in Sanghuangporus baumii [66]. Based on the transcriptome database of the camphor tree, Redding-Johanson et al. [67] and Woo et al. [68] found that PMK plays an important role in the biosynthesis of terpenoids in camphor trees, and previous studies have shown that the overexpression of PMK leads to a threefold increase in terpenoid production.
FDPS is a key rate-limiting enzyme in the mevalonate pathway, catalyzing the synthesis of isoprenoid products, including farnesyl pyrophosphate and geranyl geranyl pyrophosphate. The farnesyl pyrophosphate produced by FDPS catalyzes the condensation reaction between dimethylallyl diphosphate and two units of isopentene pyrophosphate, serving as a precursor for the synthesis of many terpenoids. In order to understand and elucidate the role of RfFDPS in terpenoid biosynthesis in YJ, we conducted functional validation of RfFDPS through transient overexpression and transient gene silencing experiments. The discovery that it has a negative correlation with the content of monoterpenes and a positive correlation with the content of sesquiterpenes indicates its importance in the biosynthesis of terpenes. The high activity level of FDPS in wild ginseng is believed to be related to the biosynthesis pathways of sesquiterpenes and triterpenes, which is consistent with the conclusion of this study [69]. Liu et al. [70] cloned PgFPS from Platycodon grandiflorus, and after overexpression in tobacco, the content of squalene significantly increased, verifying its function in terpenoid biosynthesis. Through the exogenous addition of inducers to Inonotus obliquus to regulate FPS expression levels, significant effects were also observed on the accumulation of triterpenoids [71]. In addition, the overexpression of FDPS is beneficial for increasing triterpenoid biosynthesis activity and yield in other plant species. Qian et al. [72] used the genetic algorithm for recombination detection (GARD) method for recombination detection and concluded that the diversity of FDPS enhances enzyme activity in the triterpenoid biosynthesis pathway. In the high-yield 001 system of Artemisia annua, the overexpression of FDPS resulted in a significant increase in artemisinin production compared to wild plants [73]. Wang et al. [48] obtained PcFPPS from patchouli and achieved heterologous overexpression in tobacco plants. They found that FPP enzyme activity was significantly upregulated, and more terpenoid metabolites were detected, including stigmasterol, phytosterol, and neophytodiene, which are consistent with the results of this study. Through functional verification of RfFDPS, it was found that it positively regulates the synthesis of YJ terpenoid floral fragrance compounds and is a key gene in the synthesis of volatile terpenoids. However, in this study, there are also some monoterpenes, such as terpinen-4-ol, that positively correlate with the expression of RfFDPS. It is speculated that this is due to the differential competition among various terpene synthases for GPP.
Monoterpenes are mostly synthesized in plastids and are the main metabolic products of the MVA pathway. On the other hand, sesquiterpenes and triterpenes are often synthesized more in the cytosol, primarily relying on the MEP pathway. Through genetic silencing and overexpression experiments in this study, it was discovered that interventions in the MVA pathway’s metabolism also impact the biosynthesis of monoterpenes, indicating that the intermediates in these pathways can cross the plasma membrane and be utilized by each other [74,75,76,77].
Future research should conduct a more in-depth analysis of genes and metabolites to elucidate whether FDPS family genes have similar effects on terpenoid biosynthesis and further elucidate the regulatory mechanisms of flower metabolite biosynthesis and accumulation.
5. Conclusions
In this study, a combined analysis of metabolomics and transcriptomics identified (-)-myrtenol, linalool, pinene, myrtenyl acetate, and terpineol as key floral aroma compounds in YJ and RfFDPS as a key gene regulating YJ terpenoid aromatic compounds. The function of RfFDPS was validated through transient overexpression and transient gene silencing experiments, confirming that RfFDPS is a negative regulatory gene for monoterpenes and a positive regulatory gene for sesquiterpenes in YJ. Through subcellular localization, it was found to be located in the cytoplasm, which is consistent with previous predictions. This joint analysis deepens our understanding of the metabolic pathway mechanisms in YJ. On the other hand, there is partial material exchange and mutual influence between MVA and MEP pathways, although the current research results have certain limitations, they provide valuable reference data for future research on the physiological processes and molecular mechanisms of terpenoid compound synthesis.
Supplementary Materials
The following are available online at https://www.mdpi.com/article/10.3390/horticulturae10090959/s1: Figure S1: Volcano plot (A) YJ1 vs. NW1; (B) YJ2 vs. NW2; (C) YJ3 vs. NW3; and (D) YJ4 vs. NW4 and Venn plot (E) of accumulated metabolites in petals of two rhododendron varieties compared at the same developmental stage detected using LC–MS (POS); Figure S2: Volcano plot (A) YJ1 vs. NW1; (B) YJ2 vs. NW2; (C) YJ3 vs. NW3; and (D) YJ4 vs. NW4 and Venn plot (E) of accumulated metabolites in petals of two rhododendron varieties compared at the same developmental stage detected using LC–MS (NEG); Figure S3: Volcano plots (A) YJ2 vs. YJ1; (B) YJ3 vs. YJ2; and (C) YJ4 vs. YJ3 and Venn plot (D) of differentially accumulated metabolites in petals of YJ at the different developmental stage detected using LC–MS (POS); Figure S4: Volcano plots (A) YJ2 vs. YJ1; (B) YJ3 vs. YJ2; and (C) YJ4 vs. YJ3 and Venn plot (D) of differentially accumulated metabolites in petals of YJ at the different developmental stage detected using LC–MS (NEG); Figure S5: Chromatogram of YJ blooming petals in GC–MS detection mode; Figure S6: Bar charts of terpene differential accumulation metabolites in petals of two rhododendron varieties at different developmental stages under LC–MS (POS) detection mode; Figure S7: Bar charts of terpene differential accumulation metabolites in petals of two rhododendron varieties at different developmental stages under LC–MS (NEG) detection mode; Figure S8: KEGG enrichment pathway of terpenoid-related genes in YJ at the different developmental stages (A) YJB vs. YJA; (B) YJC vs. YJB; and (C) YJD vs. YJC; Figure S9: Upregulation and downregulation analysis of two terpenoid-related genes in YJ at the different developmental stages through KEGG enrichment pathway (A) YJB vs. YJA; (B) YJC vs. YJB; and (C) YJD vs. YJC; Figure S10: Correlation analysis between candidate genes of terpenoid pathway and terpenoid metabolites under GC-TOM-MS detection mode (A) YJB vs. YJA; (B) YJC vs. YJB; and (C) YJD vs. YJC; Table S1: qRT-PCR primers; Table S2: Cloning and validation of primers; Table S3: Expression levels of terpenoids under three detection modes; Table S4: Wolfpsort online website prediction results; Table S5: Changes in volatile substance content after instantaneous infection.
Author Contributions
Y.Q., Y.W. and X.X. conceived and designed the experiments. D.Z. and K.Y. performed the RNA isolation experiment. Y.Q. analyzed the data and wrote the manuscript. G.Y. helped to analyze the data and draft the manuscript. D.L. participated in the design of this study. Z.C. and Z.Y. coordinated this study and revised the manuscript. All authors have read and agreed to the published version of the manuscript.
Funding
This work was supported by 2025 Major Science and Technology Innovation Special Project of Ningbo (2021Z005), the Key Research and Development Program of Zhejiang Province (2021C02053), and (2023 National Treasury) First Class Discipline-Bioengineering-Talent Cultivation—Student Innovation Project in 2023 (SZ1000014005012). Thank you to all members of our laboratory for their useful discussions and help in the whole project.
Institutional Review Board Statement
Not applicable.
Informed Consent Statement
Not applicable.
Data Availability Statement
The contributions proposed in this study are public. These data can be found at the following location: the National Center for Biotechnology Information (NCBI) biological project database with the registration number PRJNA885230 (https://www.ncbi.nlm.nih.gov/sra/PRJNA885230 (accessed on 25 September 2023)).
Conflicts of Interest
The authors declare that they have no conflicts of interest.
References
- Chang, Y.H.; Yao, G.; Neilsen, J.; Liu, D.T.; Zhang, L.; Ma, Y.P. Rhododendron kuomeianum (Ericaceae), a new species from northeastern Yunnan (China), based on morphological and genomic data. Plant Divers. 2021, 43, 292–298. [Google Scholar] [CrossRef] [PubMed]
- Shrestha, A.; Hakeem Said, I.; Grimbs, A.; Thielen, N.; Lansing, L.; Schepker, H.; Kuhnert, N. Determination of hydroxycinnamic acids present in Rhododendron species. Phytochemistry 2017, 144, 216–225. [Google Scholar] [CrossRef] [PubMed]
- Mo, L.; Chen, J.; Lou, X.; Xu, Q.; Dong, R.; Tong, Z.; Huang, H.; Lin, E. Colchicine-Induced Polyploidy in Rhododendron fortunei Lindl. Plants 2020, 9, 424. [Google Scholar] [CrossRef] [PubMed]
- Yang, G.; Qin, Y.; Jia, Y.; Xie, X.; Li, D.; Jiang, B.; Wang, Q.; Feng, S.; Wu, Y. Transcriptomic and metabolomic data reveal key genes that are involved in the phenylpropanoid pathway and regulate the floral fragrance of Rhododendron fortunei. BMC Plant Biol. 2023, 23, 8. [Google Scholar] [CrossRef]
- Wang, X.; Gao, Y.; Wu, X.; Wen, X.; Li, D.; Zhou, H.; Li, Z.; Liu, B.; Wei, J.; Chen, F.; et al. High-quality evergreen azalea genome reveals tandem duplication-facilitated low-altitude adaptability and floral scent evolution. Plant Biotechnol. J. 2021, 19, 2544–2560. [Google Scholar] [CrossRef]
- Raguso, R.A. Floral scent in a whole-plant context: Moving beyond pollinator attraction. Funct. Ecol. 2009, 23, 837–840. [Google Scholar] [CrossRef]
- Prieto-Benitez, S.; Dotterl, S.; Gimenez-Benavides, L. Diel Variation in Flower Scent Reveals Poor Consistency of Diurnal and Nocturnal Pollination Syndromes in Sileneae. J. Chem. Ecol. 2015, 41, 1095–1104. [Google Scholar] [CrossRef]
- Dong, F.; Fu, X.; Watanabe, N.; Su, X.; Yang, Z. Recent Advances in the Emission and Functions of Plant Vegetative Volatiles. Molecules 2016, 21, 124. [Google Scholar] [CrossRef]
- Huang, M.; Sanchez-Moreiras, A.M.; Abel, C.; Sohrabi, R.; Lee, S.; Gershenzon, J.; Tholl, D. The major volatile organic compound emitted from Arabidopsis thaliana flowers, the sesquiterpene (E)-beta-caryophyllene, is a defense against a bacterial pathogen. New Phytol. 2012, 193, 997–1008. [Google Scholar] [CrossRef]
- Moemenbellah-Fard, M.D.; Abdollahi, A.; Ghanbariasad, A.; Osanloo, M. Antibacterial and leishmanicidal activities of Syzygium aromaticum essential oil versus its major ingredient, eugenol. Flavour Fragr. J. 2020, 35, 534–540. [Google Scholar] [CrossRef]
- Ramya, M.; Jang, S.; An, H.R.; Lee, S.Y.; Park, P.M.; Park, P.H. Volatile Organic Compounds from Orchids: From Synthesis and Function to Gene Regulation. Int. J. Mol. Sci. 2020, 21, 1160. [Google Scholar] [CrossRef]
- Dudareva, N.; Pichersky, E.; Gershenzon, J. Biochemistry of plant volatiles. Plant Physiol. 2004, 135, 1893–1902. [Google Scholar] [CrossRef]
- Matteo, C.; Valentina, S. The Contribution of Volatile Organic Compounds (VOCs) Emitted by Petals and Pollen to the Scent of Garden Roses. Horticulturae 2022, 8, 1049. [Google Scholar] [CrossRef]
- Shanshan, L.; Ling, Z.; Miao, S.; Mengwen, L.; Yong, Y.; Wenzhong, X.; Liangsheng, W. Biogenesis of flavor-related linalool is diverged and genetically conserved in tree peony (Paeonia × suffruticosa). Hortic. Res. 2023, 10, uhac253. [Google Scholar]
- Jiang, F.; Liu, D.; Dai, J.; Yang, T.; Zhang, J.; Che, D.; Fan, J. Cloning and Functional Characterization of 2-C-methyl-D-erythritol-4-phosphate cytidylyltransferase (LiMCT) Gene in Oriental Lily (Lilium ‘Sorbonne’). Mol. Biotechnol. 2024, 66, 56–67. [Google Scholar] [CrossRef] [PubMed]
- Liu, X.; Yan, W.; Liu, S.; Wu, J.; Leng, P.; Hu, Z. LiNAC100 contributes to linalool biosynthesis by directly regulating LiLiS in Lilium ‘Siberia’. Planta 2024, 259, 73. [Google Scholar] [CrossRef] [PubMed]
- Jiawei, L.; Hongmin, H.; Huimin, S.; Qingyin, T.; Wenjie, D.; Xiulian, Y.; Lianggui, W.; Yuanzheng, Y. Insights into the Cytochrome P450 Monooxygenase Superfamily in Osmanthus fragrans and the Role of OfCYP142 in Linalool Synthesis. Int. J. Mol. Sci. 2022, 23, 12150. [Google Scholar] [CrossRef] [PubMed]
- Sha, W.; Zhihui, D.; Xiyu, Y.; Lanlan, W.; Kuaifei, X.; Zhilin, C. An Integrated Analysis of Metabolomics and Transcriptomics Reveals Significant Differences in Floral Scents and Related Gene Expression between Two Varieties of Dendrobium loddigesii. Appl. Sci. 2022, 12, 1262. [Google Scholar] [CrossRef]
- Wang, X.; Song, Z.; Ti, Y.; Ma, K.; Li, Q. Comparative transcriptome analysis linked to key volatiles reveals molecular mechanisms of aroma compound biosynthesis in Prunus mume. BMC Plant Biol. 2022, 22, 395. [Google Scholar]
- Wang, D.; Liu, G.; Yang, J.; Shi, G.; Niu, Z.; Liu, H.; Xu, N.; Wang, L. Integrated metabolomics and transcriptomics reveal molecular mechanisms of corolla coloration in Rhododendron dauricum L. Plant Physiol. Biochem. 2024, 207, 108438. [Google Scholar] [CrossRef]
- Yang, Q.; Li, Z.; Ma, Y.; Fang, L.; Liu, Y.; Zhu, X.; Dong, H.; Wang, S. Metabolite analysis reveals flavonoids accumulation during flower development in Rhododendron pulchrum sweet (Ericaceae). PeerJ 2024, 12, e17325. [Google Scholar] [CrossRef] [PubMed]
- Zhang, N.; Xu, Y.; Sun, D.; Li, Y.; Li, H.; Chen, L. Chromene meroterpenoids from Rhododendron dauricum L. and their anti-inflammatory effects. Phytochemistry 2024, 225, 114200. [Google Scholar] [CrossRef] [PubMed]
- Zheng, G.; Huang, L.; Feng, Y.; Zhang, H.; Gao, B.; Ma, X.; Sun, Y.; Abudurexiti, A.; Yao, G. Discovery of highly functionalized grayanane diterpenoids from the flowers of Rhododendron molle as potent analgesics. Bioorganic Chem. 2024, 142, 106928. [Google Scholar] [CrossRef] [PubMed]
- Zheng, G.; Huang, L.; Feng, Y.; Zhang, H.; Ma, X.; Gao, B.; Sun, Y.; Abudurexiti, A.; Yao, G. Structurally diverse analgesic diterpenoids from the flowers of Rhododendron molle. Fitoterapia 2024, 172, 105770. [Google Scholar] [CrossRef]
- Huang, H.; Kuo, Y.W.; Chuang, Y.C.; Yang, Y.P.; Huang, L.M.; Jeng, M.F.; Chen, W.H.; Chen, H.H. Terpene Synthase-b and Terpene Synthase-e/f Genes Produce Monoterpenes for Phalaenopsis bellina Floral Scent. Front. Plant Sci. 2021, 12, 700958. [Google Scholar] [CrossRef]
- Pazouki, L.; Niinemets, U. Multi-Substrate Terpene Synthases: Their Occurrence and Physiological Significance. Front. Plant Sci. 2016, 7, 1019. [Google Scholar] [CrossRef] [PubMed]
- Tholl, D. Terpene synthases and the regulation, diversity and biological roles of terpene metabolism. Curr. Opin. Plant Biol. 2006, 9, 297–304. [Google Scholar] [CrossRef]
- Degenhardt, J.; Kollner, T.G.; Gershenzon, J. Monoterpene and sesquiterpene synthases and the origin of terpene skeletal diversity in plants. Phytochemistry 2009, 70, 1621–1637. [Google Scholar] [CrossRef]
- Magnard, J.-L.; Roccia, A.; Caissard, J.-C.; Vergne, P.; Sun, P.; Hecquet, R.; Dubois, A.; Hibrand-Saint Oyant, L.; Jullien, F.; Nicolè, F.; et al. Biosynthesis of monoterpene scent compounds in roses. Science 2015, 349, 81–83. [Google Scholar] [CrossRef]
- Gao, F.; Liu, B.; Li, M.; Gao, X.; Fang, Q.; Liu, C.; Ding, H.; Wang, L.; Gao, X. Identification and characterization of terpene synthase genes accounting for volatile terpene emissions in flowers of Freesia × hybrida. J. Exp. Bot. 2018, 69, 4249–4265. [Google Scholar] [CrossRef]
- Conart, C.; Bomzan, D.P.; Huang, X.Q.; Bassard, J.E.; Paramita, S.N.; Saint-Marcoux, D.; Rius-Bony, A.; Hivert, G.; Anchisi, A.; Schaller, H.; et al. A cytosolic bifunctional geranyl/farnesyl diphosphate synthase provides MVA-derived GPP for geraniol biosynthesis in rose flowers. Proc. Natl. Acad. Sci. USA 2023, 120, e2221440120. [Google Scholar] [CrossRef] [PubMed]
- Raza, A.; Su, W.; Hussain, M.A.; Mehmood, S.S.; Zhang, X.; Cheng, Y.; Zou, X.; Lv, Y. Integrated Analysis of Metabolome and Transcriptome Reveals Insights for Cold Tolerance in Rapeseed (Brassica napus L.). Front. Plant Sci. 2021, 12, 721681. [Google Scholar] [CrossRef] [PubMed]
- Wu, H.; Wu, Z.; Wang, Y.; Ding, J.; Zheng, Y.; Tang, H.; Yang, L. Transcriptome and Metabolome Analysis Revealed the Freezing Resistance Mechanism in 60-Year-Old Overwintering Camellia sinensis. Biology 2021, 10, 996. [Google Scholar] [CrossRef]
- Jiang, Y.; Qian, R.; Zhang, W.; Wei, G.; Ma, X.; Zheng, J.; Kollner, T.G.; Chen, F. Composition and Biosynthesis of Scent Compounds from Sterile Flowers of an Ornamental Plant Clematis florida cv. ‘Kaiser’. Molecules 2020, 25, 1711. [Google Scholar] [CrossRef]
- Basir, S.; Akbar, M.A.; Talip, N.; Baharum, S.N.; Bunawan, H. An Integrative Volatile Terpenoid Profiling and Transcriptomics Analysis in Hoya cagayanensis, Hoya lacunosa and Hoya coriacea (Apocynaceae, Marsdenieae). Horticulturae 2022, 8, 224. [Google Scholar] [CrossRef]
- Liu, Z.-q.; Gao, Q.; Li, H.; Jiang, M.-f.; Chen, R. Expression analysis of key genes in terpenoid biosynthesis of Ginkgo biloba under different growth years based on metabolomics and transcriptome. Chin. Tradit. Herb. Drugs 2022, 53, 1138–1147. [Google Scholar]
- Lee, D.K.; Ahn, S.; Cho, H.Y.; Yun, H.Y.; Park, J.H.; Lim, J.; Lee, J.; Kwon, S.W. Metabolic response induced by parasitic plant-fungus interactions hinder amino sugar and nucleotide sugar metabolism in the host. Sci. Rep. 2016, 6, 37434. [Google Scholar] [CrossRef] [PubMed]
- Dunn, W.B.; Broadhurst, D.; Begley, P.; Zelena, E.; Francis-McIntyre, S.; Anderson, N.; Brown, M.; Knowles, J.D.; Halsall, A.; Haselden, J.N.; et al. Procedures for large-scale metabolic profiling of serum and plasma using gas chromatography and liquid chromatography coupled to mass spectrometry. Nat. Protoc. 2011, 6, 1060–1083. [Google Scholar] [CrossRef]
- Chai, L.; Wang, Z.; Chai, P.; Chen, S.; Ma, H. Transcriptome analysis of San Pedro-type fig (Ficus carica L.) parthenocarpic breba and non-parthenocarpic main crop reveals divergent phytohormone-related gene expression. Tree Genet. Genomes 2017, 13, 83. [Google Scholar] [CrossRef]
- Livak, K.J.; Schmittgen, T.D. Analysis of relative gene expression data using real-time quantitative PCR and the 2−ΔΔCT Method. Methods 2001, 25, 402–408. [Google Scholar] [CrossRef]
- Li, G.; Xi, J.; Ji, X.; Li, M.-Z.; Xie, D.-Y. Non-plastidial expression of a synthetic insect geranyl pyrophosphate synthase effectively increases tobacco plant biomass. J. Plant Physiol. 2018, 221, 144–155. [Google Scholar] [CrossRef]
- Chen, C.; Chen, H.; Zhang, Y.; Thomas, H.R.; Frank, M.H.; He, Y.; Xia, R. TBtools: An Integrative Toolkit Developed for Interactive Analyses of Big Biological Data. Mol. Plant 2020, 13, 1194–1202. [Google Scholar] [CrossRef] [PubMed]
- Thabet, I.; Guirimand, G.; Guihur, A.; Lanoue, A.; Courdavault, V.; Papon, N.; Bouzid, S.; Giglioli-Guivarc’h, N.; Simkin, A.J.; Clastre, M. Characterization and subcellular localization of geranylgeranyl diphosphate synthase from Catharanthus roseus. Mol. Biol. Rep. 2012, 39, 3235–3243. [Google Scholar] [CrossRef] [PubMed]
- Xia, T.; Su, S.; Guo, K.; Wang, L.; Tang, Z.; Huo, J.; Song, H. Characterization of key aroma-active compounds in blue honeysuckle (Lonicera caerulea L.) berries by sensory-directed analysis. Food Chem. 2023, 429, 136821. [Google Scholar] [CrossRef] [PubMed]
- Yu, R.; Li, Y.; Si, D.; Yan, S.; Liu, J.; Si, J.; Zhang, X. Identification, quantitative and bioactivity analyses of aroma and alcohol-soluble components in flowers of Gardenia jasminoides and its variety during different drying processes. Food Chem. 2023, 420, 135846. [Google Scholar] [CrossRef]
- Zhang, Y.; Gong, Z.; Zhu, Z.; Sun, J.; Guo, W.; Zhang, J.; Ding, P.; Liu, M.; Gao, Z. Identification of floral aroma components and molecular regulation mechanism of floral aroma formation in Phalaenopsis. J. Sci. Food Agric. 2024. online ahead of print. [Google Scholar] [CrossRef]
- Shang, J.; Feng, D.; Liu, H.; Niu, L.; Li, R.; Li, Y.; Chen, M.; Li, A.; Liu, Z.; He, Y.; et al. Evolution of the biosynthetic pathways of terpene scent compounds in roses. Curr. Biol. CB 2024, 34, 3550–3563.e3558. [Google Scholar] [CrossRef] [PubMed]
- Wang, X.; Tang, Y.; Huang, H.; Wu, D.; Chen, X.; Li, J.; Zheng, H.; Zhan, R.; Chen, L. Functional analysis of Pogostemon cablin farnesyl pyrophosphate synthase gene and its binding transcription factor PcWRKY44 in regulating biosynthesis of patchouli alcohol. Front. Plant Sci. 2022, 13, 946629. [Google Scholar] [CrossRef] [PubMed]
- Lu, Z.; Wang, X.; Lin, X.; Mostafa, S.; Bao, H.; Ren, S.; Cui, J.; Jin, B. Genome-Wide Identification and Characterization of Long Non-Coding RNAs Associated with Floral Scent Formation in Jasmine (Jasminum sambac). Biomolecules 2023, 14, 45. [Google Scholar] [CrossRef]
- Pichersky, E.; Gershenzon, J. The formation and function of plant volatiles: Perfumes for pollinator attraction and defense. Curr. Opin. Plant Biol. 2002, 5, 237–243. [Google Scholar] [CrossRef]
- Lewinsohn, E.; Schalechet, F.; Wilkinson, J.; Matsui, K.; Tadmor, Y.; Nam, K.-H.; Amar, O.; Lastochkin, E.; Larkov, O.; Ravid, U.; et al. Enhanced Levels of the Aroma and Flavor Compound S-Linalool by Metabolic Engineering of the Terpenoid Pathway in Tomato Fruits. Plant Physiol. 2001, 127, 1256–1265. [Google Scholar] [CrossRef]
- Zhang, P.; Ma, X.; Zhang, Q.; Guo, Z.; Hao, J.; Zhang, Z.; Sun, M.; Liu, Y. Determination of Volatile Organic Compounds and Endogenous Extracts and Study of Expression Patterns of TPS and BSMT in the Flowers of Seven Lilium Cultivars. Molecules 2023, 28, 7938. [Google Scholar] [CrossRef]
- Hendrickson, H.; Islam, M.; Wabo, G.F.; Mafu, S. Biochemical analysis of the TPS-a subfamily in Medicago truncatula. Front. Plant Sci. 2024, 15, 1349009. [Google Scholar] [CrossRef]
- Zhao, Y.; Chen, Y.; Gao, M.; Wu, L.; Wang, Y. LcMYB106 suppresses monoterpene biosynthesis by negatively regulating LcTPS32 expression in Litsea cubeba. Tree Physiol. 2023, 43, 2150–2161. [Google Scholar] [CrossRef] [PubMed]
- Nieuwenhuizen, N.J.; Green, S.A.; Chen, X.; Bailleul, E.J.; Matich, A.J.; Wang, M.Y.; Atkinson, R.G. Functional genomics reveals that a compact terpene synthase gene family can account for terpene volatile production in apple. Plant Physiol. 2013, 161, 787–804. [Google Scholar] [CrossRef]
- Zeng, X.; Liu, C.; Zheng, R.; Cai, X.; Luo, J.; Zou, J.; Wang, C. Emission and Accumulation of Monoterpene and the Key Terpene Synthase (TPS) Associated with Monoterpene Biosynthesis in Osmanthus fragrans Lour. Front. Plant Sci. 2015, 6, 1232. [Google Scholar] [CrossRef]
- Zhang, T.; Guo, Y.; Shi, X.; Yang, Y.; Chen, J.; Zhang, Q.; Sun, M. Overexpression of LiTPS2 from a cultivar of lily (Lilium ‘Siberia’) enhances the monoterpenoids content in tobacco flowers. Plant Physiol. Biochem. 2020, 151, 391–399. [Google Scholar] [CrossRef] [PubMed]
- Schmidt, A.; Wachtler, B.; Temp, U.; Krekling, T.; Seguin, A.; Gershenzon, J. A bifunctional geranyl and geranylgeranyl diphosphate synthase is involved in terpene oleoresin formation in Picea abies. Plant Physiol. 2010, 152, 639–655. [Google Scholar] [CrossRef] [PubMed]
- Rui-jie, L.; Hong, Z.; Shao-zhen, H.; Huan, Z.; Ning, Z.; Qing-chang, L. A geranylgeranyl pyrophosphate synthase gene, IbGGPS, increases carotenoid contents in transgenic sweetpotato. J. Integr. Agric. 2022, 21, 2538–2546. [Google Scholar]
- Ziang, L.; Xinwen, Z.; Kun, L.; Peiyun, W.; Chuanrong, L.; Xiuhua, S. Integrative analysis of transcriptomic and volatile compound profiles sheds new insights into the terpenoid biosynthesis in tree peony. Ind. Crops Prod. 2022, 188, 115672. [Google Scholar]
- Kalita, R.; Patar, L.; Shasany, A.K.; Modi, M.K.; Sen, P. Molecular cloning, characterization and expression analysis of 3-hydroxy-3-methylglutaryl coenzyme A reductase gene from Centella asiatica L. Mol. Biol. Rep. 2015, 42, 1431–1439. [Google Scholar] [CrossRef]
- Afroz, S.; Warsi, Z.I.; Khatoon, K.; Sangwan, N.S.; Khan, F.; Rahman, L.U. Molecular cloning and characterization of Triterpenoid Biosynthetic Pathway Gene HMGS in Centella asiatica (Linn.). Mol. Biol. Rep. 2022, 49, 4555–4563. [Google Scholar] [CrossRef] [PubMed]
- Ladevèze, V.; Marcireau, C.; Delourme, D.; Karst, F. General resistance to sterol biosynthesis inhibitors in Saccharomyces cerevisiae. Lipids 1993, 28, 907–912. [Google Scholar] [CrossRef]
- Hu, Y.; Chen, L.; Huang, L.; Wang, G. The expression of AcIDI1 reveals diterpenoid alkaloids’ allocation strategies in the roots of Aconitum carmichaelii Debx. Gene 2024, 920, 148529. [Google Scholar] [CrossRef]
- Chai, J.; Wang, D.; Peng, Y.; Zhao, X.; Zhang, Q.; Li, P.; Fang, X.; Wang, M.; Cai, X. Molecular cloning, expression and immunolocalization analysis of diphosphomevalonate decarboxylase involved in terpenoid biosynthesis from Euphorbia helioscopia L. Biotechnol. Biotechnol. Equip. 2017, 31, 1106–1115. [Google Scholar] [CrossRef]
- Shixin, W.; Zengcai, L.; Xutong, W.; Tingting, S.; Li, Z. Cloning and characterization of a phosphomevalonate kinase gene from Sanghuangporus baumii. Biotechnol. Biotechnol. Equip. 2021, 35, 934–942. [Google Scholar]
- Redding-Johanson, A.M.; Batth, T.S.; Chan, R.; Krupa, R.; Szmidt, H.L.; Adams, P.D.; Keasling, J.D.; Lee, T.S.; Mukhopadhyay, A.; Petzold, C.J. Targeted proteomics for metabolic pathway optimization: Application to terpene production. Metab. Eng. 2011, 13, 194–203. [Google Scholar] [CrossRef]
- Woo, H.M.; Murray, G.W.; Batth, T.S.; Prasad, N.; Adams, P.D.; Keasling, J.D.; Petzold, C.J.; Lee, T.S. Application of targeted proteomics and biological parts assembly in E. coli to optimize the biosynthesis of an anti-malarial drug precursor, amorpha-4,11-diene. Chem. Eng. Sci. 2013, 103, 21–28. [Google Scholar] [CrossRef]
- Ma, R.; Yang, P.; Jing, C.; Fu, B.; Teng, X.; Zhao, D.; Sun, L. Comparison of the metabolomic and proteomic profiles associated with triterpene and phytosterol accumulation between wild and cultivated ginseng. Plant Physiol. Biochem. 2023, 195, 288–299. [Google Scholar] [CrossRef]
- Liu, M.; Wang, Z.; Qin, C.; Cao, H.; Kong, L.; Liu, T.; Jiang, S.; Ma, L.; Liu, X.; Ren, W.; et al. Cloning, Expression Characteristics of Farnesyl Pyrophosphate Synthase Gene from Platycodon grandiflorus and Functional Identification in Triterpenoid Synthesis. J. Agric. Food Chem. 2024, 72, 11429–11437. [Google Scholar] [CrossRef]
- Lin, P.; Yan, Z.F.; Li, C.T. Effects of Exogenous Elicitors on Triterpenoids Accumulation and Expression of Farnesyl Diphosphate Synthase Gene in Inonotus obliquus. Biotechnol. Bioprocess Eng. 2020, 25, 580–588. [Google Scholar] [CrossRef]
- Qian, J.; Liu, Y.; Chao, N.; Ma, C.; Chen, Q.; Sun, J.; Wu, Y. Positive selection and functional divergence of farnesyl pyrophosphate synthase genes in plants. BMC Mol. Biol. 2017, 18, 3. [Google Scholar] [CrossRef] [PubMed]
- Han, J.-L.; Liu, B.-Y.; Ye, H.-C.; Wang, H.; Li, Z.-Q.; Li, G.-F. Effects of Overexpression of the Endogenous Farnesyl Diphosphate Synthase on the Artemisinin Content in Artemisia annua L. J. Integr. Plant Biol. 2006, 48, 482–487. [Google Scholar] [CrossRef]
- Bick, J.A.; Lange, B.M. Metabolic cross talk between cytosolic and plastidial pathways of isoprenoid biosynthesis: Unidirectional transport of intermediates across the chloroplast envelope membrane. Arch. Biochem. Biophys. 2003, 415, 146–154. [Google Scholar] [CrossRef] [PubMed]
- Oliver, L.; Andreas, F.; Hur-Song, C.; Tong, Z.; Xun, W.; Heifetz, P.B.; Wilhelm, G.; Markus, L. Crosstalk between cytosolic and plastidial pathways of isoprenoid biosynthesis in Arabidopsis thaliana. Proc. Natl. Acad. Sci. USA 2003, 100, 6866–6871. [Google Scholar]
- Rodríguez-Concepción, M. Early Steps in Isoprenoid Biosynthesis: Multilevel Regulation of the Supply of Common Precursors in Plant Cells. Phytochem. Rev. 2006, 5, 1–15. [Google Scholar] [CrossRef]
- Zhang, W.; Zhang, J.; Fan, Y.; Dong, J.; Gao, P.; Jiang, W.; Yang, T.; Che, D. RNA sequencing analysis reveals PgbHLH28 as the key regulator in response to methyl jasmonate-induced saponin accumulation in Platycodon grandiflorus. Hortic. Res. 2024, 11, uhae058. [Google Scholar] [CrossRef]


Disclaimer/Publisher’s Note: The statements, opinions and data contained in all publications are solely those of the individual author(s) and contributor(s) and not of MDPI and/or the editor(s). MDPI and/or the editor(s) disclaim responsibility for any injury to people or property resulting from any ideas, methods, instructions or products referred to in the content. |
© 2024 by the authors. Licensee MDPI, Basel, Switzerland. This article is an open access article distributed under the terms and conditions of the Creative Commons Attribution (CC BY) license (https://creativecommons.org/licenses/by/4.0/).