Article

Extracellular Fragmented Self-DNA Displays Biostimulation of Lettuce in Soilless Culture

by
Tatiana P. L. Cunha-Chiamolera
1,*,
Miguel Urrestarazu
1,
Ireri A. Carbajal-Valenzuela
2,
José Barroso Ramos
1,
Raúl Ortega
1,
Isabel Miralles
1 and
Ramón Gerardo Guevara-González
2
1
Department of Agronomy, University of Almeria, 04120 Almería, Spain
2
Center of Applied Research in Biosystems (CARB-CIAB), School of Engineering, Autonomous University of Queretaro-Campus Amazcala, Highway Chichimequillas s/n Km 1, Amazcala 76265, Querétaro, Mexico
*
Author to whom correspondence should be addressed.
Horticulturae 2024, 10(9), 964; https://doi.org/10.3390/horticulturae10090964
Submission received: 10 August 2024 / Revised: 5 September 2024 / Accepted: 9 September 2024 / Published: 11 September 2024
(This article belongs to the Section Vegetable Production Systems)

Abstract

:
Research is advancing regarding techniques that are based on natural products developed using the plants. Extracellular DNA (eDNA) is a potential alternative that can be used as active material in agronomy. The objective of this study was to evaluate the use of self-eDNA using fertigation in lettuce plants as a biostimulant. Five fertigation treatments were used: 0 (control), 0.025, 0.25, 2.5 and 25 mg self-eDNA per plant. Fertigation was monitored through drainage fraction, pH and EC. The benefits of fertigation were evaluated using water, nitrate and potassium uptake, and growth. There was a significant correlation between fertigation uptake and growth. The highest correlation (R2 = 0.96) occurred between water uptake and growth. There was a quadratic fit between uptake and production parameters and the dose of self-eDNA applied. Mean drainage values showed no significant differences between treatments for EC and pH. The highest values of fertigation uptake (water, nitrate and potassium) and growth were observed at doses of 0.25 and 2.5 mg self-eDNA. Doses lower than 0.25 decreased by 21.3%, while doses higher than 2.5 decreased by 16.4%. Self-eDNA had beneficial effects as a biostimulant and potentially had an appropriate cost–benefit ratio.

1. Introduction

The term “eDNA” refers collectively to extracellular and extranuclear (i.e., cytosolic) DNA [1]. Much evidence has accumulated addressing the role of extracellular self-eDNA (obtained from the other plant of the same species) as a signal molecule with multiple effects on stress-related plant signal transduction pathways such as cell membrane depolarization, changes in Ca2+ signaling [2], oxidative burst and antioxidant enzymatic activity [3], signaling activation of mitogen-activated protein kinases (MAPKs) [1], major genetic expression changes [4,5], plant metabolism affecting the phenylpropanoid biosynthetic pathway [6] and the jasmonate signaling pathway [7]. As a consequence of these effects, self-eDNA induces a protector effect against some diseases such as wilt and root rot in plants [8].
Self-eDNA has been proposed as a damage-associated molecular pattern [9] because it activates a network of molecular mechanisms related to stress tolerance and immunity. Continuous exposure of an organism to a certain stimulus induces different responses than if the organism is only exposed to that stimulus once, leading to a form of adaptation with more efficient mechanisms and enhanced responses, a process termed priming [10].
This evidence suggests the potential of self-eDNA to be introduced as an agricultural product. Self-eDNA also offers the advantage of being extracted from the crop’s own organic residues such as leaves and stem pruning, thereby reducing costs and the ecological, hydric and carbon fingerprint of the overall crop supplies [11]. However, little is known about the effect of the application of self-eDNA in plants on variables with agronomic importance such as plant growth and nutrient uptake, resulting in an increase in the yield and quality of the crop.
When a product applied to a crop improves nutritional efficiency, abiotic stress tolerance and crop quality traits without directly providing nutrients, the product is classified as a biostimulant [12]. In current agricultural systems, there is a need for novel biostimulant molecules, which offer a healthier and more ecologically and environmentally secure option [13]. Multiple examples of biostimulants that are already used commercially are seaweed extracts, humic and fulvic acids, plant growth-promoting bacteria and mycorrhizae, among others [14,15].
In earlier research studies of DNA effects in plant metabolism, the application of self-eDNA has always been made in a foliar way, allowing the leaf and stem cells to sense the self-eDNA and stimulate the corresponding signal transduction pathway inside the cell and possibly through neighboring cells [6]. This form of application of self-eDNA offers an easy and readily available means of introduction into any agricultural crop using a biostimulant and possibly priming effects, and allows the plants to maintain certain biological pathways in an activated state while avoiding a distress effect regarding plant metabolism [9,16].
Fertigation is an efficient and effective technique for the supply of active self-eDNA materials, avoiding the need for other management that implies an extra economic or temporal cost for the crop [17]. Lettuce (Lactuca sativa L.) is the most consumed leafy vegetable worldwide, and its production has been growing over the years, mainly in controlled environments [18]. According to the FAO statistical database, in 2021, approximately 27.7 million tons of lettuce were produced globally, an increase of almost 40,000 tons compared to the previous year [19]. On the other hand, soilless cultivation systems have been described as an effective and efficient method to discover the details of metabolism in plant physiology [20]. The self-eDNA could be applied to the nutrient solution; in this way, the only parts of the plant in contact with the DNA solution are the roots. With this type of application, it is expected that the systemic signaling due to eDNA will be sensed by the plants, likely leading to induced systemic resistance (ISR) via jasmonic acid (JA) and ethylene (ET) signaling [7]. The activation of ISR represents a physiological state of enhanced defense capacity in all the plant organs elicited by a localized stimulus, confirming a state of active communication between cells and organs in the same plant [21].
The objective of this study was to evaluate the potential use of self-eDNA as a feasible agricultural product and biostimulant to be applied via fertigation to a lettuce crop.

2. Materials and Methods

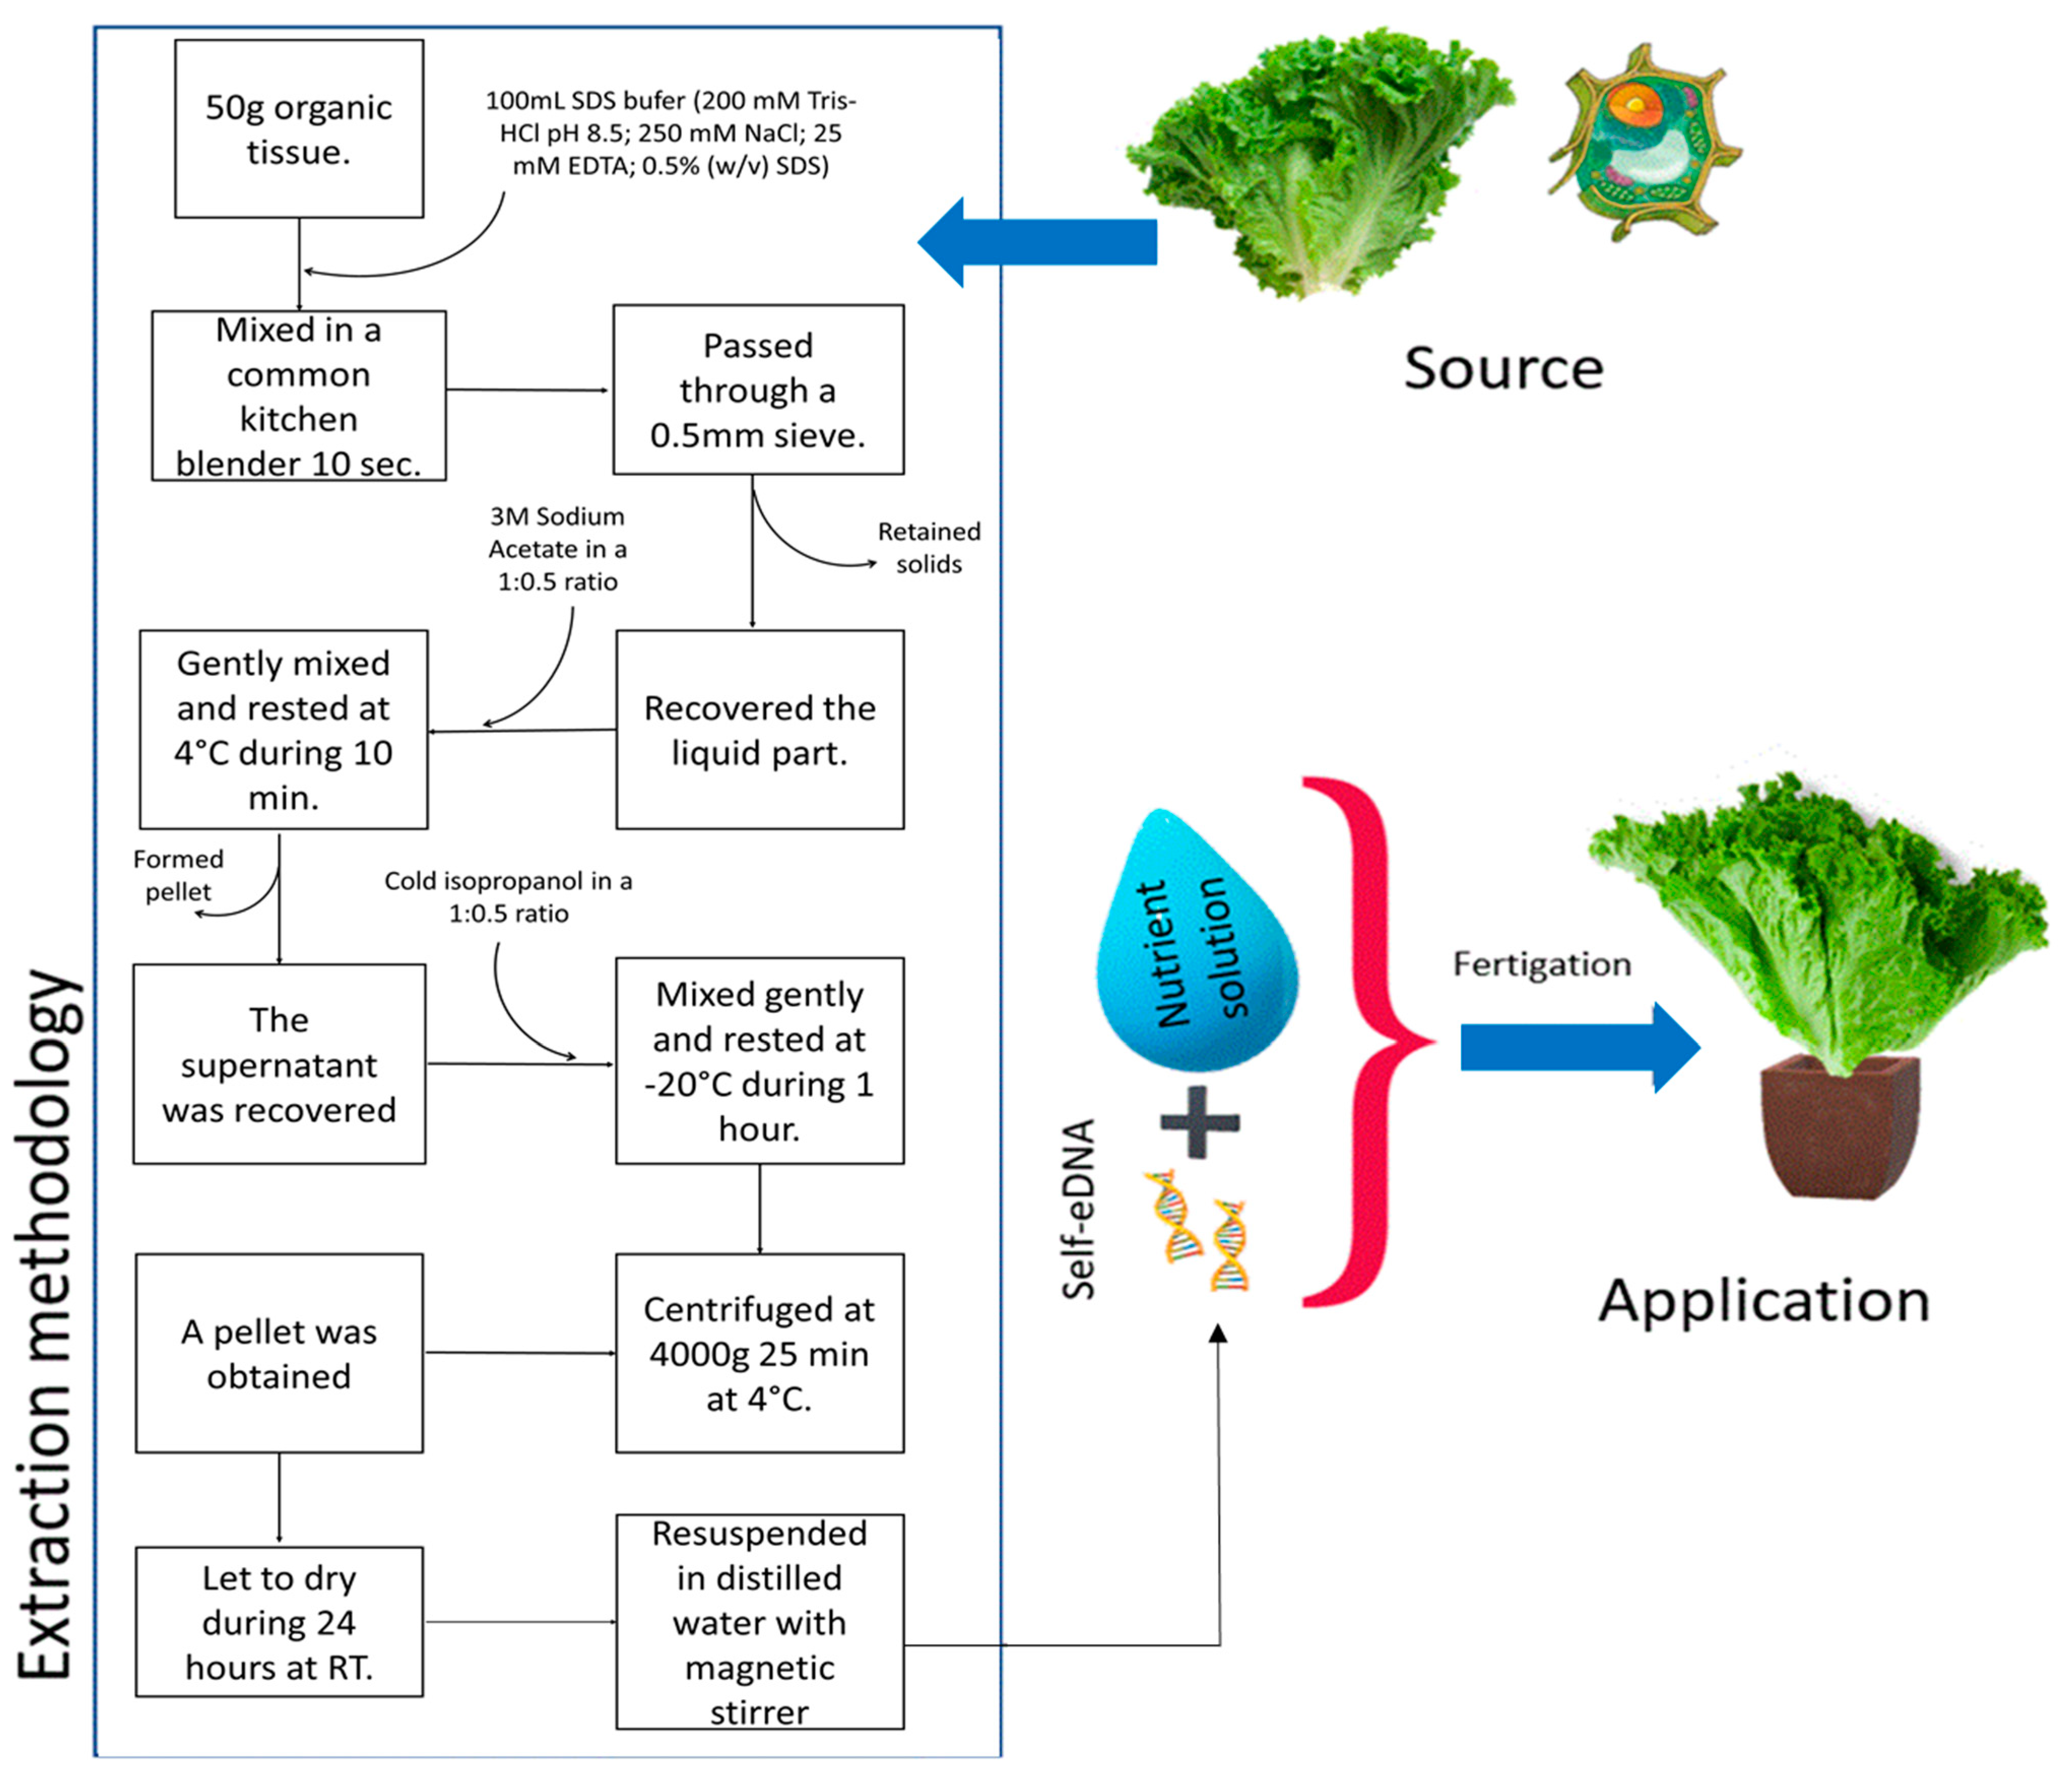
2.1. Biological Material and DNA Extraction

Lettuce (Lactuca sativa L. cv. “Summer Wonder”) was used as the model crop. DNA was extracted from leaves of lettuce following the methodology of Carbajal-Valenzuela et al. [6] with some changes (Figure 1). Biological material (50 g FW) was collected and blended with 100 mL Buffer SDS (200 mM Tris-HCl, pH 8.5; 250 mM NaCl; 25 mM EDTA; 0.5% (w/v) SDS) in a Ufesa BS4800 glass blender for 30 s. The obtained mixture was passed through a metal sieve with aperture of 0.5 mm. Then, 25 mL of the liquid phase was transferred to Falcon tubes, and 15 mL 3 M sodium acetate was added, gently mixed, and rested for 10 min at −20 °C. The mixture was centrifuged for 25 min at 3234 g and 4 °C (Centrifuge 5804/5804 R, EppendorfTM, Hamburg, Germany). Supernatant was recovered, and an isopropanol volume equivalent to half of the supernatant volume was added. Tubes were incubated for 1 h at −20 °C and centrifuged at 4000× g for 25 min (4 °C), and the supernatant was discarded. Finally, the DNA pellet was dissolved in sterile distilled water. DNA concentration was measured using spectrophotometry at an absorbance of 260 nm with a Thermo Scientific NanoDrop 2000c Spectrophotometer (Thermo Fisher Scientific, Waltham, MA, USA) and fluorometry with a Qubit 2.0 (Thermo Fisher Scientific, Waltham, MA, USA).

2.2. Treatment and Plant-Growing Conditions

The experiment was carried out in controlled growth chambers located at the University of Almería (Spain). Lettuce seedlings with 4 true leaves were transplanted into 250 mL plastic pots filled with coconut fiber, whose physical characteristics are described by Rodríguez et al. [22]. The environmental variables were a 16/8 h photoperiod (day/night), a temperature of 20 to 25 °C, a relative humidity from 55 to 75% and a photosynthetic photon flux density of 250 μmol m−2 s−1 (400–700 nm) supplied by L18 T8 AP67 LED lamps (Valoya, Helsinki, Finland), and the experiment’s duration was a 30-day cycle. Fertigation treatments were 0 (control treatment), 0.025, 0.25, 2.5 and 25 mg self-eDNA per plant.

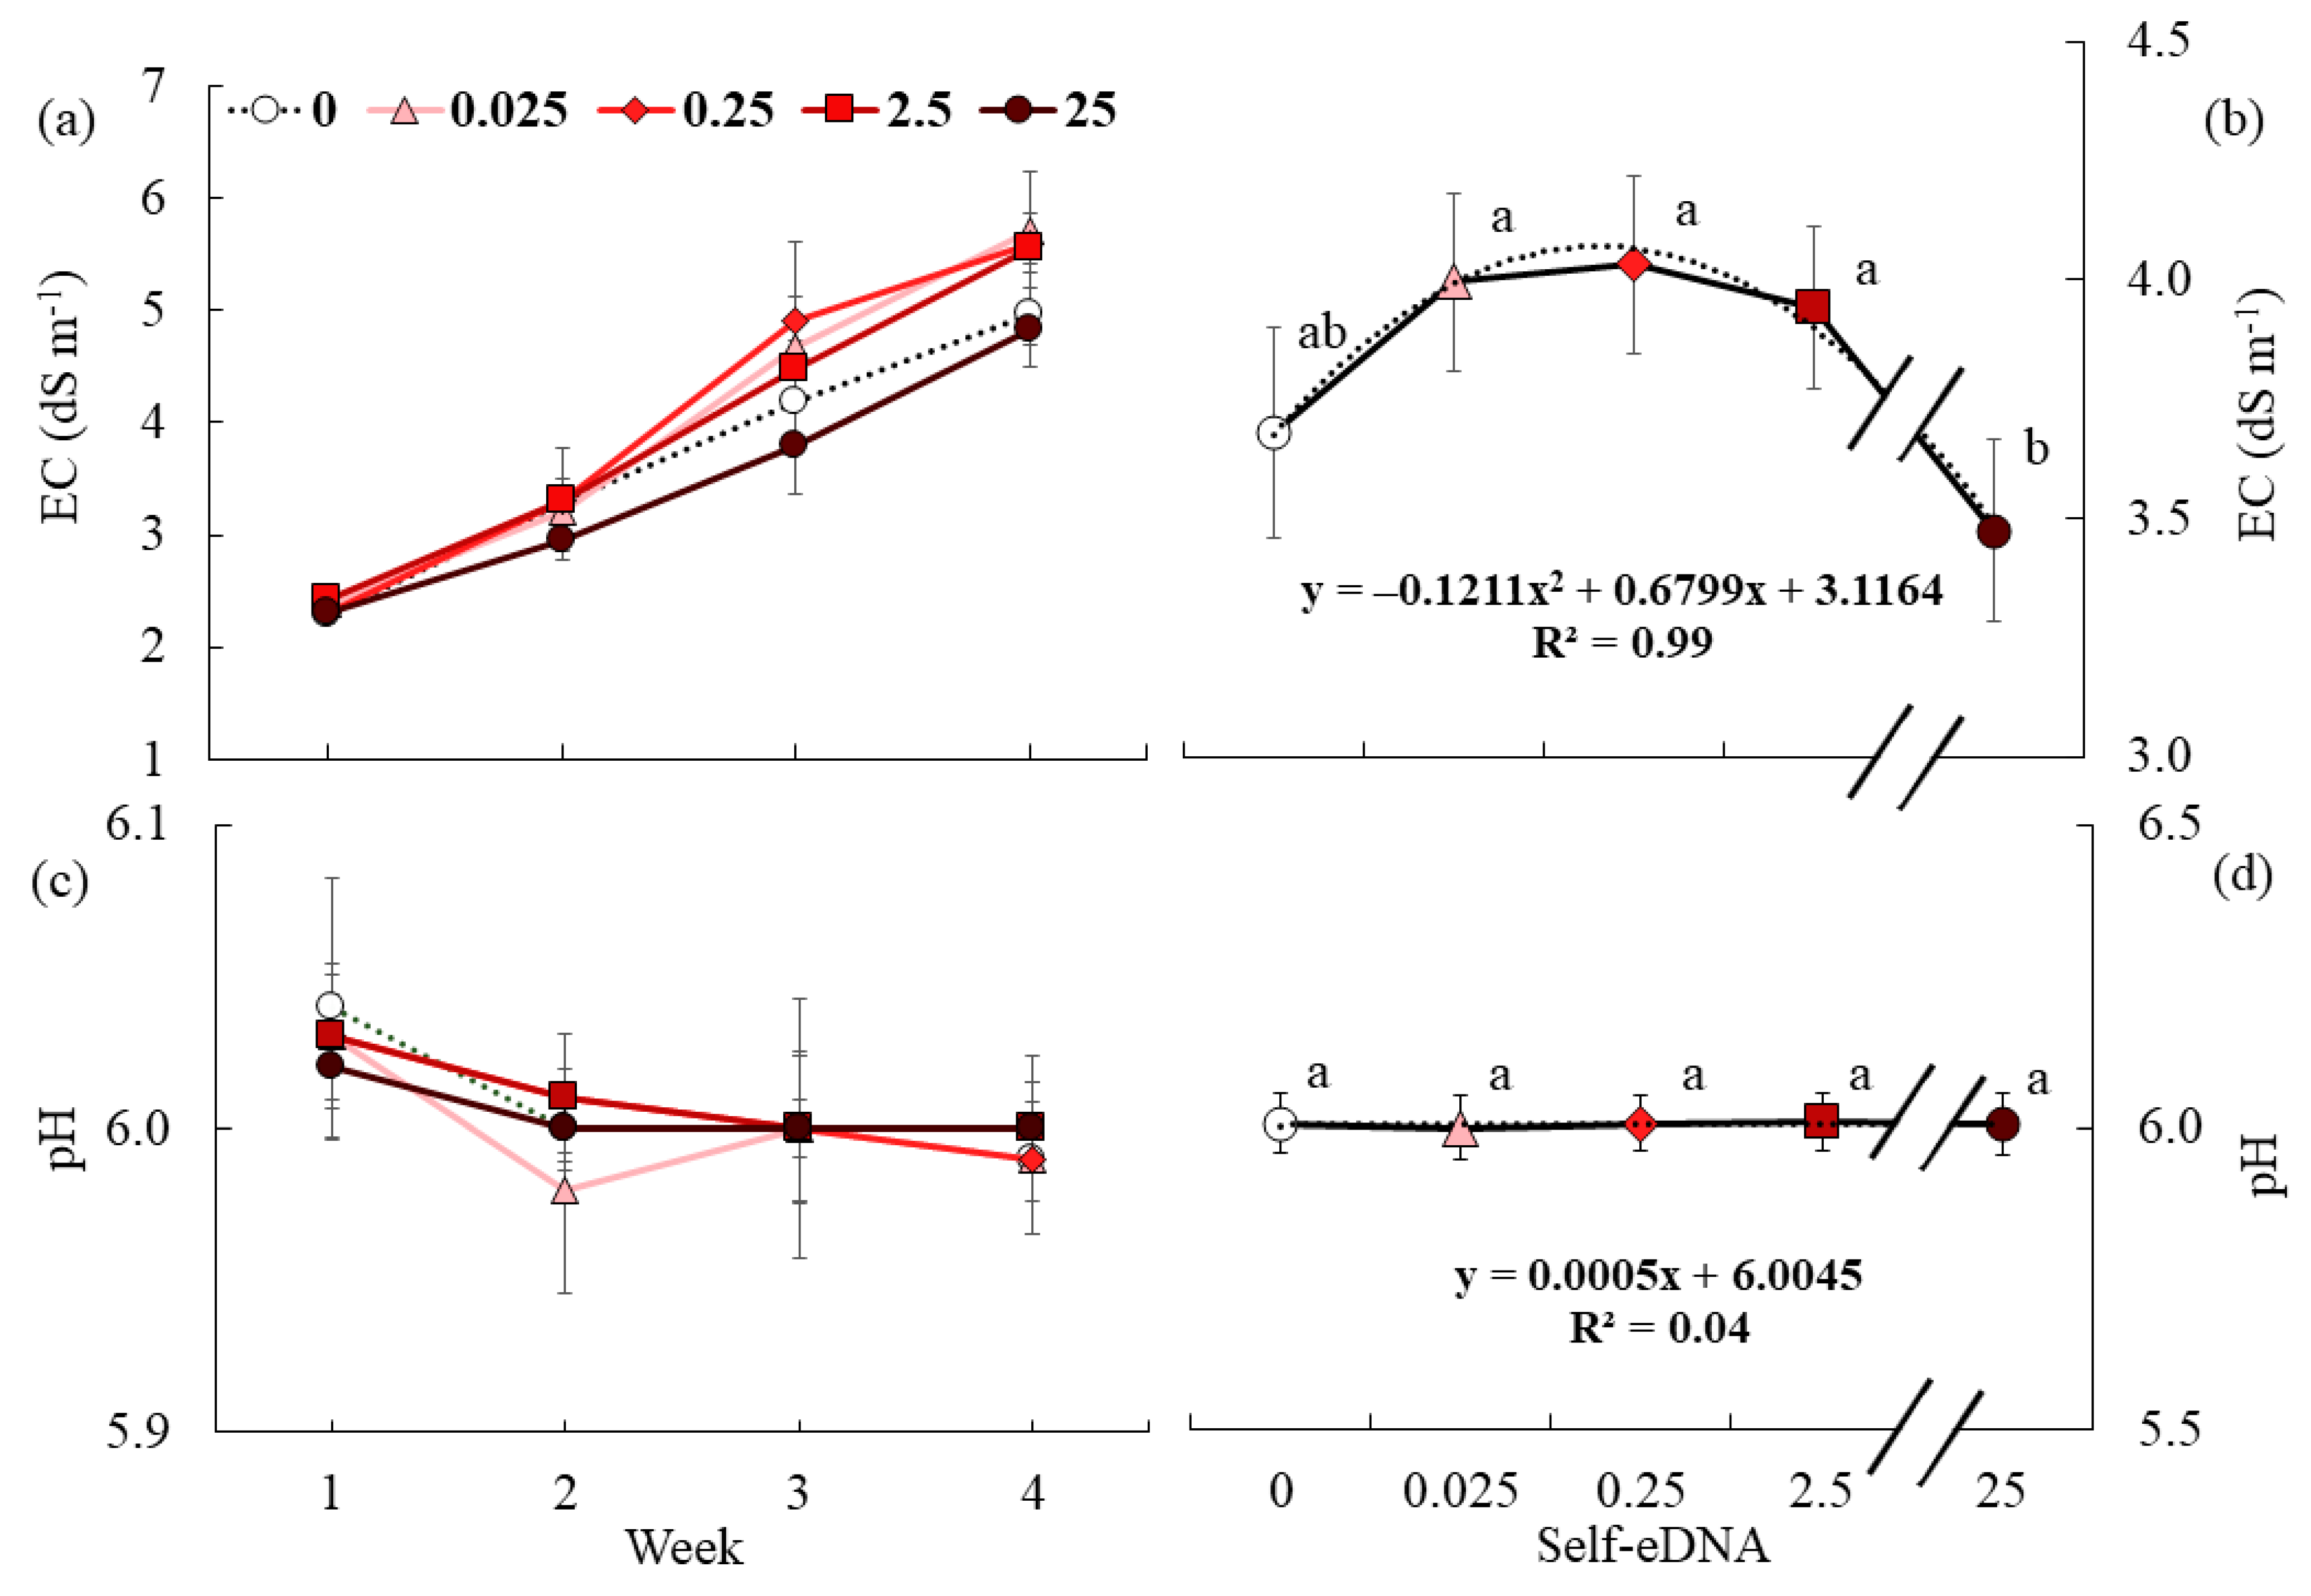
2.3. Fertigation Parameters

Fertigation management was performed following the criteria of Rodríguez et al. [22] and Urrestarazu and Carrasco [23]. New rounds of fertigation took place when the water in the crop unit reached 10% of the readily available water, and the necessary volume was added to obtain a drainage range between 15 and 25% [24,25]. The nutrient solution was similar to that of Sonneveld and Straver [26]: the pH was kept at 5.8 with the addition of nitric acid, and the electrical conductivity was maintained at 2.0 dS m−1. The pH, electrical conductivity (EC), nitrate and potassium content of the nutritive solution and the drainage were measured using a Crison MM40+ pH meter (Hach® LPV2500.98.0002, Loveland, CO, USA), an EC-Meter Crison BASIC 30 conductivity meter (Hach® LPV2500.98.0002, Loveland, Colorado, USA), and a LAQUATwin B-742 and B-731 (Horiba®, Moulton, Northampton, UK), respectively. Ratio of drainage was measured using a test tube graduated to one hundredth of a millimeter.

2.4. Growth Parameters

The plants were harvested at 30 days after transplanting, and the fresh and dry matter were recorded as the growth parameter. Plants were separated into root, stem and leaves, weighed and then placed in a forced air circulation oven (Thermo Scientific Heratherm, Waltham, MA, USA) at 85 °C for drying until it reached a constant weight. Weights were measured using an precision analytical balance (model AX 124/E, OHAUS Corporation, Parsippany, NJ, USA), with an accuracy of four tenths of a gram.

2.5. Statistical Analysis and Experimental Design

The experiment was conducted using a randomized complete block design with five treatments and 4 replicates comprising of 6 plants per replicate [27]. The statistical analyses were performed using analysis of variance (ANOVA) and subsequent separation of means via Tukey’s test (p ≤ 0.05); in addition, a quadratic adjustment with its R2 was used when appropriate. Statgraphics Centurion® software XVI (, Princeton, NJ, USA) was used in all cases.

3. Results and Discussion

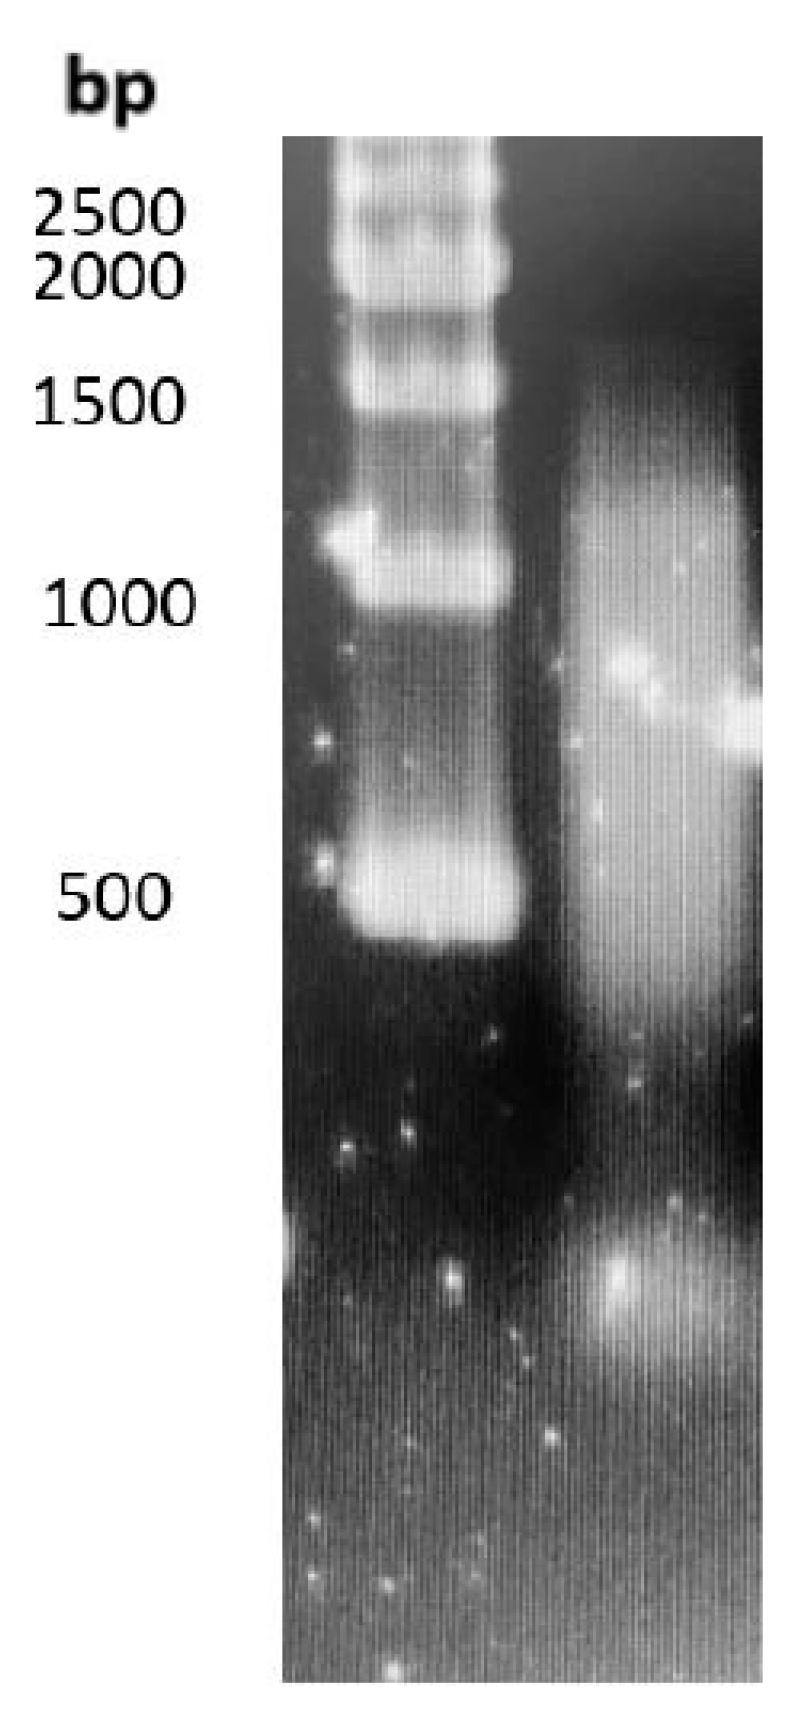
3.1. Yield from Self-eDNA Extraction

The number of self-eDNA nucleotides that are 1000 base pairs (bps) long has been described by Duran-Flores and Heil [1], and these are the signal molecules in plants. The DNA extraction from lettuce showed a similar number of bands of the expected size using agarose gel electrophoresis (Figure 2).

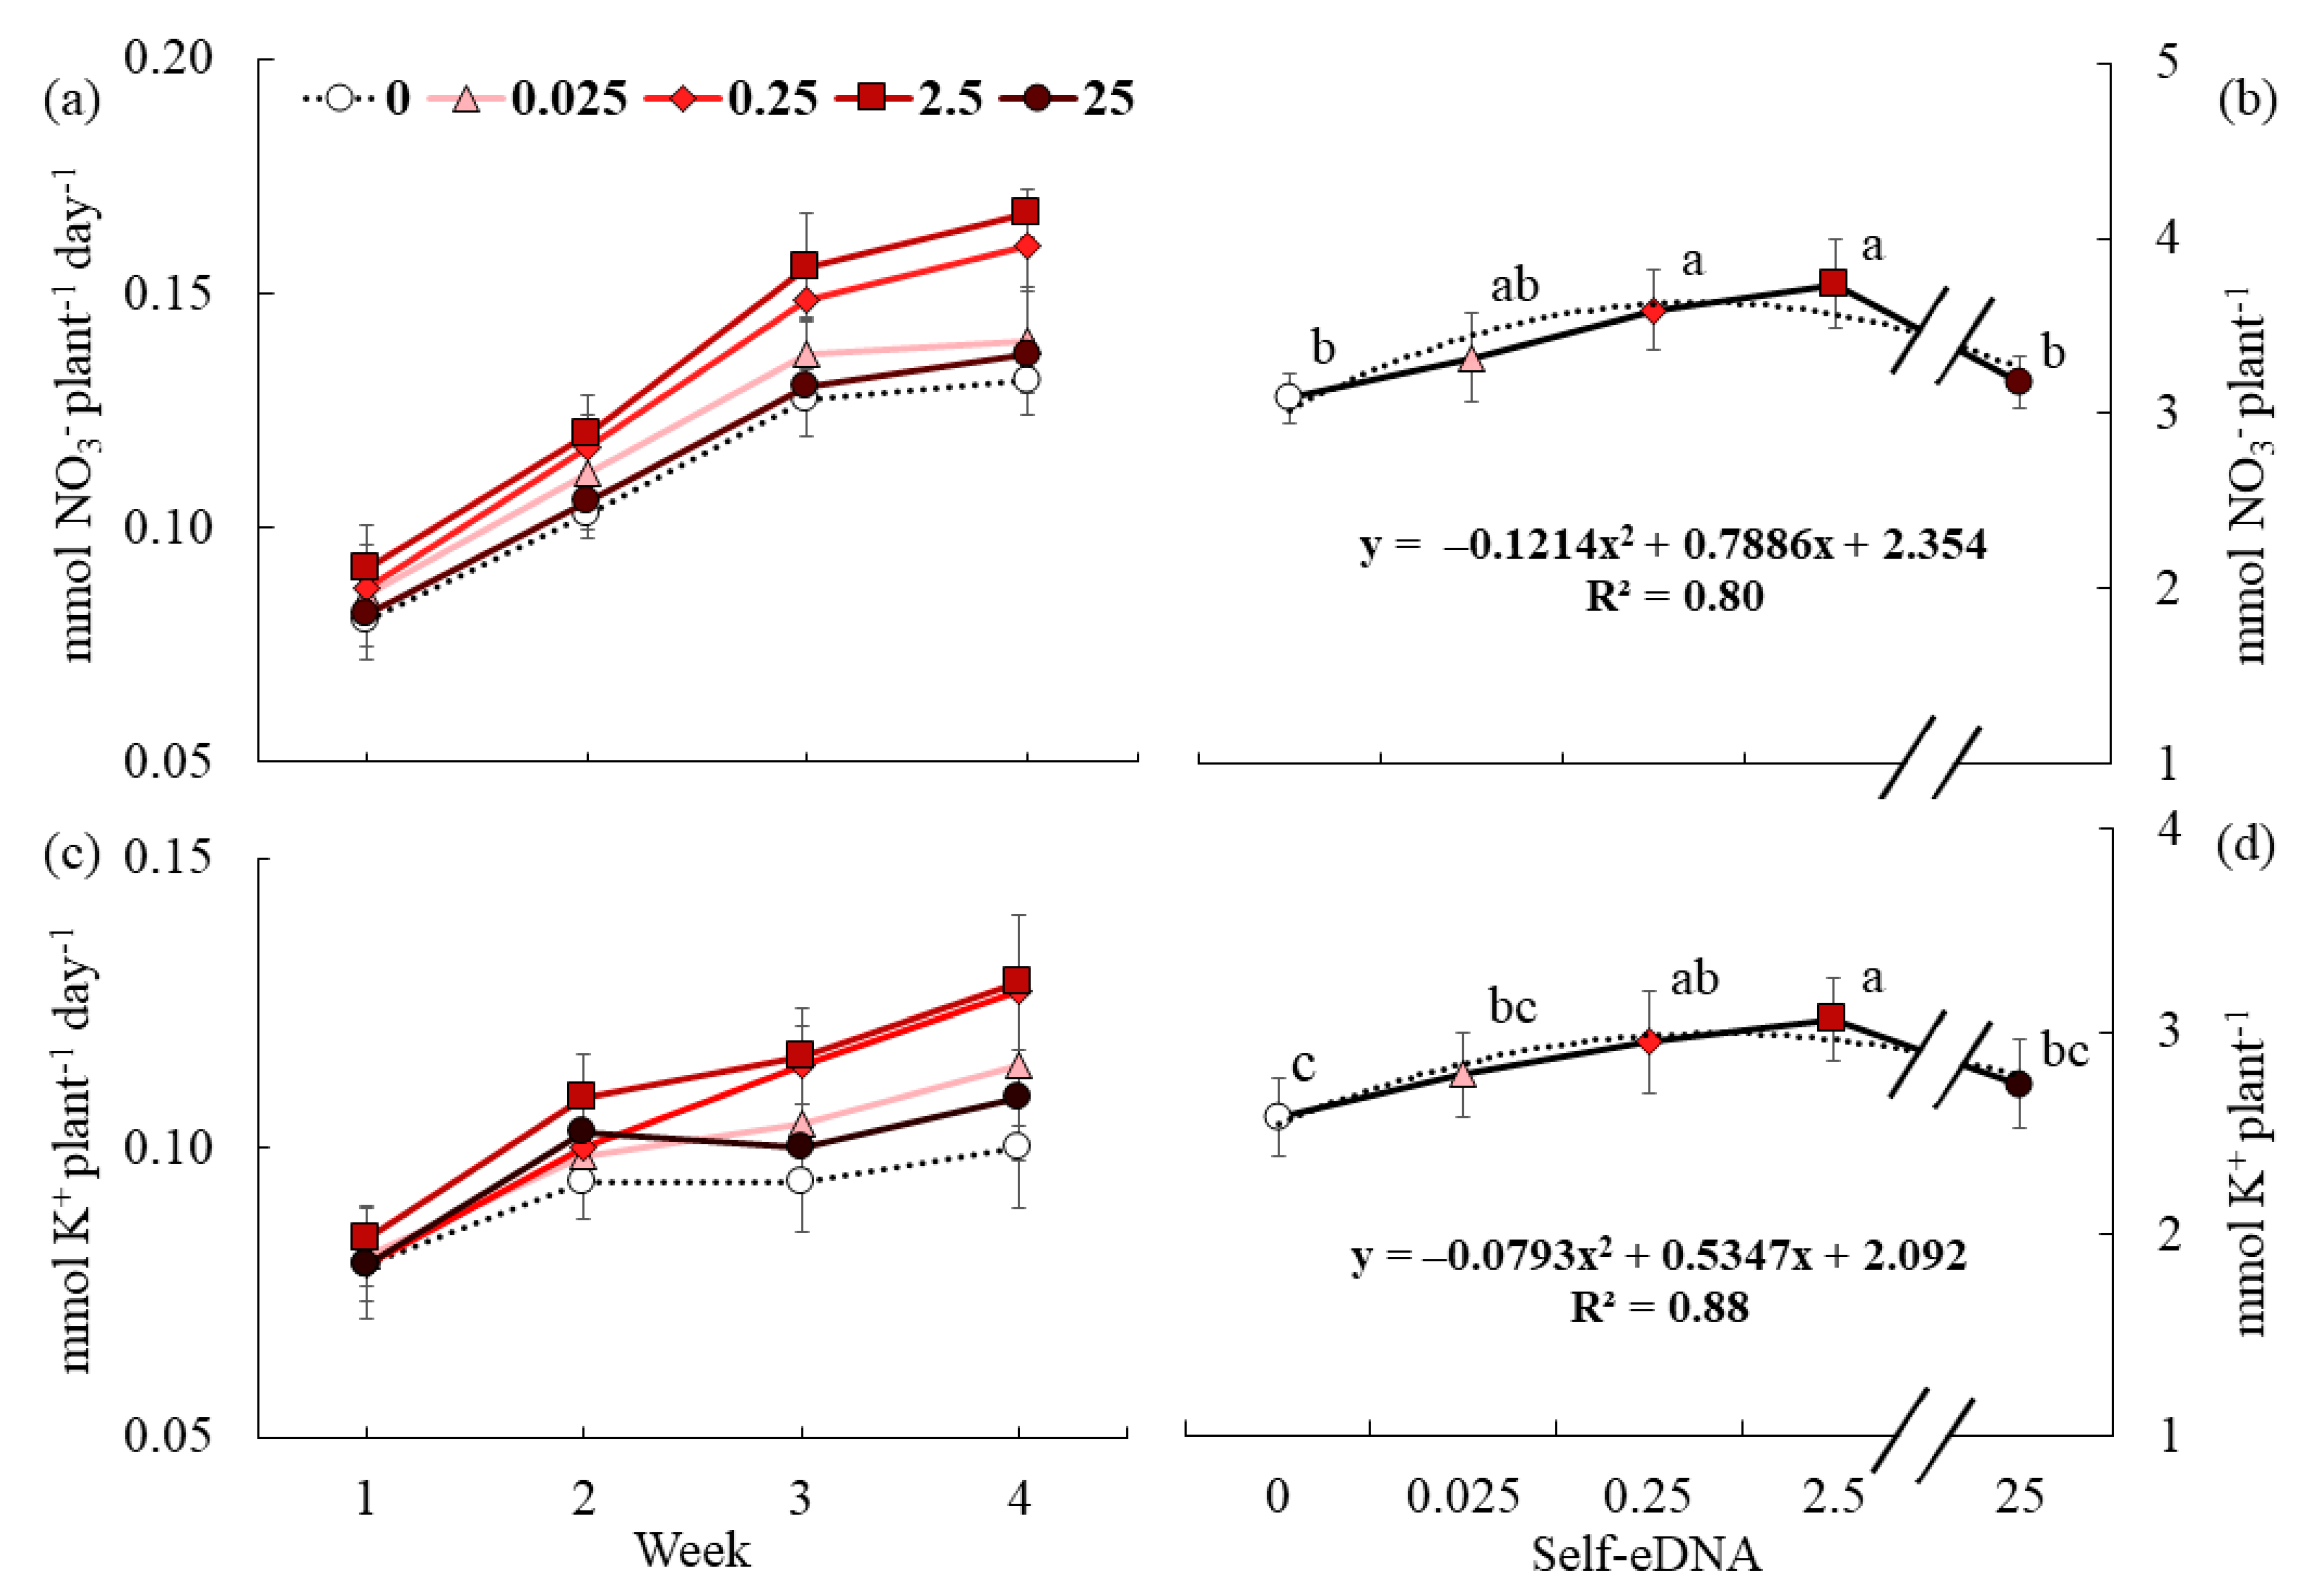
3.2. Effect of Self-eDNA Biostimulation on Fertigation Uptake Parameters of Lettuce

The fraction of volume, electrical conductivity (EC) and pH of the drainage are parameters used to control nutrient solution management and fertigation [22,23,28,29]. The volume fraction was maintained between 0.2 and 0.3 to ensure that the matric potential of water in the substrate remained constant [25].
The EC during plant vegetative growth had an increasing trend, reaching up to four units above the fertigation value at the end of the trial (Figure 3a). The EC of the T4 (25 mg self-eDNA) treatment remained lower than the other treatments. The mean drainage values showed no significant differences within treatments (Figure 3b), with EC one or two units above the supplied fertigation. The average output EC was within the desired limits for the culture [23,30].
Drainage pH showed little significant difference between the treatments and was 0.2 units above fertigation (5.8) after the four weeks of cultivation (Figure 3c). The values expected under vegetative growth conditions in plants such as lettuce are up to one unit above the fertigation pH value [23]. There were no significant differences between treatments (Figure 3d), with a mean value of 6.0.
The drainage fraction, EC and pH of the drainages remained within the ranges considered adequate for monitoring and control of fertigation in a lettuce crop [23].

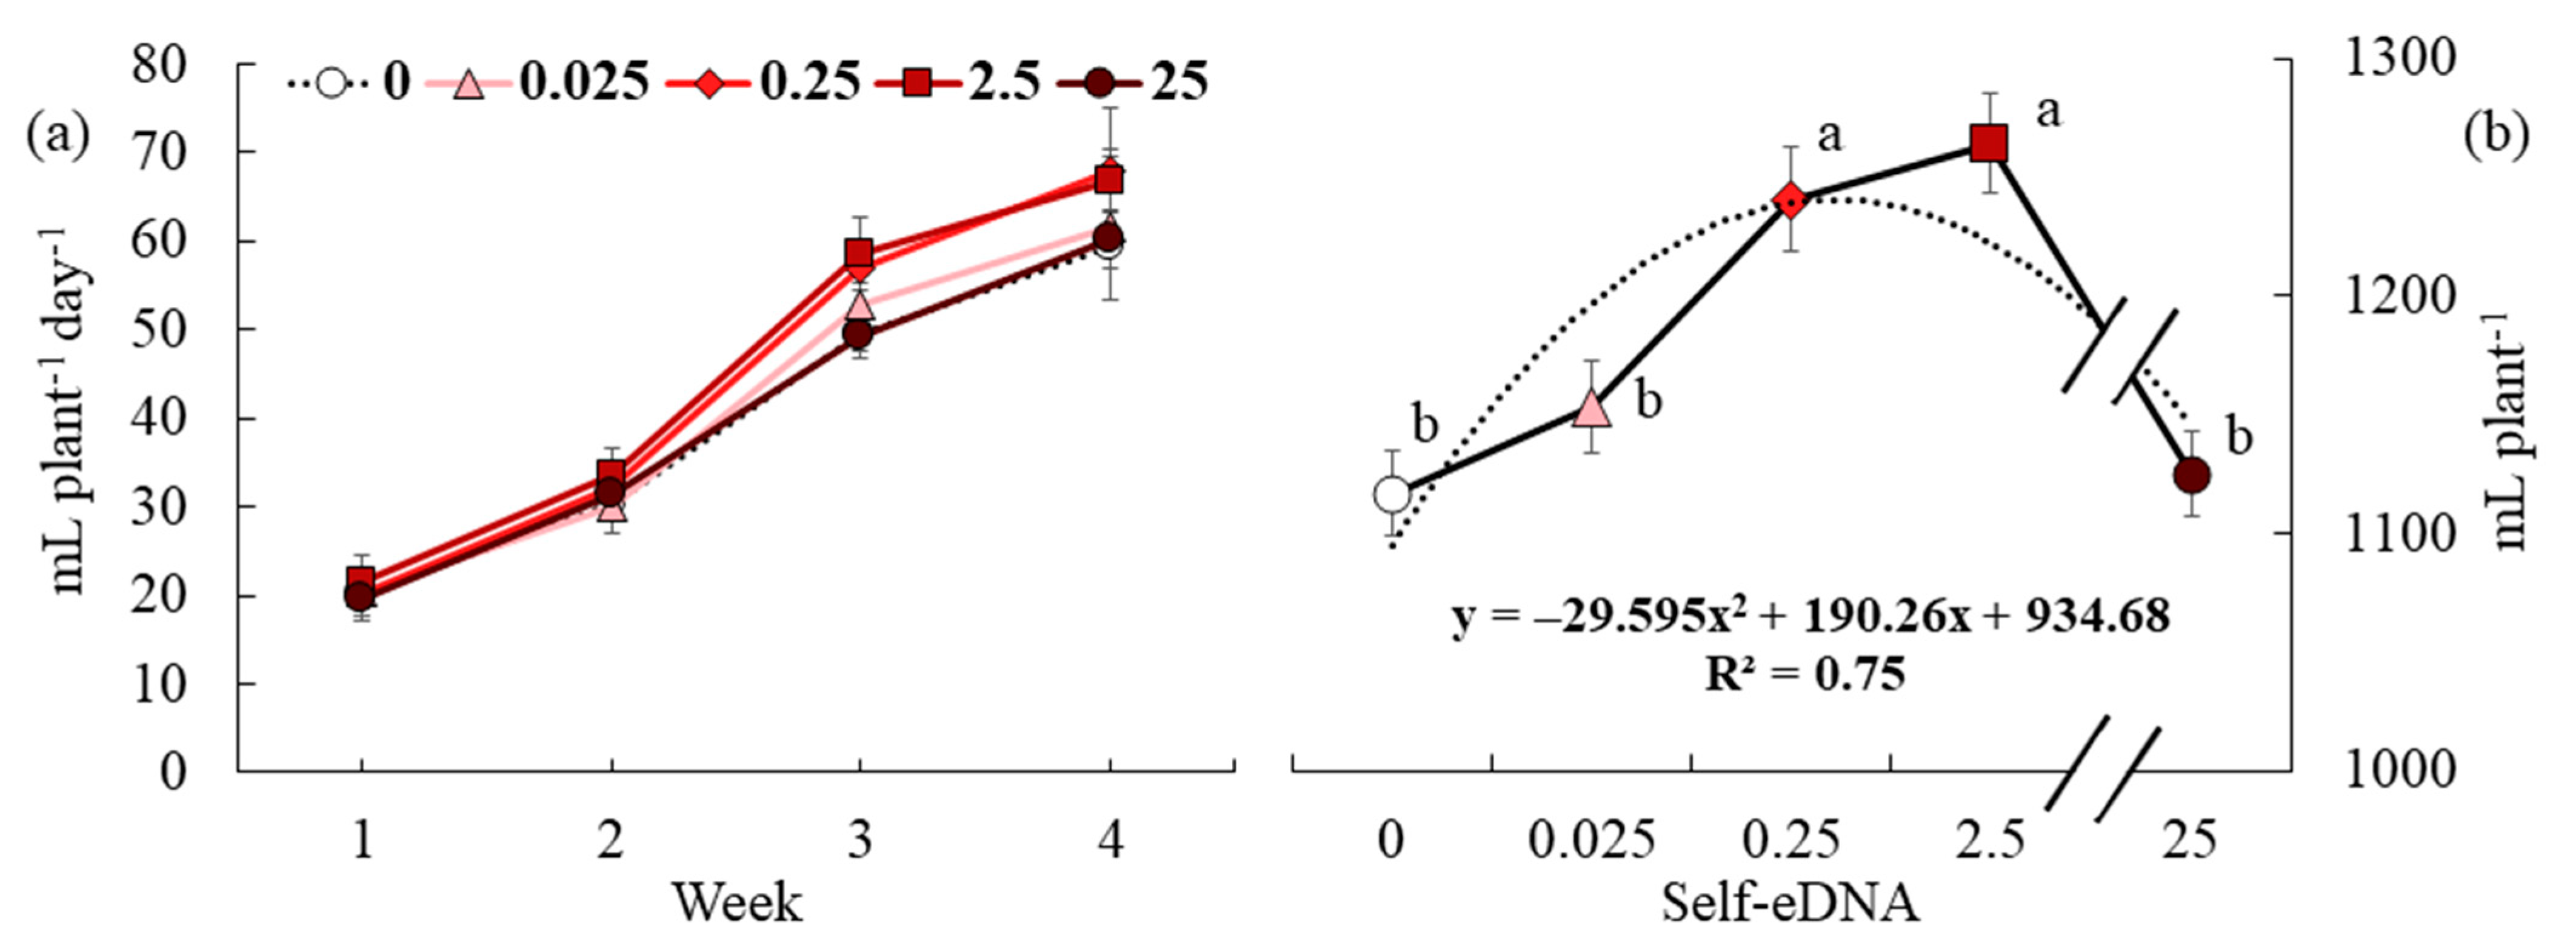
3.3. Effect of Self-eDNA Biostimulation on Water Uptake Parameters of Lettuce

A significant difference in water consumption was recorded after the second week of transplant (Figure 4a), in which applications of 0.25 and 2.5 mg self-eDNA plant−1 had a higher absorption. Considering the complete crop cycle, plants treated with 0.25 to 2.5 mg self-eDNA plant−1 had the highest water absorptions (Figure 4b), which were statistically significant. At the optimum dose (0.25–2.5 mg self-eDNA plant−1), the increase in water uptake was 11%, while at much higher doses (up to 25 mg self-eDNA plant−1), the negative effect was slightly lower (10%).
The biostimulant effect of the application of self-eDNA on water absorption was significant (R2 = 0.75); the highest concentration had an inhibitory effect compared to the maximum (0.25 and 2.5 mg self-eDNA plant−1) of the control treatment.
All measured fertigation uptake parameters were positive and significantly correlated with each other and with growth (Table 1). Water uptake was highly correlated with potassium uptake (r = 0.926) and final dry weight (r = 0.980). These results have an important practical consideration: when using soilless cultivation systems, water uptake is a very easy parameter to measure, and consequently, it is a simpler and more useful indicator to predict the final weight or growth of the crop and can be measured in the early stages of cultivation.

3.4. Effect of Self-eDNA Biostimulation on Nutrient Uptake Parameters of Lettuce

There is a close correlation between fertigation uptake (water and nutrients) and crop yield [31,32,33]. Fertigation uptake values increased at all doses during the weeks of cultivation (Figure 5a,c). For both nitrate and potassium, the trend was very similar to the water absorption trend, where the highest uptakes were for the 0.25 and 2.5 mg self-eDNA plant−1 treatments (17.4% and 15.7%, respectively), which coincided with the values for water uptake (Figure 5b,d).
A significant improvement in the mean total nitrate and potassium uptake occurred with the 0.25 to 2.5 mg of self-eDNA plant−1 treatments compared to the control treatment. The doses below 0.25 and above 2.5 mg self-eDNA plant−1 had a behavior similar to that of water absorption: their correlation coefficients (R2) were above 0.96.
These results indicated that the use of self-eDNA as an agronomic product via fertigation is not phytotoxic and could have a biostimulant effect since the lowest dose (0.25 mg of self-eDNA) followed the NOEL (no observed effect level) point of the hormesis model compared to the control treatment [16].
Little is known about the role of the presence of self-eDNA in plant nutrient uptake, but there is solid evidence that the effects of self-eDNA in plants are induced mostly through the jasmonic acid signaling pathway [7]. ET/JA signaling mediates the regulation of multiple nitrate transporter coding genes expressed particularly in the roots, resulting in a crosstalk between stress tolerance and plant growth via nitrate uptake [34]. A gene expression profile revealed a prominent response from genes related to JA in K starvation of Arabidopsis thaliana [35]. Macronutrient deficiency tolerance is achieved via changes in the expression of several JA biosynthesis-related genes such as PLA1, LOX, AOS, AOC, OPR, ACX and JAR1 in rice plants [36]. The response to nutrient deficiency is different, depending on the time of stress exposure, and this may be translated into stress intensity similar to the concentration of a signal molecule [9,16]. This evidence may explain the biphasic response of plants to the application of DNA depending on the applied dose, with higher doses representing higher stress for plant metabolism.

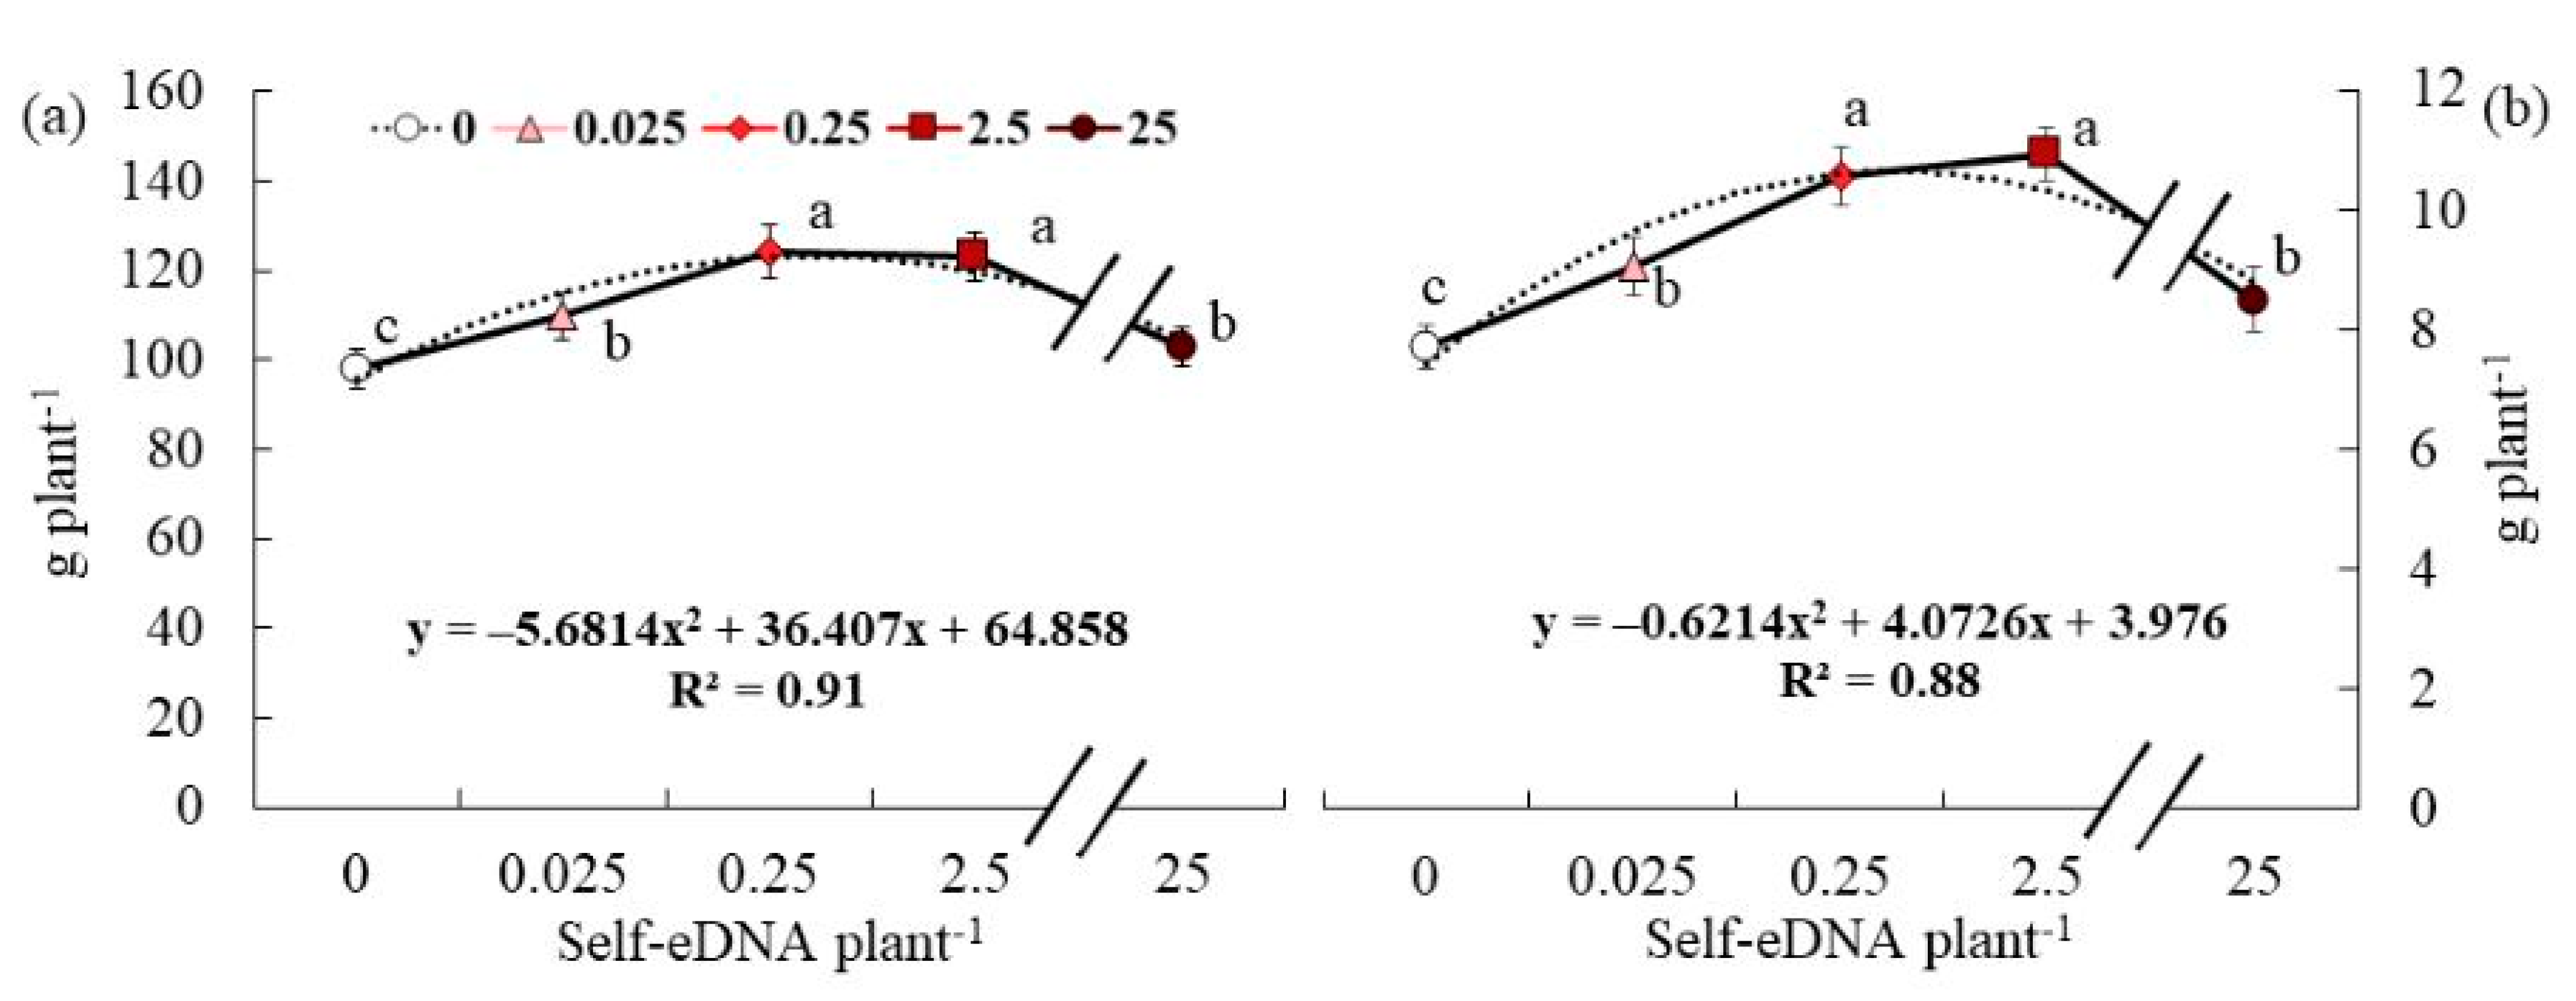
3.5. Effect of Self-eDNA Biostimulation on Growth Parameters of Lettuce

The presence of self-eDNA in the irrigation nutrient solution produced a variation in lettuce biomass production (Figure 6). The fresh and dry weight had a similar trend that was significant; a significant improvement in the weight occurred with the 0.25 to 2.5 mg of self-eDNA plant−1 treatments compared to the control treatment. Doses slightly below (<0.25 mg self-eDNA plant−1) and well above (<2.5 mg self-eDNA plant−1) the optimum showed a very different trend. The application of an optimal dose increased production by 28%, while the decrease that occurred with the higher dose was limited to 21%. This indicates that the biostimulant effect of self-eDNA via fertigation is far superior to the risky phytotoxic effect of a high dose of self-eDNA. This was the dose range that also showed the best results regarding water and nutrient absorption (potassium and nitrate). Water absorption was the parameter that had the greatest correlation with dry (96%) and fresh (93%) weight. Lettuce biomass production showed a hormesis-like effect in response to self-eDNA, which was similar to that observed for water and nutrient consumption in which there was a correlation with the applied dose, but the highest treatment had the opposite effect and elicited the same response as the control. Increased plant weight is often related to a biostimulant effect [37]. The biostimulant effect is modulated by treatment doses following a hormetic curve described by an early stimulatory effect and a late inhibitory effect [38]. The hormetic effect of a biostimulant can differ regarding factors such as plant species [14,39], so an adequate characterization of the effect is necessary for each system, even with the same biostimulant. Based on the hypothesis of the hormetic behavior of biostimulants, the highest dose evaluated in this work would be determined as the NOAEL [16].

4. Conclusions

The application of 0.25 and 2.5 mg of self-eDNA using fertigation had a higher biostimulant effect on the nutrient absorption and growth of lettuce, probably due to an effect of DAMP in the crop. Nevertheless, we suggest further work with other vegetables and stress indicator metabolites could require an understanding of the specific mechanism and the selective benefits through the immunity response. Plant biostimulation via the application of self-eDNA using the fertigation solution suggests the possible future development of an organic and sustainable agricultural treatment that is easy to apply with the goal of enhancing plant growth and production yields.
Assuming that the extraction of DNA from the same crop has a cost and that the potential biostimulant effect occurs at relatively low doses (0.25 to 2.5 mg DNA plant−1) but not at the highest doses would allow self-eDNA to be used as a useful agricultural product, since this amount could have an adequate cost–benefit ratio.

Author Contributions

Conceptualization, T.P.L.C.-C. and M.U.; methodology, T.P.L.C.-C., M.U. and R.G.G.-G.; software, I.A.C.-V., I.M., J.B.R. and R.O.; validation, I.A.C.-V., I.M., J.B.R. and R.O.; formal analysis, I.A.C.-V., I.M., J.B.R. and R.O.; investigation, J.B.R., T.P.L.C.-C. and M.U.; resources, T.P.L.C.-C. and M.U.; data curation, J.B.R., T.P.L.C.-C. and M.U.; writing—original draft preparation, I.A.C.-V., R.G.G.-G., T.P.L.C.-C. and M.U.; writing—review and editing, I.A.C.-V., J.B.R., T.P.L.C.-C. and M.U.; visualization, I.A.C.-V., I.M., J.B.R. and R.O.; supervision, T.P.L.C.-C. and M.U.; project administration, T.P.L.C.-C. and M.U.; funding acquisition, T.P.L.C.-C. and M.U. All authors have read and agreed to the published version of the manuscript.

Funding

This publication is part of project no. AEI/10.13039/501100011033/FEDER, UE, funded by MCIN/AEI/10.13039/501100011033/FEDER, UE, where AEI/10.13039/501100011033/FEDER, UE, is the reference in the award resolution; MCIN is the acronym for the Ministry of Science and Innovation; AEI is the acronym for the State Research Agency; 10.13039/501100011033 is the DOI (digital object identifier) of the agency; and FEDER is the acronym for the European Regional Development Fund.

Data Availability Statement

The raw data supporting the conclusions of this article will be made available by the authors on request.

Conflicts of Interest

The authors declare no conflicts of interest. The funders had no role in the design of the study; in the collection, analyses or interpretation of data; in the writing of the manuscript; or in the decision to publish the results.

References

  1. Duran-Flores, D.; Heil, M. Extracellular self-DNA as a damage-associated molecular pattern (DAMP) that triggers self-specific immunity induction in plants. Brain Behav. Immun. 2018, 72, 78–88. [Google Scholar] [CrossRef] [PubMed]
  2. Barbero, F.; Guglielmotto, M.; Capuzzo, A.; Maffei, M.E. Extracellular self-DNA (esDNA), but not heterologous plant or insect DNA (etDNA), induces plasma membrane depolarization and calcium signaling in lima bean (Phaseolus lunatus) and maize (Zea mays). Int. J. Mol. Sci. 2016, 17, 1659. [Google Scholar] [CrossRef] [PubMed]
  3. Vega-Muñoz, I.; Feregrino-Pérez, A.A.; Torres-Pacheco, I.; Guevara-González, R.G. Exogenous fragmented DNA acts as a damage-Associated molecular pattern (DAMP) inducing changes in CpG DNA methylation and defence-related responses in Lactuca sativa. Funct. Plant Biol. 2018, 45, 1065–1072. [Google Scholar] [CrossRef] [PubMed]
  4. Barbero, F.; Guglielmotto, M.; Islam, M.; Maffei, M.E. Extracellular fragmented self-DNA is involved in plant responses to biotic stress. Front. Plant Sci. 2021, 12, 686121. [Google Scholar] [CrossRef] [PubMed]
  5. Chiusano, M.L.; Incerti, G.; Colantuono, C.; Termolino, P.; Palomba, E.; Monticolo, F.; Benvenuto, G.; Foscari, A.; Esposito, A.; Marti, L.; et al. Arabidopsis thaliana response to extracellular DNA:Self versus nonself exposure. Plants 2021, 10, 1744. [Google Scholar] [CrossRef] [PubMed]
  6. Carbajal-Valenzuela, I.A.; Guzmán-Cruz, R.; González-Chavira, M.M.; Medina-Ramos, G.; Serrano-Jamaica, L.M.; Torres-Pacheco, I.; Vázquez, L.; Feregrino-Pérez, A.A.; Rico-García, E.; Guevara-González, R.G. Response of plant immunity markers to early and late application of extracellular DNA from different sources in tomato (Solanum lycopersicum). Agriculture 2022, 12, 1587. [Google Scholar] [CrossRef]
  7. Zhou, X.; Gao, H.; Zhang, X.; Khashi, U.; Rahman, M.; Mazzoleni, S.; Du, M.; Wu, F. Plant extracellular self-DNA inhibits growth and induces immunity via the jasmonate signaling pathway. Plant Physiol. 2023, 192, 2475–2491. [Google Scholar] [CrossRef]
  8. Serrano-Jamaica, L.M.; Villordo-Pineda, E.; González-Chavira, M.M.; Guevara-González, R.G.; Medina-Ramos, G. Effect of fragmented DNA from plant pathogens on the protection against wilt and root rot of Capsicum annuum L. plants. Front. Plant Sci. 2021, 11, 581891. [Google Scholar] [CrossRef]
  9. Ferrusquía-Jiménez, N.I.; Chandrakasan, G.; Torres-Pacheco, I.; Rico-Garcia, E.; Feregrino-Perez, A.A.; Guevara-González, R.G. Extracellular DNA: A relevant plant damage-associated molecular pattern (DAMP) for crop protection against pests—A review. J. Plant Growth Regul. 2020, 40, 451–463. [Google Scholar] [CrossRef]
  10. Cedillo-Jiménez, C.A.; Guevara-González, R.G.; Hernández, A.C. Exogenous dsRNA sequence based on miR1917 downregulates its target gene related to ethylene signaling in tomato seedlings and fruit. Sci. Hortic. 2024, 331, 113090. [Google Scholar] [CrossRef]
  11. Carbajal-Valenzuela, I.A.; Medina-Ramos, G.; Caicedo-Lopez, L.H.; Jim, A.; Ortega-Torres, A.E.; Contreras-Medina, L.M.; Torres-Pacheco, I. Extracellular DNA: Insight of a signal molecule in crop protection. Biology 2021, 10, 1022. [Google Scholar] [CrossRef] [PubMed]
  12. Dipak-Kumar, H.; Aloke, P. Role of biostimulant formulations in crop production: An overview. Int. J. Agric. Sci. Vet. Med. 2020, 8, 38–46. [Google Scholar]
  13. Baltazar, M.; Correia, S.; Guinan, K.J.; Sujeeth, N.; Bragança, R.; Gonçalves, B. Recent advances in the molecular effects of biostimulants in plants: An overview. Biomolecules 2021, 11, 1096. [Google Scholar] [CrossRef] [PubMed]
  14. Jardin, P.D. Plant biostimulants: Definition, concept, main categories and regulation. Sci. Hortic. 2015, 30, 3–14. [Google Scholar] [CrossRef]
  15. Sible, C.N.; Seebauer, J.R.; Below, F.E. Plant biostimulants: A categorical review, their implications for row crop production, and relation to soil health indicators. Agronomy 2021, 11, 1297. [Google Scholar] [CrossRef]
  16. Godinez-Mendoza, P.L.; Rico-Chavez, A.K.; Ferrusquia-Jimenez, N.I.; Carbajal-Valenzuela, I.A.; Villagomez-Aranda, A.L.; Torres-Pacheco, I.; Guevara-González, R.G. Plant hormesis: Revising of the concepts of biostimulation, elicitation and their application in a sustainable agricultural production. Sci. Total Environ. 2023, 894, 164883. [Google Scholar] [CrossRef]
  17. Sonneveld, C.; Voogt, W. Plant Nutrition of Greenhouse Crops, 1st ed.; Springer: Dordrecht, The Netherlands; Heidelberg, Germany; London, UK; New York, NY, USA, 2009; 431p. [Google Scholar]
  18. Camejo, D.; Frutos, A.; Mestre, T.C.; Piñero, M.C.; Rivero, R.M.; Martínez, V. Artificial light impacts the physical and nutritional quality of lettuce plants. Hortic. Environ. Biotechnol. 2020, 61, 69–82. [Google Scholar] [CrossRef]
  19. FAO Annual Production Volume of Lettuce in the World between 2012 and 2021. Available online: https://es.statista.com/estadisticas/529438/producciones-de-lechugas-en-el-mundo/ (accessed on 4 August 2024).
  20. Gruda, N.S. Increasing sustainability of growing media constituents and stand-alone substrates in soilless culture systems. Agronomy 2020, 9, 298. [Google Scholar] [CrossRef]
  21. Choudhary, D.K.; Prakash, A.; Johri, B.N. Induced systemic resistance (ISR) in plants: Mechanism of action. Indian J. Microbiol. 2007, 47, 289–297. [Google Scholar] [CrossRef]
  22. Rodríguez, D.; Reca, J.; Martínez, J.; Lao, M.T.; Urrestarazu, M. Effect of controlling the leaching fraction on the fertigation and production of a tomato crop under soilless culture. Sci. Hortic. 2014, 179, 153–157. [Google Scholar] [CrossRef]
  23. Urrestarazu, M.; Carrasco, G. Soilless Culture and Hydroponics, 1st ed.; Mundi-Prensa: Madrid, Spain, 2023; 279p. [Google Scholar]
  24. Rodríguez, D.; Reca, J.; Martínez, J.; López-Luque, R.; Urrestarazu, M. Development of a new control algorithm for automatic irrigation scheduling in soilless culture. Appl. Math Inf. Sci. 2015, 9, 47–56. [Google Scholar] [CrossRef]
  25. Peçanha, D.A.; Cunha-Chiamolera, T.P.L.; Chourak, Y.; Martínez-Rivera, E.Y.; Urrestarazu, M. Effect of the matric potential on growth and water, nitrate and potassium absorption of vegetables under soilless culture. J. Soil Sci. Plant Nutr. 2021, 21, 3493–3501. [Google Scholar] [CrossRef]
  26. Sonneveld, C.; Straver, N.B. Nutrient Solution for Vegetables and Flowers Grown in Water or Substrates, 10th ed.; Glasshouse Crops Research Station: Naaldwijk, The Netherlands, 1994; pp. 1–33. [Google Scholar]
  27. Petersen, R.G. Agricultural Field Experiments: Design and Analysis, 1st ed.; Marcel Dekker: New York, NY, USA, 1994; 409p. [Google Scholar]
  28. Gorbe, E.; Calatayud, A. Optimization of nutrition in soilless systems: A review. Adv. Bot. Res. 2010, 53, 193–245. [Google Scholar] [CrossRef]
  29. Moya, C.; Oyanedel, E.; Verdugo, G.; Flores, M.F.; Urrestarazu, M.; Álvaro, J.E. Increased electrical conductivity in nutrient solution management enhances dietary and organoleptic qualities in soilless culture tomato. HortScience 2017, 52, 868–872. [Google Scholar] [CrossRef]
  30. Cunha-Chiamolera, T.P.L.; Urrestarazu, M.; Cecílio-Filho, A.B.; Morales, I. Agronomic and economic feasibility of tomato and lettuce intercropping in a soilless system as a function of the electrical conductivity of the nutrient solution. HortScience 2017, 52, 1195–1200. [Google Scholar] [CrossRef]
  31. Carvalho, R.S.C.; Bastos, R.G.; Souza, C.F. Influence of the use of wastewater on nutrient absorption and production of lettuce grown in a hydroponic system. Agric. Water Manag. 2018, 203, 311–321. [Google Scholar] [CrossRef]
  32. Cecílio-Filho, A.B.; Coelho, R.L.; Cunha, T.P.L.; Urrestarazu, M. Nitrogen efficiency in hydroponic chicory. J. Plant Nutr. 2017, 40, 2532–2539. [Google Scholar] [CrossRef]
  33. Wamser, A.F.; Cecílio Filho, A.B.; Nowaki, R.H.D.; Mendoza-Cortez, J.W.; Urrestarazu, M. Influence of drainage and nutrient-solution nitrogen and potassium concentrations on the agronomic behavior of bell-pepper plants cultivated in a substrate. PloS ONE 2017, 12, e0180529. [Google Scholar] [CrossRef]
  34. Zhang, G.; Yi, H.Y.B.; Gong, J.M. The Arabidopsis Ethylene/Jasmonic acid-NRT signaling module coordinates nitrate reallocation and the trade-off between growth and environmental adaptation. Plant Cell 2014, 26, 3984–3998. [Google Scholar] [CrossRef]
  35. Armengaud, P.; Breitling, R.; Amtmann, A. The potassium-dependent transcriptome of arabidopsis reveals a prominent role of jasmonic acid in nutrient signaling. Plant Physiol. 2004, 136, 2556–2576. [Google Scholar] [CrossRef]
  36. Singh, D.A. Expression dynamics indicate the role of Jasmonic acid biosynthesis pathway in regulating macronutrient (N, P and K+) deficiency tolerance in rice (Oryza sativa L.). Plant Cell Rep. 2021, 40, 1495–1512. [Google Scholar] [CrossRef]
  37. Cardarelli, M.; Rouphael, Y.; Coppa, E.; Hoagland, L. Using microgranular-based biostimulant in vegetable transplant production to enhance growth and nitrogen uptake. Agronomy 2020, 10, 842. [Google Scholar] [CrossRef]
  38. Vargas-Hernandez, M.; Macias-Bobadilla, I.; Guevara-Gonzalez, R.G.; Romero-Gomez, S.J.; Rico-Garcia, E.; Ocampo-Velazquez, R.V.; Alvarez-Arquieta, L.L.; Torres-Pacheco, I. Plant hormesis management with biostimulants of biotic origin in agriculture. Front. Plant Sci. 2017, 8, 1762. [Google Scholar] [CrossRef] [PubMed]
  39. García-Mier, L.; Guevara-González, R.G.; Mondragón-Olguín, V.M.; Verduzco-Cuellar, B.R.; Torres-Pacheco, I. Agriculture and bioactives: Achieving both crop yield and phytochemicals. Int. J. Mol. Sci. 2013, 14, 4203–4222. [Google Scholar] [CrossRef]
Figure 1. Methodology used for DNA extraction in lettuce and its application via fertigation reported by Carbajal-Valenzuela et al. [6].
Horticulturae 10 00964 g001
Figure 2. Agarose gel electrophoresis of different DNA solutions stored at room temperature for 1, 4, 10 and 15 days. First lane shows the 2500-base-pair (bp) molecular marker.
Horticulturae 10 00964 g002
Figure 3. Electrical conductivity (EC) per week (a), average EC (b), pH per week (c) and average pH (d) of drainage of lettuce grown in soilless culture that was subjected to different self-eDNA treatments (mg DNA plant−1) using fertigation. Different letters indicate significant differences (p ≤ 0.05) according to Tukey’s test.
Horticulturae 10 00964 g003
Figure 4. Water uptake per week (a) and total water uptake (b) of lettuce crops in soilless culture subjected to different self-eDNA treatments (mg DNA plant−1) using fertigation. Different letters indicate significant differences (p ≤ 0.05) according to Tukey’s test.
Horticulturae 10 00964 g004
Figure 5. Uptake of nitrate per week (a), total nitrate (b), potassium per week (c) and total potassium (d) of lettuce crops in soilless culture subjected to different self-eDNA treatments (mg DNA plant−1) using fertigation. Different letters indicate significant differences (p ≤ 0.05) according to Tukey’s test.
Horticulturae 10 00964 g005
Figure 6. Fresh (a) and dry (b) mass of lettuce crops in soilless culture that were subjected to different self-eDNA treatments (mg DNA plant−1) using fertigation. Different letters indicate significant differences (p ≤ 0.05) according to Tukey’s test.
Horticulturae 10 00964 g006
Table 1. Pearson’s correlation matrix, p values versus degrees of freedom (n = 20) and the coefficient R2 corresponding to growth and the rest of evaluated variables of lettuce grown in soilless culture that was subjected to different treatments with self-eDNA using fertigation.
DrainageAbsorptionGrowth
ECpHWaterNO3K+FWDW
pH−0.0352 ns ------
Water0.7025 ***0.0168 ns-----
NO30.6904 ***−0.0111 ns0.9714 ***----
K+0.6012 ** 0.0442 ns0.9256 ***0.9421 ***---
FW0.7463 ***0.0682 ns0.9665 ***0.9434 ***0.9284 ***--
DW0.7012 ***−0.0052 ns 0.9802 ***0.9778 ***0.9600 ***0.9710 ***-
DNA−0.7911 ***−0.0192 ns −0.3903 ns −0.3431 ns −0.1598 ns −0.3258 ns −0.3016 ns
pH0.00------
Water0.490.00-----
NO30.470.000.94----
K+0.360.000.860.89---
FW0.560.010.930.890.86--
DW0.490.000.960.960.920.94-
DNA0.630.000.150.120.020.110.09
***, **, and ns indicate significance at p ≤ 0.001, p ≤ 0.01, and no significance, respectively. FW and DW are fresh and dry weight, respectively.
Disclaimer/Publisher’s Note: The statements, opinions and data contained in all publications are solely those of the individual author(s) and contributor(s) and not of MDPI and/or the editor(s). MDPI and/or the editor(s) disclaim responsibility for any injury to people or property resulting from any ideas, methods, instructions or products referred to in the content.

