Article

Balancing Yield and Sustainability: A Comparative Analysis of Supplemental Lighting in Commercial-Scale Cucumber Cultivation

by
Seyed Mohammad Hashemi
1,2,*,
Andrzej Kurenda
3,
Selin Karatepe
1 and
Nick A. Savidov
2,*
1
The Centre for Applied Research, Innovation and Entrepreneurship, Lethbridge Polytechnic, Lethbridge, AB T1K 1L6, Canada
2
Integrated Agriculture Technology Centre, Lethbridge Polytechnic, Lethbridge, AB T1K 1L6, Canada
3
Vivent SA, Rue Mauverney 28, 1196 Gland, Switzerland
*
Authors to whom correspondence should be addressed.
Horticulturae 2025, 11(1), 79; https://doi.org/10.3390/horticulturae11010079
Submission received: 25 November 2024 / Revised: 7 January 2025 / Accepted: 8 January 2025 / Published: 13 January 2025
(This article belongs to the Section Protected Culture)

Abstract

:
Lighting is a fundamental driver of plant productivity in controlled-environment agriculture (CEA), directly affecting physiological processes, resource efficiency, and sustainability. This study evaluates the effects of distinct lighting systems, industrial Light-Emitting Diodes (iLEDs), horticultural LEDs (hLEDs), high-pressure sodium (HPS) lamps, and controls (no supplemental light), each providing unique light spectra, on cucumber (Cucumis sativus L.) growth, physiology, and environmental impact under a controlled light intensity of 250 µmol m−2 s−1 in a commercial CEA setup. The results indicated that iLEDs enhance intrinsic water use efficiency (35.65 µmol CO2/mol H2O) and reduce transpiration, reflecting superior physiological resource use. Electrophysiological measurements indicated significantly more stable stress responses in plants subjected to iLEDs and hLEDs as compared to HPS and control treatments, indicating the effectiveness of LED light spectra in mitigating stress-related physiological impacts. Furthermore, compact growth and shorter stem internodes were observed under iLEDs as well as hLEDs, highlighting the spectral effects on photomorphogenesis, likely caused by a balanced light spectrum. HPS lighting achieved the highest yield (42.86 kg m−2) but at a significant environmental cost, with 342.65 kg CO2e m−2 emissions compared to 204.29 kg CO2e m−2 for iLEDs, with competitive yield of 38.84 kg m−2. Economic analysis revealed that iLEDs also offered the most cost-effective solution due to lower energy consumption and extended lifespan. This study focused on the interaction between light spectra, photosynthetic performance, stress resilience, and resource efficiency, advancing sustainable strategies for energy-efficient food production in CEA systems.

1. Introduction

By 2050, the global population is projected to reach nearly 10 billion, necessitating a 70% increase in worldwide food production [1,2]. Conventional agriculture, constrained by land degradation, water scarcity, and climate variability, faces significant challenges in meeting this demand sustainably [3,4]. Controlled Environment Agriculture (CEA), including greenhouse systems, has emerged as a promising solution by providing optimized growing conditions that enhance crop yields while minimizing resource use and environmental impact [5]. Within CEA systems, supplemental lighting is one of the most critical factors influencing plant productivity, as it directly affects photosynthesis, growth, and physiological processes [6,7,8].
For light-demanding crops such as cucumber (Cucumis sativus L.), supplemental lighting is essential to optimize photosynthetic efficiency and productivity, particularly in regions where the Daily Light Integral (DLI) is insufficient during winter months [9]. Traditionally, High-Pressure Sodium (HPS) lamps have been the predominant choice for greenhouse growers due to their high red light output (600–700 nm), which is effective in enhancing photosynthesis and biomass accumulation [10]. However, these lamps have notable limitations, including lack of adequate blue light (400–500 nm) (Figure 1), substantial energy consumption, significant heat emission, and a substantial environmental footprint. These drawbacks have driven interest in alternatives with more balanced spectra and sustainability, such as Light Emitting Diodes (LEDs) [11,12].
LEDs offer distinct advantages, including customizable light spectra, lower energy requirements, and reduced carbon emissions, positioning them as pivotal tools for sustainable greenhouse production [13,14,15]. Full spectrum horticultural LEDs (hLEDs), with higher technical advancement (Table S3), provide a balance of red, blue, and green light (Figure 1) and are designed to optimize various growth parameters, such as plant flowering induction, compact growth, and photosynthetic efficiency [12,16]. Despite their efficacy in supporting plants’ diverse growth requirements, the high initial cost remains a barrier, particularly for large-scale commercial greenhouses [15,17,18].
To address this, industrial LEDs (iLEDs), originally developed for non-agricultural applications, have emerged as a cost-effective alternative (Figure 1 and Table S3). While previous studies have highlighted the resource efficiency of LEDs [19,20], the potential of iLEDs for agricultural use, particularly their impact on plant physiology, electrophysiology, and stress responses, remains underexplored. Understanding how iLEDs compare to hLEDs and HPS in terms of spectral suitability, energy consumption, and crop performance is critical for advancing greenhouse lighting strategies [21,22]. Furthermore, the interactions between yield optimization, energy consumption, and environmental sustainability require further investigation to develop advanced lighting strategies that align with the principles of sustainable agriculture [23,24].
This study aims to examine the impact of spectral properties from various supplemental lighting systems including HPS, iLEDs, and hLEDs on cucumber physiology, photosynthetic performance, stress responses, resource use efficiency, and environmental sustainability. The findings provide critical insights into resource-efficient lighting strategies that optimize cucumber productivity while reducing environmental impacts, contributing to sustainable and economically viable agricultural practices in CEA.

2. Results

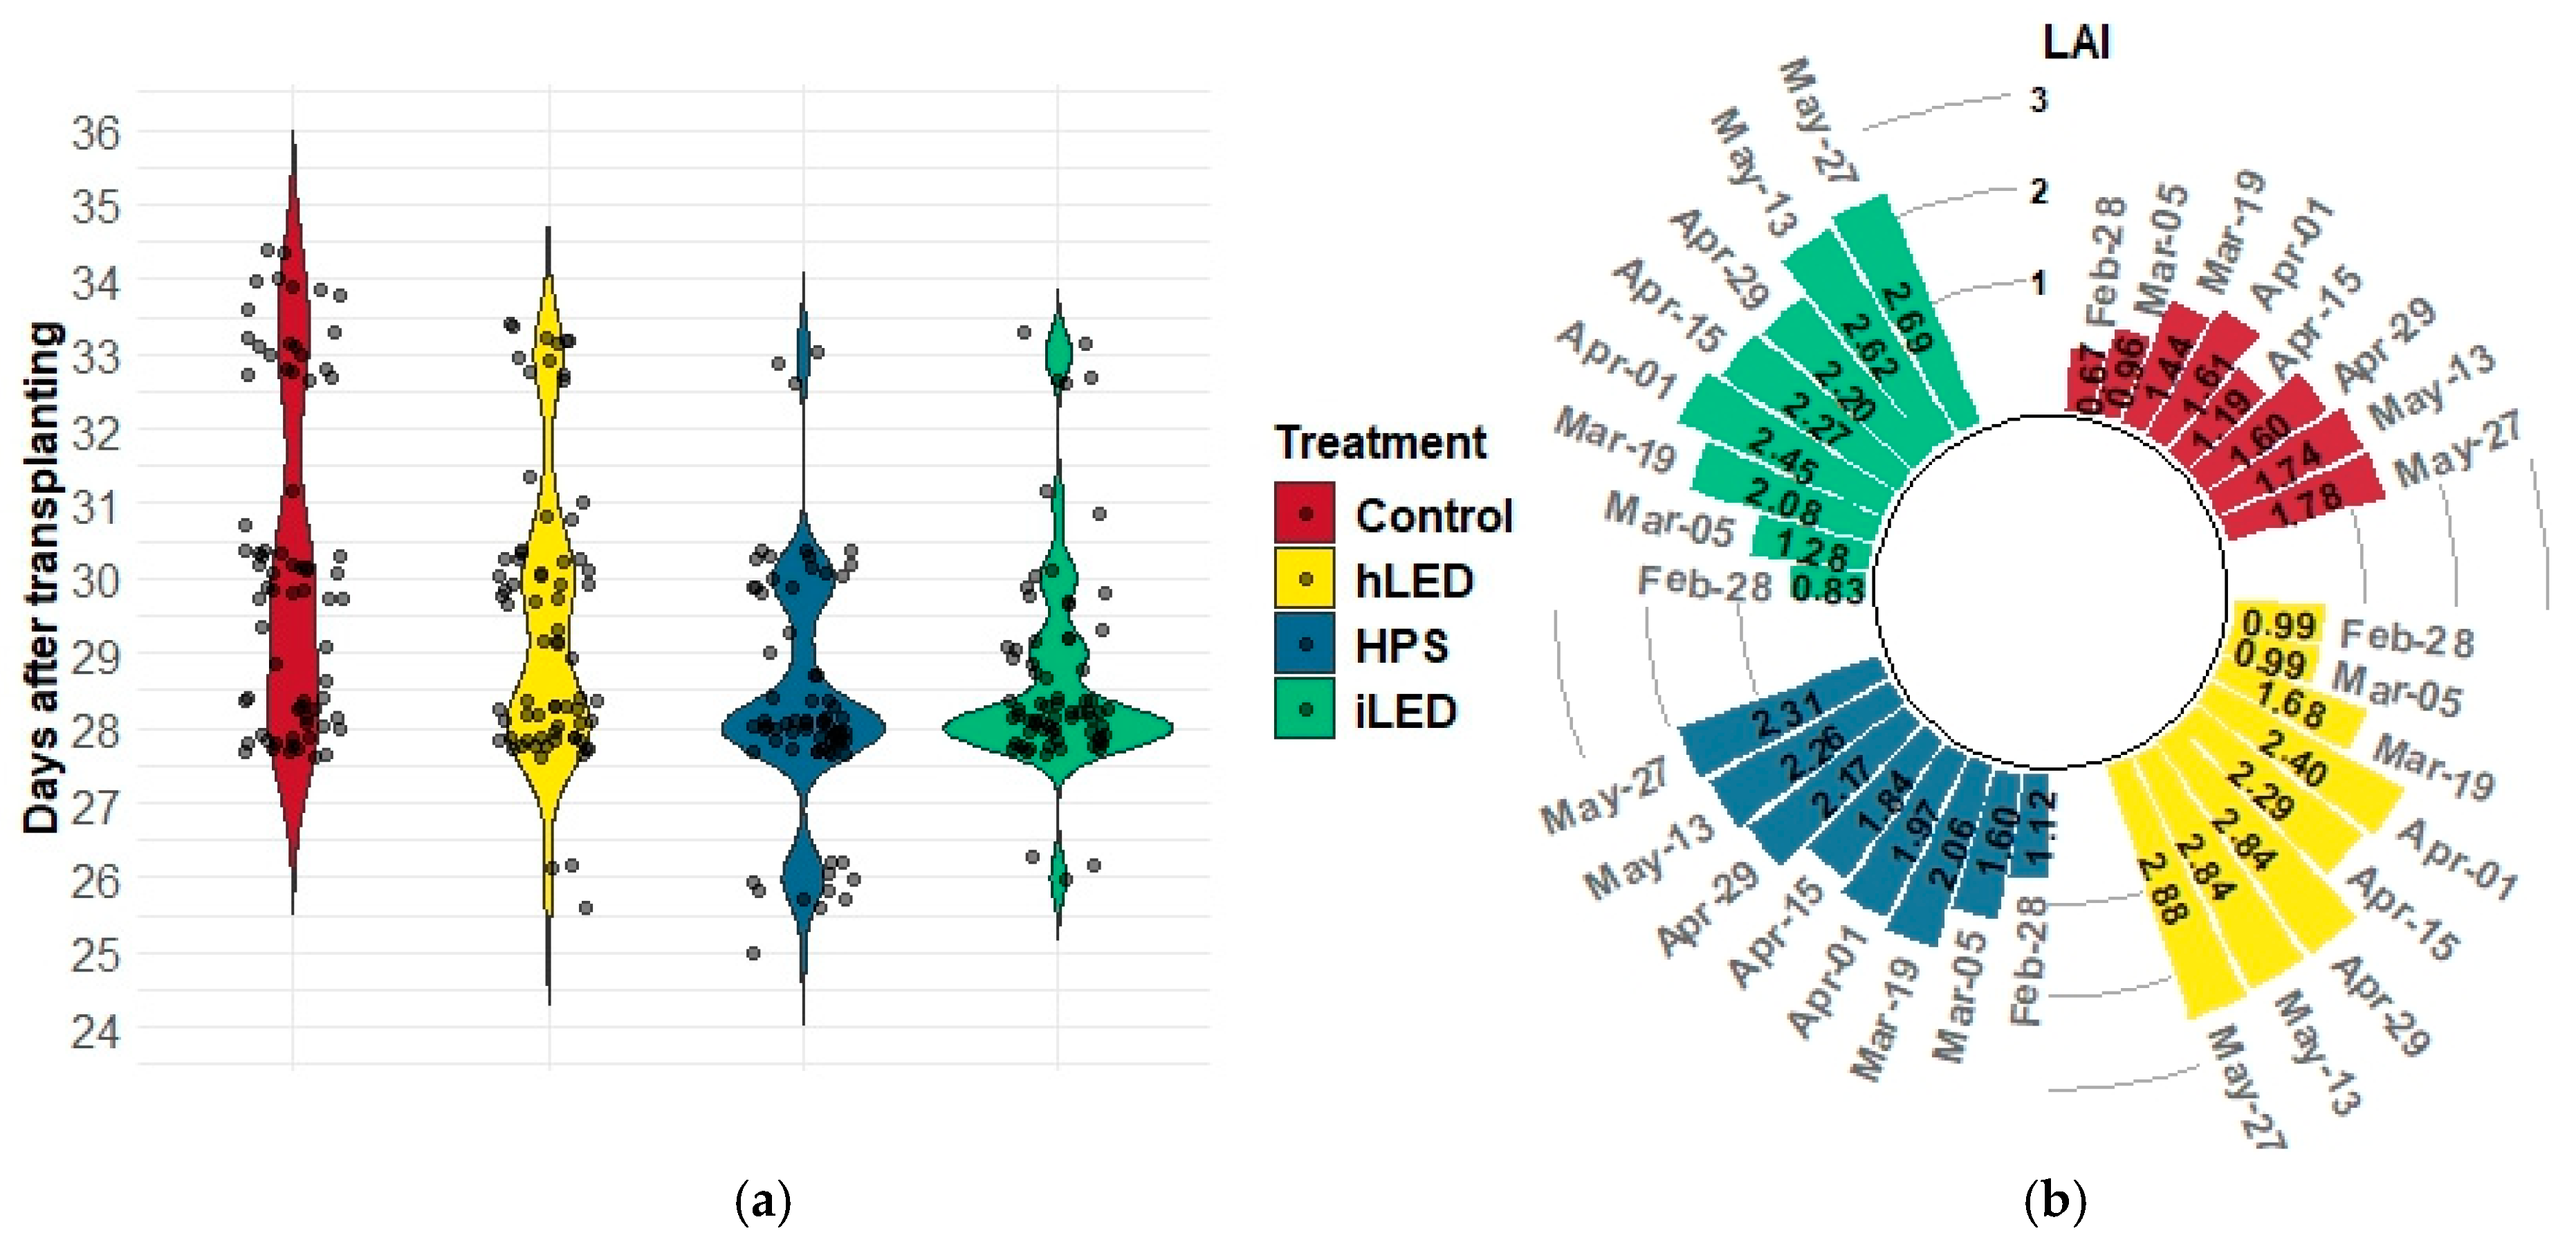
2.1. Morphological Measurements

Significant differences in morphological traits were observed under different lighting treatments (Table 1). The Control and HPS treatments resulted in the greatest stem elongation (SE), with average heights of 881.21 cm and 871.67 cm, respectively (Figure S4), and the longest internode distances (IDs) of 9.99 cm and 9.54 cm (Table 1). Industrial LEDs (iLEDs) showed moderate SE at 854.56 cm and an ID of 9.04 cm, while horticultural LEDs (hLEDs) had the shortest plants, with 838.04 cm of SE and an ID of 8.89 cm (Figure S4). HPS and iLEDs produced the thickest stems, averaging 14.48 mm and 14.26 mm, respectively, while hLEDs and controls had the smallest stem diameter (SD), averaging 13.67 mm and 13.35 mm. Plants under HPS lighting flowered the earliest, averaging 24 days post-transplantation, with iLED showing the most homogeneous flowering induction (Figure 2). The control group had the latest flowering induction date at 26 days and the least homogeneous flowering (Figure 2). Leaf Area Index (LAI) measurements varied significantly, with hLEDs achieving the highest LAI of 2.10, followed by industrial LEDs at 1.95, HPS at 1.87, and controls at 1.34 (Figure 2).

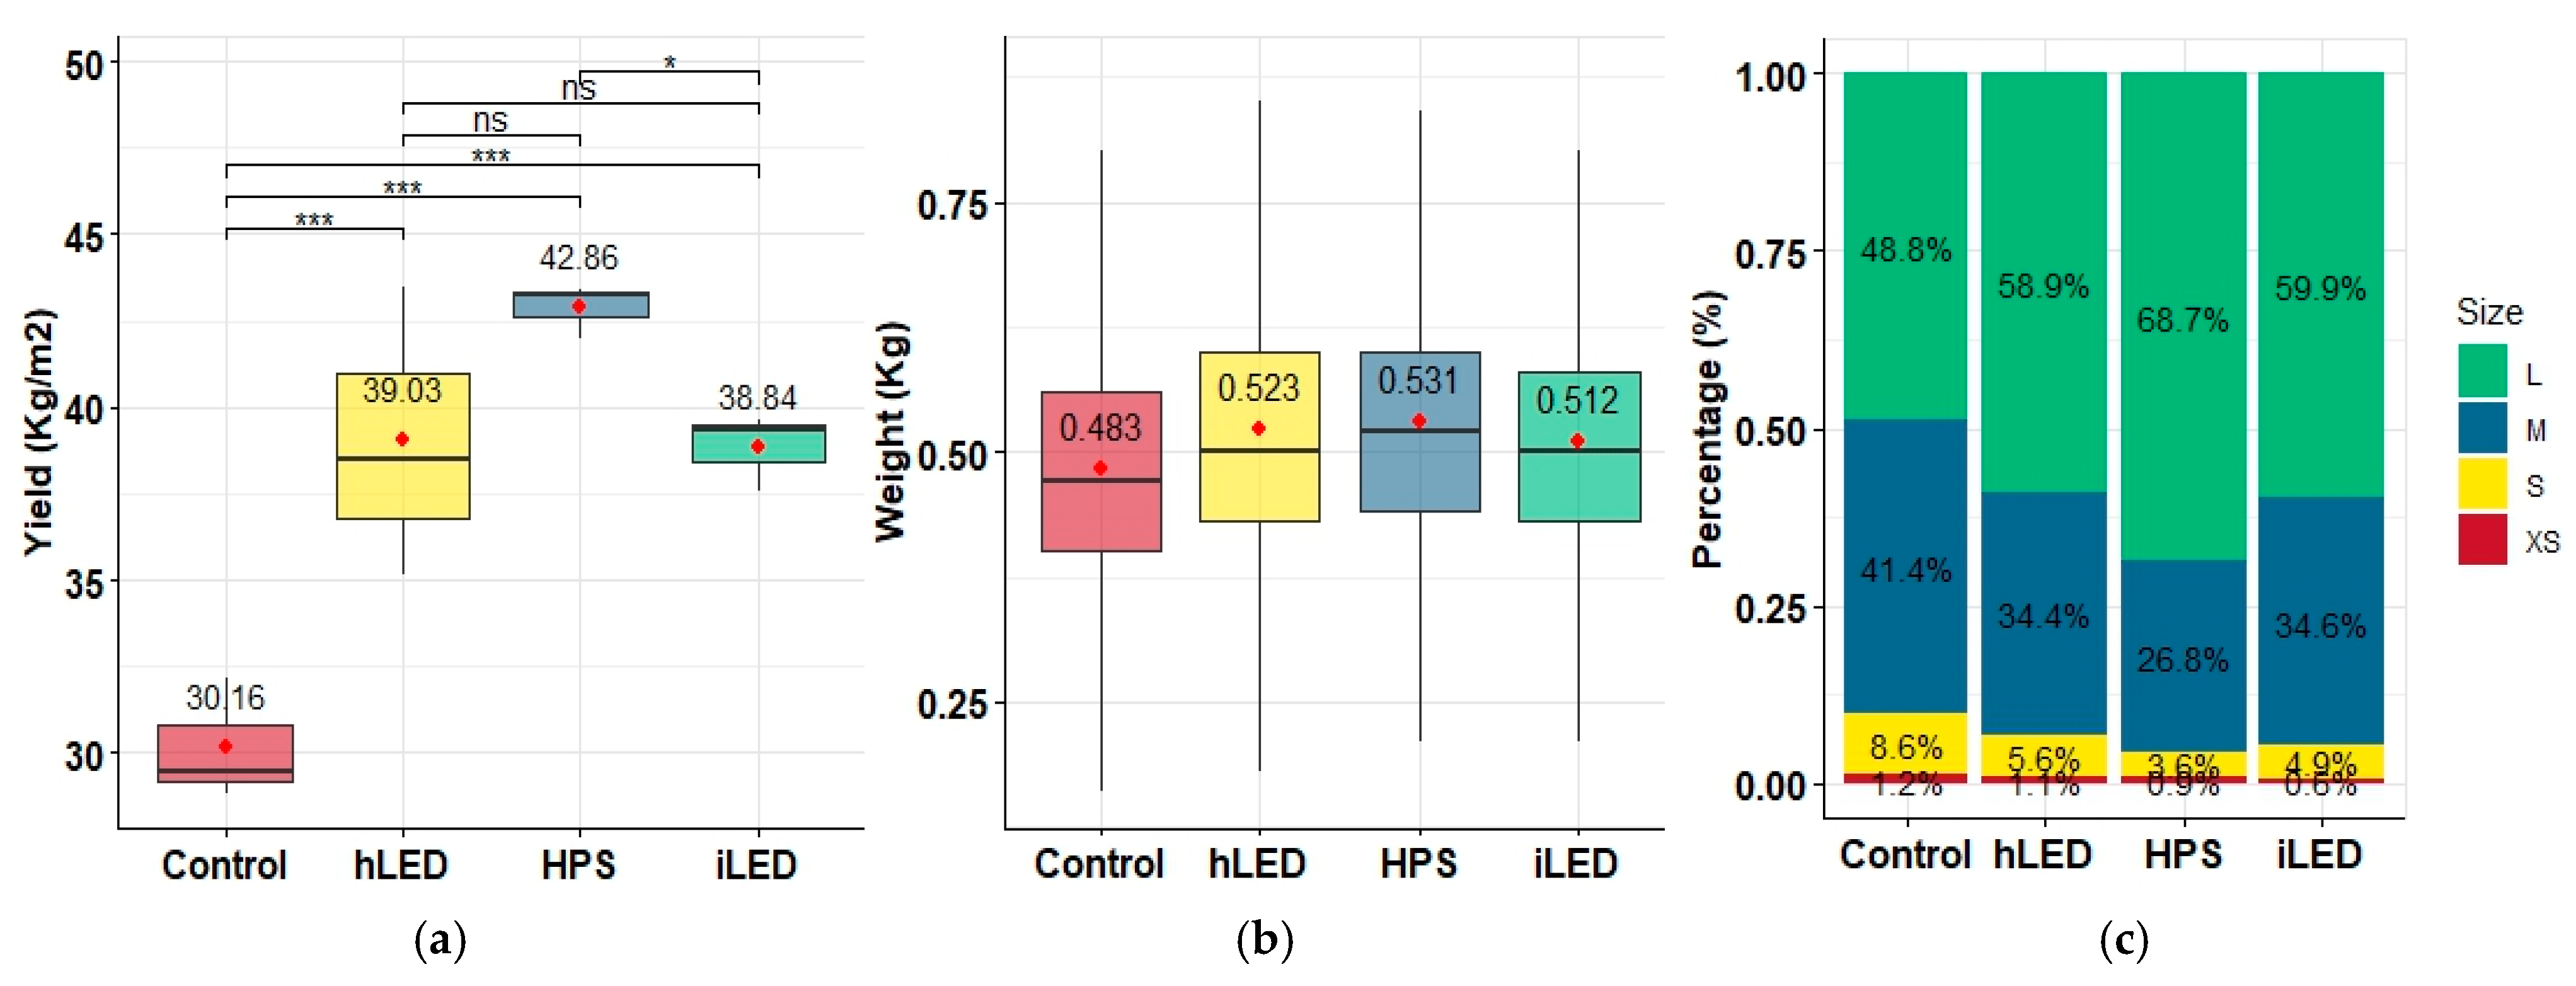
2.2. Plant Yield and Fruit Quality

The yield and quality of the cucumbers were significantly influenced by different lighting treatments (Figure 3). The highest yield was observed in the HPS treatment, with an average of 42.86 kg m−2, followed by the horticultural and iLEDs, with yields of 39.03 kg m−2 and 38.84 kg m−2, respectively. The control group produced the lowest yield of 30.16 kg m−2. Quality assessments based on fruit weight and size distribution also revealed significant differences among treatments (Figure 3). The highest average fruit weight was observed in the HPS treatment, with a mean weight of 0.531 kg, followed by the horticultural and iLEDs, with average weights of 0.523 and 0.512 kg, respectively. The control group exhibited the lowest average fruit weight of 0.483 kg. The distribution of fruit sizes further highlighted the impact of different lighting treatments on fruit quality. The control treatment had the lowest proportion of large fruits at 48.8% (Figure 3).

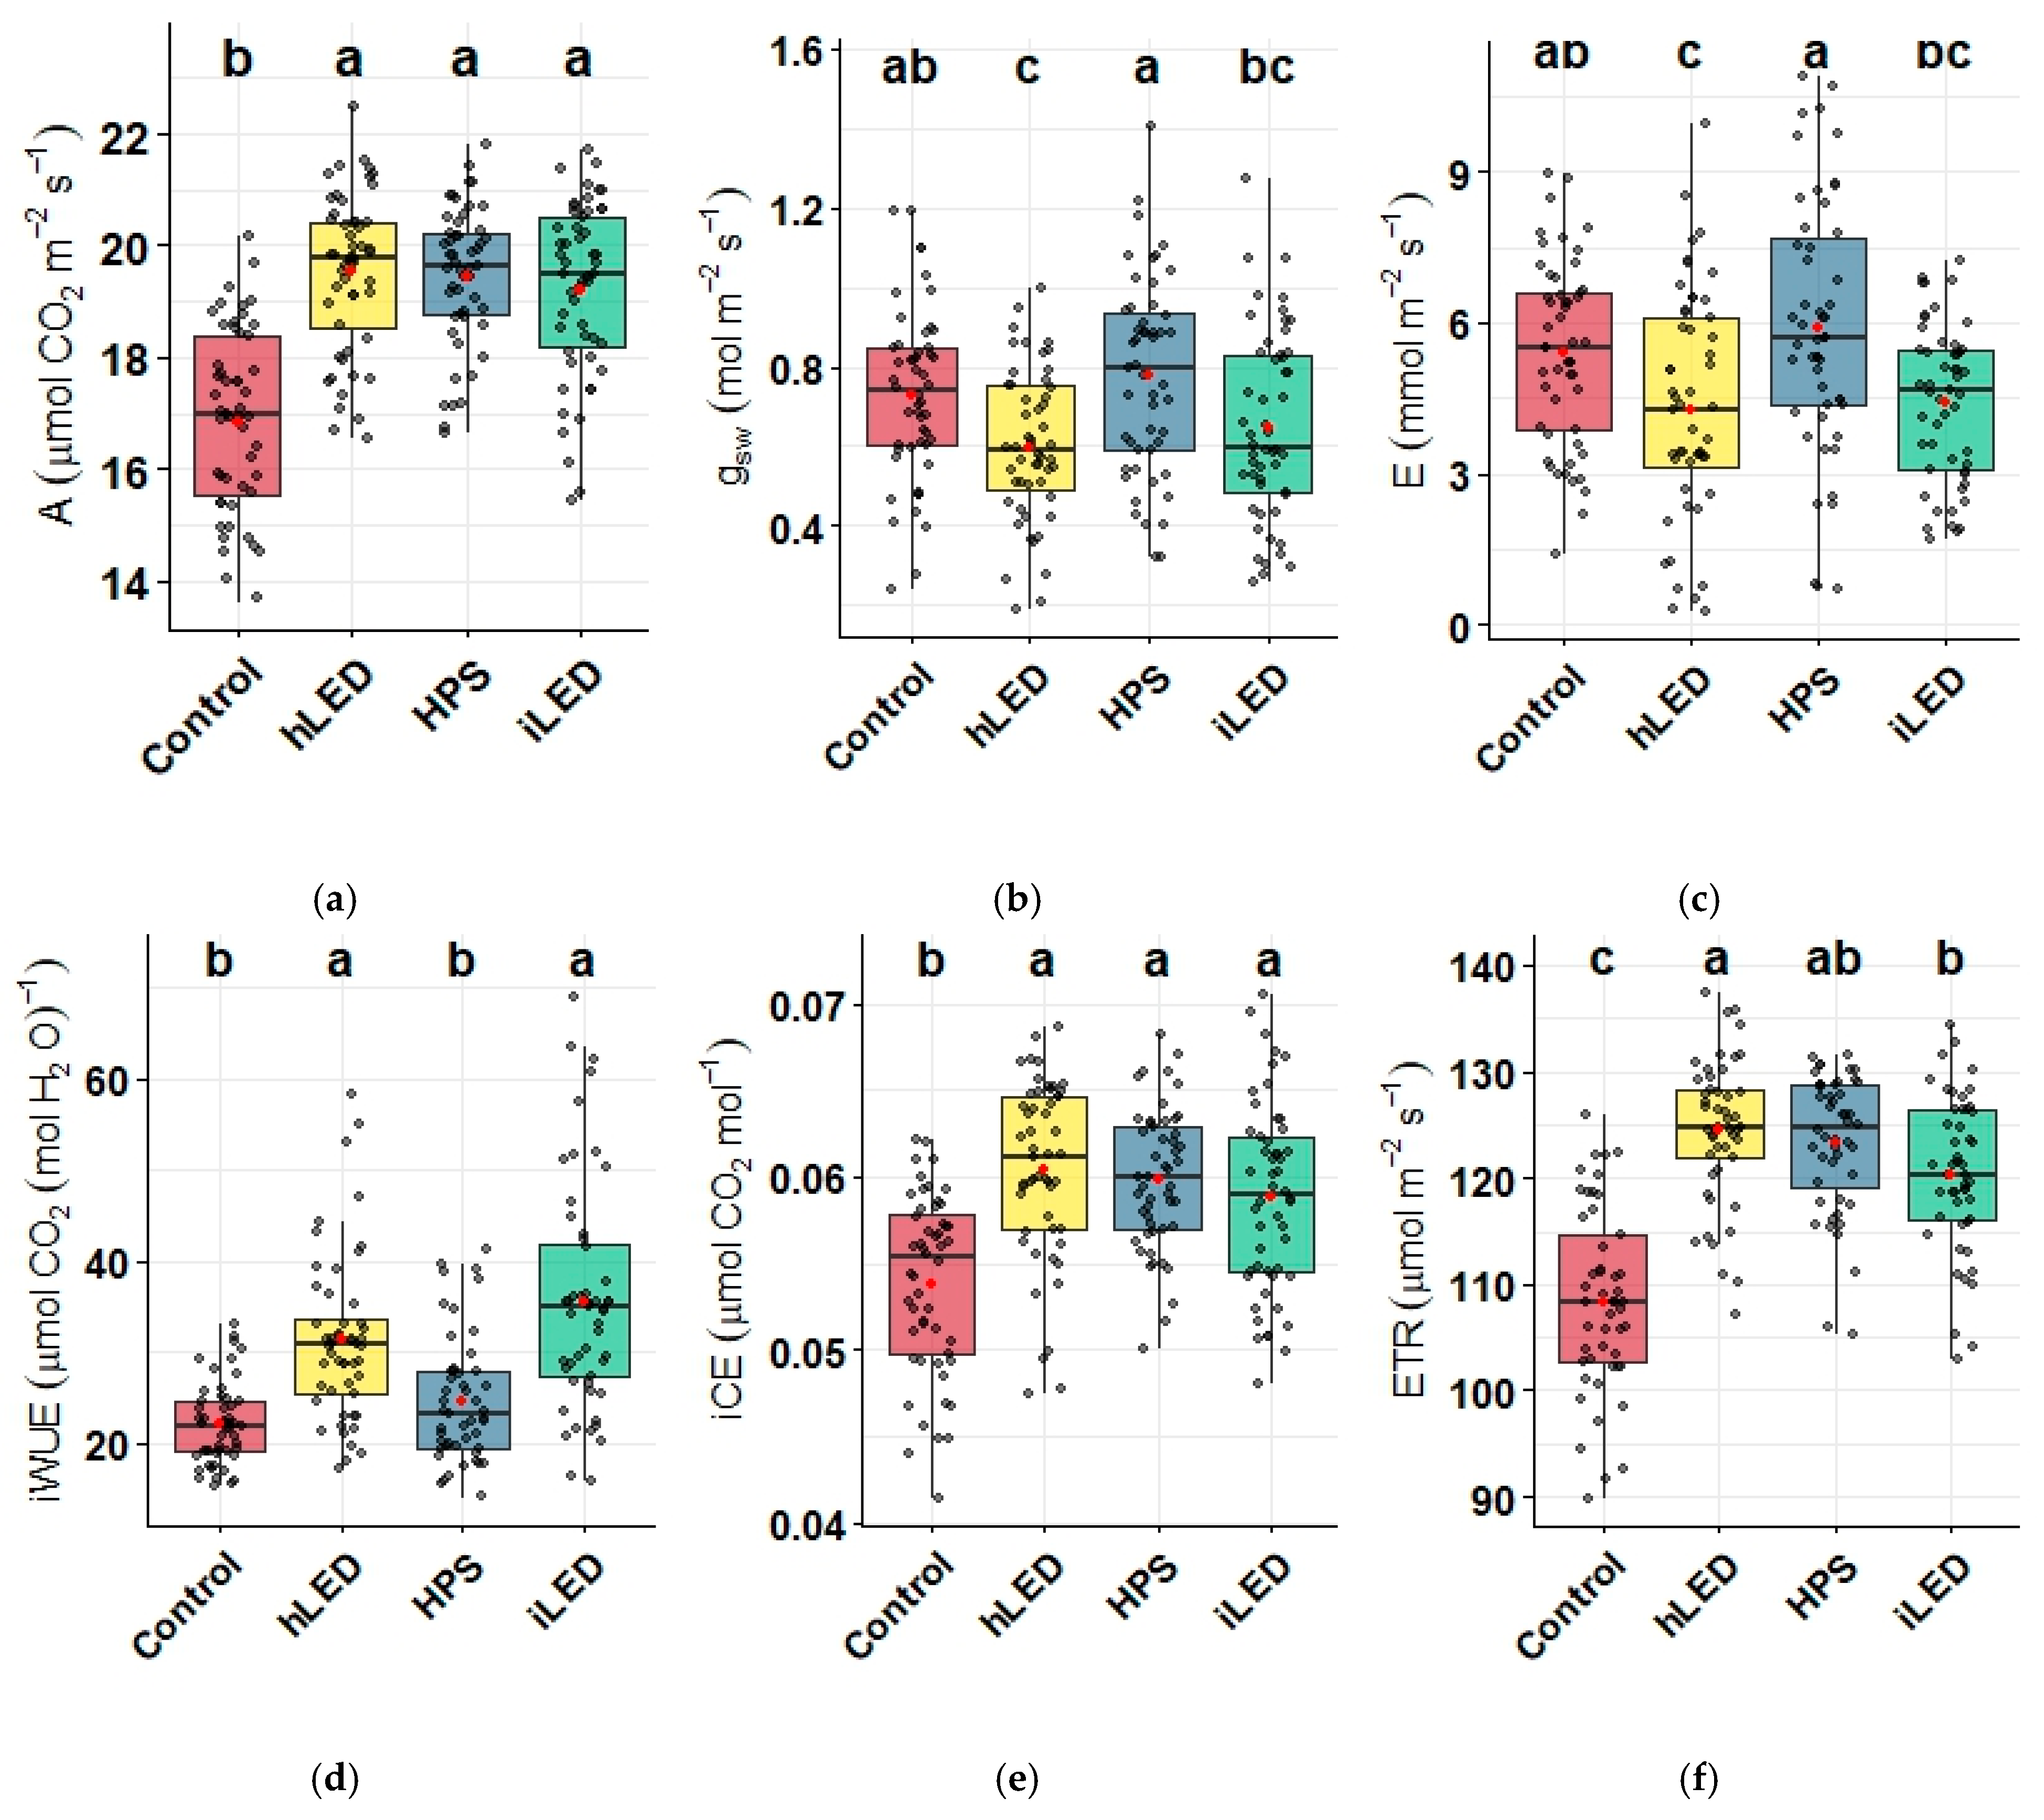
2.3. Photosynthetic Parameters

Photosynthetic parameters, including net assimilation rate (A), stomatal conductance (gsw), intrinsic water use efficiency (iWUE), electron transport rate (ETR), intrinsic carboxylation efficiency (iCE), and transpiration rate (E) varied significantly across treatments (Figure 4). The highest net assimilation rate was observed in plants grown under supplemental lighting conditions, while the control group exhibited the lowest rate, averaging 16.80 µmol CO2 m−2 s−1 (Figure 4a). The highest gsw was observed under the HPS treatment, averaging 0.77 mol m−2 s−1, while the horticultural LED group had the lowest value at 0.59 mol m−2 s−1 (Figure 4b). HPS also showed the highest transpiration rate (E), with an average of 5.90 mmol m−2 s−1, compared to the industrial and hLED average of 4.39 and 4.29 mmol m−2 s−1, respectively (Figure 4c). iWUE was significantly higher in the Industrial LED treatment, averaging 35.65 µmol CO2/mol H2O, in contrast to the control and HPS group’s 22.04 and 24.55 µmol CO2/mol H2O, respectively (Figure 4d). The iCE and ETR followed a similar pattern to the net assimilation rate, with the highest values observed under the supplemental lighting treatments (Figure 4e,f).

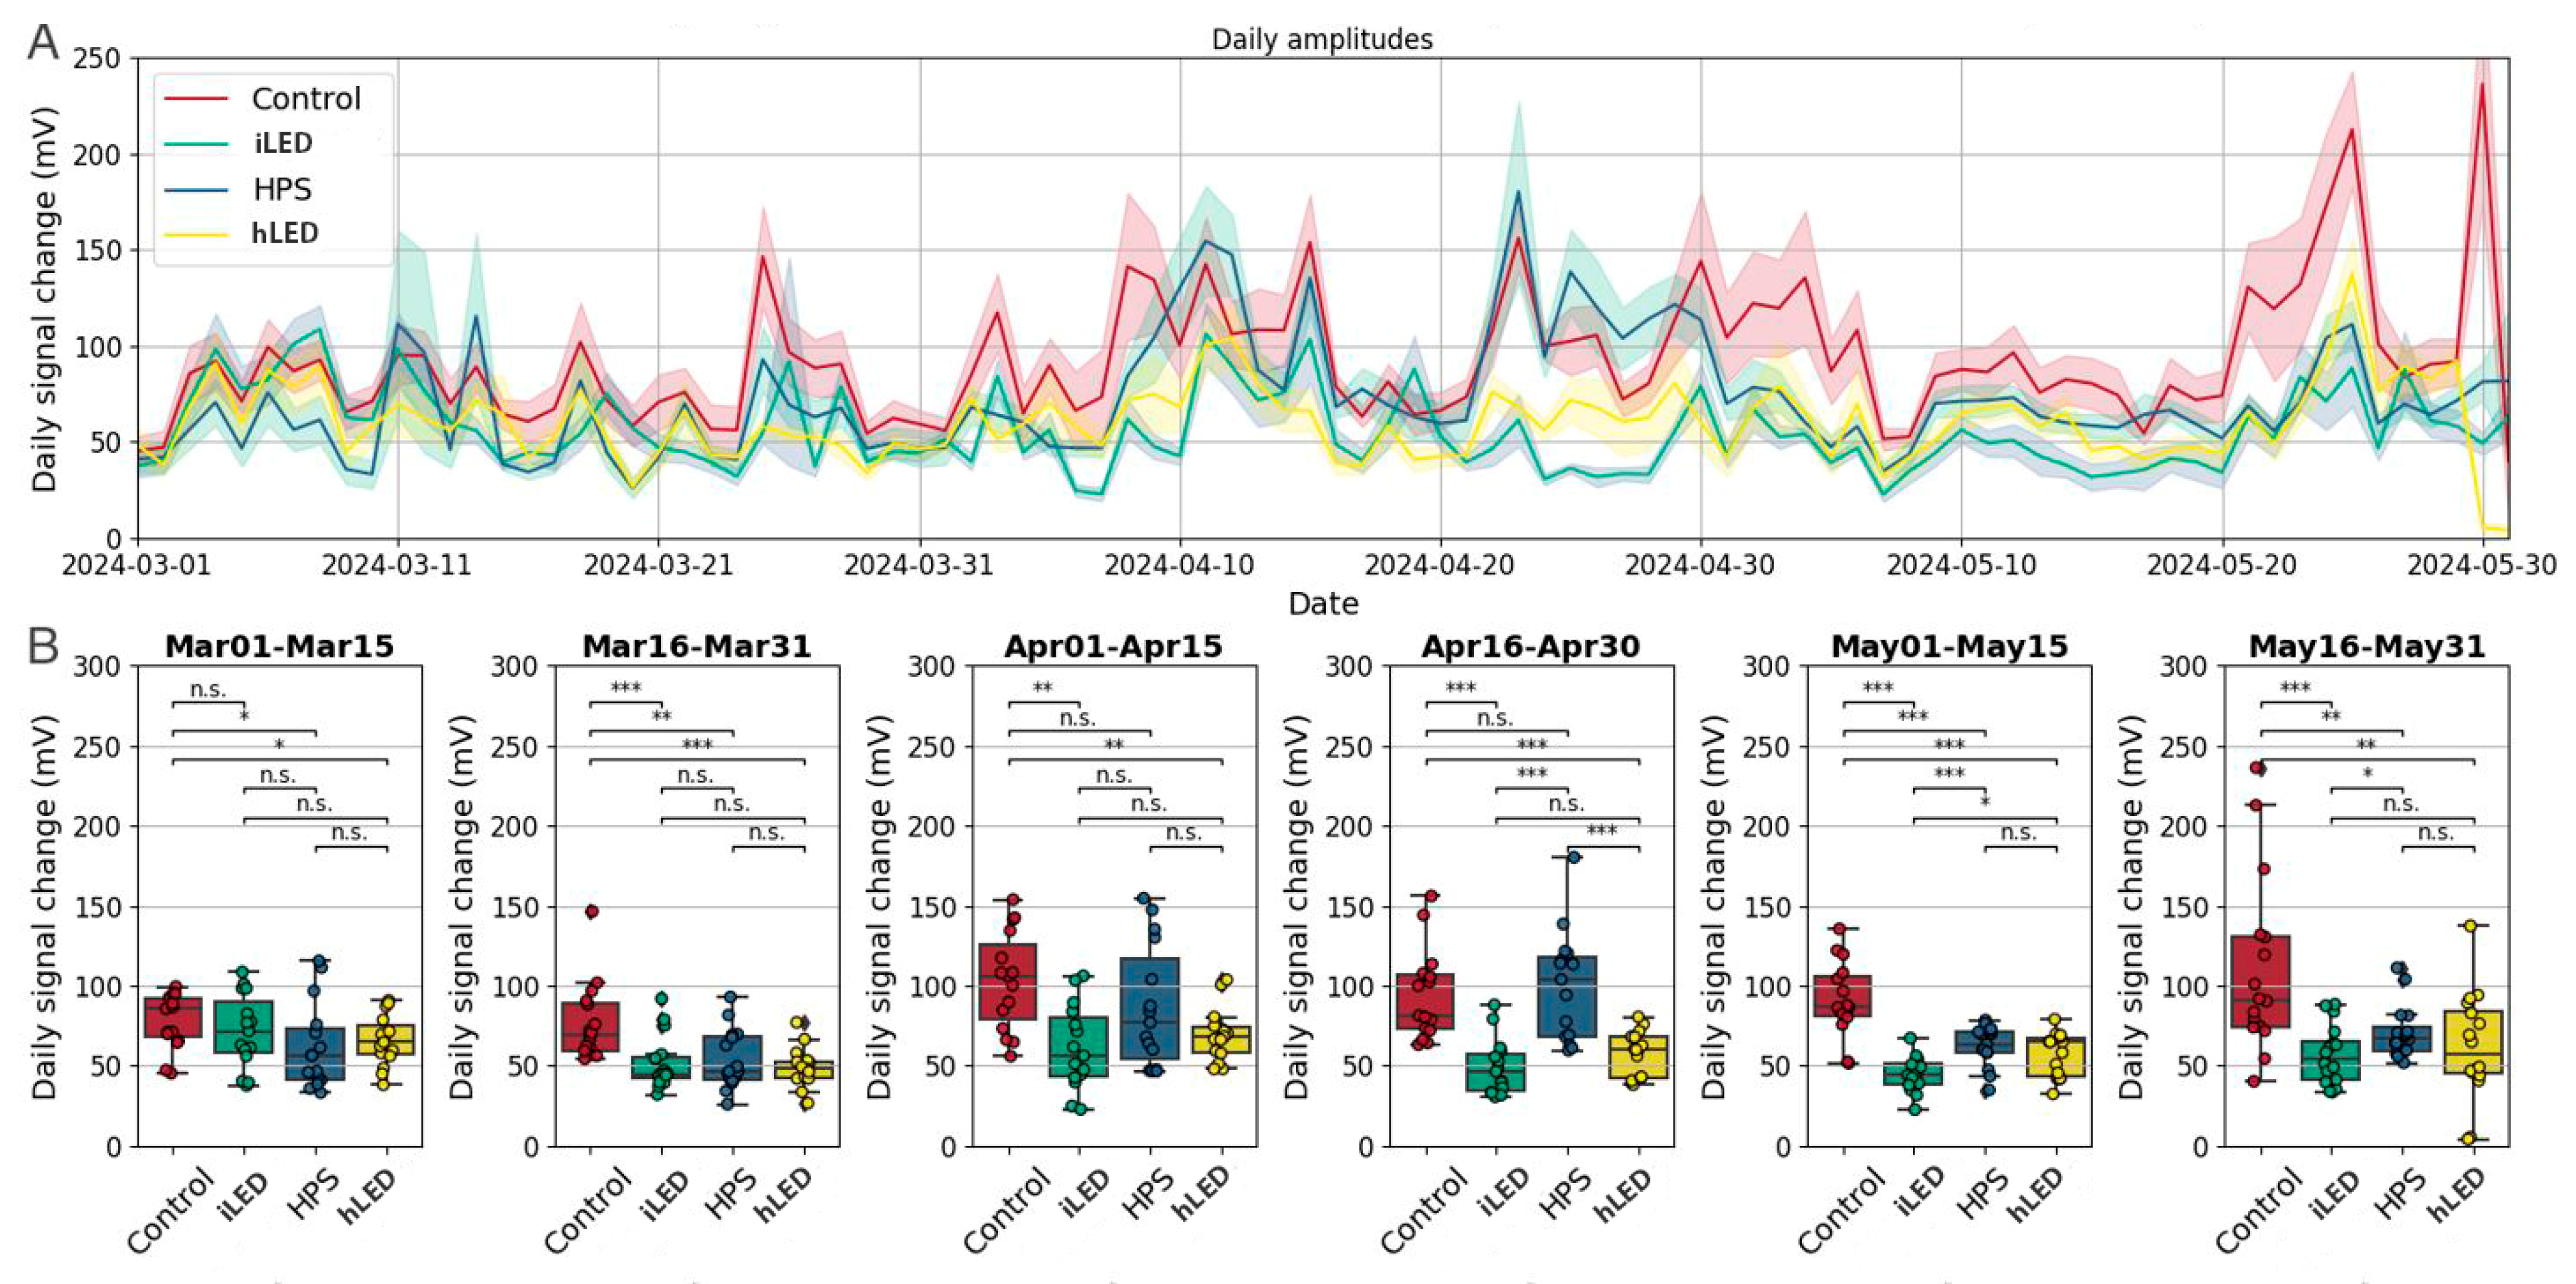
2.4. Plant Stress Response

Electrophysiological recordings revealed distinct differences in the daily amplitudes of electrical signals between the various lighting treatments. The time course of daily signal changes (Figure 5A) showed that plants under control conditions consistently exhibited the highest fluctuations, with peaks reaching over 200 mV. In contrast, plants grown under LEDs maintained lower and more stable daily amplitudes, averaging around 50 mV. The HPS group demonstrated moderate fluctuations but with generally higher signal changes than the LED treatments. A bi-weekly analysis of daily signal changes (Figure 5B) further highlighted significant statistical differences between treatments at specific intervals.
The Plant Balance Index (PBI) analysis (Figure 6A–C) supported these observations. Higher PBI fluctuations were observed in plants under control and HPS treatments (Figure 6A). In contrast, plants under LEDs showed lower and more stable PBI values. Plants grown under control and HPS conditions had frequent periods of elevated stress (Figure 6B,C), while plants under LEDs exhibited more time in low-stress ranges (Figure 6B,C). Quantitatively, plants under LEDs spent the largest proportion of time in the low-stress PBI range (PBI < 0.4), accounting for 71.14% and 67.03% of the total time, respectively (Figure 6C). In contrast, plants in the control group spent the most time in the high-stress PBI range (PBI > 0.8), with 22.68%, significantly higher than industrial LED (32.93%) and horticultural LED groups (24.83%).

2.5. Economic and Environmental Sustainability

Energy consumption analysis demonstrated that the iLEDs were the most energy-efficient, with an average power consumption of 378.31 kWh m−2, compared to 634.53 kWh m−2 for the HPS and 465.39 kWh m−2 for the hLEDs. Consequently, iLEDs achieved substantial energy savings of 40.38% compared to HPS lights and 18.71% compared to hLEDs (Table 2). When assessed on a per square meter basis, the initial cost of HPS lighting is 32.29% more than industrial LEDs and the initial cost of hLEDs is 102.91% more than iLEDs (Table 2). The resulting total emissions per light type were 342.65 kg CO2e m−2 for HPS, 251.31 kg CO2e m−2 for hLEDs, and 204.29 kg CO2e m−2 for iLEDs (Table 2). HPS was found to have a hidden carbon pollution cost of $8.99 m−2 compared to iLEDs, while hLEDs had a hidden cost of $3.06 m−2 compared to iLEDs (Table 2).
By considering the differences in yield (kg m−2) and power consumption (kWh m−2) together with the current market prices (CAD 2.96 kg−1, CAD 0.11 kWh−1) [25,26], the net economic benefit of each lighting type was assessed. Industrial LEDs were found to be the most profitable, with HPS lights being CAD 16.29 m−2 less profitable and horticultural LED lights being CAD 9.02 m−2 less profitable in comparison with iLEDs. The analysis here was based on average wholesale prices for cucumbers, implying the potential profitability of each lighting system under standard market conditions. Notably, the initial cost per m2 for iLEDs was the lowest, at CAD 124.20, compared to CAD 164.26 for HPS (32.26% higher) and CAD 252.00 for hLEDs (102.91% higher). Additionally, the warranted lifespan of industrial and hLEDs was 50,000 h, significantly longer than the 24,000 h for HPS lights (Table 2).

3. Discussion

This study highlights the profound impact of supplemental lighting systems on cucumber physiology, photosynthetic performance, and environmental sustainability in controlled-environment agriculture (CEA). By analyzing the spectral properties of Industrial LEDs (iLEDs), horticultural LEDs (hLEDs), and HPS lamps, this research underscores the importance of spectral distribution in optimizing crop growth while balancing economic and environmental considerations. It should be noted that no supplemental lighting or natural light was selected as the baseline control to reflect real conditions in a commercial greenhouse, ensuring the study’s practical relevance for growers.
The spectral composition of the lighting systems significantly influenced morphological traits. iLEDs, with a balanced red-to-blue light ratio (26.42% and 8.87%, respectively), promoted compact growth characterized by shorter internodes and robust plant architecture (Figure 1). This effect is attributed to blue light’s ability to suppress gibberellin biosynthesis and redistribute auxin, thereby optimizing canopy structure for light interception in high-density cropping systems [21,27,28]. Similarly, hLEDs, with a slightly higher blue light proportion (10.04%), exhibited even more pronounced photomorphogenic effects. This photomorphogenic effect is consistent with previous studies, which reported reduced stem elongation (SE) and improved canopy structure in cucumbers and cherry tomatoes under blue light [11,29]. In contrast, HPS lighting, dominated by yellow-orange wavelengths (48.06% in the 550–599 nm range), induced greater SE and longer stem internodes, likely due to far-red light promoting shade avoidance responses. These findings are consistent with previous research emphasizing the critical role of balanced spectra in improving plant morphology and space utilization [8,30,31].
The spectral distribution significantly influenced plant yield and fruit quality. HPS lighting, dominant in green-yellow wavelengths (79.88% in the 550–650 nm range), achieved the highest yield (42.86 kg m−2), likely due to enhanced light penetration and the additional heat produced into the canopy [32,33]. The far-red component of HPS lighting may also have contributed to improved photon capture in shaded canopy layers, promoting increased biomass accumulation [34]. However, the low proportion of blue light (3.14%) in HPS resulted in suboptimal physiological efficiency, higher transpiration rates, and inconsistent fruit size. Industrial LEDs, with 15.97% of their spectrum in the green range (500–549 nm), achieved competitive yields (38.84 kg m−2) by ensuring even light distribution within the canopy. This result highlights the significance of green light in enhancing photosynthetic performance across plant layers [33,35]. Horticultural LEDs performed similarly, achieving yields of 39.03 kg m−2 while improving fruit quality and size consistency. These outcomes underscore the trade-offs between yield, energy efficiency, and fruit quality across lighting systems.
Photosynthetic parameters further reflected the influence of light spectra. Industrial LEDs demonstrated superior intrinsic water-use efficiency (35.65 µmol CO2/mol H2O) and reduced transpiration rates compared to HPS lighting (Figure 4c,e). These results suggest that the balanced red-to-blue spectra of the industrial LED spectrum optimized photosystem II activity and stomatal conductance, consistent with the established roles of red and blue light in chloroplast development and Rubisco activation [36,37]. Similar results were reported by Hogewoning et al. (2010), who found that blue light enhances Rubisco activation and photosynthetic capacity in cucumber leaves [38]. Horticultural LEDs produced similar outcomes, with slightly higher stomatal conductance due to their elevated blue light proportion. Other studies documented enhanced photosynthesis and water use efficiency under LED lighting in tomato cultivation, corroborating these findings [39]. Conversely, HPS lighting, despite achieving the highest net assimilation rates, exhibited poor water-use efficiency and higher transpiration rates, emphasizing the need for spectral optimization to maximize photosynthetic efficiency without increasing water loss.
Plant stress responses were also significantly influenced by the lighting systems. Electrophysiological measurements revealed that both LED treatments stabilized plant stress responses more effectively than HPS and control treatments (Figure 4 and Figure 5). The blue light component in these LEDs likely contributed to the activation of antioxidant pathways and reduced reactive oxygen species (ROS) accumulation [38,40], enhancing stress resistance [41]. Borbély et al. (2022) highlighted that blue light plays a significant role in modulating redox homeostasis and activating antioxidant pathways, which are critical for reducing reactive oxygen species (ROS) accumulation, supporting the hypothesis that blue light improves stress adaptation under LED lighting conditions [42,43]. In contrast, the unbalanced spectral composition of HPS lighting resulted in greater stress response, further highlighting its limitations in maintaining plant stability under controlled conditions [44].
The yield and environmental performance of iLEDs further underscore their potential as a sustainable alternative to HPS lighting. While HPS achieved the highest yield (42.86 kg m−2), its energy consumption and carbon emissions (342.65 kg CO2e m−2) were significantly higher than those of iLEDs, which achieved competitive yields (38.84 kg m−2) with 40% lower emissions. These findings highlight the dual benefits of LEDs in reducing greenhouse energy consumption and carbon footprints while maintaining crop productivity [14,45,46]. Singh et al. (2015) also reported energy savings of up to 70% when using LEDs for greenhouse lighting, emphasizing their feasibility as a resource-efficient solution for sustainable agriculture [15]. The energy efficiency of iLEDs stems from their streamlined design, operating at lower wattage (240 W vs. 720 W for hLEDs), utilizing SMD2835 LEDs, and featuring a compact, lightweight structure that reduces manufacturing and handling costs. In contrast, hLEDs rely on advanced OSRAM LEDs, which increase energy consumption and production costs (Table S3). To fully capitalize on the advantages of iLEDs, future research should explore their long-term impacts across diverse crops and environments, focusing on molecular mechanisms of stress adaptation and photosynthetic efficiency, particularly photoreceptor-mediated signaling. Integrating light–temperature interactions and nutrient optimization could reveal synergistic effects to enhance greenhouse productivity. Including both negative and positive controls in future studies will provide a more comprehensive analysis of the combined impacts of natural and supplemental lighting systems on crop performance.

4. Materials and Methods

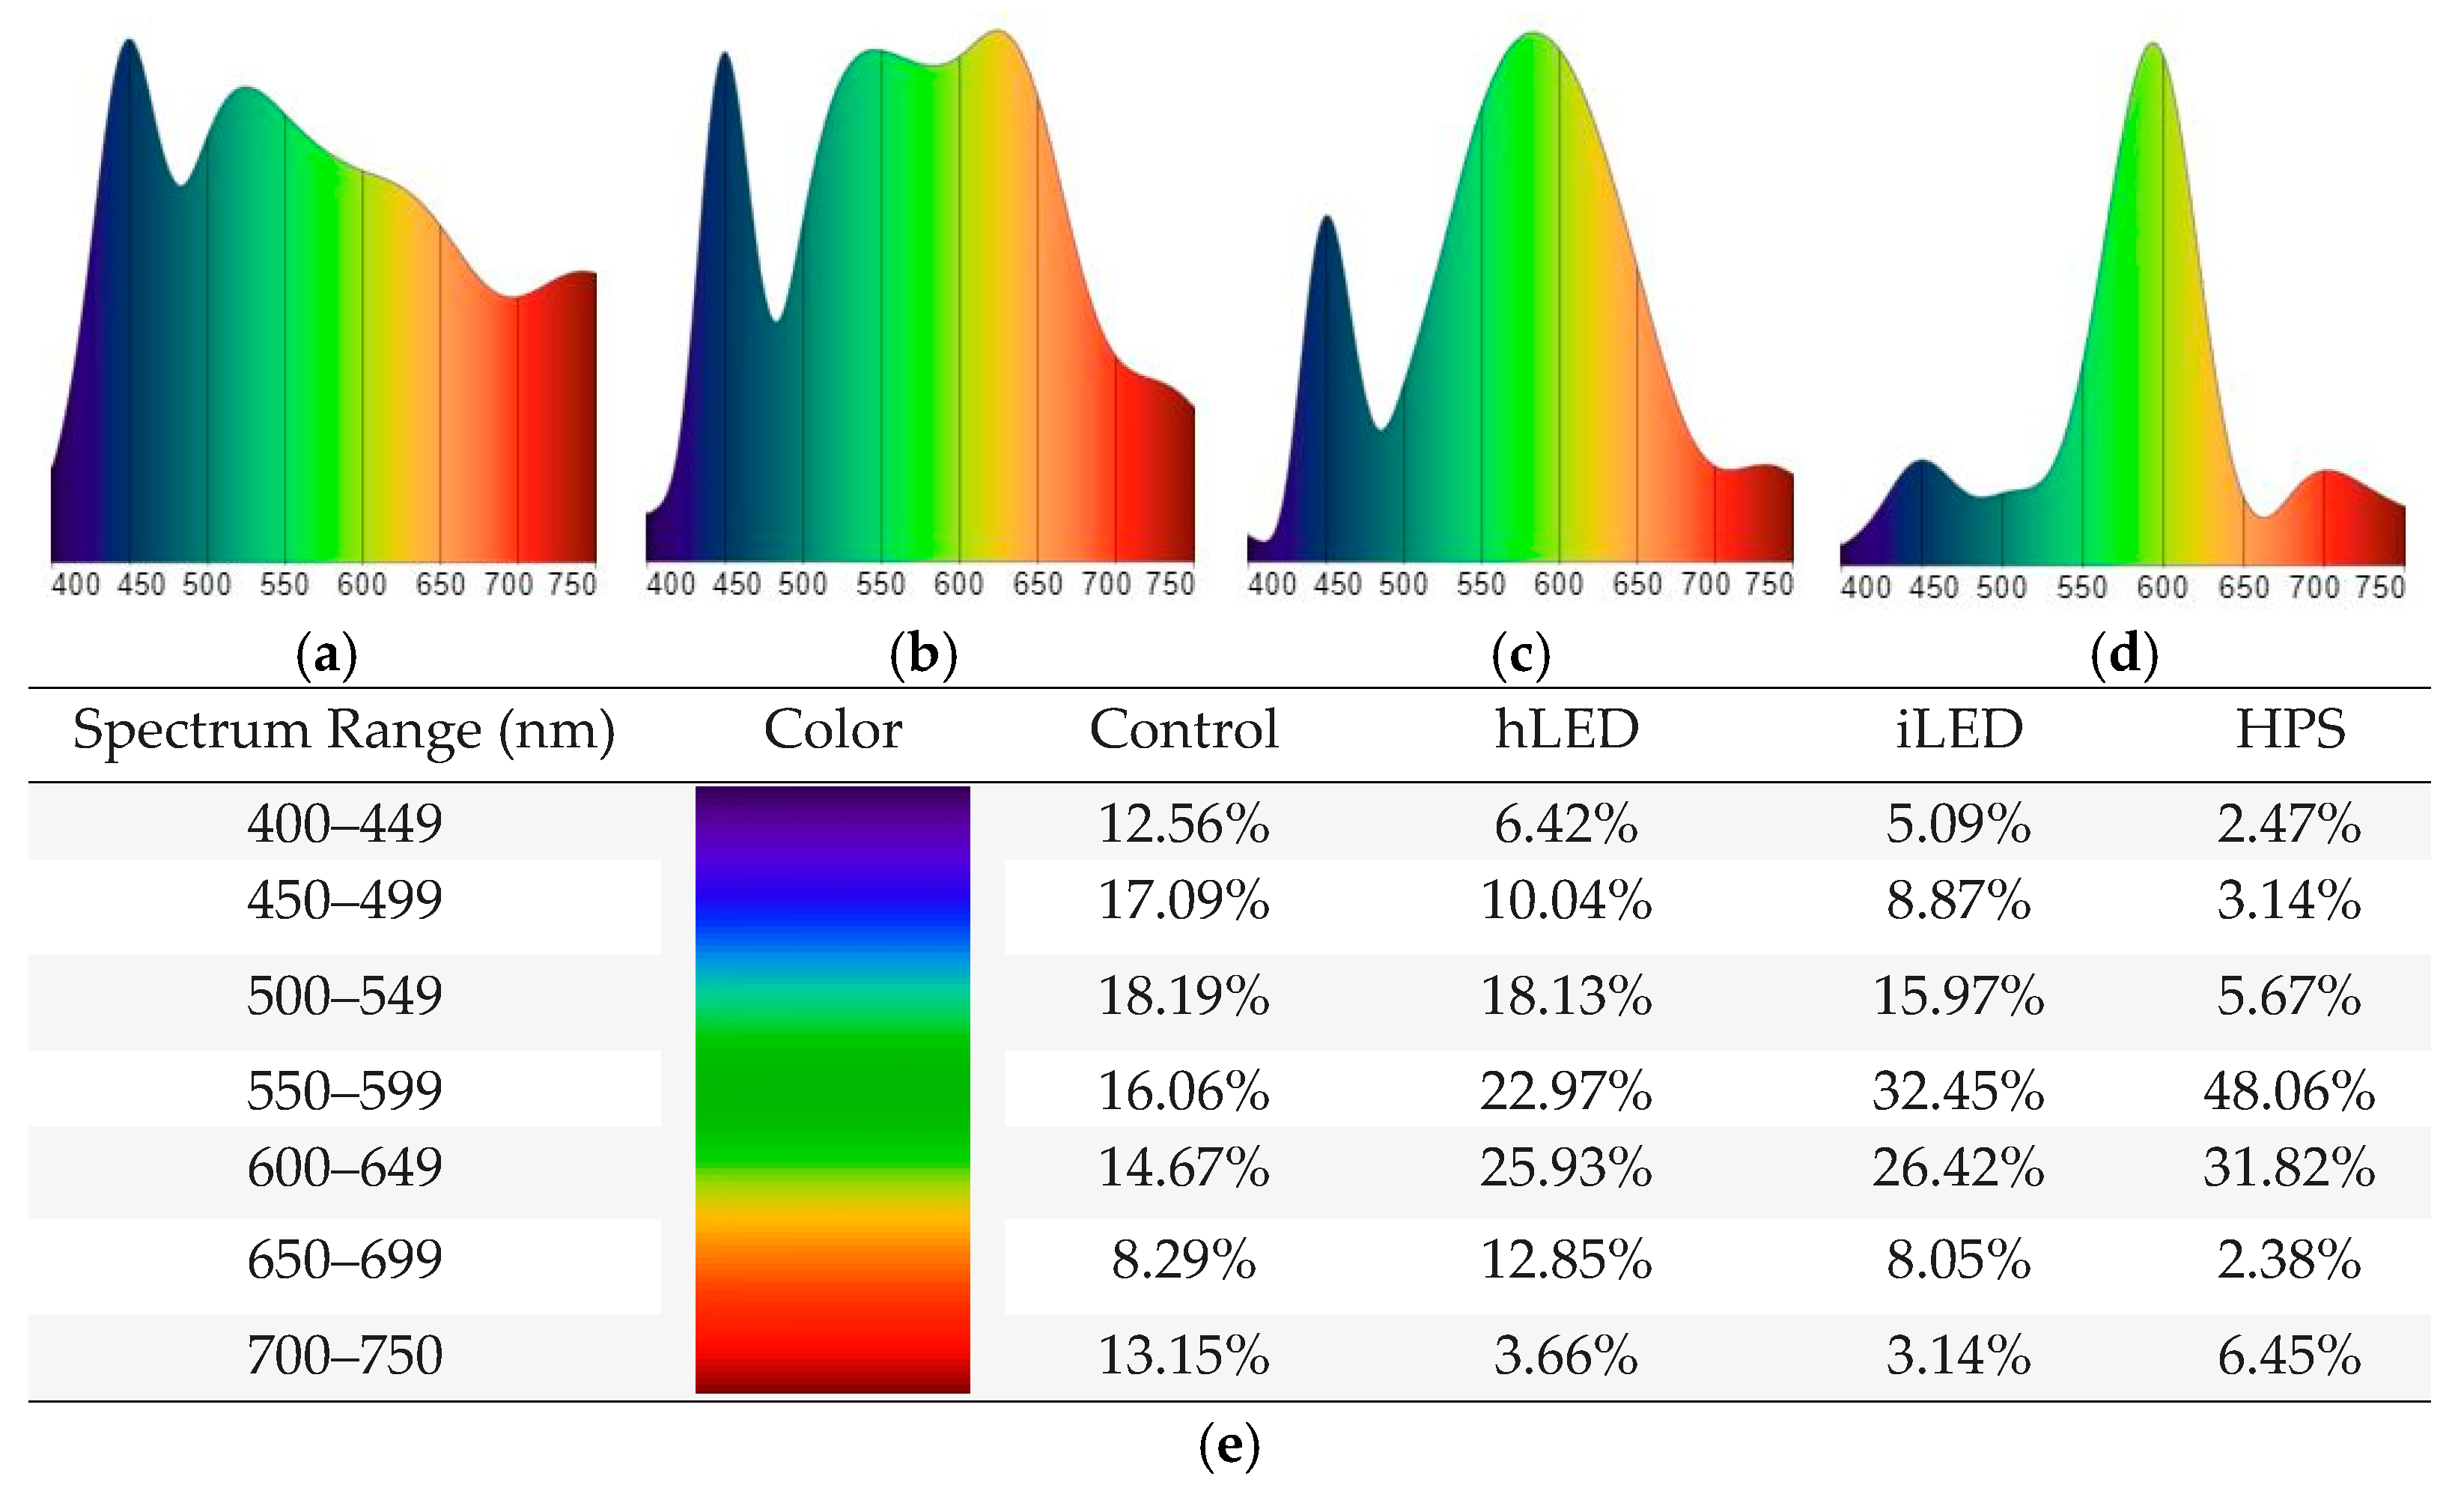
4.1. Plant Materials and Greenhouse Conditions

The Verdon RZ F1 cultivar by Rijk Zwaan of the long English cucumber, Cucumis sativus L., was used in the study. This cultivar produces uniform fruits (450–500 g) with strong roots and tolerance to pests, yielding 35–45 kg m−2 under optimal conditions [47]. The seeds were germinated in 2.5 cm × 2.5 cm rockwool cubes starting 15 January 2024 in Lethbridge Polytechnic’s Center for Sustainable Food Production (CSFP) greenhouse, located in Lethbridge, Alberta, Canada (49°39′33.8904″ N 112°48′24.0516″ W). The commercial-scale greenhouse (7500 ft2) and its recirculating irrigation system are illustrated in Figures S1 and S2, respectively. Greenhouse and irrigation system sanitization was done a week before starting the experiment, using (5% peroxyacetic acid (PAA)) and 1.0% hydrogen peroxide. Environmental conditions were controlled 24/7, maintaining a day temperature range of 23 ± 2 °C, a night temperature range of 21 ± 2 °C, a relative humidity of 65–75%, and a Vapor Pressure Deficit (VPD) of 0.8 to 1.2 kPa. To achieve the target daily light integral (DLI) of 27.5 ± 2.5 mol m−2 day−1, the supplemental light at the canopy was maintained at an average Photosynthetic Photon Flux Density (PPFD) of 250 µmol m−2 s−1, with an 18 h photoperiod (light: 12:00 AM to 6:00 PM during the early season and 2:00 AM to 8:00 PM during the late season) followed by 6 h of darkness. The PPFD level for the control treatment varied throughout the day due to natural variations in sunlight intensity.
Following the initial propagation phase, seedlings were transplanted onto rockwool cubes (10 cm × 10 cm × 10 cm) on 21 January 2024. After a week, when the plants had three true leaves, they were transferred onto slabs with carbon-based soilless substrate (15 cm × 100 cm × 10 cm). The continuous monitoring system of was used to oversee climate, light, and irrigation conditions 24/7 (Microclimates Inc. Seattle, WA, USA).
Electrical Conductivity (EC) of the feeding solution was maintained at 1800 ± 50 µS cm−1, and pH at 5.7–5.9. The irrigation regime was 1 min watering every 4 min in the recirculating system, allowing 40–50% overdrain. Two concentrated nutrient stock solutions, A and B, were stored in 100 L tanks (Table S1). An 800 L feeding tank diluted these concentrates with tap water, delivering the nutrient solution (Table S2) via the irrigation system. Hydrochloric acid (3.65%) was used to adjust the pH of the feeding tank. A continuous automated system was used to make the feeding solution and control the irrigation regime (Microclimates Inc. Seattle, WA, USA). Figure S2 illustrates the recirculating irrigation system components, including the nutrient solutions, acid stock solution, and feeding tank, as well as EC and pH sensors.

4.2. Experimental Design

The experiment was conducted from 15 January to 27 May 2024. Randomized Complete Block Design (RCBD) was employed to evaluate three supplemental lighting systems, High Pressure Sodium (HPS), Industrial LED, and Horticultural LED, alongside a control (no supplemental light). An SXQ quantum light sensor and spectrometer (Agrowtek Inc., Brookfield, WI, USA) was used for quantitative measurement of the light spectra. Spectral characteristics of the light types used in the experiments are illustrated in Figure 1. Technical specifications of the light types can be found in Table S3. The treatments, in three replicates, were randomly distributed in the greenhouse (total 12 plots). Each plot was measured to be 3.3 m by 4.4 m, with a total area of 14.52 m2 (Figure S3). A 50 cm border separated the plots, and a light-blocking layer was installed to prevent light contamination. The rows were spaced 110 cm apart, with 55 cm between plants within rows. Each plot contained 24 cucumber plants grown on 12 slabs, resulting in a density of 1.65 plants m−2. To manage temperature effects, four fans were installed at the corners of each plot to enhance airflow and minimize heat accumulation, particularly under HPS lighting. For physiological trait measurements, plants were randomly selected from each plot, and data for yield and quality were collected from all 24 plants in each plot.

4.3. Morphological Measurments

Plant growth and development traits, including stem elongation (cm), stem diameter (mm), internode distance (cm), and first flowering induction date, were measured for all the plants within each plot. Stem elongation was measured twice a week. Stem diameter was also measured twice a week with an electronic caliper at two locations, between the 4th and 5th leaves, counting from the top of the plant and stem base. The first flowering induction date was recorded when the first flower bloomed on each plant within a given treatment group. Non-destructive leaf area index (LAI) measurements were conducted every 15 days using an AccuPAR LP-80 Ceptometer (METER Group, Inc., Pullman, WA, USA). Measurements were randomly collected from the top and middle (5th expanded leaf from the top) canopies within each row. The ceptometer was systematically moved across the canopy to obtain data from both the outer and inner regions of the plant canopy. Each treatment group consisted of four replicates. The following formula, adapted from [48], was used to estimate the LAI:
L A I = [ ( 1 1 2 K ) f b 1 ] l n τ A ( 1 0.47 f b )
where K is the extinction coefficient for the canopy, fb is the beam fraction, τ is the ratio of PAR measured below the canopy to PAR measured above the canopy, and A is the general absorption coefficient of the canopy, which is equal to 0.86.

4.4. Plant Yield and Fruit Quality Analysis

Throughout the experiment, each fruit was tagged with its corresponding ID based on the location and treatment in the experiment. Fruits were harvested twice a week when their minimum diameter reached 41 mm [49]. Fruit quality and market category were determined based on the CFIA standards [49]. During each harvest, data such as fruit weight (g) and length (cm) were documented. Furthermore, calculations were performed for the fruit yield per plant per square meter.

4.5. Photosynthetic Measurments

Photosynthesis measurements were conducted on the canopy using an LI-6800 (LI-COR, Lincoln, NE, USA) once a week from nine randomly selected plants per treatment, between 8:00 AM and 11:30 AM, on the fifth or sixth fully expanded and photosynthetically active leaf. All measurements were taken under a constant light quantity of 500 µmol m−2 s−1, with a spectrum of 10B:90R. Temperature, humidity, and CO2 concentration in the chamber were adjusted to greenhouse conditions. Recorded parameters included net assimilation rate (A, µmol CO2 m−2 s−1), stomatal conductance (gsw, mol m−2s−1), transpiration rate (E, mmol H2O m−2s−1), electron transport rate (ETR, µmol electrons m−2 s−1), intrinsic water use efficiency (iWUE, µmol CO2 (mol H2O)−1), and carboxylation efficiency (iCE, µmol CO2 mol−1). Intrinsic water use efficiency (iWUE) was calculated as the ratio of net assimilation rate to stomatal conductance (A/gsw), and carboxylation efficiency (iCE) was calculated as the ratio of net assimilation rate to intercellular CO2 concentration (A/Ci).

4.6. Electrophysiology Measurements

Electrophysiology recordings were conducted continuously throughout the study to capture diurnal variations in the electrical activity of plants. Eight plants from the center of each plot were selected for analysis from each treatment group. Electrical signals generated by plants were recorded using PhytlSigns devices from Vivent SA (Crans-près-Celigny, Switzerland), as described by [50] Tran et al., 2019. For each plant, the PhytlSigns device measured the electrical potential difference between the main stem and the petiole of the 7th leaf from the base of the plant. The electrical signal was sampled at a rate of 256 Hz and filtered to remove the frequencies at 60 and 120 Hz. The signal was recorded in millivolts (mV) and was captured using MATLAB software (V. R2023a) [2].
The daily amplitude was defined as the difference between the maximum and minimum electrical potential recorded within a 24 h cycle. For PBI, a comparative analysis was performed by aligning each day’s signal pattern with the standard deviation of the previous four days. Instances where the recorded signal exceeded the standard deviation were marked as significant deviations, indicating plant responses to environmental changes. The PBI was calculated as a normalized ratio between these deviations and the standard deviation itself, averaged across all plants in a treatment group. PBI scores were categorized as follows: a range of 0.8–1.0 indicated marginal environmental influence and stable ambient conditions; a range of 0.4–0.8 reflected moderate adaptation to environmental factors; and a range of 0–0.4 suggested significant environmental influence and potential plant stress.

4.7. Energy Use Efficiency and Carbon Emissions

Energy consumption for each lighting treatment was calculated using the following formula:
E C i = ( E R i × P F i × T ) / 1000 A
where ECi is total energy consumption (kWh m−2), ERi is the energy rating (W/unit), PFi is the power factor (%) by light type (i = Industrial LED, HPS, Horticultural LED), T is the total number of hours the lights were on during the experiment, and A is the total area covered by each light type (m2). The total experimental period was approximately 3146.33 h from 17 January to 27 May, while the lights were on for 2193.08 h and off for approximately 953.25 h. A Photosynthetic Photon Flux Density (PPFD) threshold of 245 ± 5 µmol m−2 s−1 was used to determine the total light on and off time. The total area covered by each treatment group and comprised of 3 replicates was 43.56 m2.
The environmental impact of light types was assessed based on the CO2 emissions associated with their energy consumption. To calculate the CO2 emissions, we used the electricity consumption intensity [51] value for Alberta for the years 2023 and 2024, which is 540 g CO2e per kilowatt-hour (kWh) of electricity consumed [51].
The formula used to calculate the emissions is as follows:
E i = E C i × E F E L , G H G
where Ei is the total CO2 emissions (kg CO2e m−2), ECi is total energy consumption (kWh m−2) by light type (i = Industrial LED, HPS, Horticultural LED), and E F E L , G H G is the electricity consumption intensity (kg CO2e kWh−1).
To evaluate the economic implications of these emissions, the carbon pollution price of $65 per tonne of CO2e for Canada in 2023 [52] was used. The formula to calculate the CO2e-related cost embedded in each kWh of electricity consumption is as follows:
C C O 2 = P C O 2   1000 × E F E L , G H G
where C C O 2 is the CO2e-related cost (cents kWh−1), P C O 2 is the carbon pollution price (CAD tonne−1 CO2e), and E F E L , G H G is the electricity consumption intensity (kg CO2e kWh−1). Using the carbon pollution price and the electricity consumption intensity, the CO2e-related cost embedded in each kilowatt-hour of electricity consumed is 3.51 cents kWh−1.

4.8. Statistical Analysis

Before conducting statistical analysis, data normality was assessed using the Shapiro–Wilk test, and homogeneity of variance was tested with Levene’s test. Outliers were identified and reviewed for potential data entry errors or valid extreme values. A one-way ANOVA was then performed to evaluate differences among treatments. When significant differences were found (p < 0.05), Tukey’s HSD test was applied for pairwise mean comparisons to identify specific treatment differences. Statistical analysis and visualization were carried out using R (V. 4.2), Python (V. 3.13), and MATLAB (V. R2023a), with relevant packages [53,54,55].

5. Conclusions

This study demonstrates the importance of supplemental lighting in optimizing cucumber cultivation in commercial-scale controlled environment agriculture (CEA). High-pressure sodium (HPS) lighting achieved the highest yields but at significant environmental and energy costs. In contrast, industrial LEDs (iLEDs) and horticultural LEDs (hLEDs) provided sustainable alternatives with competitive yields, improved stress resilience, and lowered energy consumption. iLEDs were found as the most cost-effective and eco-friendly option, balancing productivity and sustainability. While this study focused on individual lighting systems, the findings suggest that hybrid lighting systems combining HPS and LEDs could be explored further as a promising approach. By integrating the high-yield potential of HPS with the energy efficiency and spectral flexibility of LEDs, hybrid systems can optimize cucumber crop performance while reducing environmental impacts. These results emphasize the need for optimizing light spectra to enhance plant physiological performance and reduce environmental footprints, contributing to sustainable CEA systems capable of addressing global food security challenges.

Supplementary Materials

The following supporting information can be downloaded at: https://www.mdpi.com/article/10.3390/horticulturae11010079/s1, Figure S1. Layout of controlled environment agriculture facility used in the experiment. Figure S2. Schematic diagram of circulating hydroponics system used in this experiment. Figure S3. Schematic of the Randomized Complete Block Design (RCBD) to test the effect of supplemental lights on plant performance. Figure S4. Temporal dynamics of plant height under different lighting treatments. Table S1. Fertilizer recipe for stock solutions A and B. Table S2. Element concentration in the feeding solution for hydroponic system (EC 1800 µS/cm). Table S3. Technical specifications and cost of different supplemental lighting types.

Author Contributions

Conceptualization, N.A.S.; methodology, S.M.H., A.K., S.K. and N.A.S.; validation, S.M.H. and A.K.; formal analysis, S.M.H., A.K. and S.K.; data curation, S.M.H.; writing—original draft preparation, S.M.H. and S.K.; writing—review and editing, S.M.H., A.K., S.K. and N.A.S.; visualization, S.M.H. and A.K.; supervision, S.M.H.; project administration, S.M.H.; funding acquisition, N.A.S. All authors have read and agreed to the published version of the manuscript.

Funding

This research was funded by Results Driven Agriculture Research (RDAR) and Agriculture Funding Consortium (AFC) under the funding number of 2023F279R. Tamura Imports Ltd. and Current Prairie Fisherman Corp. provided partial funding for LED lights. Vivent Biosignals funded the electrophysiology component of the study. These companies were not involved in the study design, data collection, analysis, interpretation of data, the writing of this article, or the decision to submit it for publication.

Data Availability Statement

The raw data used to analyze for this study are available by contacting corresponding authors.

Acknowledgments

The authors would also like to thank John Derksen, Gregory Holmes, Eric Stock, Kristine Wilson, Alexis Buzzee, Carrol Plummer, Norm Janssen, Moritz Graeff, Dongjin Kim, Brian Cook, Tyler Branson, Daria Ladighnia, Hector Eduardo Briones Espinoza, and Logan Petty for their support during the study.

Conflicts of Interest

Author Andrzej Kurenda was employed by the company Vivent SA. The remaining authors declare that the research was conducted in the absence of any commercial or financial relationships that could be construed as a potential conflict of interest.

References

  1. Roser, M.; Ritchie, H. Two Centuries of Rapid Global Population Growth Will Come to an End. Available online: https://ourworldindata.org/world-population-growth-past-future (accessed on 6 January 2025).
  2. Tilman, D.; Balzer, C.; Hill, J.; Befort, B.L. Global food demand and the sustainable intensification of agriculture. Proc. Natl. Acad. Sci. USA 2011, 108, 20260–20264. [Google Scholar] [CrossRef] [PubMed]
  3. FAO. The State of the World’s Land and Water Resources for Food and Agriculture-Systems at Breaking Point: Synthesis Report; Agriculture Organization of T.U.N.: Rome, Italy, 2021. [Google Scholar]
  4. van Dijk, M.; Morley, T.; Rau, M.L.; Saghai, Y. A Meta-Analysis of Projected Global Food Demand and Population at Risk of Hunger for the Period 2010–2050. Nat. Food 2021, 2, 494–501. [Google Scholar] [CrossRef] [PubMed]
  5. Dsouza, A.; Newman, L.; Graham, T.; Fraser, E.D.G. Exploring the Landscape of Controlled Environment Agriculture Research: A Systematic Scoping Review of Trends and Topics. Agric. Syst. 2023, 209, 103673. [Google Scholar] [CrossRef]
  6. Neo, D.C.J.; Ong, M.M.X.; Lee, Y.Y.; Teo, E.J.; Ong, Q.; Tanoto, H.; Xu, J.; Ong, K.S.; Suresh, V. Shaping and Tuning Lighting Conditions in Controlled Environment Agriculture: A Review. ACS Agric. Sci. Technol. 2022, 2, 3–16. [Google Scholar] [CrossRef]
  7. Appolloni, E.; Paucek, I.; Pennisi, G.; Stringari, G.; Gabarrell Durany, X.; Orsini, F.; Gianquinto, G. Supplemental LED Lighting Improves Fruit Growth and Yield of Tomato Grown under the Sub-Optimal Lighting Condition of a Building Integrated Rooftop Greenhouse (i-RTG). Horticulturae 2022, 8, 771. [Google Scholar] [CrossRef]
  8. Eylands, N.J.; Mattson, N.S. Influence of Far-Red Intensity during the Seedling Stage on Biomass Production and Photomorphogenic Characteristics in Leafy Greens under Sole-Source Lighting. Horticulturae 2023, 9, 1100. [Google Scholar] [CrossRef]
  9. Hamedalla, A.M.; Ali, M.M.; Ali, W.M.; Ahmed, M.A.A.; Kaseb, M.O.; Kalaji, H.M.; Gajc-Wolska, J.; Yousef, A.F. Increasing the Performance of Cucumber (Cucumis sativus L.) Seedlings by LED Illumination. Sci. Rep. 2022, 12, 852. [Google Scholar] [CrossRef]
  10. Tarakanov, I.G.; Tovstyko, D.A.; Lomakin, M.P.; Shmakov, A.S.; Sleptsov, N.N.; Shmarev, A.N.; Litvinskiy, V.A.; Ivlev, A.A. Effects of Light Spectral Quality on Photosynthetic Activity, Biomass Production, and Carbon Isotope Fractionation in Lettuce, Lactuca sativa L., Plants. Plants 2022, 11, 441. [Google Scholar] [CrossRef]
  11. Nguyen, T.K.L.; Cho, K.M.; Lee, H.Y.; Sim, H.S.; Kim, J.H.; Son, K.H. Growth, Fruit Yield, and Bioactive Compounds of Cherry Tomato in Response to Specific White-Based Full-Spectrum Supplemental LED Lighting. Horticulturae 2022, 8, 319. [Google Scholar] [CrossRef]
  12. Pattison, P.M.; Tsao, J.Y.; Brainard, G.C.; Bugbee, B. LEDs for Photons, Physiology and Food. Nature 2018, 563, 493–500. [Google Scholar] [CrossRef]
  13. Li, J.; Liu, Y.; Wang, J.; Liu, M.; Li, Y.; Zheng, J. Effects of Different LED Spectra on the Antioxidant Capacity and Nitrogen Metabolism of Chinese Cabbage (Brassica rapa L. Ssp. Pekinensis). Plants 2024, 13, 2958. [Google Scholar] [CrossRef] [PubMed]
  14. Katzin, D.; Marcelis, L.F.M.; van Mourik, S. Energy Savings in Greenhouses by Transition from High-Pressure Sodium to LED Lighting. Appl. Energy 2021, 281, 116019. [Google Scholar] [CrossRef]
  15. Singh, D.; Basu, C.; Meinhardt-Wollweber, M.; Roth, B. LEDs for Energy Efficient Greenhouse Lighting. Renew. Sustain. Energy Rev. 2015, 49, 139–147. [Google Scholar] [CrossRef]
  16. Sena, S.; Kumari, S.; Kumar, V.; Husen, A. Light Emitting Diode (LED) Lights for the Improvement of Plant Performance and Production: A Comprehensive Review. Curr. Res. Biotechnol. 2024, 7, 100184. [Google Scholar] [CrossRef]
  17. Nelson, J.A.; Bugbee, B. Economic Analysis of Greenhouse Lighting: Light Emitting Diodes vs. High Intensity Discharge Fixtures. PLoS ONE 2014, 9, e99010. [Google Scholar] [CrossRef]
  18. Kowalczyk, K.; Olewnicki, D.; Mirgos, M.; Gajc-Wolska, J. Comparison of Selected Costs in Greenhouse Cucumber Production with LED and HPS. Agronomy 2020, 10, 1342. [Google Scholar] [CrossRef]
  19. Chen, M.; Chory, J.; Fankhauser, C. Light Signal Transduction in Higher Plants. Annu. Rev. Genet. 2004, 38, 87–117. [Google Scholar] [CrossRef]
  20. Folta, K.M.; Carvalho, S.D. Photoreceptors and Control of Horticultural Plant Traits. HortScience 2015, 50, 1274–1280. [Google Scholar] [CrossRef]
  21. Paradiso, R.; Proietti, S. Light-Quality Manipulation to Control Plant Growth and Photomorphogenesis in Greenhouse Horticulture: The State of the Art and the Opportunities of Modern LED Systems. J. Plant Growth Regul. 2022, 41, 742–780. [Google Scholar] [CrossRef]
  22. Spall, C.E.; Lopez, R.G. Supplemental Lighting Quality Influences Time to Flower and Finished Quality of Three Long-Day Specialty Cut Flowers. Horticulturae 2023, 9, 73. [Google Scholar] [CrossRef]
  23. Bugbee, B. Toward an Optimal Spectral Quality for Plant Growth and Development: The Importance of Radiation Capture. Acta Hortic. 2016, 1134, 1134. [Google Scholar] [CrossRef]
  24. Li, Q.; Kubota, C. Effects of Supplemental Light Quality on Growth and Phytochemicals of Baby Leaf Lettuce. Environ. Exp. Bot. 2009, 67, 59–64. [Google Scholar] [CrossRef]
  25. Statistics Canada. Table 32-10-0456-01 Production and Value of Greenhouse Fruits and Vegetables. Geography: Alberta. Available online: https://www150.statcan.gc.ca/t1/tbl1/en/tv.action?pid=3210045601 (accessed on 8 June 2024).
  26. Average Electricity Price for Farm Use (Excluding Service or Delivery Charge) by the End of May 2024 per 100 kwh. Available online: https://www.agric.gov.ab.ca/app21/farminputprices (accessed on 8 June 2024).
  27. Jin, D.; Su, X.; Li, Y.; Shi, M.; Yang, B.; Wan, W.; Wen, X.; Yang, S.; Ding, X.; Zou, J. Effect of Red and Blue Light on Cucumber Seedlings Grown in a Plant Factory. Horticulturae 2023, 9, 124. [Google Scholar] [CrossRef]
  28. Wu, B.S.; Hitti, Y.; MacPherson, S.; Orsat, V.; Lefsrud, M.G. Comparison and Perspective of Conventional and LED Lighting for Photobiology and Industry Applications. Environ. Exp. Bot. 2020, 171, 103953. [Google Scholar] [CrossRef]
  29. Kang, C.; Zhang, Y.; Cheng, R.; Kaiser, E.; Yang, Q.; Li, T. Acclimating Cucumber Plants to Blue Supplemental Light Promotes Growth in Full Sunlight. Front. Plant Sci. 2021, 12, 782465. [Google Scholar] [CrossRef]
  30. Dutta Gupta, S. Light Emitting Diodes for Agriculture: Smart Lighting; Springer Nature: Singapore, 2017. [Google Scholar] [CrossRef]
  31. Brini, F.; Mseddi, K.; Brestic, M.; Landi, M. Hormone-Mediated Plant Responses to Light Quality and Quantity. Environ. Exp. Bot. 2022, 202, 105026. [Google Scholar] [CrossRef]
  32. Slattery, R.A.; Ort, D.R. Carbon Assimilation in Crops at High Temperatures. Plant Cell Environ. 2019, 42, 2750–2758. [Google Scholar] [CrossRef]
  33. Terashima, I.; Fujita, T.; Inoue, T.; Chow, W.S.; Oguchi, R. Green Light Drives Leaf Photosynthesis More Efficiently than Red Light in Strong White Light: Revisiting the Enigmatic Question of Why Leaves Are Green. Plant Cell Physiol. 2009, 50, 684–697. [Google Scholar] [CrossRef]
  34. Zhang, N.; van Westreenen, A.; He, L.; Evers, J.B.; Anten, N.P.R.; Marcelis, L.F.M. Light from below Matters: Quantifying the Consequences of Responses to Far-Red Light Reflected Upwards for Plant Performance in Heterogeneous Canopies. Plant Cell Environ. 2021, 44, 102–113. [Google Scholar] [CrossRef]
  35. Chen, Y.; Bian, Z.; Marcelis, L.F.M.; Heuvelink, E.; Yang, Q.; Kaiser, E. Green Light Is Similarly Effective in Promoting Plant Biomass as Red/Blue Light: A Meta-Analysis. J. Exp. Bot. 2024, 75, 5655–5666. [Google Scholar] [CrossRef]
  36. Wang, T.; Sun, Q.; Zheng, Y.; Xu, Y.; Liu, B.; Li, Q. Effects of Red and Blue Light on the Growth, Photosynthesis, and Subsequent Growth under Fluctuating Light of Cucumber Seedlings. Plants 2024, 13, 1668. [Google Scholar] [CrossRef] [PubMed]
  37. Naznin, M.T.; Lefsrud, M.; Gravel, V.; Azad, M.O.K. Blue Light Added with Red LEDs Enhance Growth Characteristics, Pigments Content, and Antioxidant Capacity in Lettuce, Spinach, Kale, Basil, and Sweet Pepper in a Controlled Environment. Plants 2019, 8, 93. [Google Scholar] [CrossRef] [PubMed]
  38. Hogewoning, S.W.; Trouwborst, G.; Maljaars, H.; Poorter, H.; van Ieperen, W.; Harbinson, J. Blue Light Dose-Responses of Leaf Photosynthesis, Morphology, and Chemical Composition of Cucumis Sativus Grown under Different Combinations of Red and Blue Light. J. Exp. Bot. 2010, 61, 3107–3117. [Google Scholar] [CrossRef] [PubMed]
  39. Li, Q.; Liu, Y.; Tian, S.; Liang, Z.; Li, S.; Li, Y.; Wei, M.; Zhang, D. Effect of Supplemental Lighting on Water Transport, Photosynthetic Carbon Gain and Water Use Efficiency in Greenhouse Tomato. Sci. Hortic. 2019, 256, 108630. [Google Scholar] [CrossRef]
  40. Giliberto, L.; Perrotta, G.; Pallara, P.; Weller, J.L.; Fraser, P.D.; Bramley, P.M.; Fiore, A.; Tavazza, M.; Giuliano, G. Manipulation of the Blue Light Photoreceptor Cryptochrome 2 in Tomato Affects Vegetative Development, Flowering Time, and Fruit Antioxidant Content. Plant Physiol. 2005, 137, 199–208. [Google Scholar] [CrossRef]
  41. Pech, R.; Volná, A.; Špunda, V.; Nezval, J. Blue Light as an Important Factor Increasing Plant Tolerance to Acute Photooxidative Stress. Environ. Exp. Bot. 2024, 226, 105923. [Google Scholar] [CrossRef]
  42. Borbély, P.; Gasperl, A.; Pálmai, T.; Ahres, M.; Asghar, M.A.; Galiba, G.; Müller, M.; Kocsy, G. Light Intensity-and Spectrum-Dependent Redox Regulation of Plant Metabolism. Antioxidants 2022, 11, 1311. [Google Scholar] [CrossRef]
  43. Jiménez-Viveros, Y.; Núñez-Palenius, H.G.; Fierros-Romero, G.; Valiente-Banuet, J.I. Modification of Light Characteristics Affect the Phytochemical Profile of Peppers. Horticulturae 2023, 9, 72. [Google Scholar] [CrossRef]
  44. Yavari, N.; Tripathi, R.; Wu, B.S.; MacPherson, S.; Singh, J.; Lefsrud, M. The Effect of Light Quality on Plant Physiology, Photosynthetic, and Stress Response in Arabidopsis Thaliana Leaves. PLoS ONE 2021, 16, e0247380. [Google Scholar] [CrossRef]
  45. Nicholsa, M. LEDs (Light Emitting Diodes) in Horticulture. Acta Hortic. 2017, 1176, 23–24. [Google Scholar] [CrossRef]
  46. Iddio, E.; Wang, L.; Thomas, Y.; McMorrow, G.; Denzer, A. Energy Efficient Operation and Modeling for Greenhouses: A Literature Review. Renew. Sustain. Energy Rev. 2020, 117, 109480. [Google Scholar] [CrossRef]
  47. Available online: https://rijkzwaanusa.com/cucumber/VERDON-RZ-F1-24-150-prdCS10684-ctgCrops.cucumber (accessed on 8 June 2024).
  48. Campbell, G.S.; Norman, J.M. The Description and Measurement of Plant Canopy Structure. In Plant Canopies: Their Growth Form Function; Cambridge University Press: Cambridge, UK, 1990; pp. 1–19. [Google Scholar]
  49. CFIA, A.C.F.I. Grades and Requirements for Greenhouse Long Seedless Cucumbers. Available online: https://inspection.canada.ca/en/about-cfia/acts-and-regulations/list-acts-and-regulations/documents-incorporated-reference/canadian-grade-compendium-volume-2#s27c3 (accessed on 8 June 2024).
  50. Tran, D.; Dutoit, F.; Najdenovska, E.; Wallbridge, N.; Plummer, C.; Mazza, M.; Raileanu, L.E.; Camps, C. Electrophysiological Assessment of Plant Status Outside a Faraday Cage Using Supervised Machine Learning. Sci. Rep. 2019, 9, 17073. [Google Scholar] [CrossRef] [PubMed]
  51. A Consumption Intensity Indicator Is Derived to Reflect the GHG Emission Intensity of Electricity as It Is Delivered to the Consumer. Available online: https://www.canada.ca/en/environment-climate-change/services/climate-change/pricing-pollution-how-it-will-work/output-based-pricing-system/federal-greenhouse-gas-offset-system/emission-factors-reference-values.html (accessed on 8 June 2024).
  52. Available online: https://www.canada.ca/en/revenue-agency/services/forms-publications/publications/fcrates/fuel-charge-rates.html (accessed on 8 June 2024).
  53. The MathWorks Inc. MATLAB, Version: 9.13.0 (R2022b); The MathWorks Inc.: Natick, MA, USA, 2022. [Google Scholar]
  54. R Core Team. R: A Language and Environment for Statistical Computing; R Core Team: Vienna, Austria, 2024. [Google Scholar]
  55. Harris, C.R.; Millman, K.J.; van der Walt, S.J.; Gommers, R.; Virtanen, P.; Cournapeau, D.; Wieser, E.; Taylor, J.; Berg, S.; Smith, N.J.; et al. Array Programming with NumPy. Nature 2020, 585, 357–362. [Google Scholar] [CrossRef] [PubMed]
Figure 1. Spectral distribution of supplemental lighting treatments and controls used in the study. Panels (ad) display the control, horticultural LED (hLED), industrial LED (iLED), and HPS treatments, respectively. On the panels, the x-axis represents the wavelength range in nanometers (nm). Panel (e) provides a table detailing the percentage distribution of different spectrum ranges (400–750 nm) for each light source with a photosynthetic photon flux density (PPFD) of 250 µmol m−2 s−1, measured directly at the canopy level without natural light. For the control treatment (natural light), the spectral distribution was also measured at a PPFD of 250 µmol m−2 s−1. The color bar in the table corresponds to the spectral ranges depicted in the graphs.
Horticulturae 11 00079 g001
Figure 2. Flowering induction and leaf area index (LAI) response to supplemental lighting. (a) The distribution and density of flowering days post-transplantation in each treatment group. The y-axis indicates the number of days after transplantation at which flowering occurred. (b) The temporal dynamics of Leaf Area Index (LAI) for the same treatment groups throughout the growing season. Dates formatted as month-day represent the specific days when LAI measurements were taken. The color legend, Control (red), Horticultural LED (yellow), HPS (blue), and Industrial LED (green), identifies the treatment groups for both graphs.
Horticulturae 11 00079 g002
Figure 3. Yield and fruit quality under different supplemental lighting. (a) Yield (kg m−2) over four different treatment groups. (b) Fruit weight (kg) over the four treatment groups. (c) Fruit size (XS, S, M, and L) distribution percentages across different treatment groups. The mean yield and fruit weight are indicated by a red dot, and the mean values are displayed above it. Significance levels from Tukey’s HSD test are marked with asterisks (* p < 0.05, *** p < 0.001, ns: not significant).
Horticulturae 11 00079 g003
Figure 4. Photosynthetic parameters across different light treatments. (a) Net assimilation rate (A, µmol CO2 m−2 s−1), (b) stomatal conductance over water vapor (gsw, mol m−2s−1), (c) transpiration rate (E, mmol H2O m−2s−1), (d) intrinsic water use efficiency (iWUE, µmol CO2 (mol H2O)−1), (e) intrinsic carboxylation efficiency (iCE, µmol CO2 mol−1), and (f) electron transport rate (ETR, µmol electrons m−2 s−1). Photosynthetic parameters were recorded under a constant light of 500 µmol m−2 s−1 for all treatments. The boxplots display the median, interquartile range, and mean point (yellow) for each treatment. Different letters above the boxes indicate statistical mean comparison differences based on the Tukey HSD test (p < 0.05) among the treatments.
Horticulturae 11 00079 g004
Figure 5. (A) Time courses of daily amplitudes (mV) of cucumber electrical signals under different illumination types (Control, iLED, HPS, hLED) and (B) quantitative comparison of daily amplitudes (mV) under different illuminations in bi-weekly periods. Line plots represent mean daily amplitude and shaded envelopes represent standard deviations (n = 8). Box plots display the median and interquartile range. Whiskers indicate range of the data. Dots show mean daily amplitudes per day per group of 8 plants. Bars and labels above boxplots indicate statistical differences between groups based on the Mann–Whitney test, with following significance ranges: *** p < 0.001, ** p < 0.01, * p < 0.05, n.s. (not significant) p ≥ 0.05.
Horticulturae 11 00079 g005
Figure 6. Plant Balance Index (PBI) analysis across different lighting treatments over the trial period. (A) Bar charts depicting the percentage of time spent in the PBI range below 0.4, (B) in the PBI range of 0.4–0.8, and (C) above 0.8. Asterisks (*) indicate statistically significant differences between groups based on pairwise ANOVA tests. (D) Heatmap showing the temporal variation of PBI values for each treatment (Control, iLED, HPS, hLED) across the trial duration. Colors represent PBI values, with red indicating higher stress levels and green indicating more balanced states.
Horticulturae 11 00079 g006
Table 1. Mean comparison of plant morphological traits under different lighting treatments.
TreatmentSE (cm)SD (mm)ID (cm)LAI
MeanStdMeanStdMeanStdMeanStd
Control881.21 a38.3513.35 a1.109.99 a0.491.34 b0.61
HPS871.67 a35.3314.48 a1.149.54 b0.391.87 a0.62
Industrial LED854.56 b43.3814.26 b1.039.04 c0.571.95 a0.67
Horticultural LED838.04 c37.6413.67 b1.238.89 c0.452.10 a0.85
SE: stem elongation; SD: stem diameter; ID: internode distance; LAI: Leaf Area Index. Mean values followed by different letters within the same column indicate statistically significant differences between treatments (p < 0.05).
Table 2. Energy efficiency of supplemental lighting treatments during the study.
ParametersLight Type
iLEDhLEDHPS
Number of lights (Light m−2)0.690.280.62
Plant density (Plant m−2)1.651.651.65
Total hours of light application (h)2193.082193.082193.08
Energy consumption (kWh m−2)378.31465.39634.53
Carbon Emission (CO2e m−2)204.29251.31342.65
* Energy saving compared to HPS lighting (%)40.3826.65-
Initial light cost (CAD m−2)124.2252.0164.3
** Initial cost compared to iLED lighting (%)-102.9132.29
Company warranted lifespan (h)50,00050,00024,000
** Pollution cost compared to iLED (CAD m−2)-3.068.99
* The energy savings are calculated using a direct comparison of each light type to the HPS light. ** The initial cost and pollution cost are calculated using a direct comparison of each light type to the industrial LED light.
Disclaimer/Publisher’s Note: The statements, opinions and data contained in all publications are solely those of the individual author(s) and contributor(s) and not of MDPI and/or the editor(s). MDPI and/or the editor(s) disclaim responsibility for any injury to people or property resulting from any ideas, methods, instructions or products referred to in the content.

