Article

Leveraging Multispectral and 3D Phenotyping to Determine Morpho-Physiological Changes in Peppers Under Increasing Drought Stress Levels

1
Research Centre for Vegetable and Ornamental Crops, Council for Agricultural Research and Economics (CREA), 84098 Pontecagnano Faiano, Italy
2
Department of Agricultural Sciences, University of Naples Federico II, Via Università 100, 80055 Napoli, Italy
3
Consorzio Sativa Società Cooperativa Agricola, Via Calcinaro 2425, 47521 Cesena, Italy
*
Author to whom correspondence should be addressed.
Horticulturae 2025, 11(11), 1318; https://doi.org/10.3390/horticulturae11111318
Submission received: 7 October 2025 / Revised: 30 October 2025 / Accepted: 31 October 2025 / Published: 3 November 2025

Abstract

The expected population rise will require a maximum exploitation of agricultural lands with a consequent increase in the demand for freshwater for irrigation uses. Future trends predict increasing periods of drought stress, which may impact on crop performance and limit the future production. Pepper is one of the most economically important crops and globally consumed vegetables. This crop is highly demanding in terms of water supply, and so far, developing tolerant cultivars is one of the main targets for breeding. The aim of this study is to accurately determine how pepper plants react to water stress at the vegetative stage in order to select genotypes that better cope with drought. We implemented the PhenoHort Plant Eye phenotyping platform to precisely assess changes in plant architecture and morpho-physiological parameters on 25 cultivated pepper genotypes (Capsicum annuum) under drought stress conditions. Three different irrigation supply levels were considered, including the control, intense, and severe water stress, by irrigating every 24, 72, and 96 h, respectively. Daily monitoring of 20 traits allowed ~190,000 multispectral and tridimensional data points through scans over 6 weeks of cultivation, thus shedding light on changes in plant architecture and vegetation indices’ values during stress. The dissection of genotype (G) and treatment (T) interactions revealed that digital biomass and plant height traits were strongly affected by the T factor (more than 50% of total variance), whereas color and multispectral parameters were under greater genotypic control, accounting for 58.27% and 64.97% of the total variance for HUE and NPCI, respectively. The comparison of each accession with respect to the control and the application of multivariate models allowed us to select four drought-tolerant lines (G1, G2, G22, and G25) able to reduce the effects of drought on the morphological parameters and architecture of the plant with positive effects on vegetative indices. This work represents the first attempt to dissect the response of pepper under drought stress at the vegetative stage using a high-throughput and non-invasive phenotyping system, offering new insights for selecting resilient genotypes.

Graphical Abstract

1. Introduction

Cultivated pepper (Capsicum annuum) is one of the most important vegetables, ranking amongst the top seven in terms of world total production [1]. Thanks to the numerous uses as a fresh and processed food product [2], the crop is popular in both tropical and temperate zones, where the global cultivation reaches approximately 4 million hectares, with an increasing trend expected in the next decade [1]. Peppers are demanding in terms of water supply, and drought periods severely affect the quantity and quality of production [3,4]. Globally, the occurrence of climate changes and the presence of long periods of drought are threatening the cultivations [5], where water scarcity is projected to impact one-third of arable land, particularly for the developing countries [6].
The Intergovernmental Panel on Climate Change reported how the last decade (2011–2020) was 1.1 °C warmer compared to the last fifty years of the 20th century, with an increasing risk of drought on all continents [6]. In addition, the FAO’s agricultural outlook for the next decade [7] reports an expected increase of 7% of calorie intake in middle-income countries and 4% in low-income ones, which combined with the expected global population increase by 2050 [8] would require a maximum exploitation of agricultural lands.
It must be considered that agriculture accounts for over 70% of water consumption and that rising freshwater demands worldwide are leading to the overexploitation of groundwater overdrafts, thus negatively impacting soil degradation and salinization [9,10]. Therefore, it is essential to implement strategies to solve the challenges in managing water resources, among which the selection of resistant cultivars represents one of the foundations.
Investigating morphological and physiological changes in crops during water stress events is necessary to understand the response of plants and select those that best adapt to the drought conditions. Nevertheless, determining these parameters is not an easy assessment since water depletion involves multiple processes. Indeed, plants respond to drought by triggering their own response mechanisms, which include growth reduction, structural modifications, and alteration of metabolism [11,12]. In pepper, water deficit negatively impacts the photosynthetic rate, affecting plant biomass and total yield, nutrient uptake, and metabolite accumulation, with repercussions on the overall quality of production [13,14]. Thus, comprehending and controlling its effects is pivotal for the establishment of sustainable cultivations.
To date, the evaluations of the effects of drought stress on morphological and physiological traits in pepper have been carried out mostly through manual measurements. A caliper for measuring the diameter of the stem and other parts of plants and a ruler for measuring the height of the plant or leaf length are two examples of the techniques mostly employed [15,16]. Other techniques require the destruction of the plant, such as for biomass assessment [17]. These methods tend to be laborious, time consuming, and often inaccurate. Furthermore, measurements are often taken at the end of the cycle or at certain intervals, which does not allow for continuous monitoring of the plant’s development during stress. The possibility of implementing cutting-edge methodologies, thanks to advances in the biological and engineering fields, allowed in the past decade the development of imaging-based phenotyping technologies. These methods are powerful since they enable the non-destructive analysis of plant phenotypes with high throughput, precision, and high spatiotemporal frequency, thus overcoming the shortcomings of manual assessment, such as the low efficiency and the risk of inaccuracy [18,19].
These systems integrate wavelength data from RGB and multispectral/hyperspectral imaging sensors to reconstruct via artificial-intelligence-based analytics, plant architecture, and to compute vegetation indices required to determine plant health status [20]. RGB sensors use three spectral information channels—red (R), green (G), and blue (B) wavelengths—that lie within the visible (VIS) part of the electromagnetic spectrum (400–700 nm), thus providing the perceptible color of the object under study [21]. Each pixel in an RGB image is made up of a matrix of three values that can be used to create two-dimensional (2D) or three-dimensional (3D) images. Multispectral and hyperspectral imaging allow for wider coverage that also includes the near-infrared (NIR) region of the electromagnetic spectrum beyond that of the VIS. The main differences rely on the number of bands captured, and while the multispectral analysis refers to a limited number of discrete spectral bands (e.g., 3 to 15), the hyperspectral one acquires hundreds or thousands of narrow and continuous spectral bands [21]. These two imaging methods allow a deeper investigation of both the vegetation structure and physiological changes when plants undergo a stress period.
High-throughput phenotyping (HTP) platforms rely on plant-to-sensor (PS) systems, where the plants move and/or rotate on conveyor belts toward an imaging device [22,23], or sensor-to-plant (SP) infrastructures, where a mobile imaging apparatus mounted on a gantry system moves on stationary plants [24,25]. Although both are powerful, the PS systems are thought to be less feasible due to the requirement for more space and the complexity of the mechanical infrastructures required [26]. HTP imaging phenotyping systems have been applied for the investigation of plants’ reactions to drought stress mostly in cereals, as reviewed by Kim et al. [27], and several horticultural crops [28], while no attempts have been reported in peppers.
This study aims to cover this gap by comparatively assessing the performance of 25 pepper genotypes in the vegetative stage under control and two drought stress conditions. We implemented the Plant Eye 3D, a laser sensor mounted on an HTP-SP system able to acquire three-dimensional data and multispectral information, gathering up to 20 plant parameters non-invasively and with high processivity. The system has been used to continuously monitor, for six weeks, growth and morpho-physiological changes during water deficit. Findings highlight the main changes in plant architecture, offering important information on which pepper genotypes better fit with reduced irrigation growth conditions and for selecting the best candidates for breeding purposes.

2. Materials and Methods

2.1. Plant Material and Growth Details

The experiment was performed in the PhenoHort facility built in the glasshouse of CREA—Research Centre for Vegetable and Ornamental Crops, Pontecagnano Faiano, Italy (40°37′ N; 14°58′ E) [29]. Twenty-five cultivated C. annuum genotypes (namely G1–G25) were sown in a climate chamber (August 2024) and after three weeks, seedlings were transplanted into plastic pots with 12 cm diameter and 10 cm height, filled with 120 g of peat, whose water-holding capacity was determined by the gravimetric method. A complete randomized design with three replicates for each genotype was adopted to ensure random placement and avoid variability in greenhouse conditions. The trial lasted for 40 days from August 28 (day 1) to October 6 (day 40). All plants were irrigated daily (9:00 am) through an ebb and flow system able to pump the nutrient solution from the bottom of the bench on which pots were positioned. Each flooding cycle lasted for 30 min, including the flooding and draining phases. Before starting the experiment, after transplant, all treatments were irrigated daily for 6 days to avoid any occurring post-transplant crises. Then, from day 1 to day 40, three treatments were applied: CT, control condition by keeping daily irrigation; WS1, considered as intense water stress with irrigation turns every 72 h; WS2, considered as severe water stress with irrigation turns every 96 h. This system ensured even water distribution conditions in all treatments adopted. The nutrient solution included N-P-K fertilization consisting of 198.7 mg L−1 of KNO3, 91.7 mg L−1 of Ca(NO3)2, 41.7 mg L−1 of Mg(NO3)2, 68.3 mg L−1 of KH2PO4, 18.3 mg L−1 of K2SO4, 21.7 mg L−1 of MgSO4, 23.3 mg L−1 of (NH4)2SO4, and 0.113 ml L−1 of HNO3. In all treatments, nutrients were applied during the irrigation cycle for the duration of the trial. Through the entire cycle, temperature and relative humidity have been recorded using a HygroVUE5 (Hortus Srl, Milano, Italy) system, while solar radiation was recorded by a CS310 sensor (Campbell Scientific, Logan, UT, USA). Data are reported in Supplementary Table S1.

2.2. PhenoHort Phenotyping Platform Layout

The PhenoHort platform consisted of a PlantEye F500 scanner (Phenospex, Heerlen, The Netherlands) mounted on an automated gantry system and positioned at 1.80 m above the surface of the cultivation bench. The system drove the scanner along the x-y axes, thus guaranteeing the complete imaging data acquisition. Several metal barcodes (55.5 mm high) outlined the experiment, orientating the pots, tagging the treatments, and delimitating the beginning and end of each scan. This layout allowed a unique code for each pot, which combined the barcode, genotype, and treatment information. The system consisted of a dual digital sensor combining multispectral imaging with 3D vision able to acquire different wavelengths in the red (620–645 nm), green (530–540 nm), blue (460–485 nm), near-infrared (820–850 nm), and 3D laser (940 nm) channels, and then combined them into different spectral indices [30], as follows:
NDVI, normalized differential vegetation index:
N D V I = N I R R E D N I R + R E D
NPCI, normalized pigment chlorophyll ratio index:
N P C I = R E D B L U E R E D + B L U E
PSRI, plant senescence reflection index:
P S R I = R E D G R E E N N I R
GLI, green leaf index average:
G L I = 2 × G R E E N R E D B L U E 2 ×   G R E E N + R E D + B L U E
The dual scan was performed daily at 3:00 pm. After each scan, different steps were performed, including data pre-processing and filtering able to remove any distortion, segmentation for precise identification of plants and separation from any background objects, data normalization, and definition of plant morphological parameters calculated from the 3D model [30]. The raw data and the ply (Polygon File Format) files were automatically elaborated and retrieved from the Hortcontrol v. 3.8 software. Parameters are listed in Table 1.

2.3. Data Analysis

All data were analyzed using the R statistical software v. 4.0.2 [31]. Average differences between treatments and the control were compared using the Dunnett tests considering a p = 0.05 threshold to indicate statistically significant differences. All phenotypic traits were subjected to the two-factorial linear regression model to estimate the main effects of genotype (G), treatments (T), and their interactions (G × T). The general linear model with fixed factors was used following the equation:
μij = μ Gi + Tj + (G × T)ij + ε,
where μ is the grand mean, ‘G’ is the random effect of genotype ‘i’, ‘T’ is the effect of the treatment ‘j’, and ε represents the error term. The G effect refers to the 25 accessions studied, while the T effect includes the different applications of nutrient solution (both water and nutrients).
For each trait, the mean square values (MS) were used to estimate the magnitude of the observed effect, while the total sum of squares in percentage (TSS %) was calculated dividing the SS of the effect by the TSS. PCA loading and score plots were drawn in R 4.4.0 using the FactoMineR and the factoextra packages [32,33]. The prediction ellipses with a 95% level of confidence were added to the PCA score plot. The correlations among traits scored in each independent treatment were calculated from accession means using the corrplot R package v. 4.4 [34]. The Pearson linear coefficients of correlation (r) were calculated between pairs of traits, and the significance of correlations was evaluated at p < 0.05. The multi-trait genotype–ideotype distance index (MGIDI) [35] considering all traits was used to identify the best genotypes.

3. Results

3.1. Greenhouse Climatic Conditions

Details of daily temperature, relative humidity, and solar energy are shown in Figure 1. Considering that the experiment was conducted at the end of the summer season, the average temperatures remained in the range of 30 (first day of the experiment) to 16 (last day of the experiment) degrees (Figure 1a). From the middle of the experiment, both maximum and minimum temperatures remained stable with values of 25–26 °C and 20–21 °C, respectively. Overall, a linear trend was observed with decreases in both maximum and minimum °T from d1 to d40. On the contrary, relative humidity values showed greater fluctuations for the lower values, with average percentage ranging between 55% and 82% (Figure 1b). Relative humidity values resulted as stable during the third decade of the experiment. Solar radiation during the entire cycle did not exceed 600 µmol/m2/s w, with higher values recorded during the second and third decades of cultivation (Figure 1c).

3.2. Phenotypic Variation Across Trials

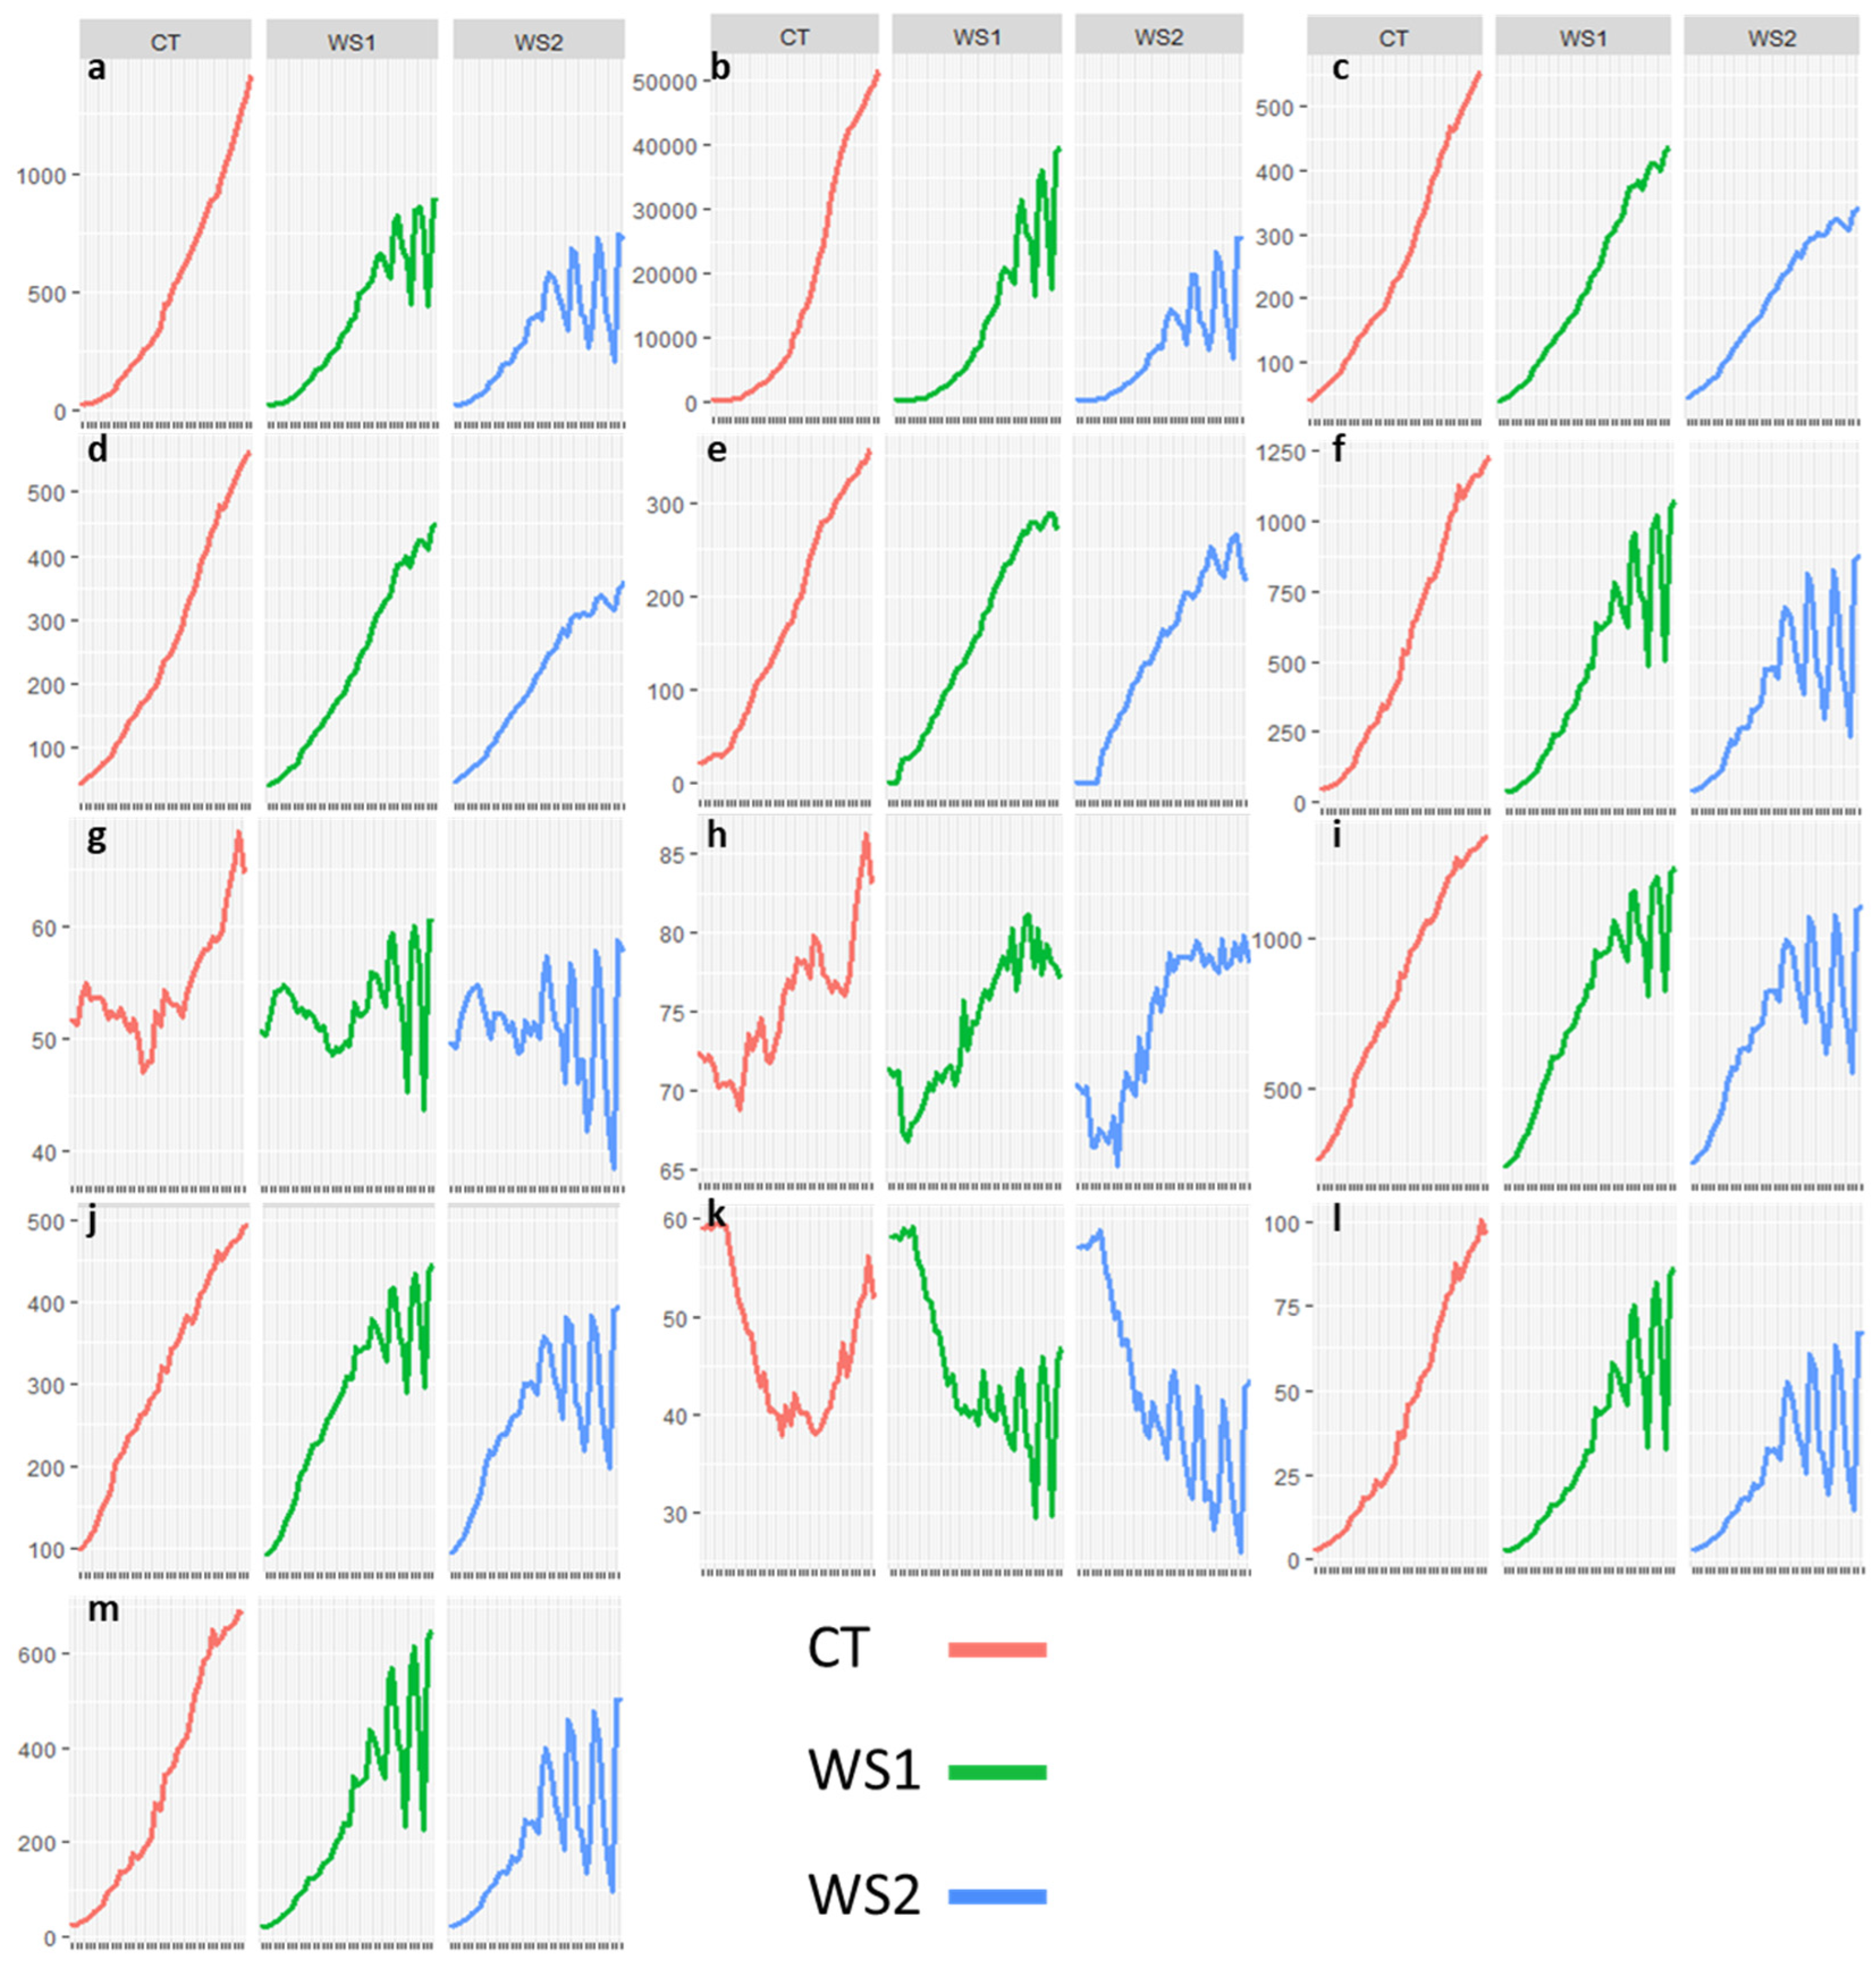
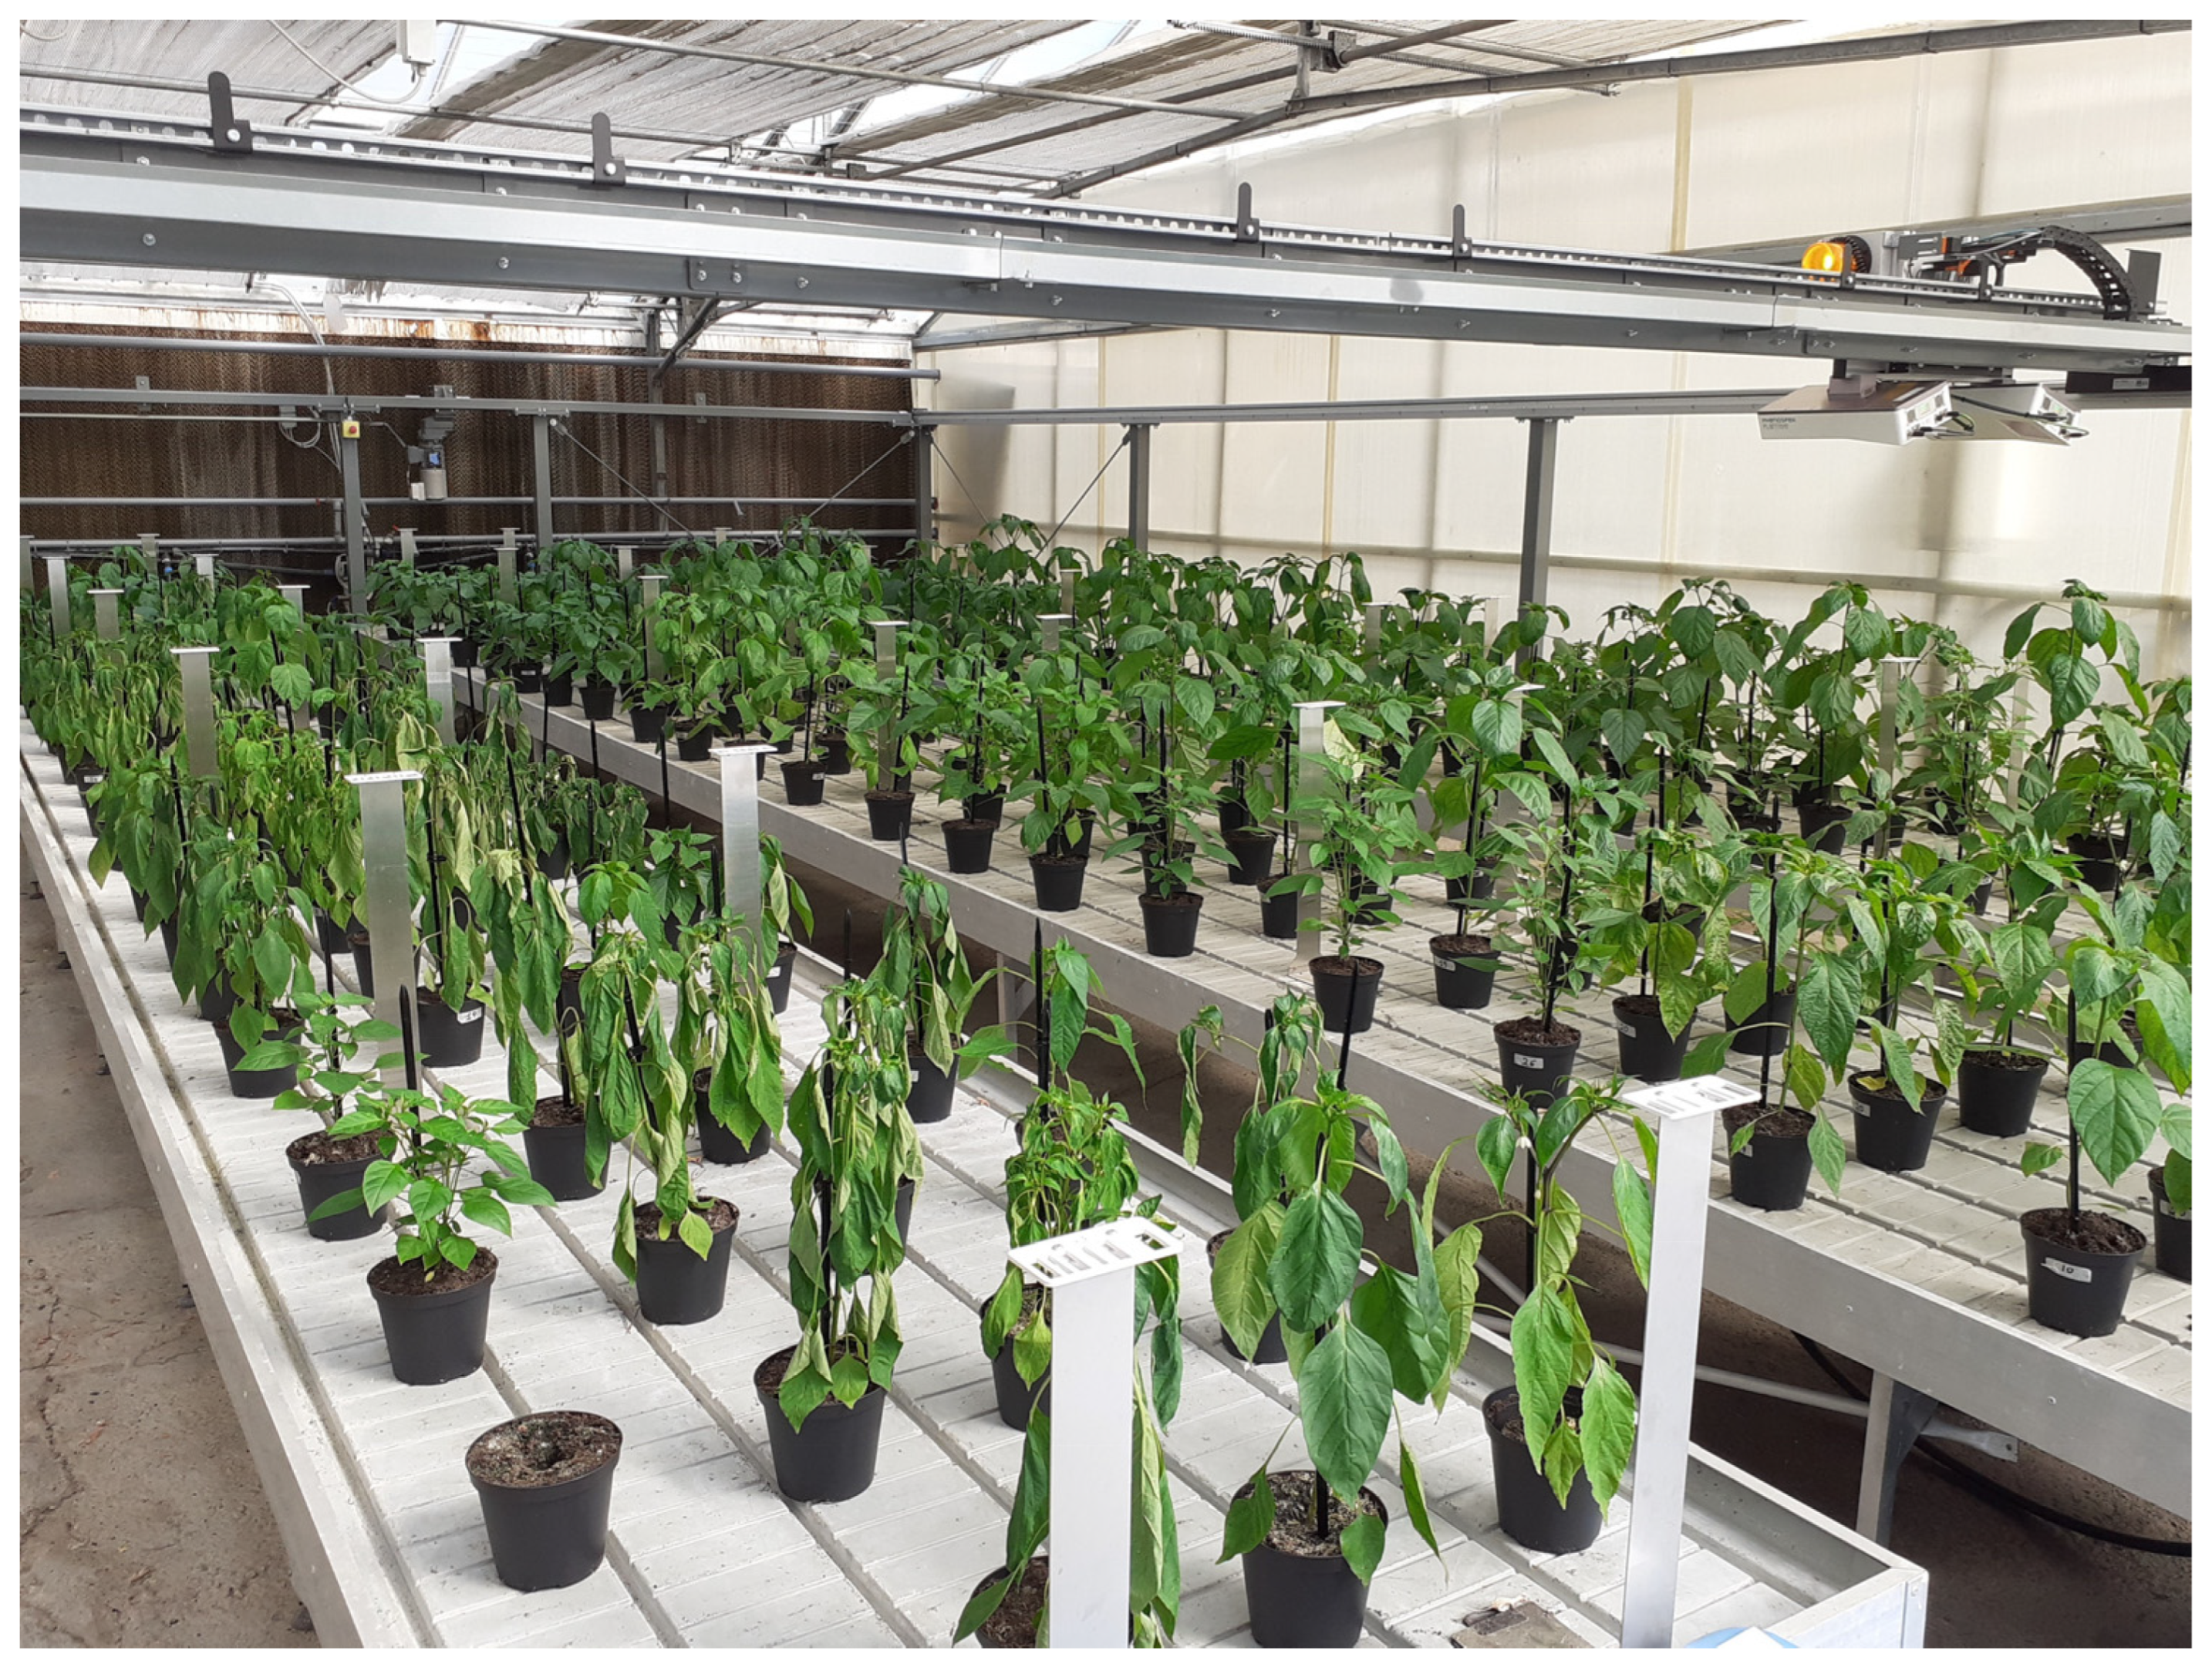
A wide variability was found for the assayed traits in the 25 genotypes tested. In Table 2, mean values and ranges referring to two growing periods: from day 1 to 20 and from day 21 to 40, are reported. The effects of applied stress were gradually more evident starting from the middle of the cycle, where more significant reductions were observed. Indeed, in the first 20 days there were no appreciable differences in the mean values of the traits of the plants cultivated in the three trials, and only some of them showed statistically significant differences between the control and the stressed treatments. In the second part of the cycle, all morphological traits showed a decreasing trend compared to the control, with statistically significant differences observed for both treatments, except for the convex hull aspect ratio. This was most evident when observing traits’ trends in the stress conditions across the 40-day experiment (Figure 2, Figure 3 and Figure 4). The rewatering effect in the two water deficit treatments was clear after three weeks for leaf-related traits. In fact, leaf area and biomass initially showed a linear increase, then decreased following the leaf wilting linked to the loss of turgor during drought stress (Figure 5) and increased further after the irrigation cycle (Figure 2). The same trend was observed for the convex hull traits, which reflected the projection and spread of the leaves in turn influenced by drought-rewatering effects.
A linear trend was observed instead for the height and the canopy light penetration depth. The canopy light penetration depth generally depends on the plant’s architecture and its response to stress. Leaf wilting due to loss of turgor may increase the light penetrability. In the same way, the increase in leaves’ dimensions during growth and the related inclination change linked to weight increase generates a greater opening of the foliage with a consequent increase of the trait. We observe a drought-rewatering effect due to the severe stress in the final phases of the experiment (Figure 2).
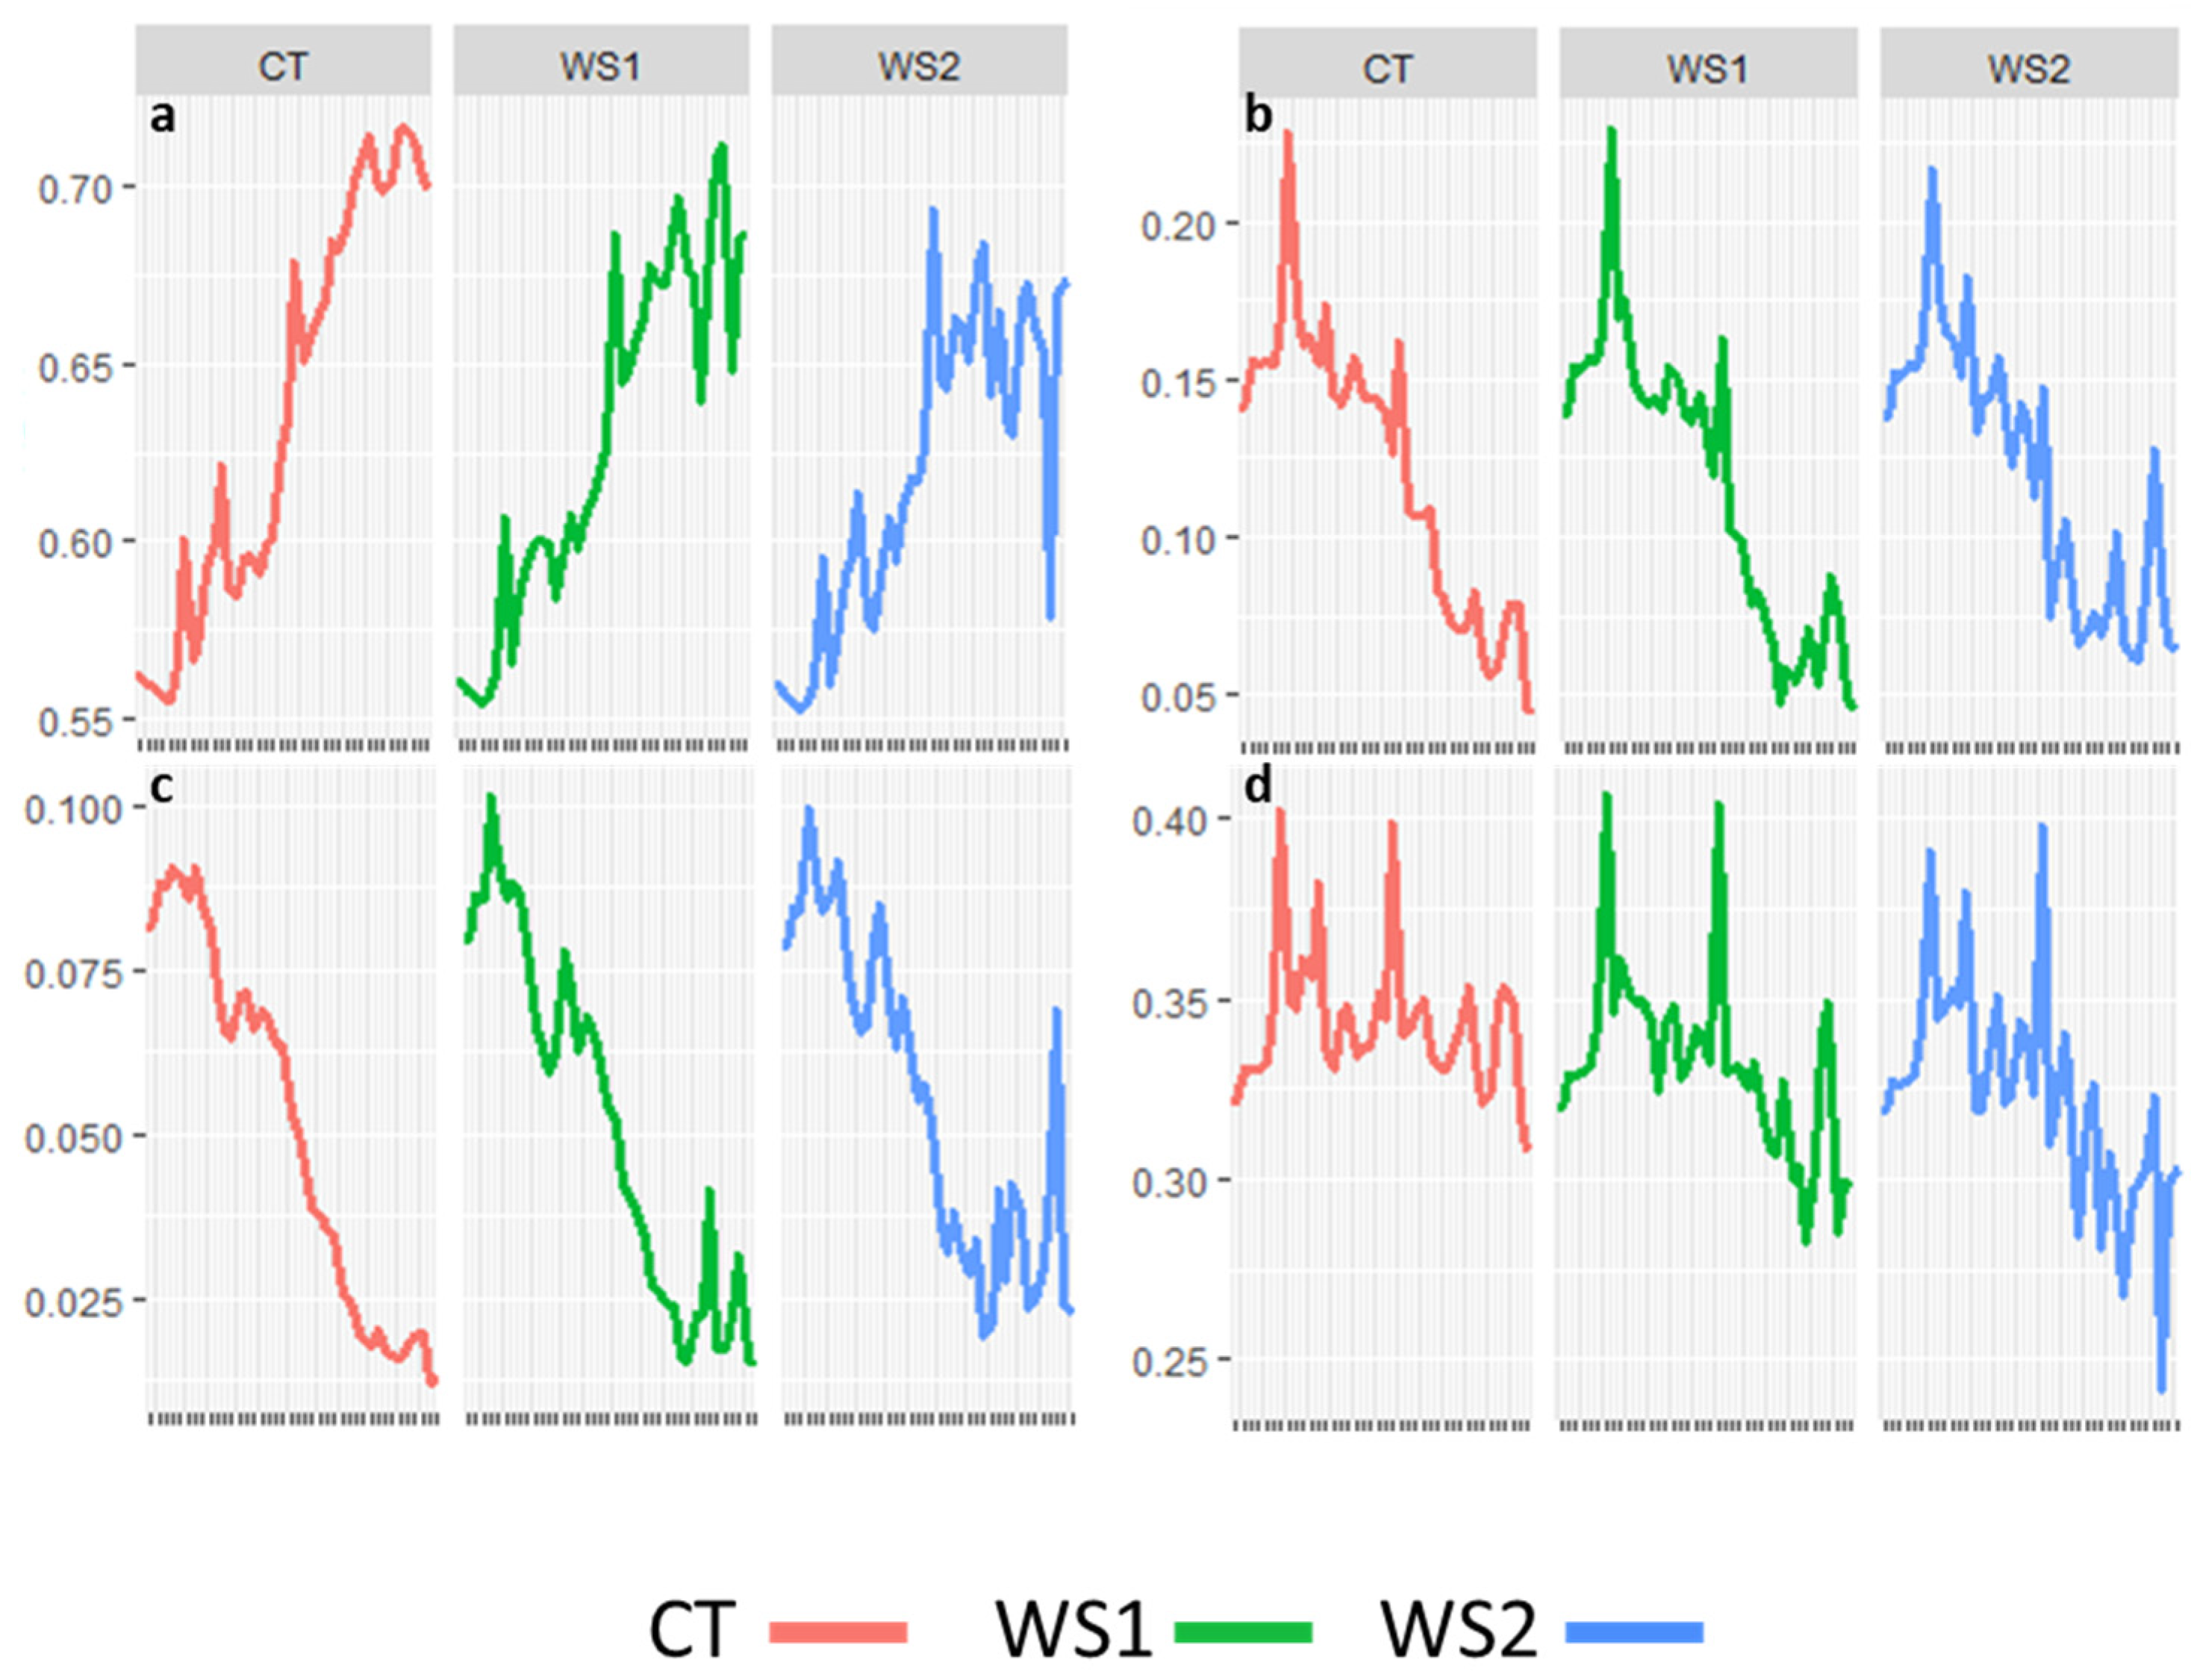
Projected leaf area and voxel volume total were the other two traits proportionally affected by water stress and drought-rewatering effects (Figure 3). When plants undergo drought stress conditions, these two metrics, which assess the plant’s projected leaf area on a two-dimensional plane and its leaf volume, respectively, drastically decline. For all treatments, we observed an increase in hue in the first weeks of growth and then observed a drastic decrease under severe drought stress during the last week. Hue is related to chlorophyll content, which decreases in stressed leaves. The same tendency was observed for NDVI and GLI, which are indicators of plant healthiness, while PSRI, which indicates the senescence status of plants after a similar trend between the three treatments, showed increases in the last week, in particular for the WS2 trial (Figure 4).

3.3. Genotype by Trait Interaction and Genotypic Variation

The results of combined analysis of variance for the 20 traits assayed in 3 treatments are reported in Table 3. We examined the final week of the trial (dd34–dd40), during which the effects of stress were most pronounced. On average, the genotype accounted for 29.62% of total variation expressed as the percentage of variance explained (TSS %), while the treatment (T) and the interaction between the two factors (G × T) explained 24.33 and 11.75 of TSS %, respectively.
The genotype was highly significant (p ≤ 0.01) for all traits and represented the main source of variation for color and multispectral data, as well as for vegetation indices. Among morphological parameters, the strongest effect of genotype (TSS = 49.77%) was found for canopy light penetration depth, while four parameters, including plant height average and maximum, convex hull area coverage, and surface angle average, showed TSS > 30%. A minor influence of the genotype was instead found for the three-dimensional leaf area and the digital biomass, which instead had a greater influence on the treatment. The treatment effect showed a low significant effect (p < 0.05) for HUE and for the NCPI index. Digital biomass and plant height parameters displayed the highest T effect (TSS % > 50%) and 9 out of 12 morphological traits showed a higher T effect compared to G. As for the G × T interaction, high significant effects were found for morphological data except for surface angle average, while among multispectral color data and vegetation indices, lightness average and PSRI exhibited the highest TSS, being 20.18% and 13.48%, respectively. Overall, several traits showed both high T and G × T effects, demonstrating the importance of these two factors in determining the effects of water stress. Among traits, morphological parameters had a proportion of variance attributed to G, T, and G × T, of 22.78%, 31.40%, and 11.38%, respectively, color data of 47.43% (G), 8.15% (T), and 13.36% (G × T), and spectral indices of 38.46% (G), 13.23% (T), and 11.75% (G × T).
To determine the response of the genotypes tested to the applied water stresses, the phenotypic difference between the treatments and the control was calculated and expressed as a percentage (Figure 6). Considering morphological traits, under drought stress most accessions showed a decrease in performances, nonetheless, there were some exceptions exhibiting trending improvements. Notably, both G01 and G03 exhibited rises of leaf area and digital biomass with intense water stress (WS1), while G16 displayed both increased digital biomass and plant height under WS1 conditions. Four genotypes (G01, G06, G16, and G17) increased the canopy penetration light depth in WS1, while for convex hull traits, the accessions G01, G02, G10, G18, and G22 showed increases greater than 10 percent for at least one trait under severe stress. As for NDVI, both G01 and G02 showed increases above 5% in both stressed trials, with G25 displaying outstanding values (>95%). A consistent decrease in PSRI was found in G01, G02, and G10. The drought-rewatering effect was evident in all instances (Figure 7). We report examples of four morphological traits, and no accession was able to mitigate this effect, although some (e.g., G01) showed good stress tolerance considering the trends compared to the control.
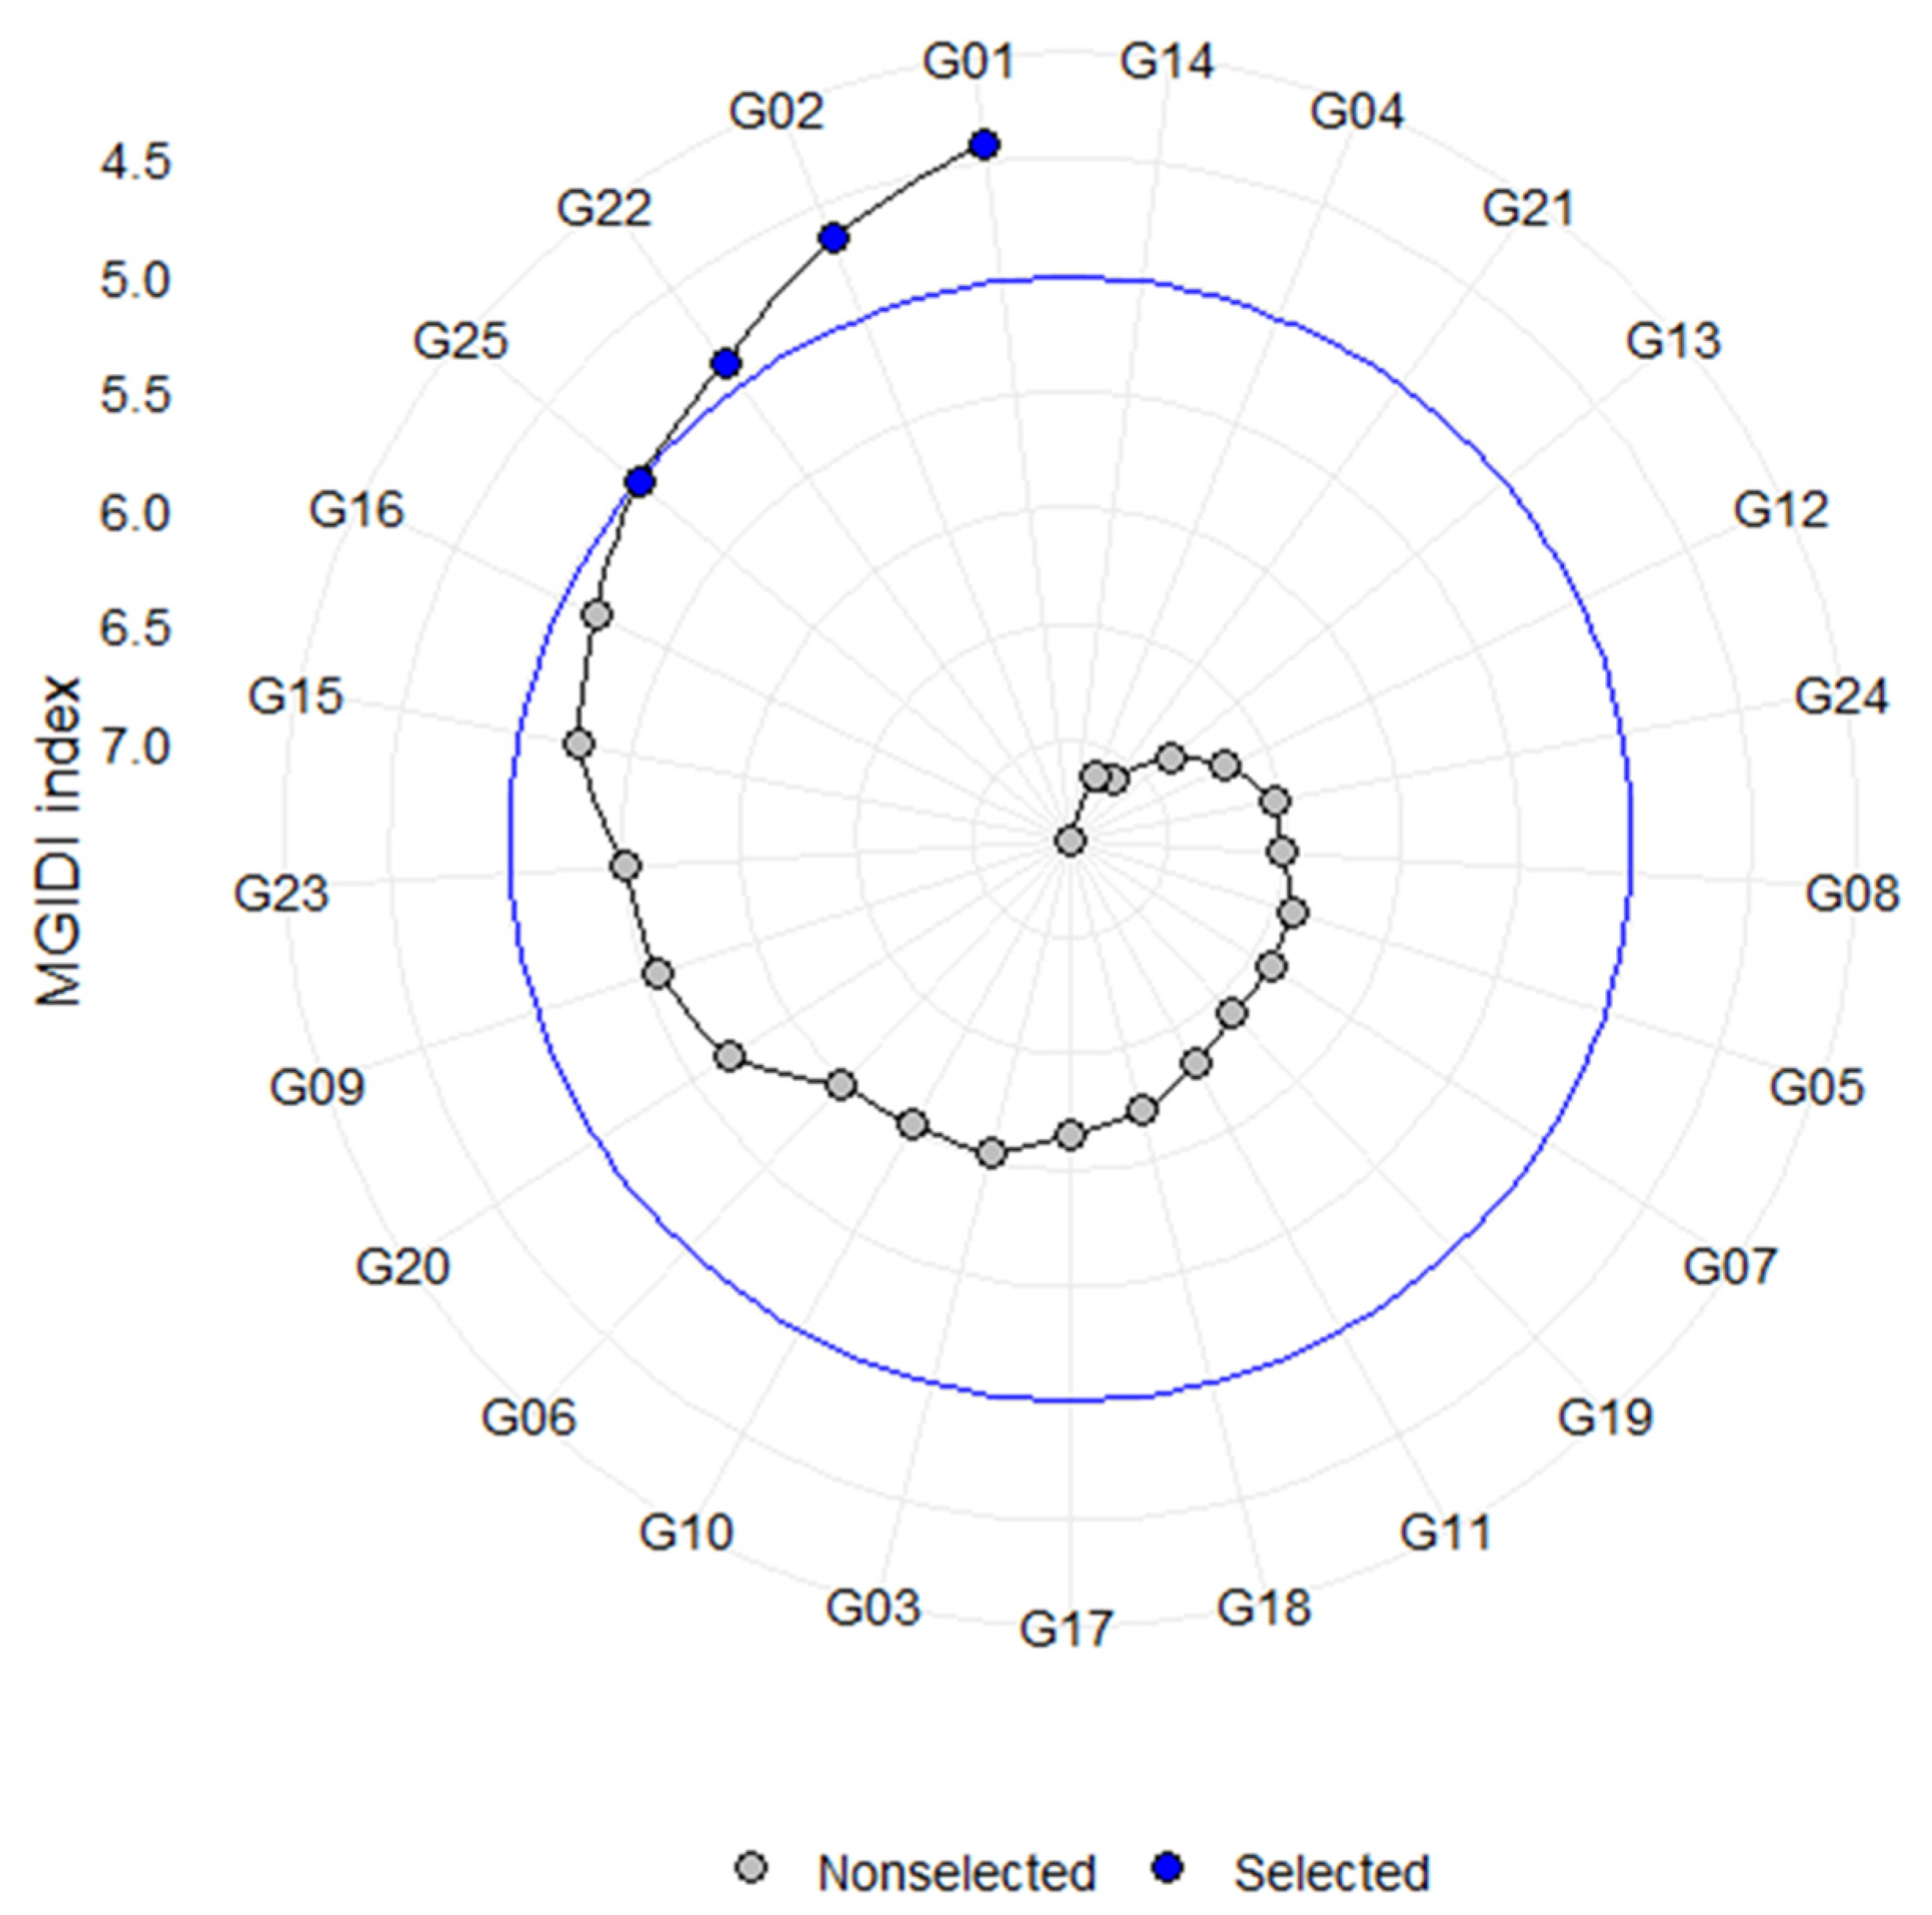
In order to select the best genotypes based on the performance obtained under stress conditions, the multi-trait genotype–ideotype distance index was implemented (Figure 8). According to a selection intensity of 16%, four genotypes (G01, G02, G22, and G25) resulted promising as tolerant for either intense or severe water stress, while the others showed a variable level of tolerance up to susceptibility.

3.4. Multivariate Analysis

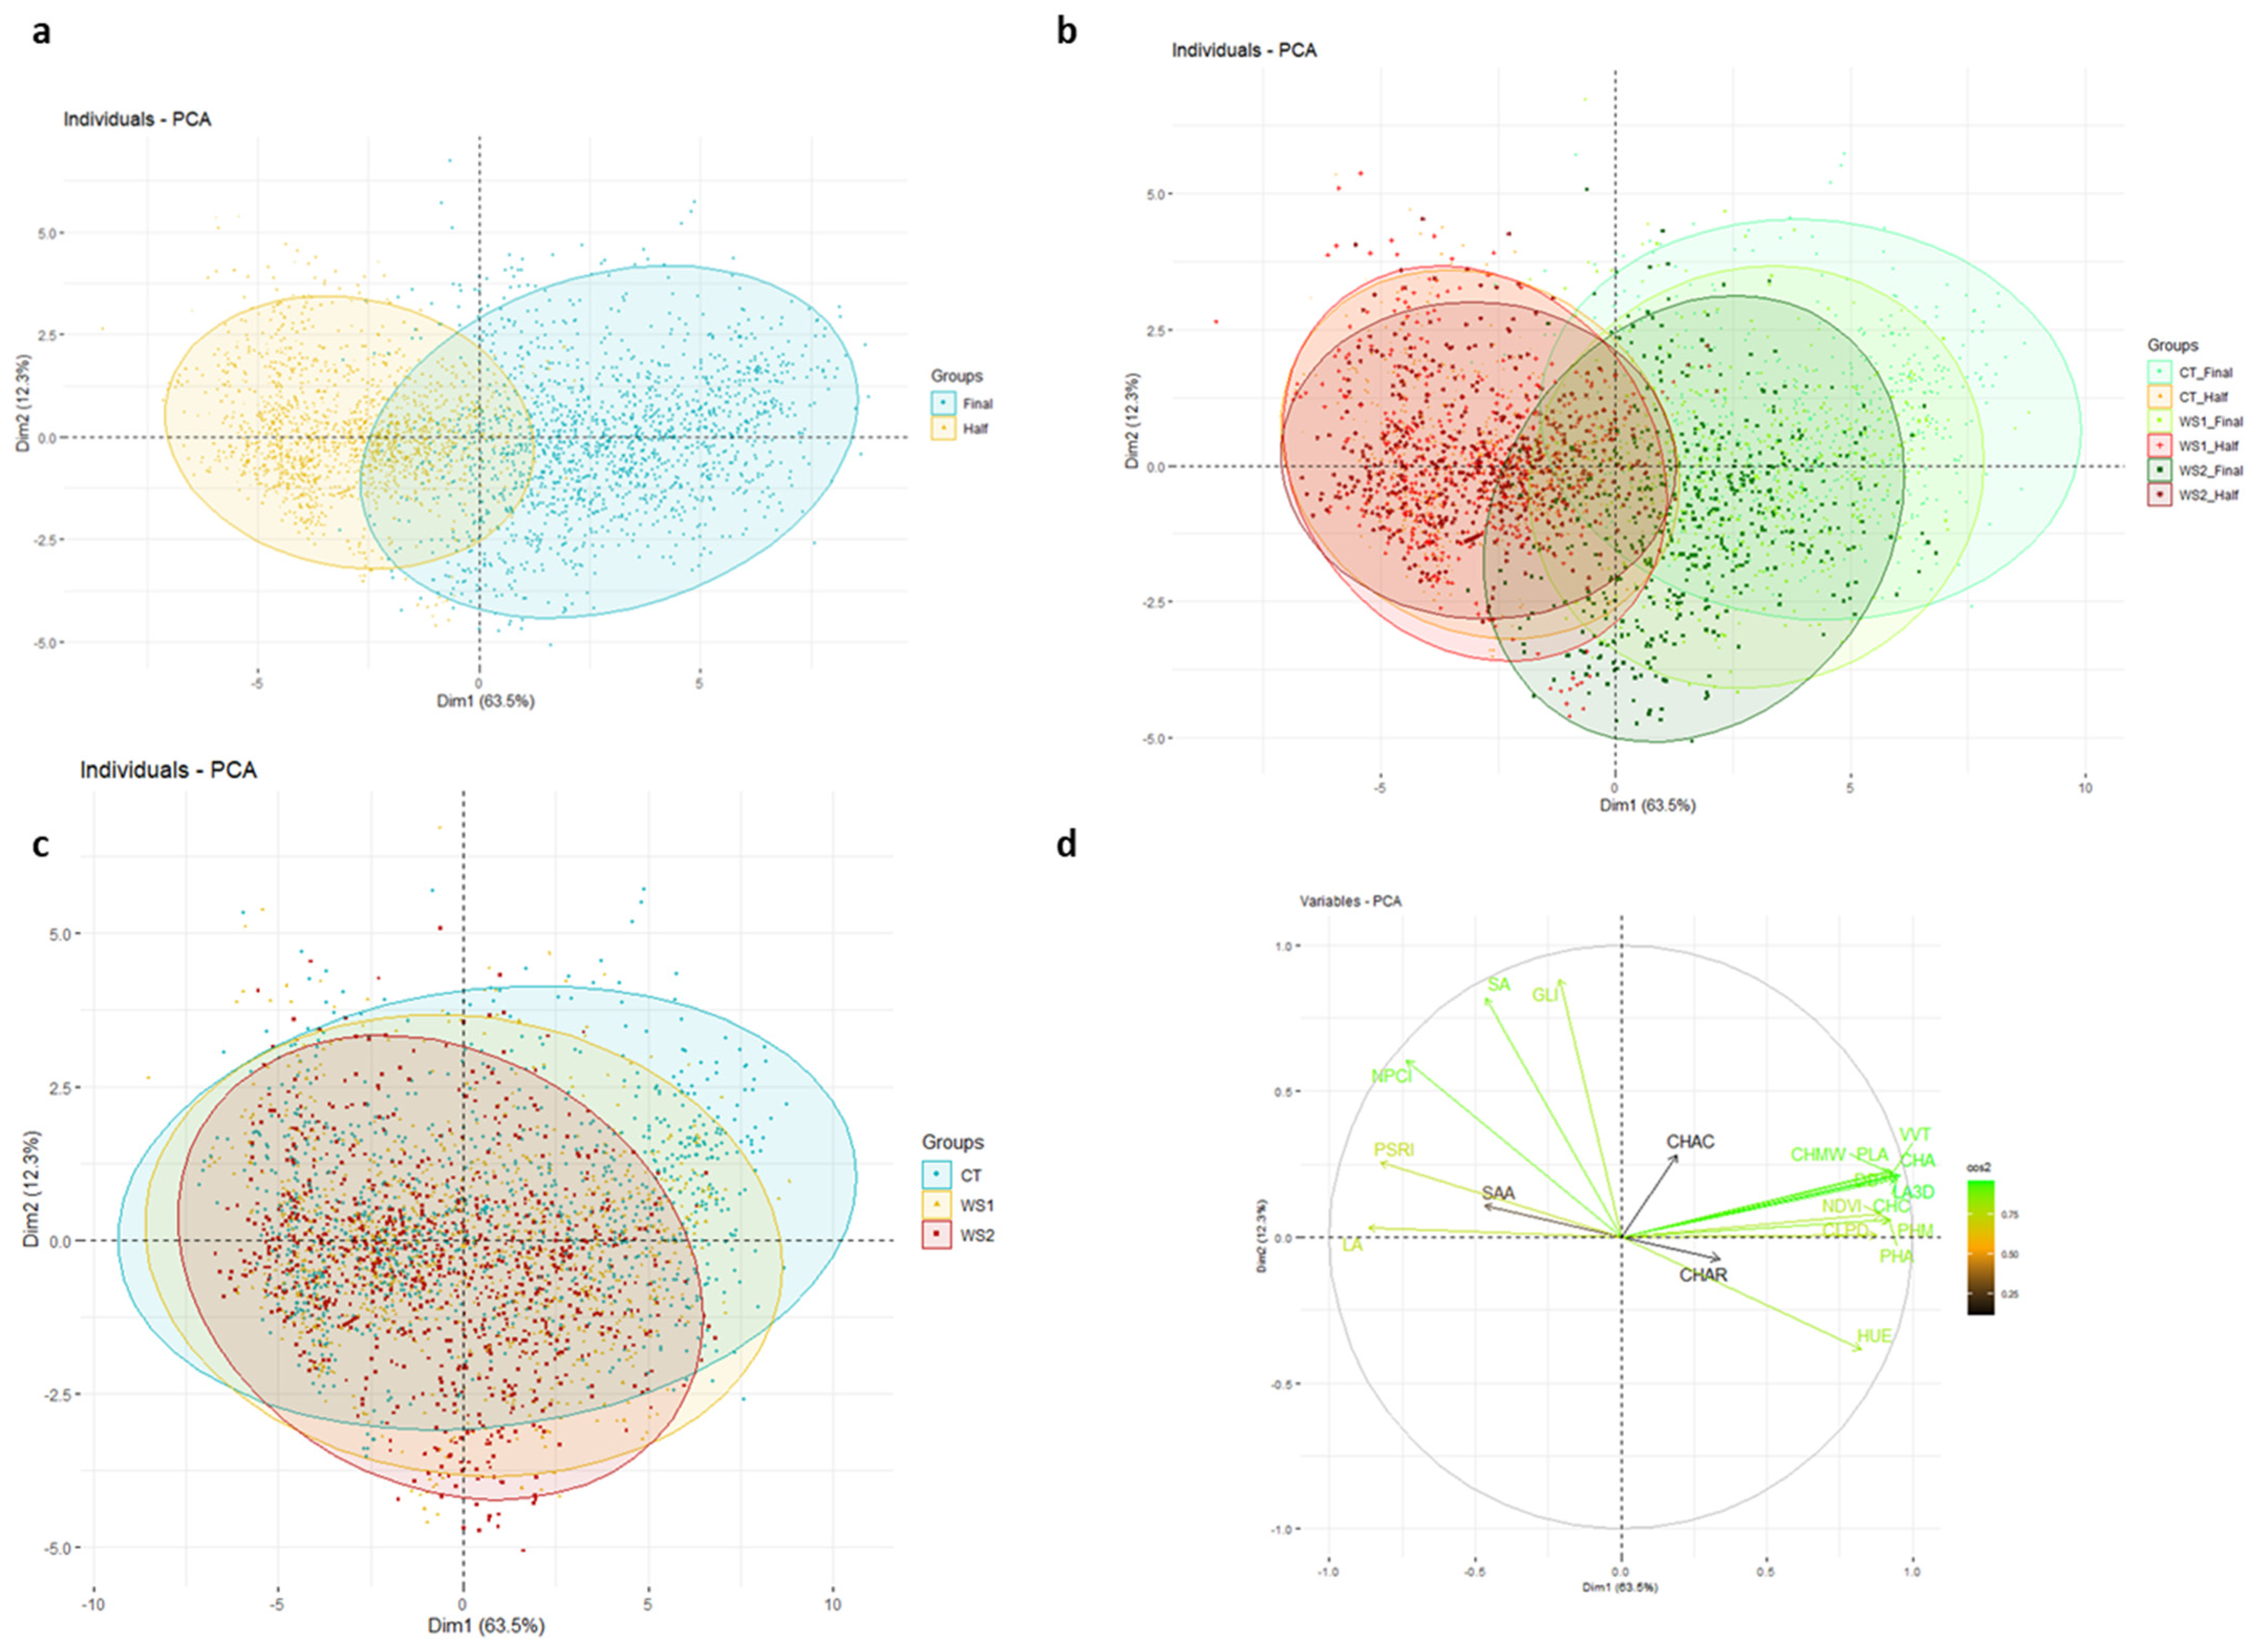
The principal component analyses (PCAs) in the first two dimensions explained 63.5% and 12.3% of the total variation. A separation between traits recorded in the first half of the cycle and the second one was visible although with minimal overlap (Figure 9a). In the first 20 days, no major differences were observed between the 3 conditions, but these became more evident in the second part of the experiment (Figure 9b). A greater variability was observed along the first component for genotypes grown under control conditions, while for water stress conditions, a greater variability was observed along the second axis. This trend was also observed in the PCA displaying the entire experiment (Figure 9c), which highlighted the greater variability of the control condition with respect to the drought stress trials. The assayed traits showed a greater correlation with the first component, which explained the large part of variability. Along with this, positive correlation was found for morphological traits, while negative correlations for color and spectra indices (Figure 9d). With the exception of HUE and CHAR, all traits were positively correlated with the second principal component.
The correlation among traits has been calculated for each treatment considering a significance threshold of p < 0.05 using the Pearson coefficient. The correlogram within the control condition is reported in Figure 10a, while Figure 10b,c represent the different water deficits applied.
The same patterns of correlations were found in all trials, although a higher number were found in the control conditions. CHAC did not show any correlation under drought stress, while in the control few correlations were detected, the strongest ones with CHAR (R = +0.64) and VVT (R = +0.50). Stress conditions instead highlighted positive correlations between SAA and SA and SAA and NPCI, for which no signal was found in the control. Overall, LA3D and DB showed weaker correlations with other traits than the control.

4. Discussion

In the years ahead, agriculture will face unprecedented challenges that will require a significant boost in productivity with less inputs. The occurrence of global warming is increasing the risk of drought in several agricultural regions, thus requiring greater attention in the use of water for agriculture. At the vegetative stage, pepper is particularly sensitive to drought due to its large leaf surface and high stomatal conductance [36], which accelerate water loss, significantly impacting plant development. Nevertheless, since plant response differs according to genotype [37], it is important to identify suitable genotypes that can withstand dry spells.
In the present study we implemented a high-throughput phenotyping system that yielded over 190,000 phenotypic data points related to 20 traits assayed on 25 genotypes through daily scans over 6 weeks. By combining 3D laser scanning and multispectral data, both morphological parameters and physiological indices were measured in a non-destructive manner, allowing us to compare plant changes between the control and the two stressed treatments. The system used includes the Dual Scan mode, which, as highlighted by Maphosa and colleagues [38], allows a better scanning coverage, thus providing a more detailed three-dimensional structure. This layout is suitable for scans on plants in a more advanced vegetative state, compared to plantlets in the case of the single overhead scanner. Consistent with prior research employing high-throughput phenotyping, most of the examined traits exhibited substantial responses to water stress [39,40].

4.1. Potentiality of PhenoHort for Morpho-Physiological Traits and Stress Indices Assessment

Results showed how several morphological traits, including plant height, leaf area, and digital biomass, decreased with the application of water stress with more drastic effects as the growth cycle progressed. During the vegetative stage, by closing leaf stomata and limiting the transpiration rate, plants reduce the energy needed for biomass accumulation, resulting in reduced leaf expansion and plant height, and in significant changes in plant architecture [40]. Other traits, such as canopy light penetration depth, increased in both control and stressed trials, depending on how the plant modifies its architecture upon stress. Generally, elevated stress levels may result in a reduction in canopy density, thus enhancing light penetration. In a previous study [40], it was reported that both the loss of leaf turgor due to stress and the weight of the leaves in healthy plants can increase the light incidence depth on the canopy. Our observations highlight a linear development of this trait in both control and stress trials, with lower performance in the latter, thus being not indicative of the effects of applied stress.
Plants that undergo drought stress show noticeable changes in the electromagnetic spectrum, increasing the visible red, green, and blue reflectance and decreasing in the near-infrared region (NIR) [41]. Indeed, while photosynthetic pigments predominantly govern reflectance in the visible area, leaf structure primarily influences reflectance in the near-infrared region [42]. The relationships between the bands allow us to determine vegetative indices, which highlight the health status of the plant. The normalized difference vegetation index (NDVI) is calculated as a ratio of NIR to the red channel and evaluates the presence of photosynthetic activity, as it correlates the red spectrum, where chlorophyll absorbs light, with the near-infrared spectrum, where leaves reflect light to prevent overheating [43]. On the contrary, the plant senescence reflectance index (PSRI) can be detected by the ratio between carotenoids and chlorophyll, which are degraded at differential rates during senescence [44]. Generally, the NDVI tends to increase during the vegetative phase unless any stress impacting photosynthetic activity occurs. In our study, we observed a rise of the index in the first weeks in all three trials, then observed an evident decrease under severe water stress conditions. Being linked to absorption in the NIR spectrum, NDVI is positively correlated with morphological traits. We observed a stronger correlation in the control trials, which consistently decreased in the stressed ones. This is in agreement with previous findings reporting positive correlations with NIR reflectance and morphological traits, and their simultaneous reduction in stress conditions [39,41].
The PSRI, in normal growing conditions, follows a linear decrease during the vegetative stage, then increases at the end of the cycle during the senescent phase and/or during the occurrence of stress. In the severe stress trials, PSRI stopped increasing after rewatering, although it maintained higher average values compared to both the control and moderate stress trial. Overall, the observed trend for PSRI in the control and water deficit conditions was consistent with previous studies [30,42,44]. The other two vegetative indices recorded by PhenoHort were the green leaf index (GLI) and the normalized pigment chlorophyll index (NPCI), both related to the reflectance in chlorophyll pigments and indicative of the health status of the plant. While GLI showed a decrease in the stressed trials, confirming a reduction of the vegetation, NPCI showed a slight increase when the stress was imposed. This index is correlated to the absorption of blue and red chlorophyll wavelengths and reflection of green light. The concentration of chlorophylls leads to an increase or decrease of both absorption and reflection, influencing the index strength [45]. Therefore, the signal is not straight, as the NDVI and previous studies support the evidence that NPCI is less influenced by water stress until plants reach senescence [46,47]. We observed negative correlations between NDVI and NPCI and positive ones between PSRI and NPCI with stronger signals in the control in all instances. Conversely, GLI only exhibited positive relationships with NDVI under extreme stress situations, demonstrating how a sharp drop in water clearly altered the chlorophyll content of plants. It should be noted, however, that the correlations we have reported represent the entire cycle and more significant effects are evident when considering the last week of cultivation.
Following the PCA, it was possible to observe how the application of stress reduced the variability of the entire set studied. This is particularly linked to the reduction of the performance of the morphological characters that accounted for most of the variability. Although the trend was evident in the second half of the cycle considered, even in the first one, a considerable reduction under severe stress conditions was observed. Nevertheless, it should be noted that the effects of applied stress could also be related to the different nutrient solution supply frequency during differentiated irrigation. A minimum amount of nutrient solution was indeed necessary to allow plant growth. However, we did not consider nutrients as a separate factor, as we employed a much more diluted solution than is often used and for a 40-day experiment, and we expected a low impact on the T effect, compared to the different water intake.

4.2. Identification of Best Accessions Resilient to Water Stress

The selection of potential genotypes able to cope with drought depends on their response to stress but also on the interaction of the genotype and the treatment for the trait to be selected. We observed a strong effect of the treatment on plant biomass and leaf area, which represent important parameters underlying the accumulation of primary metabolites functional both for growth and for fruit quality [48]. Traits related to plant height and canopy had greater genotypic control. This can be explained by the presence of QTLs with a greater effect in both pepper and other species [49,50].
To identify the genotypes that responded better to stress conditions, we implemented the multi-trait genotype–ideotype distance index (MGIDI) [35], a multivariate model that combines numerous attributes for the selection of superior genotypes. Among the best accessions, we identified G01 and G02, which under stress conditions showed improvements compared to the control for several traits related to biomass and plant architecture, as well as a slight improvement in NDVI and a reduction in PSRI, which highlighted the ability to withstand the impact of water deficit. G22, although showing decreases in biomass and leaf area, improved plant architectural traits and vegetative indices compared to the control, while G25 showed outstanding levels of color and vegetative indices, highlighting a better physiological response to stress. Although it was not possible to obtain a single ideotype capable of improving all characteristics, these genotypes may improve morpho-physiological traits by keeping low-input conditions. This information can be useful to set up new breeding programs able to combine the different characteristics to develop new hybrids and select improved lines in subsequent generations. To this end, precise phenotyping through the platform allows for the implementation of precise characterizations even at the vegetative stage, significantly reducing the selection time. The present experiment was highly informative to identify the best tolerant and susceptible pepper accessions. In the future, based on the performance of the genotypes tested, we plan to develop a novel mapping population to be explored for identification of candidate genes underlying drought stress resistance in pepper. To identify any new candidate genes underlying the physiological response to drought, a follow-up study involving the most tolerant and susceptible lines is also planned. This experiment will use the PhenoHort platform for drought stress response on the epigeal part, add additional soil moisture sensors, and implement transcriptomic analysis at various stages.

5. Conclusions

In the past few years, technological advancements have been made in the field of plant phenotyping, and different sensing technologies have been developed. In this work, we tested the potentiality of the automated PhenoHort platform for thorough assessment of morphological and physiological changes in cultivated pepper accessions under differential drought stress conditions. We demonstrated how severe water deficit stress impacts the performance of plants, although several genotypes better coped with drought conditions.
It was possible to determine the most predictive parameters for drought tolerance by taking into account the multivariate analysis of the studied traits, their response to the genotype-by-treatment interaction, and the performance of the most promising accessions. The first measures to observe among these are undoubtedly digital biomass, three-dimensional leaf area, and the normalized pigment chlorophyll ratio index. However, this study emphasized that the whole plant phenome needs to be considered, and species other than pepper may undoubtedly react differently. As an outcome, the platform must be used in future research on different plant species.
The methodology outlined here can be expanded to examine cultivar performance under additional abiotic stress (e.g., salt). Furthermore, using omics strategies in conjunction with multispectral data would allow us to thoroughly examine the mechanisms behind drought stress tolerance in pepper.

Supplementary Materials

The following supporting information can be downloaded at: https://www.mdpi.com/article/10.3390/horticulturae11111318/s1. Table S1: Temperature, humidity, and solar radiation recorded in the PhenoHort platform during a 40-day experiment.

Author Contributions

Conceptualization, P.T. and C.M.; methodology, A.C., A.V., R.M. and C.D.C.; formal analysis, P.T. and A.C.; investigation, P.T. and A.C.; resources, C.M.; data curation, P.T.; writing—original draft preparation, A.C. and P.T.; writing—review and editing, P.T., C.M., A.V. and A.C.; supervision, P.T. and C.M.; funding acquisition, P.T. and C.M. All authors have read and agreed to the published version of the manuscript.

Funding

This research was funded by RINOVA. Soc. Coop in the frame of MASAF, in the Supply Chain Program.

Data Availability Statement

The original contributions presented in this study are included in the article. Further inquiries can be directed to the corresponding author.

Conflicts of Interest

The authors declare no conflicts of interest. The funders had no role in the design of the study; in the collection, analyses, or interpretation of data; in the writing of the manuscript, or in the decision to publish the results.

References

  1. FAOSTAT. 2025. Available online: http://www.fao.org/faostat/en/#home (accessed on 27 September 2025).
  2. Tripodi, P.; Kumar, S. The Capsicum Crop: An introduction. In The Capsicum Genome; Ramchiary, N., Kole, C., Eds.; Springer International Publishing: Basel, Switzerland, 2019. [Google Scholar]
  3. Agyemang Duah, S.; Silva e Souza, C.; Nagy, Z.; Pék, Z.; Neményi, A.; Daood, H.G.; Vinogradov, S.; Helyes, L. Effect of Water Supply on Physiological Response and Phytonutrient Composition of Chili Peppers. Water 2021, 13, 1284. [Google Scholar] [CrossRef]
  4. Fallik, E.; Alkalai-Tuvia, S.; Chalupowicz, D.; Zaaroor-Presman, M.; Offenbach, R.; Cohen, S.; Tripler, E. How Water Quality and Quantity Affect Pepper Yield and Postharvest Quality. Horticulturae 2019, 5, 4. [Google Scholar] [CrossRef]
  5. Wang, L.; Ren, W. Drought in Agriculture and Climate-Smart Mitigation Strategies. Cell Rep. Sustain. 2025, 2, 100386. [Google Scholar] [CrossRef]
  6. Intergovernmental Panel on Climate Change (IPCC). Fourth Assessment Report: Climate Change 2007—Working Group II: Impacts, Adaptation and Vulnerability. Available online: https://archive.ipcc.ch/ipccreports/tar/vol4/english/114.htm (accessed on 25 September 2025).
  7. OECD-FAO (2023a). ‘OECD-FAO Agricultural Outlook 2023–2032’, Technical Report, OECD, and Food and Agriculture Organization of the United Nations). Available online: https://www.oecd-ilibrary.org/agriculture-and-food/oecd-fao-agricultural-outlook-2023-2032_08801ab7-en (accessed on 30 October 2025).
  8. Brook, B.W.; Buettel, J.C.; Hong, S. Constrained scenarios for twenty-first century human population size based on the empirical coupling to economic growth. Nat. Commun. 2021, 12, 1–8. [Google Scholar] [CrossRef]
  9. Ingrao, C.; Strippoli, R.; Lagioia, G.; Huisingh, D. Water Scarcity in Agriculture: An Overview of Causes, Impacts and Approaches for Reducing the Risks. Heliyon 2023, 9, e18507. [Google Scholar] [CrossRef]
  10. Okur, B.; Örçen, N. Soil Salinization and Climate Change. In Climate Change and Soil Interactions; Prasad, M.N.V., Pietrzykowski, M., Eds.; Elsevier: Amsterdam, The Netherlands, 2020; pp. 331–350. ISBN 9780128180327. [Google Scholar] [CrossRef]
  11. Haghpanah, M.; Hashemipetroudi, S.; Arzani, A.; Araniti, F. Drought Tolerance in Plants: Physiological and Molecular Responses. Plants 2024, 13, 2962. [Google Scholar] [CrossRef] [PubMed]
  12. Yang, X.; Lu, M.; Wang, Y.; Wang, Y.; Liu, Z.; Chen, S. Response Mechanism of Plants to Drought Stress. Horticulturae 2021, 7, 50. [Google Scholar] [CrossRef]
  13. Borràs, D.; Plazas, M.; Moglia, A.; Lanteri, S. The Influence of Acute Water Stresses on the Biochemical Composition of Bell Pepper (Capsicum annuum L.) Berries. J. Sci. Food Agric. 2021, 101, 4724–4734. [Google Scholar] [CrossRef] [PubMed]
  14. Ntanasi, T.; Karavidas, I.; Savvas, D.; Spyrou, G.P.; Giannothanasis, E.; Consentino, B.B.; Papasotiropoulos, V.; Sabatino, L.; Ntatsi, G. Physiological and Yield Responses of Pepper (Capsicum annuum L.) Genotypes to Drought Stress. Plants 2025, 14, 1934. [Google Scholar] [CrossRef]
  15. Thin, K.K.; Lee, S.; Lee, J.M. Genetic and morpho-physiological attributes of drought resistance in Capsicum accessions. Hort. Plant J. 2025, in press. [Google Scholar] [CrossRef]
  16. Ahmadi, S.Z.; Zahedi, B.; Ghorbanpour, M.; Mumivand, H. Comparative morpho-physiological and biochemical responses of Capsicum annuum L. plants to multi-walled carbon nanotubes, fullerene C60 and graphene nanoplatelets exposure under water deficit stress. BMC Plant Biol. 2024, 24, 116. [Google Scholar] [CrossRef]
  17. Gisbert-Mullor, R.; Martín-García, R.; Bažon Zidarić, I.; Pascual-Seva, N.; Pascual, B.; Padilla, Y.G.; Calatayud, Á.; López-Galarza, S. A Water Stress-Tolerant Pepper Rootstock Improves the Behavior of Pepper Plants under Deficit Irrigation through Root Biomass Distribution and Physiological Adaptation. Horticulturae 2023, 9, 362. [Google Scholar] [CrossRef]
  18. Yang, W.; Feng, H.; Zhang, X.; Zhang, J.; Doonan, J.H.; Batchelor, W.D.; Xiong, L.; Yan, J. Crop Phenomics and High-Throughput Phenotyping: Past Decades, Current Challenges, and Future Perspectives. Mol. Plant 2020, 13, 187–214. [Google Scholar] [CrossRef]
  19. Atefi, A.; Ge, Y.; Pitla, S.; Schnable, J.C. Robotic Technologies for High-Throughput Plant Phenotyping: Contemporary Reviews and Future Perspectives. Front. Plant Sci. 2021, 12, 611940. [Google Scholar] [CrossRef]
  20. Bethge, H.L.; Weisheit, I.; Dortmund, M.S.; Landes, T.; Zabic, M.; Linde, M.; Debener, T.; Heinemann, D. Automated Image Registration of RGB, Hyperspectral and Chlorophyll Fluorescence Imaging Data. Plant Methods 2024, 20, 175. [Google Scholar] [CrossRef] [PubMed]
  21. Tripodi, P.; Nicastro, N.; Pane, C. Digital applications and artificial intelligence in agriculture toward next-generation plant phenotyping. Crop Pasture Sci. 2022, 74, 597–614. [Google Scholar] [CrossRef]
  22. Song, P.; Wang, J.; Guo, X.; Yang, W.; Zhao, C. High-Throughput Phenotyping: Breaking through the Bottleneck in Future Crop Breeding. Crop J. 2021, 9, 633–645. [Google Scholar] [CrossRef]
  23. Angidi, S.; Madankar, K.; Tehseen, M.M.; Bhatla, A. Advanced High-Throughput Phenotyping Techniques for Managing Abiotic Stress in Agricultural Crops—A Comprehensive Review. Crops 2025, 5, 8. [Google Scholar] [CrossRef]
  24. Xu, R.; Li, C. A Review of High-Throughput Field Phenotyping Systems: Focusing on Ground Robots. Plant Phenomics 2022, 2022, 9760269. [Google Scholar] [CrossRef] [PubMed]
  25. Phenospex. FieldScan: High-Throughput Field Phenotyping. Available online: https://phenospex.com/products/plant-phenotyping/fieldscan-high-throughput-field-phenotyping (accessed on 25 September 2025).
  26. Abebe, A.M.; Kim, Y.; Kim, J.; Kim, S.L.; Baek, J. Image-Based High-Throughput Phenotyping in Horticultural Crops. Plants 2023, 12, 2061. [Google Scholar] [CrossRef]
  27. Kim, M.; Lee, C.; Hong, S.; Kim, S.L.; Baek, J.-H.; Kim, K.-H. High-Throughput Phenotyping Methods for Breeding Drought-Tolerant Crops. Int. J. Mol. Sci. 2021, 22, 8266. [Google Scholar] [CrossRef]
  28. Sun, S.; Li, C.; Chee, P.W.; Paterson, A.H.; Meng, C.; Zhang, J.; Adhikari, J. High Resolution 3D Terrestrial LiDAR for Cotton Plant Main Stalk and Node Detection. Comput. Electron. Agric. 2021, 187, 106276. [Google Scholar] [CrossRef]
  29. IPPN Infrastructure. Available online: https://www.plant-phenotyping.org/db_infrastructure#/tool/182/ (accessed on 27 September 2025).
  30. Tripodi, P.; Vincenzo, C.; Venezia, A.; Cocozza, A.; Pane, C. Precision Phenotyping of Wild Rocket (Diplotaxis tenuifolia) to Determine Morpho-Physiological Responses under Increasing Drought Stress Levels Using the PlantEye Multispectral 3D System. Horticulturae 2024, 10, 496. [Google Scholar] [CrossRef]
  31. R Core Team. R: A Language and Environment for Statistical Computing; R Foundation for Statistical Computing: Vienna, Austria, 2024; Available online: https://www.R-project.org/ (accessed on 30 October 2025).
  32. Kassambara, A.; Mundt, F. Package ‘factoextra’. Extract and visualize the results of multivariate data analyses. RCRAN 2017, 76, 1–74. [Google Scholar]
  33. Factormine Lê, S.; Josse, J.; Husson, F. FactoMineR: An R package for multivariate analysis. J. Stat. Softw. 2008, 25, 1–18. [Google Scholar]
  34. Wei, T.S.V. R Package ‘Corrplot’: Visualization of a Correlation Matrix; R Core Team: Vienna, Austria, 2021. [Google Scholar]
  35. Olivoto, T.; Nardino, M. MGIDI: Toward an effective multivariate selection in biological experiments. Bioinformatics 2021, 37, 1383–1389. [Google Scholar] [CrossRef]
  36. Fu, Q.S.; Zhao, B.; Wang, Y.J.; Ren, S.; Guo, Y.D. Stomatal development and associated photosynthetic performance of capsicum in response to differential light availabilities. Photosynthetica 2010, 48, 189–198. [Google Scholar] [CrossRef]
  37. Egea-Gilabert, C.; Pagnotta, M.A.; Tripodi, P. Genotype × Environment Interactions in Crop Breeding. Agronomy 2021, 11, 1644. [Google Scholar] [CrossRef]
  38. Maphosa, L.; Thoday-Kennedy, E.; Vakani, J.; Phelan, A.; Badenhorst, P.; Slater, A.; Spangenberg, G.; Kant, S. Phenotyping wheat under salt stress conditions using a 3D laser scanner. Isr. J. Plant Sci. 2017, 64, 55–62. [Google Scholar] [CrossRef]
  39. Lazarević, B.; Šatović, Z.; Nimac, A.; Vidak, M.; Gunjača, J.; Politeo, O.; Carović-Stanko, K. Application of Phenotyping Methods in Detection of Drought and Salinity Stress in Basil (Ocimum basilicum L.). Front. Plant Sci. 2021, 12, 629441. [Google Scholar] [CrossRef]
  40. Cappello Fusaro, M.; Lucchetta, I.; Bona, S. Water Stress Effects on Biomass Allocation and Secondary Metabolism in CBD-Dominant Cannabis sativa L. Plants 2025, 14, 1267. [Google Scholar] [CrossRef] [PubMed]
  41. Schafleitner, R.; Lin, C.-Y.; Lin, Y.-P.; Wu, T.-H.; Hung, C.-H.; Phooi, C.-L.; Chu, S.-H.; Jhong, Y.-C.; Hsiao, Y.-Y. The World Vegetable Center Okra (Abelmoschus esculentus) Core Collection as a Source for Flooding Stress Tolerance Traits for Breeding. Agriculture 2021, 11, 165. [Google Scholar] [CrossRef]
  42. Bheemanahalli, R.; Ramamoorthy, P.; Poudel, S.; Samiappan, S.; Wijewardane, N.; Reddy, K.R. Effects of drought and heat stresses during reproductive stage on pollen germination, yield, and leaf reflectance properties in maize (Zea mays L.). Plant Direct 2022, 6, e434. [Google Scholar] [CrossRef]
  43. Slaton, M.R.; Hunt, E.R.; Smith, W.K. Estimating near-infrared leaf reflectance from leaf structural characteristics. Am. J. Bot. 2001, 88, 278–284. [Google Scholar] [CrossRef]
  44. Index Database. Available online: https://www.indexdatabase.de/ (accessed on 27 September 2025).
  45. Anderegg, J.; Yu, K.; Aasen, H.; Walter, A.; Liebisch, F.; Hund, A. Spectral Vegetation Indices to Track Senescence Dynamics in Diverse Wheat Germplasm. Front. Plant Sci. 2020, 10, 1749. [Google Scholar] [CrossRef]
  46. Govind, A.; Bhavanarayana, M.; Kumari, J.; Govind, A. Efficacy of Different Indices Derived from Spectral Reflectance of Wheat for Nitrogen Stress Detection. J. Plant Interact. 2005, 1, 93–105. [Google Scholar] [CrossRef]
  47. Hatfield, J.L.; Prueger, J.H. Value of using different vegetative indices to quantify agricultural crop chateristics at different growth stages under varying management practices. Remote Sens. 2010, 2, 562–578. [Google Scholar] [CrossRef]
  48. Shukla, S.; Felderhoff, T.J.; Saballos, A.; Vermerris, W. The relationship between plant height and sugar accumulation in the stems of sweet sorghum (Sorghum bicolor (L.) Moench). Field Crops Res. 2017, 203, 181–191. [Google Scholar] [CrossRef]
  49. McLeod, L.; Barchi, L.; Tumino, G.; Tripodi, P.; Salinier, J.; Gros, C.; Boyaci, H.F.; Ozalp, R.; Borovsky, Y.; Schafleitner, R.; et al. Multi-environment association study highlights candidate genes for robust agronomic quantitative trait loci in a novel worldwide Capsicum core collection. Plant J. 2023, 116, 1508–1528. [Google Scholar] [CrossRef]
  50. Miao, L.; Wang, X.; Yu, C.; Ye, C.; Yan, Y.; Wang, H. What factors control plant height? J. Integr. Agric. 2024, 23, 1803–1824. [Google Scholar] [CrossRef]
Figure 1. Minimum (blue line), maximum (grey line), and average (orange line) daily temperature (a) and relative humidity (b) values, and daily maximum (blue line) and average (orange line) solar radiation (c). All parameters were recorded during the growth cycle in the phenotyping facility located at CREA—Research Centre for Vegetable and Ornamental Crops, Pontecagnano Faiano.
Horticulturae 11 01318 g001
Figure 2. Line graphs showing trends for 13 morphological traits assayed via 3D and multispectral sensing in the PhenoHort platform across 40 days under 3 conditions: control (CT), intense drought stress (WS1), and severe drought stress (WS2). (a) LA3D: three-dimensional leaf area, (b) DB: digital biomass, (c) PHA: plant height averaged, (d) PHM: plant height max, (e) CLPD: canopy light penetration depth, (f) CHA: convex hull area, (g) CHAC: convex hull area coverage, (h) CHAR: convex hull aspect ratio, (i) CHC: convex hull circumference, (j) CHMW: convex hull maximum width, (k) SAA: surface angle average, (l) VVT: voxel volume total, and (m) PLA: projected leaf area.
Horticulturae 11 01318 g002
Figure 3. Line graphs showing trends for 3 color and multispectral parameters assayed in the PhenoHort platform across 40 days under 3 conditions: control (CT), intense drought stress (WS1), and severe drought stress (WS2). (a) HUE: hue average, (b) LA: lightness average, and (c) SA: saturation average.
Horticulturae 11 01318 g003
Figure 4. Line graphs showing trends for 4 vegetation indices assayed in the PhenoHort platform across 40 days under 3 conditions: control (CT), intense drought stress (WS1), and severe drought stress (WS2). (a) NDVI: normalized differential vegetation index average, (b) NPCI: normalized pigment chlorophyll index average, (c) PSRI: plant senescence reflection index average, and (d) GLI: green leaf index average.
Horticulturae 11 01318 g004
Figure 5. Details of plants affected by leaf wilt (foreground bench) under severe water stress conditions. The plants on the second and bottom benches are those subject to moderate stress and control, respectively.
Horticulturae 11 01318 g005
Figure 6. Horizontal bars showing the differences between water stress conditions (WS1 and WS2) compared to the control for 25 pepper varieties. Values are expressed as differences in percentage between the means of stress condition with respect to the control on day 40. Dark red bars: morphological parameters, blue bars: color and multispectral data, and green bars: vegetation indices.
Horticulturae 11 01318 g006
Figure 7. Line graphs showing trends for 25 genotypes across 40 days under 3 conditions: control (CT), intense drought stress (WS1), and severe drought stress (WS2). (a) LA3D, (b) DB, (c) PHA, and (d) CHC. Trait acronyms are listed in Table 1 and Figure 2.
Horticulturae 11 01318 g007
Figure 8. Genotype ranking and selected genotypes for the multi-trait genotype–ideotype distance index (MGDI) considering 20 traits. The blue circle represents the cut-off point according to the selection intensity of 16%. The blue dots represent the best genotypes that cope in drought stress conditions, while the gray dots, from the outside toward the center, increasingly represent genotypes that are less adapted to stress conditions.
Horticulturae 11 01318 g008
Figure 9. Principal component analyses. Loading plot of the first (PC1) and second (PC2) principal components showing the variation for 20 traits scored in control (CT) and drought stress treatments (WS1 and WS2). (a) PCA drawn considering all trials in the first (20 days) and second (40 days) parts of the cycle. (b) PCA drawn considering all trials in the first (20 days) and second (40 days) parts of the cycle and separating the three trials. (c) PCA for the three trials considering the entire period. Colored ellipses group measures for each treatment with a 95% confidence interval. (d) Distribution of the traits scored on the PCA biplot—the direction and distance from the center of the biplot indicate how each OTU contributes to the first two components.
Horticulturae 11 01318 g009
Figure 10. Correlations between morphological parameters, color measures, and vegetative indices for the different treatments. (a) CT, control, (b) WS1, intense water stress, and (c) WS2, severe water stress. The Pearson coefficient with a significance threshold of p < 0.05 was considered. Color intensity is directly proportional to the coefficients. On the right side of the correlogram, the legend color shows the correlation coefficients and the corresponding colors. According to the scale on the right, blue and red colors correspond to positive and negative correlations, respectively. The full name of each trait abbreviation can be found in Table 1.
Horticulturae 11 01318 g010
Table 1. List of traits calculated from the 3D model and multispectral imaging through the PlantEye 500 multispectral laser scan. Traits include morphological parameters (13), color and multispectral reflectance measures (3), and spectral vegetation indices (4).
AcronymTraitMeasurement Unit
Morphological parameters
LA3DThree-dimensional leaf areamm2
DBDigital biomass mm2
PHAPlant height averagedmm
PHMPlant height maxmm
CLPDCanopy light penetration depthmm
CHAConvex hull areamm2
CHACConvex hull area coverage%
CHARConvex hull aspect ratioindex
CHCConvex hull circumferencemm
CHMWConvex hull maximum widthmm
SAASurface angle average
VVTVoxel volume totalmm3
PLAProjected leaf areamm2
Color and multispectral
HUEHue average°
LALightness average%
SASaturation average%
Vegetation indices
NDVINormalized differential vegetation indexindex
NPCINormalized pigment chlorophyll ratio index index
PSRIPlant senescence reflection index index
GLI Green leaf index averageindex
Table 2. Mean and range for the 20 traits recorded in the PhenoHort platform in three experimental conditions, including the control (CT) and two water stress conditions: intense (WS1) and severe (WS2). Data of the first half of the cycle (20 days) and second half (40 days) are reported. The asterisks indicate significant differences with the control at p < 0.05 according to Dunnet’s test. The trait legend is reported in Table 1.
CT (dd 20)WS1 (dd 20)WS2 (dd 20)CT (dd 40)WS1 (dd 40)WS2 (dd 40)
LA3D (cm2)168.42153.08169.22884.25650.11 *495.34 *
(13.77–774.60)(0.00–721.59)(14.93–880.49)(259.81–1861.65)(194.77–1374.54)(102.82–1099.29)
DB (cm3)2826.792368.39 *2680.6533218.7823256.55 *14635.05 *
(36.478–21,555.87)(0.00–19,974.47)(45.754–18,800.05)(6248.753–73,256.43)(3032.527–66,919.20)(2433.45–47,261.80)
PHA (mm)119.42106.86 *112.77400.17338.74 *287.27 *
(20.92–370.50)(0.00–321.73)(27.15–304.88)(151.96–720.84)(147.53–577.29)(94.04–480.72)
PHM (mm)123.08110.51 *116.56411.00350.05 *297.77 *
(21.16–372.43)(0.00–326.49)(27.68–310.39)(157.66–730.54)(154.62–588.08)(97.34–499.20)
CLPD (mm)75.6970.1074.63272.29238.67 *213.26 *
(10.12–242.13)(4.48–209.04)(10.61–217.06)(89.53–543.00)(93.24–466.29)(65.59–378.98)
CHA (mm2)226.42207.76221.35939.36754.23 *571.35 *
(23.94–780.46)(0.00–803.75)(20.60–941.79)(326.33–1570.95)(222.49–1567.52)(100.98–1315.57)
CHAC (%)51.6551.8251.6254.9954.33 *50.68 *
(17.43–82.38)(23.97–91.54)(25.23–73.18)(26.70–72.35)(21.82–71.18)(23.25–70.95)
CHAR (index)72.0770.01 *71.1179.2277.8578.41
(20.89–89.57)(38.88–97.51)(35.78–87.75)(58.41–97.96)(53.06–92.14)(54.04–93.70)
CHC (mm)550.41521.31 *536.731151.301024.52 *870.54 *
(179.90–1063.62)(0.00–1079.76)(180.30–1179.04)(719.58–1531.93)(543.03–1528.68)(389.05–1375.63)
CHMW (mm)205.47195.60200.56416.60366.86 *310.90 *
(65.31–406.37)(0.00–388.52)(65.82–425.84)(252.09–569.98)(186.32–563.37)(141.03–497.91)
SAA (A°)49.8849.7848.46 *42.2240.04 *36.19 *
(29.32–66.74)(29.63–66.03)(26.41–65.61)(27.55–65.96)(17.86–64.85)(17.03–64.58)
VVT (cm3)15.1713.8415.0069.2456.52*41.46 *
(1.68–54.89)(0.00–56.71)(1.71–69.49)(20.46–120.66)(13.04–128.06)(6.66–110.87)
PLA (cm2)113.77103.93112.39518.65421.55 *306.96 *
(12.03–409.77)(0.00–425.19)(12.38–537.27)(150.25–916.95)(73.91–987.18)(37.17–859.85)
HUE (°)107.53107.80107.59115.14114.87113.79 *
(97.95–118.52)(95.93–122.15)(97.48–117.88)(102.30–127.25)(103.93–126.78)(99.01–127.02)
LA (%)9.479.409.436.286.51 *6.58 *
(6.48–12.67)(7.10–12.45)(6.46–12.64)(4.29–11.46)(4.48–9.21)(4.23–9.63)
SA (%)44.9744.8745.2742.8841.42 *41.16 *
(36.32–59.86)(34.89–59.44)(38.65–56.71)(32.15–57.18)(32.07–60.77)(34.03–55.53)
NDVI0.5850.5870.5810.6890.67 *0.65 *
(0.444–0.679)(0.470–0.651)(0.437–0.684)(0.528–0.755)(0.488–0.747)(0.470–0.763)
NPCI0.1570.1530.1560.0830.0780.085
(0.036–0.346)(0.001–0.347)(0.046–0.306)(−0.031–0.287)(−0.026–0.317)(−0.029–0.251)
PSRI0.0750.0750.0790.0250.0270.034 *
(0.012–0.200)(0.009–0.412)(0.022–0.203)(−0.013–0.123)(−0.012–0.117)(−0.016–0.168)
GLI0.3450.3420.338 *0.3400.320 *0.307 *
(0.275–0.449)(0.240–0.436)(0.261–0.443)(0.242–0.444)(0.228–0.474)(0.194–0.442)
Table 3. Two-way analysis of variance and significance levels for genotype (G), treatment (T), and genotype–treatment (G × T) effects. For each factor the percentage of variation and its significance are reported.
TraitG (df = 24)T (df = 2)G × T (df = 48)Error (df = 448)
TSS %TSS %TSS %TSS %
LA3D16.04 **28.55 **11.81 **43.59
DB13.29 **51.02 **12.50 **23.19
PHA31.23 **50.61 **12.28 **5.88
PHM30.02 **50.75 **12.37 **6.86
CLPD49.77 **22.44 **15.19 **12.60
CHA12.49 **38.86 **10.29 **38.35
CHAC31.99 **3.43 **12.41 **52.17
CHAR24.40 **13.19 **14.99 **47.41
CHC10.97 **36.77 **9.42 **42.85
CHMW11.73 **39.08 **8.84 **40.35
SAA32.03 **15.02**6.01 NS46.94
VVT15.89 **29.86 **11.06 **43.19
PLA16.39 **28.56 **10.76 **44.29
HUE58.27 **7.76 *9.96 **24.01
LA40.32 **11.57 **20.18 **27.93
SA43.72 **6.21 **9.94 **40.13
NDVI19.98 **23.30 **16.10 **40.63
NPCI64.97 **2.90 *9.11 **23.02
PSRI39.36 **9.93 **13.48 **37.23
GLI29.54 **16.78 **8.32 *45.35
The traits’ legend is reported in Table 1 and Figure 2. * Significant at p < 0.05, ** significant at p < 0.01, and NS not significant.
Disclaimer/Publisher’s Note: The statements, opinions and data contained in all publications are solely those of the individual author(s) and contributor(s) and not of MDPI and/or the editor(s). MDPI and/or the editor(s) disclaim responsibility for any injury to people or property resulting from any ideas, methods, instructions or products referred to in the content.