Abstract
Sucrose phosphate synthase (SPS) is a rate-limiting enzyme in plant sucrose biosynthesis. However, the SPS gene family in luffa remains unidentified, and its functional involvement in sugar metabolism is unexplored. Here, we present the first genome-wide identification and functional analysis of the LaSPSs in luffa. We identified nine LaSPS genes, characterized their physicochemical and evolutionary properties, and analyzed their expression patterns in different tissues and response to ethylene and drought treatments. Nine tandem-duplicated LaSPS genes formed four clusters (T1(1/2), T2(3/4), T3(5/6), T4(7–9)) with conserved architectures. RNA-seq analysis indicated a ubiquitous downregulation of LaSPS genes in senescing luffa, wherein sucrose content correlated significantly with all LaSPS members except LaSPS1/2. Exogenous ethylene substantially repressed LaSPSs transcription, while 1-methylcyclopropene (1-MCP) treatment showed induction. Notably, LaSPS3/4 displayed high activation under drought stress. Functional validation via heterologous expression in tobacco confirmed that LaSPS3/4 positively regulates drought resistance. In summary, this study provides a novel perspective for the in-depth investigation of the molecular evolutionary mechanism of the LaSPS gene family and its biological functions in luffa.
1. Introduction
Sucrose, a non-reducing disaccharide synthesized through the covalent linkage of glucose and fructose, represents a pivotal product in photosynthetic carbon metabolism. In addition to its nutritional role in providing a carbon skeleton and energy for growth, sucrose has a signaling function that activates growth processes in plants [1,2] Its biosynthesis predominantly occurs in the cytosol of photosynthetic tissues via a conserved enzymatic cascade. Beyond functioning as the principal transport form of photoassimilates, sucrose acts as a versatile signaling molecule that orchestrates energy allocation, developmental programming, and stress adaptation in plants.
Notably, sucrose metabolism constitutes a central regulatory hub for plant responses to abiotic stresses. Under drought conditions, plants strategically accumulate osmoprotectants such as sucrose and trehalose to maintain cellular osmotic homeostasis and energy balance [3]. This metabolic reprogramming enhances membrane stability while mitigating oxidative damage. Beyond its classical role in energy storage, sucrose critically regulates cell turgor-driven expansion by modulating osmotic potential and serves as a substrate reservoir for cell wall biosynthesis, providing precursors for cellulose and hemicellulose polymers.
Sucrose phosphate synthase (SPS), the rate-limiting enzyme in plant sucrose biosynthesis, catalyzes sucrose-6-phosphate synthesis from UDP-glucose and fructose-6-phosphate [4], initiating irreversible sucrose production via sucrose phosphate phosphatase. This central process governs photosynthetic partitioning between sucrose/starch while critically influencing source-sink coordination, fruit quality, and stress resistance. Multispecies studies establish conserved SPS functions: Arabidopsis AtSPS1 mediates chloroplast sucrose synthesis for inter-tissue carbon allocation; kiwifruit AcSPS1/2/4/5 [5] and kumquat CsSPS4 [6] drive sucrose accumulation during fruit ripening; apple MdSPS3/8/11/17 and SPSA2 enhance drought tolerance through sucrose upregulation and glucose metabolism modulation [7,8,9]; while SPS overexpression delays poplar leaf senescence via sucrose accumulation [10]. Despite these advances, the SPS gene family remains uncharacterized in luffa, given its established roles in fruit development, carbon allocation, and sucrose-mediated stress adaptation.
During Luffa acutangula fruit senescence, cellulose biosynthesis in luffa fruits is highly dependent on carbohydrate substrates [11,12,13]; SPS is crucial for sucrose metabolism. Systematic studies on soluble sugar dynamics and fruit development mechanisms have been conducted in cucurbits (e.g., melon) [14], and recent advances in melon research have highlighted the critical functions of the SPS gene family in sugar metabolism [15]. To date, the SPS gene family in luffa remains unidentified, and its functional involvement in sugar metabolism is unexplored. This study systematically characterized the SPS gene family and validated its drought resistance function mediated via sugar metabolism. We performed genome-wide identification and functional analysis of LaSPSs in luffa. Through genome-wide screening, nine LaSPS genes were identified on four chromosomes, with systematic investigation about their phylogenetic relationships, gene structures, conserved motifs, substrate-binding domains, and cis-regulatory elements in promoter regions. RNA sequencing (RNA-seq) data further revealed the differential expression profiles of LaSPSs during senescent fruit stages. Additionally, drought stress treatments demonstrated the stress-responsive patterns of LaSPSs, with functional validation indicating the potential role of LaSPS3/4 in drought resistance. Overall, our findings provide a theoretical foundation for deciphering the evolutionary trajectory of LaSPS genes and expand the functional understanding of this gene family in abiotic stress responses.
2. Materials and Methods
2.1. Identification and Characterization of LaSPS
The SPS protein sequence of Arabidopsis thaliana was downloaded from The Arabidopsis Information Resource (TAIR, https://www.arabidopsis.org, accessed on 4 April 2025). Using Arabidopsis thaliana SPS homologs as query sequences, we identified the coding sequences (CDSs) of SPS genes through BLAST homology searches against the luffa whole-genome database (https://www.ncbi.nlm.nih.gov/assembly/GCA_012295215.1/, accessed on 5 April 2025; Supplemental Table S1). All predicted LaSPS were checked and subjected to NCBI-CDD (https://www.ncbi.nlm.nih.gov/Structure/bwrpsb/bwrpsb.cgi, accessed on 6 April 2025) and MEME (https://meme-suite.org/meme/, accessed on 6 April 2025) analysis to confirm conserved motifs and domains.
2.2. Phylogenetic and Genome Synteny Analysis of LaSPS
Four species of pumpkin (Cucurbita maxima), angled gourd (Luffa acutangula), cucumber (Cucumis sativus), and melon (Cucumis melo) with 8, 9, 6, and 12 SPS members were identified (National Center for Biotechnology Information) and subject to multiple sequence alignment using the ClustalW program in MEGA 11 software (version 11.0.13). The phylogenetic tree was constructed using the Maximum Likelihood (ML) method, with Bootstrap 1000, the WAG + G model, and pairwise deletion handling [16]. Then, the appearance of the tree was improved with the online tool iTOL.
2.3. Gene Structure, Protein Domain and Subcelluar Location Analysis
The sequences of the LaSPS genes were extracted based on the genome annotation information. The Gene Structure Displayer (GSDS) online program was employed to display the gene structures. Domains were visualized using TBtools (version 2.310) [17]. While subcellular localization was performed using the online service package Cell-PLoc 2.0 [18,19,20,21,22].
2.4. Identification and Analysis of LaSPS Genes Cis-Acting Elements
The promoter regions (2 kb upstream) of the LaSPS genes coding regions were identified and submitted to the PlantCARE website (https://bioinformatics.psb.ugent.be/webtools/plantcare/html, accessed on 7 April 2025) for further analysis of cis-acting elements [23].
2.5. Molecular Docking
The ligand 3D structure was obtained from PubChem (PubChem CID 69,507 and 8629; https://pubchem.ncbi.nlm.nih.gov/, accessed on 8 April 2025) and the SPS family protein structure of luffa was downloaded from the PDB database or modeled on the basis of SWISS-MODEL homology (GMQE/QMEAN optimal model was selected). The ligand (hydrogen addition, Gasteiger charge counting) and receptor (dehydrogenation, polar hydrogen addition, Kollman charge counting) were pre-processed by AutoDockTools and saved in PDBQT format. Molecular docking was performed by setting the active site grid region with AutoDock Vina. Conformations were filtered by binding energy, and interactions such as hydrogen bonding, hydrophobic interactions, etc., were analyzed and visualized with PyMOL/Discovery Studio.
2.6. RNA-Seq and RT-qPCR Analysis
Fruit samples from four groups (S (Storage stage), M1 (Mature-senescence stage 1, which begins two weeks after the start of the storage stage), M2 (Mature-senescence stage 2, which begins four weeks after the start of the storage stage), and M3 (Mature-senescence stage 3, which begins six weeks after the start of the storage stage); n = 3 biological replicates per group) were collected and subjected to de novo transcriptome sequencing by Novogene Co., Ltd. (Beijing, China) using the Illumina NovaSeq 6000 platform (S4 flow cell, Illumina, San Diego, CA, USA). Raw data underwent quality control procedures including adapter removal and low-quality base trimming. A total of 50,141,000 high-quality clean reads were generated, with all samples exhibiting an average Q30 ≥ 91.95% and an error rate < 0.03%, meeting standard RNA-seq data quality thresholds. The tissues of luffa included 10 parts (old roots (OR); tendrils (TD); stems (S); young fruits (YF); old leaves (OL); stem tips (ST); young leaves (YL); young roots (YR); female flower (FF); mature fruits (MF)). RNA was extracted in strict accordance with the instructions of the kit (Magen, HiPure Total RNA Kit, R401102), followed by reverse transcription (Vazyme, HiScript III All-in-one RT SuperMix Perfect for qPCR) to obtain stable cDNA for RT-qPCR analysis. Each RT-qPCR experiment consisted of three biological replicates. Transcripts of the luffa LaActin gene (LacutCM022711.1G022380.1) were used to standardize the cDNA samples for different genes. The relative expression level for each gene was calculated with the 2−ΔΔCT method. The primers used are listed in the Supplemental Table S2.
2.7. Ethylene and 1-MCP Treatment of Luffa Fruits
Mature luffa fruits (25–30 cm length, uniform maturity) were divided into three experimental groups. For ethylene treatment, fruits were exposed to 200 μL·L−1 ethylene in sealed chambers at 25 ± 1 °C and 85–90% relative humidity for 24 h; for ethylene inhibitor treatment, fruits were fumigated with 5 μL·L−1 1-methylcyclopropene (1-MCP) in sealed containers for 24 h. Fruits were maintained at identical humidity conditions (85–90% RH) without treatment for 24 h was as control group. Each treatment group consisted of three biological replicates with three fruits per replicate. Following treatment, equatorial tissue sections were immediately flash-frozen in liquid nitrogen and stored at −80 °C for subsequent RT-qPCR analysis. The primers used are listed in the Supplemental Table S2.
2.8. Construction of LaSPS3/4 Overexpression Transgenic Tobacco Plants
The full ORF of LaSPS3/4 was inserted into overexpression vectors (pCAMBIA2300, CAMBIA), and after transfection into tobacco seeds by the Agrobacterium-mediated method, they were surface sterilized with 0.2% NaClO. Transgenic lines were then placed on selective medium containing kanamycin (50 mg/L). After in vitro rooting and acclimatization, plants were transferred to the greenhouse for growth until flowering. Transgene integration was verified through PCR and RT-qPCR. Subsequent experiments employed T2 homozygous lines. The primers used are listed in the Supplemental Table S2.
2.9. Drought Treatments
In the drought stress experiment, 1-week-old tobacco seedlings were transferred to soil for incubation and grown for an additional 2 weeks. When the relative soil water content (RWC) reached ≥70% and was consistent, the drought-treated group stopped watering, while the control group continued receiving water every 5 days. After being treated for 10 d, plant leaves were collected to determine sucrose [24]. Malondialdehyde (MDA) concentrations and enzymatic activities of superoxide dismutase (SOD) [25] and catalase (CAT) [24,25,26] with all assays were performed in triplicate biological replicates.
2.10. Statistical Analysis
The data analysis was conducted using SPSS Statistics 21 (SPSS, Inc., Chicago, IL, USA), while data visualization was performed with Microsoft Excel 365 (Version 2211, Microsoft Corporation, Washington, DC, USA). Statistical analysis employed one-way analysis of variance (ANOVA), with statistical significance defined as p < 0.05. Reported values represent the mean ± standard deviation (SD) from three independent experimental replicates.
3. Results
3.1. Genome-Wide Identification, of SPS Genes in Luffa acutangula
In this study, we systematically identified and characterized the SPS gene family in Luffa acutangula. Through homology-based BLASTP alignment against the Arabidopsis SPS family, nine LaSPS genes were identified. The physicochemical properties of the LaSPS genes were systematically analyzed as shown in Table 1; the results showed that LaSPS proteins exhibited conserved physicochemical profiles: amino acid lengths spanned from 1026 (LaSPS5) to 1063 (LaSPS7), with molecular weights ranging from 115.7 (LaSPS2) to 119.2 kDa (LaSPS7), and isoelectric points ranging from pH 5.93 (LaSPS2) to 6.50 (LaSPS6). Instability indices (40.31–46.48; all >40 threshold [27]) indicated poor in vitro stability, while aliphatic indices (85.22–89.42; >70 criterion [28]) confirmed thermostability. Hydrophilicity was evidenced by negative GRAVY values (−0.455 to −0.374; <−0.3 threshold), consistent with aqueous compartmentalization. Subcellular localization via Cell-PLoc 2.0 uniformly predicted cytoplasmic residence (Supplemental Table S3).

Table 1.
Characteristics of SPS gene family in Luffa acutangula.
3.2. Gene Structure Analysis of LaSPS
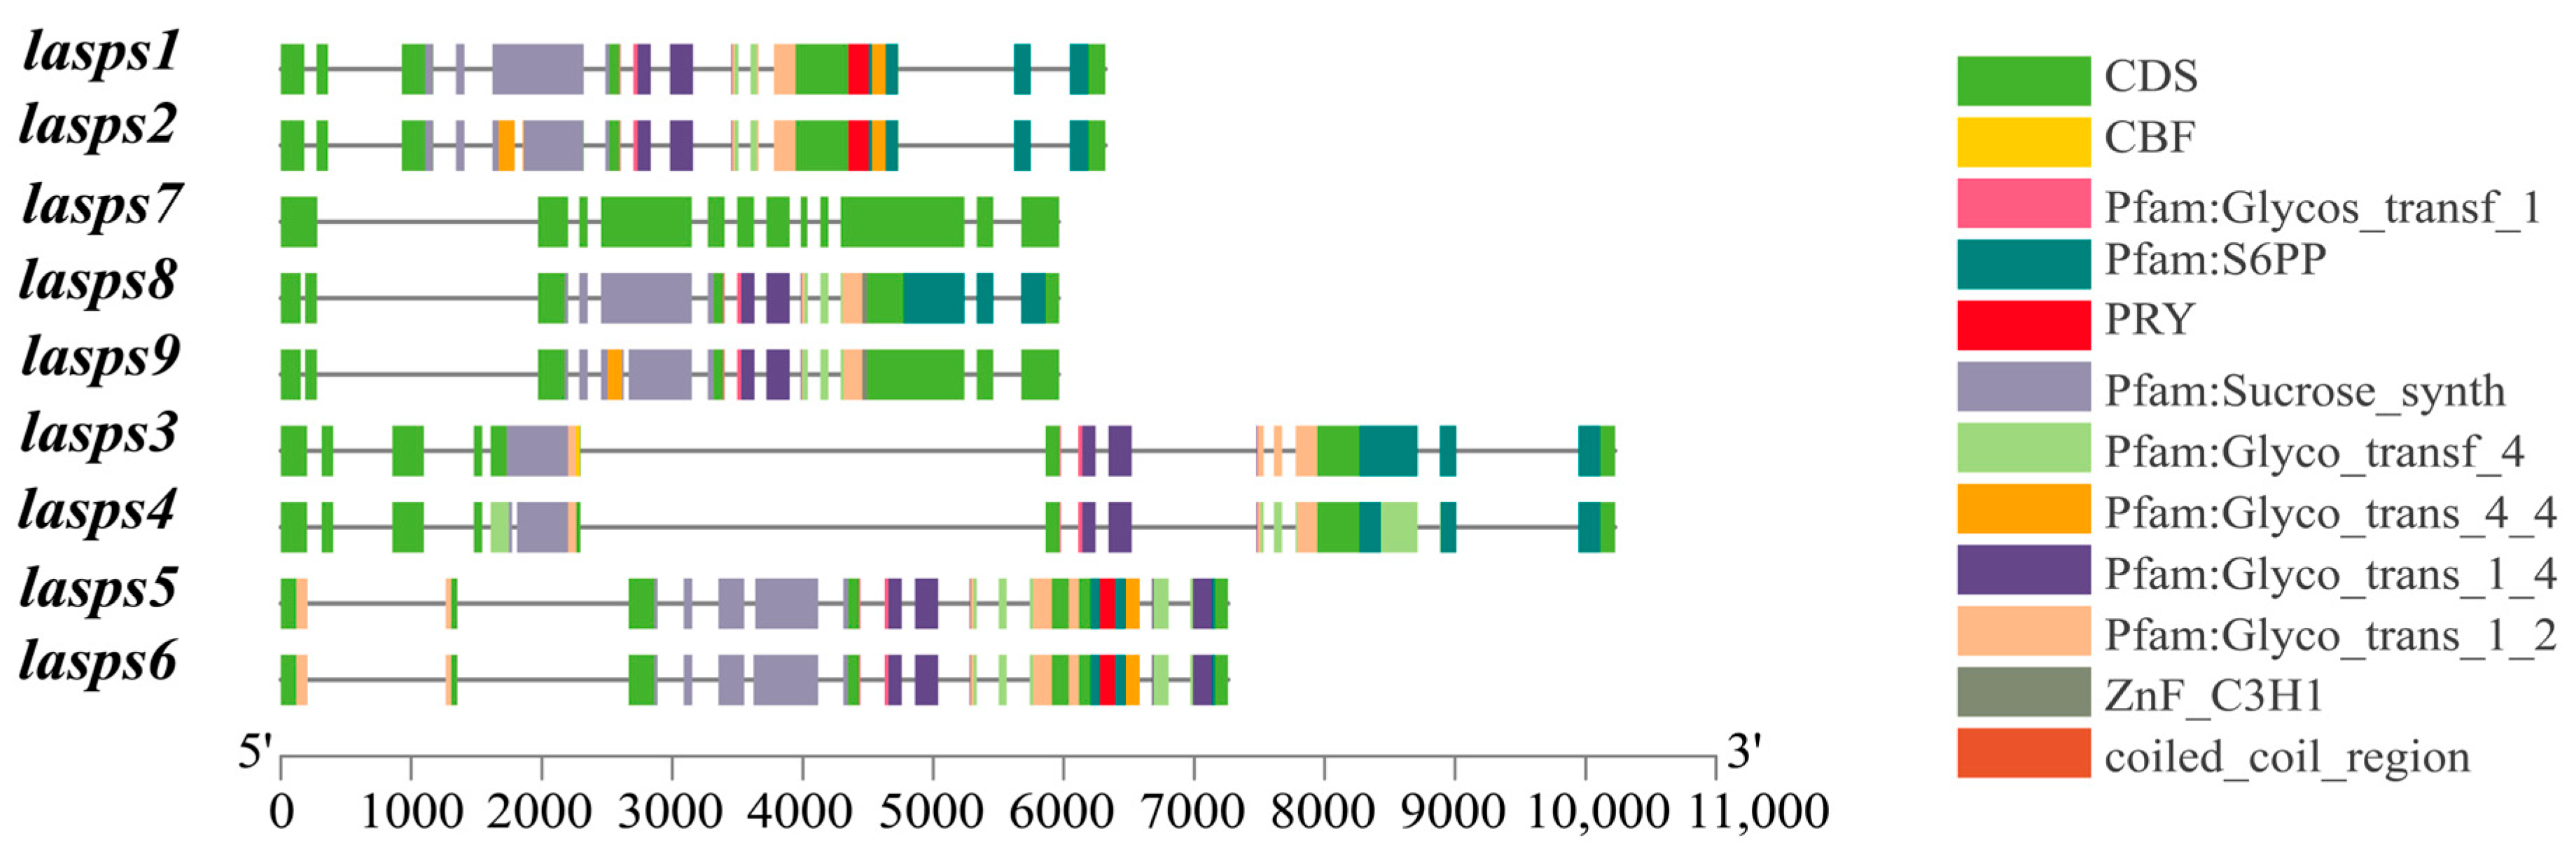
The intron-exon structures of luffa SPS family members were analyzed using the Gene Structure Displayer (GSDS) online program. The green region represents the CDS (coding sequence), which is directly involved in protein coding and is present in all nine genes. The sucrose synthase structural domain is responsible for the core function of sucrose synthesis in the SPS family. It is also present in all members except LaSPS7. In addition, there are differences in their gene structures, e.g., LaSPS7 exhibits a more concentrated and extended CDS region, accompanied by a relatively compact structural domain composition. In contrast, LaSPS3 and LaSPS4 sequences are characterized by increased length (Figure 1).

Figure 1.
Gene structure analysis of SPS in luffa. In the gene structure, the filled boxes and lines represent exons and introns, respectively.
3.3. Phylogenetic Analysis of SPS Genes in Luffa acutangula, Cucurbita maxima, Cucumis sativus and Cucumis melo
Four species of pumpkin (Cucurbita maxima), angled gourd (Luffa acutangula), cucumber (Cucumis sativus), and melon (Cucumis melo) with 8, 9, 6, and 12 SPS members, respectively, were selected to construct a phylogenetic tree. Based on the topology of the phylogenetic tree, 35 SPS genes were classified into three major clades (Clade I to III) (Figure 2). In Clade I, the luffa branch exhibits a bootstrap value of 100; the complete overlap of LaSPS5 and LaSPS6 indicates that a replication event or complementary functions may have occurred between them, due to their shared evolutionary origins. Contrastingly, the branches of the other three species show various evolutionary trajectories, which highlights their adaptations during evolution. LaSPS7 and LaSPS8 of Clade II were highly clustered in the same branch, indicating that they both diverged at a similar time and originated from the same ancestor. Additionally, they clustered on a different branch from LaSPS9. The evolutionary relationships of these three genes showed a certain degree of conservatism. In Clade III, LaSPS1 and LaSPS2 are highly clustered and retain more common ancestral features.
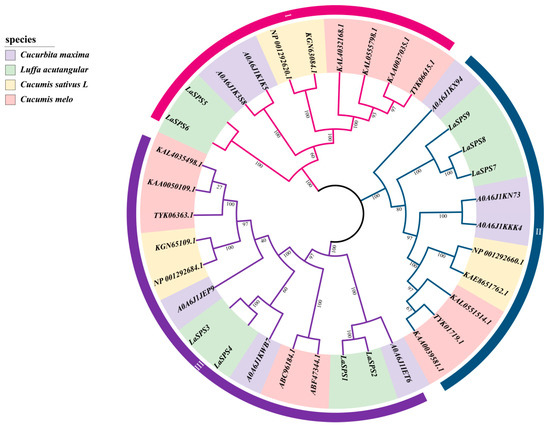
Figure 2.
Phylogenetic tree of SPS genes in four Cucurbitaceae species. Different colors on the outer ring indicate different clades. The purple, green, yellow, and pink represent SPSs from pumpkin, luffa, cucumber, and melon, respectively. The numbers on the branches represent the bootstrap: Tests the confidence of the computed branches of the evolutionary tree, in the range 0–1 or 0–100%. Closer to 100% means more credible.
3.4. Chromosomal Localization of the SPS Genes in Luffa acutangula
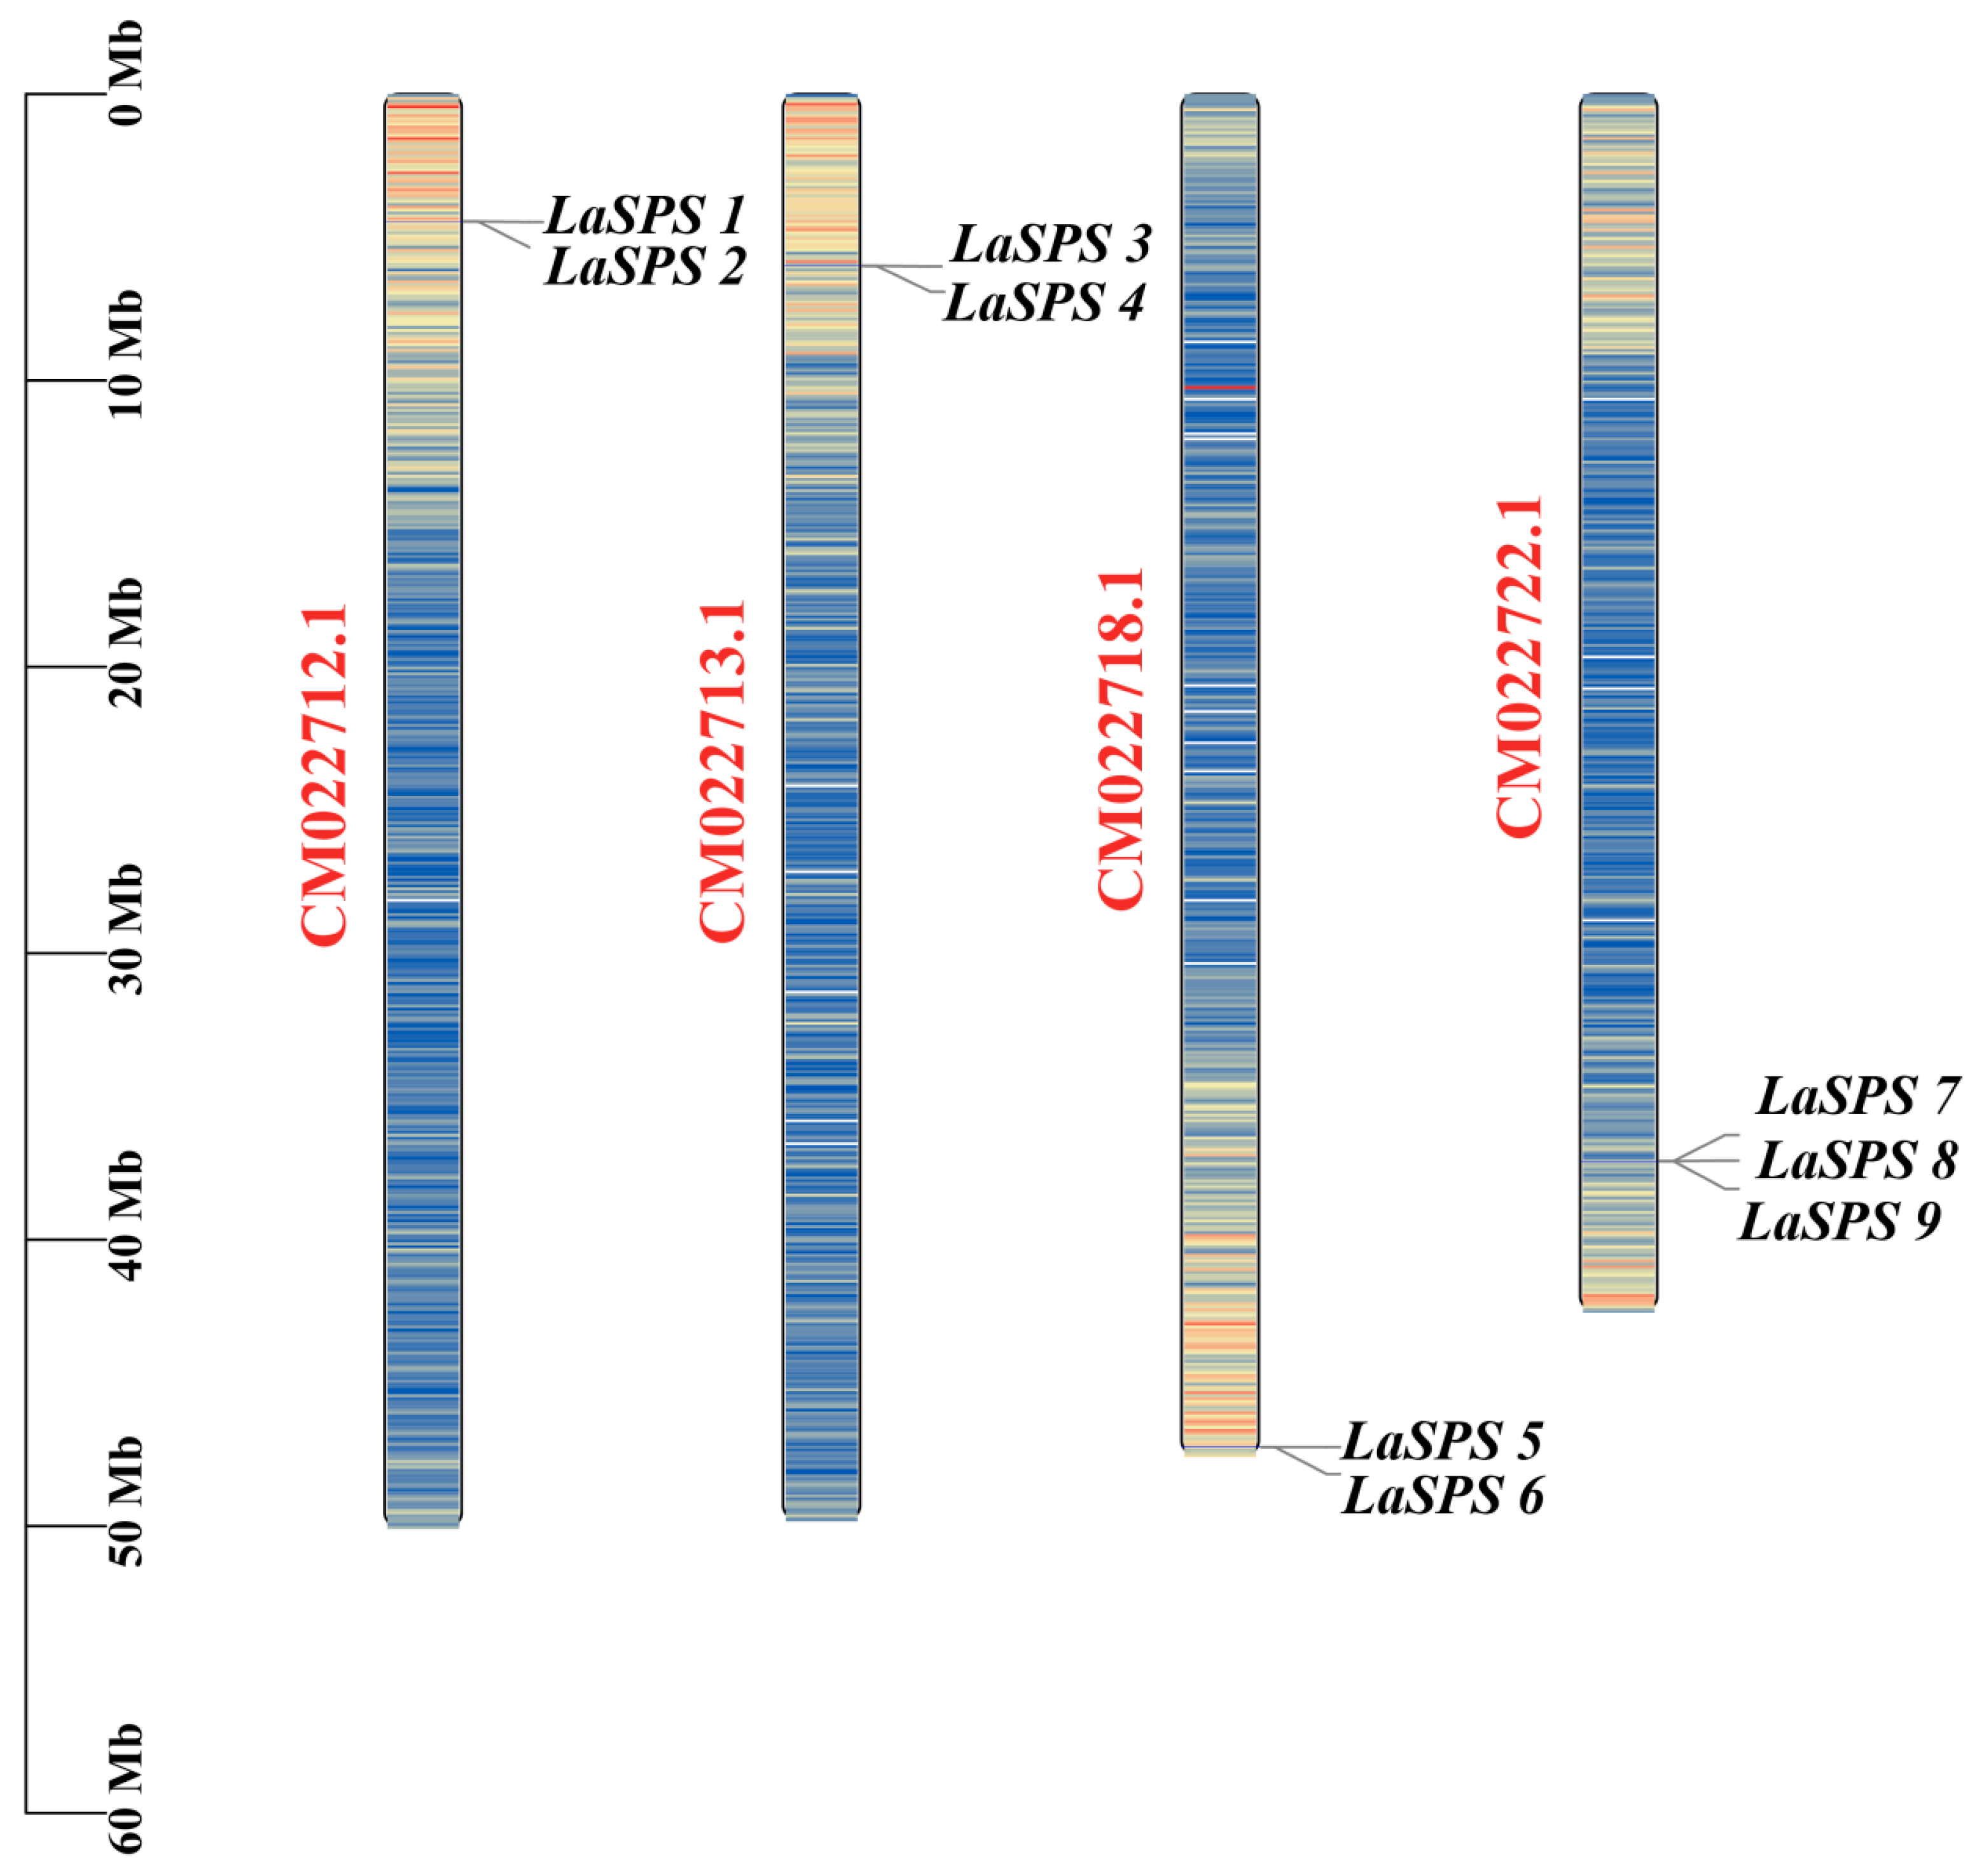
The chromosomal localization of nine SPS genes (LaSPS 1–9) in luffa revealed that they were unevenly distributed in four chromosomes (e.g., LaSPS1 and LaSPS2 were located on CM022712.1 (50,098,280 bp), LaSPS3 and LaSPS4 on CM022713.1 (49,838,747 bp), LaSPS5 and LaSPS6 on CM022718.1 (47,609,564 bp), and LaSPS7-9 on CM022722.1 (42,543,272 bp) (Figure 3)). The same chromosome produces tightly interlocking clusters of homologous genes. The analysis of the overall distribution of the SPS family in luffa can help speculate on the origin and functional differentiation of the genes, and their evolutionary features and biological functions can be further investigated in combination with functional studies.
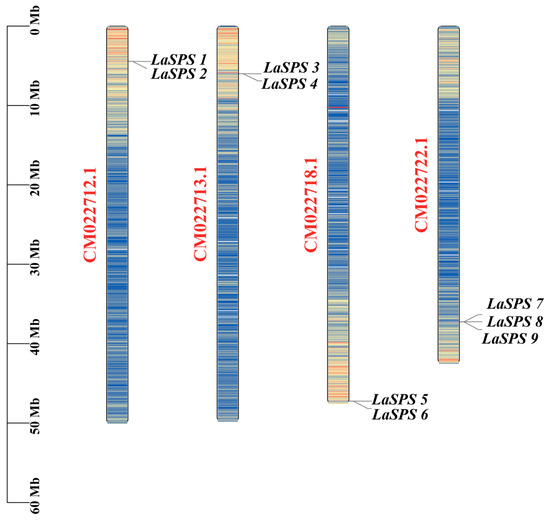
Figure 3.
Localization of the LaSPS gene family on luffa chromosomes. The scale bar on the left indicates chromosome length (Mb). The chromosome color scale indicates the density of genes in each region, with blue to red representing low-density to highest-density areas.
3.5. Protein Domain Analysis of the LaSPS
We have visualized the protein structures of luffa SPS family members to demonstrate more intuitively the characteristics of their structural domain composition (Figure 4). In terms of conservation, all nine family members contain the core structural domain (sucrose phosphate synthase) associated with sucrose phosphate synthase function, ensuring consistency in the basic function of sucrose metabolism. In terms of diversity, there are individual differences in the composition and length of their structural domains. Some proteins possess unique structural domains (e.g., glycosyl transferases group I), suggesting that evolutionary functional differentiation has occurred, possibly allowing members to perform specific functions in different environments or tissues. Overall, the SPS family of luffa has retained its core functional structures to maintain its basic functions, but has also diversified its functions through structural domain variation, which is helpful in further analyzing the complex roles of this family in the growth and metabolic processes of luffa.
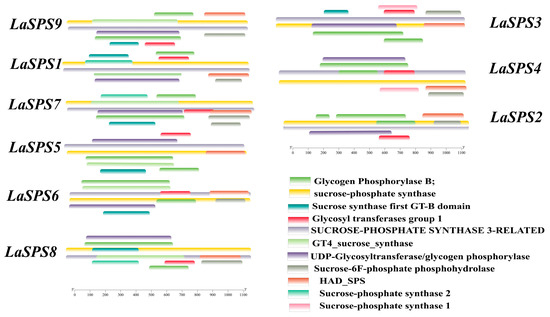
Figure 4.
Protein domains of LaSPSs. Different colored bands represent different functional domains.
3.6. Molecular Docking Reveals the Function of LaSPS in Sucrose Metabolism
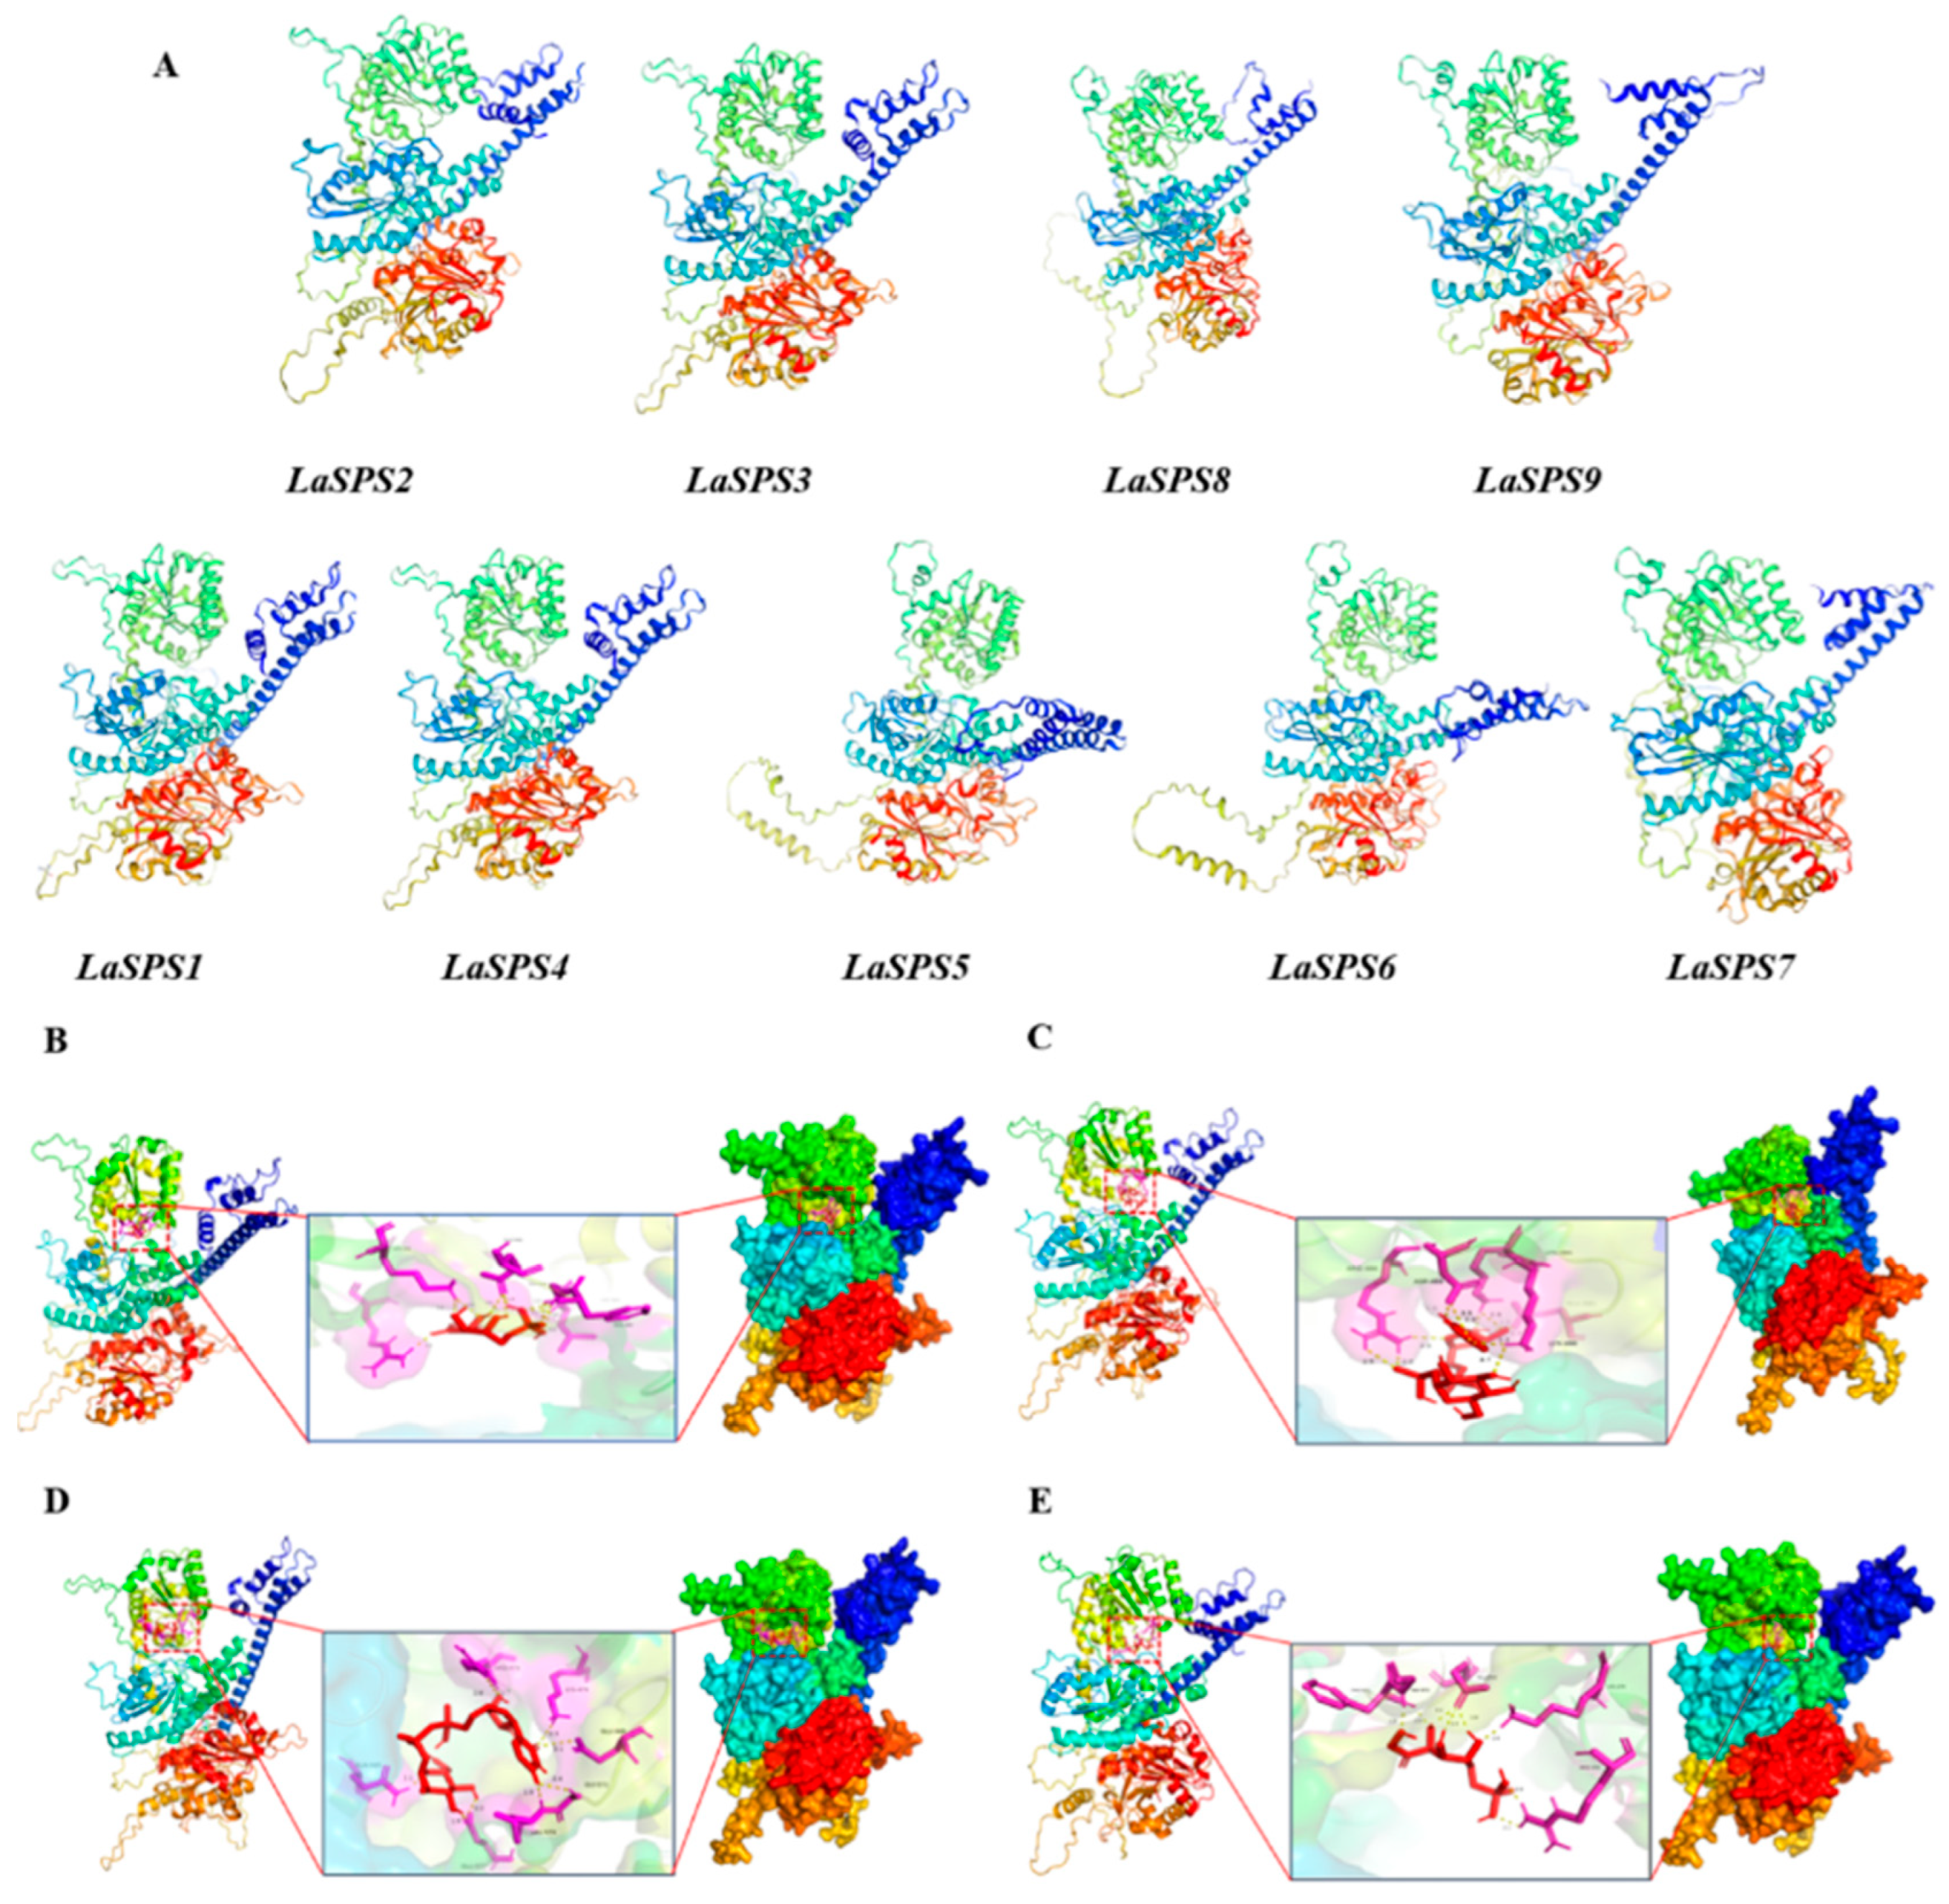
We further predicted LaSPS tertiary structure using the SwissModel platform [29,30,31,32,33]. All models had GMQE scores ≥ 0.7, indicating reliable forecast accuracy. An analysis of the docking results revealed that the tertiary structure of the nine LaSPS genes is highly conserved, with all having two distinct structural domains and an active hydrophobic pocket, consistent with the conformational features of the SPS family. Notably, alternative transcripts from the same locus (e.g., LaSPS2 vs. LaSPS1) differed in spatial arrangement despite similar overall folding patterns. Significant structural differences were observed between LaSPS6 and LaSPS5, with the latter having an increased α-helix content in the dark blue structural domain and different spatial arrangement characteristics. Similar changes were observed for LaSPS9, LaSPS8, and LaSPS7, suggesting the existence of specific structural plasticity among isozymes (Figure 5A). Interestingly, LaSPS3 and LaSPS4 showed not only highly similar conformations but also minimal spatial differences. Subsequently, we performed substrate docking simulations of these two isoenzymes, choosing fructose 6-phosphate (F6P) and uridine diphosphate glucose (UDPG) substrates to reveal their binding interactions. For LaSPS3, nine hydrogen bonds were formed with F6P involving residues LYS, ARG, GLU, LEU, GLY, and PHE (Figure 5B), and the binding of UDPG was stabilized by ten hydrogen bonds formed by ARG, ASP, LYS, and GLU (Figure 5C). LaSPS4 formed eight hydrogen bonds (LYS, ARG, GLU, GLY, and PHE) with F6P (Figure 5D) and nine hydrogen bonds (ARG, GLU, GLY, and PHE) with UDPG (Figure 5E). LaSPS4 established nine hydrogen bonds with F6P (ARG, GLN, LEU, LYS, GLU, GLY), with the catalytic residues ASP, ARG, LYS, and HIS dominating the active site.
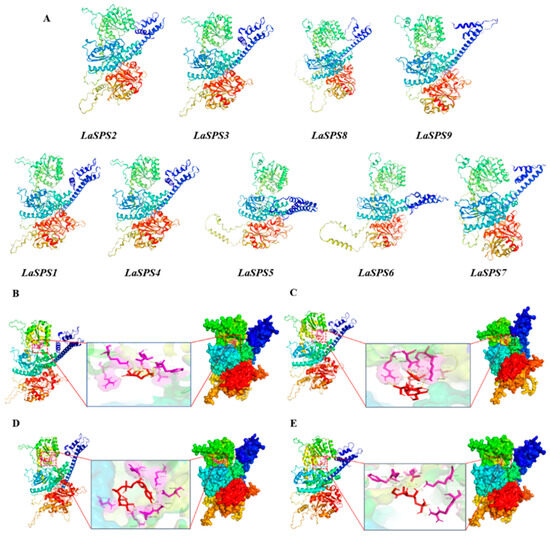
Figure 5.
Predicted structure and substrate binding details of LaSPSs protein. (A), The tertiary structure of the proteins encoded by LaSPS. (B), Structural prediction of LaSPS3 protein and binding details to F6P substrate; (C), structural prediction of LaSPS3 protein and binding details to UDPG substrate; (D), structural prediction of LaSPS4 protein and binding details to F6P substrate; (E), structural prediction of LaSPS4 protein and binding details to UDPG substrate.
3.7. Analysis of Cis-Acting Elements
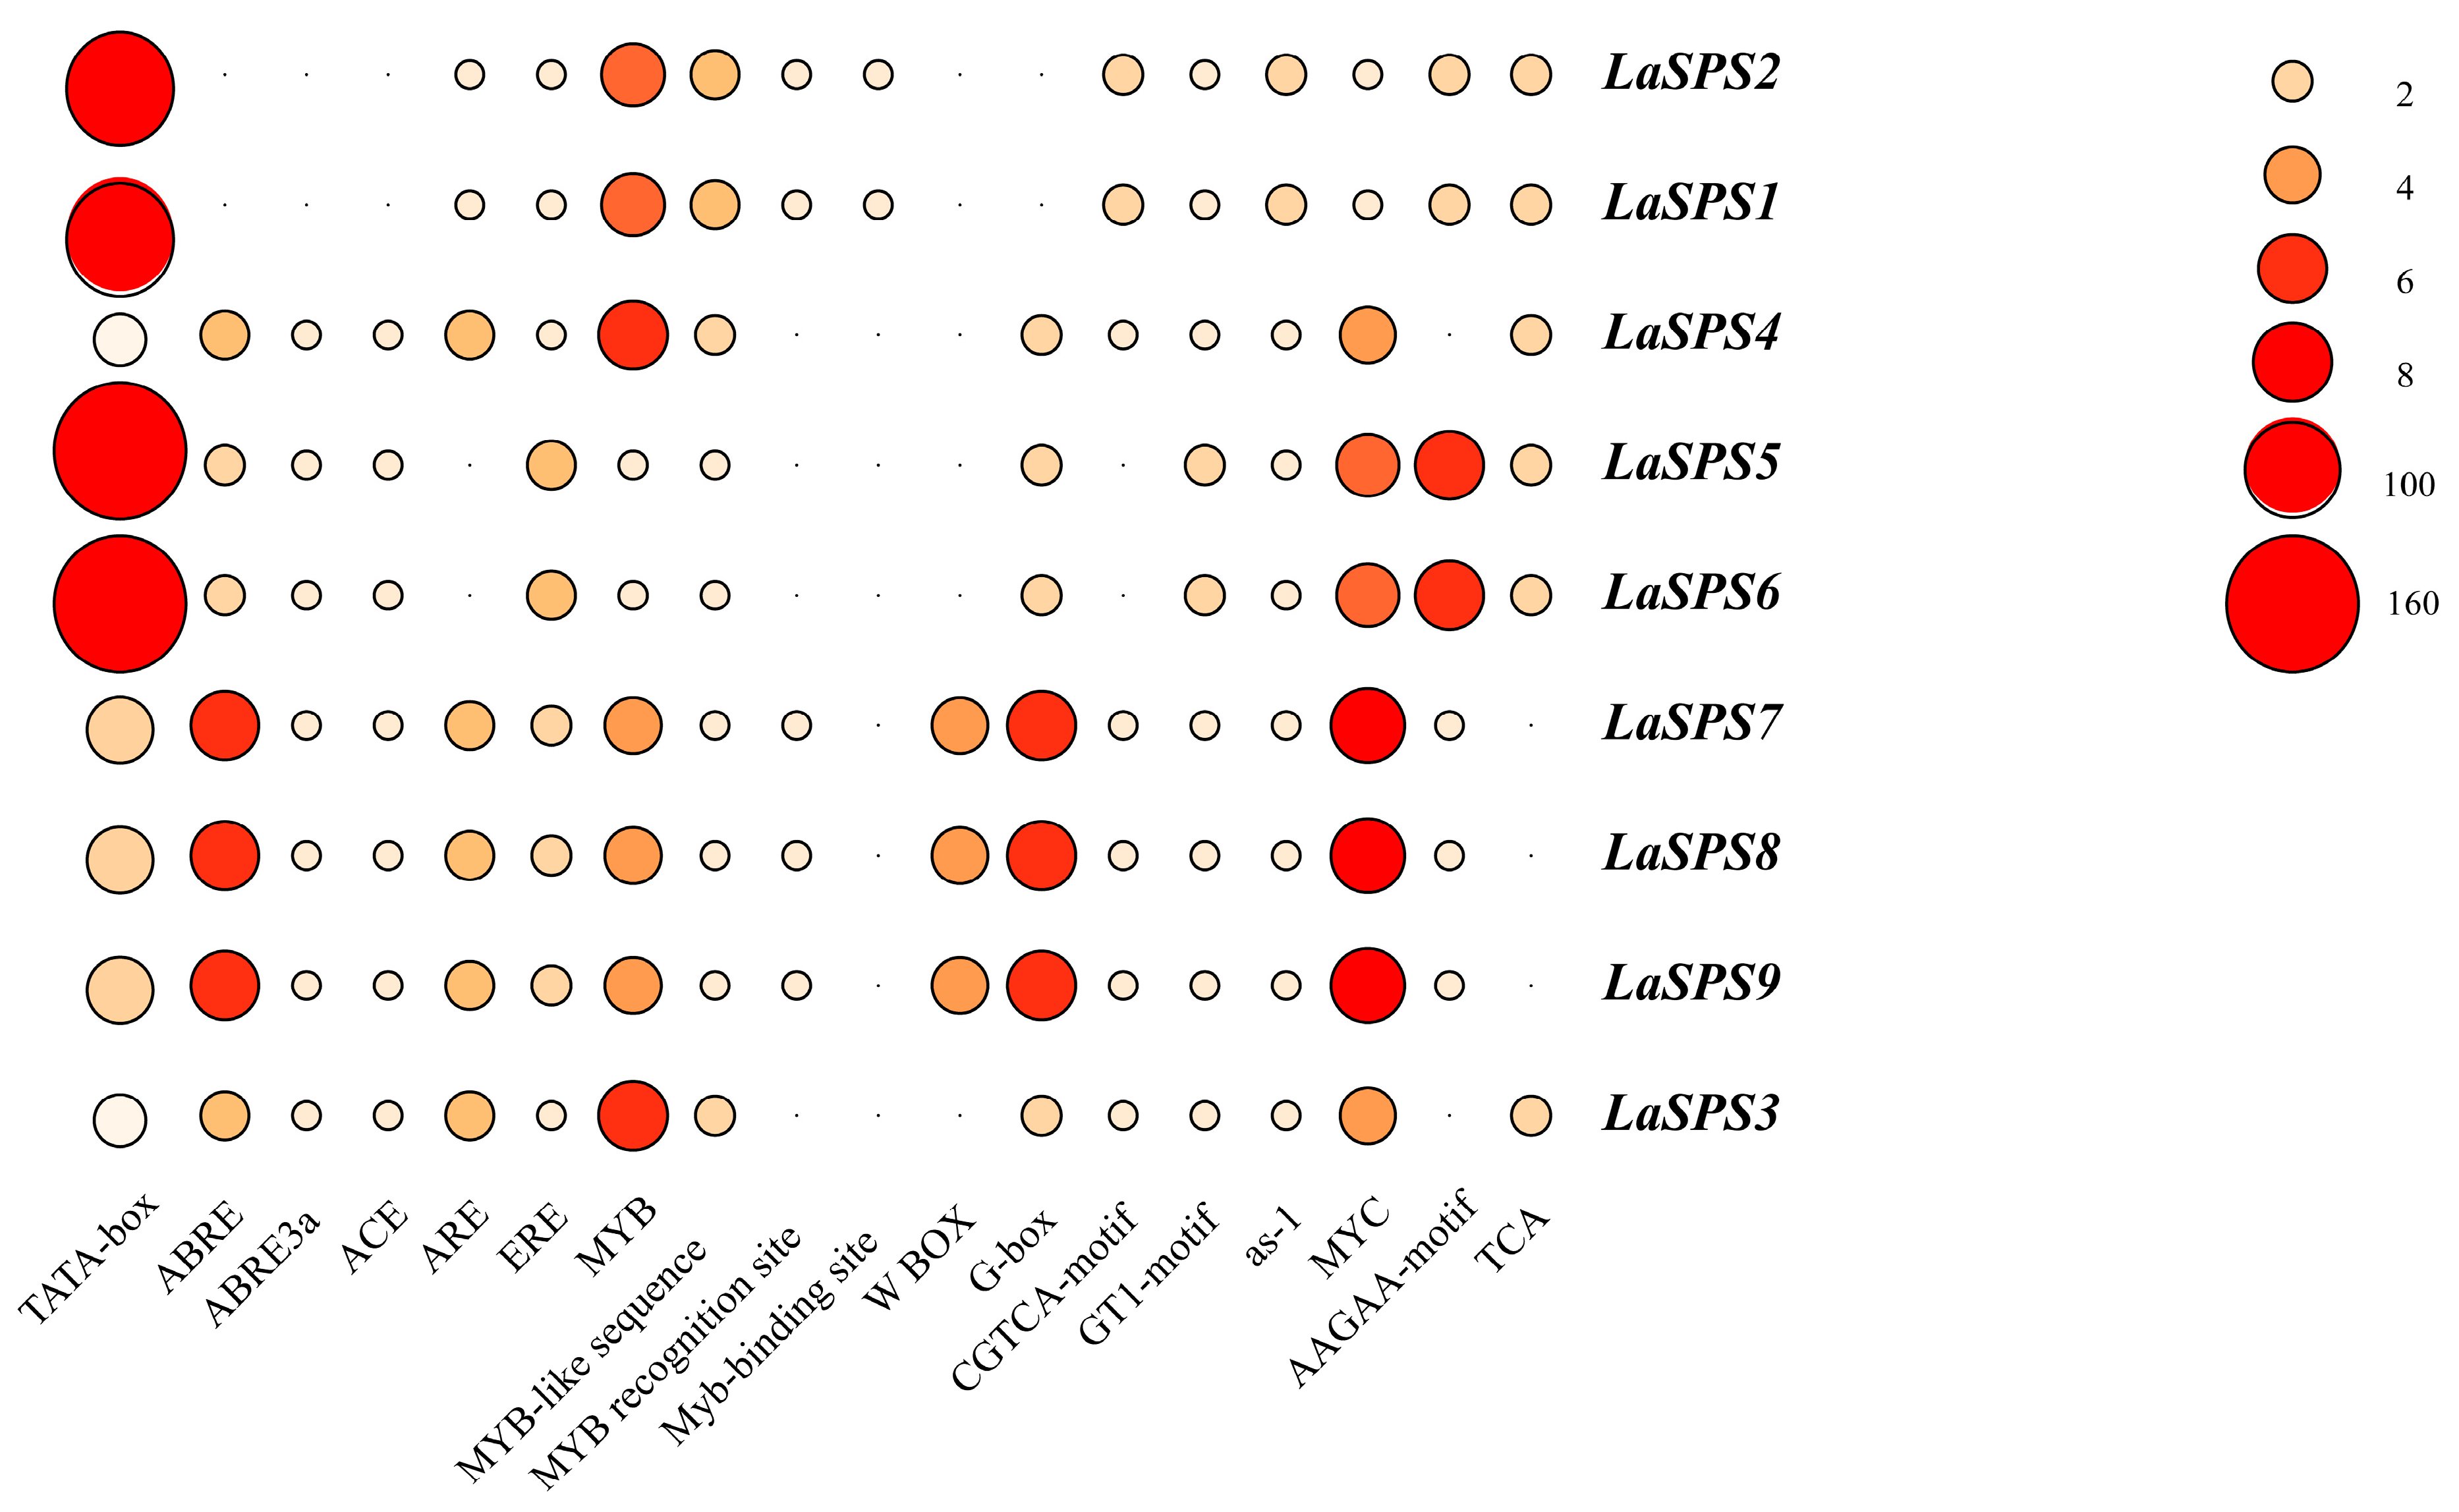
To further investigate the functional characteristics of the LaSPS family, we analyzed the cis-acting element compositions of the nine family members and their distribution characteristics. Their cis-elements are numerous and diverse, and in addition to basic promoter elements (e.g., TATA box, CAAT box), there are many specific functional elements such as ABRE (abscisic acid responsive), GARE (gibberellin responsive), and MeJA responsive (methyl jasmonate responsive), indicating that this family may play a role in hormone regulation or environmental stress (Figure 6). The types and numbers of components vary significantly among genes, with fundamental components reflecting common regulatory mechanisms among family genes and unique components suggesting specific functional differentiation. Genes with many components (e.g., LaSPS1, LaSPS2) are more complex and may be associated with multiple physiological processes, whereas genes with few components (e.g., LaSPS7, LaSPS8, LaSPS9) are simpler in regulation and more specialized in function (Supplemental Figure S1).
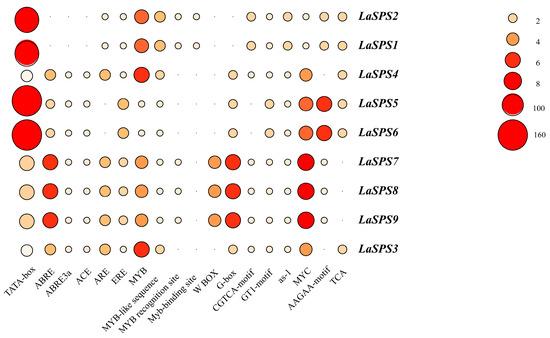
Figure 6.
Critical cis-acting elements in the promoter regions of LaSPS genes.
3.8. Expression Profiles of LaSPS Genes and Their Correlation with Sucrose Content During Fruit Senescence
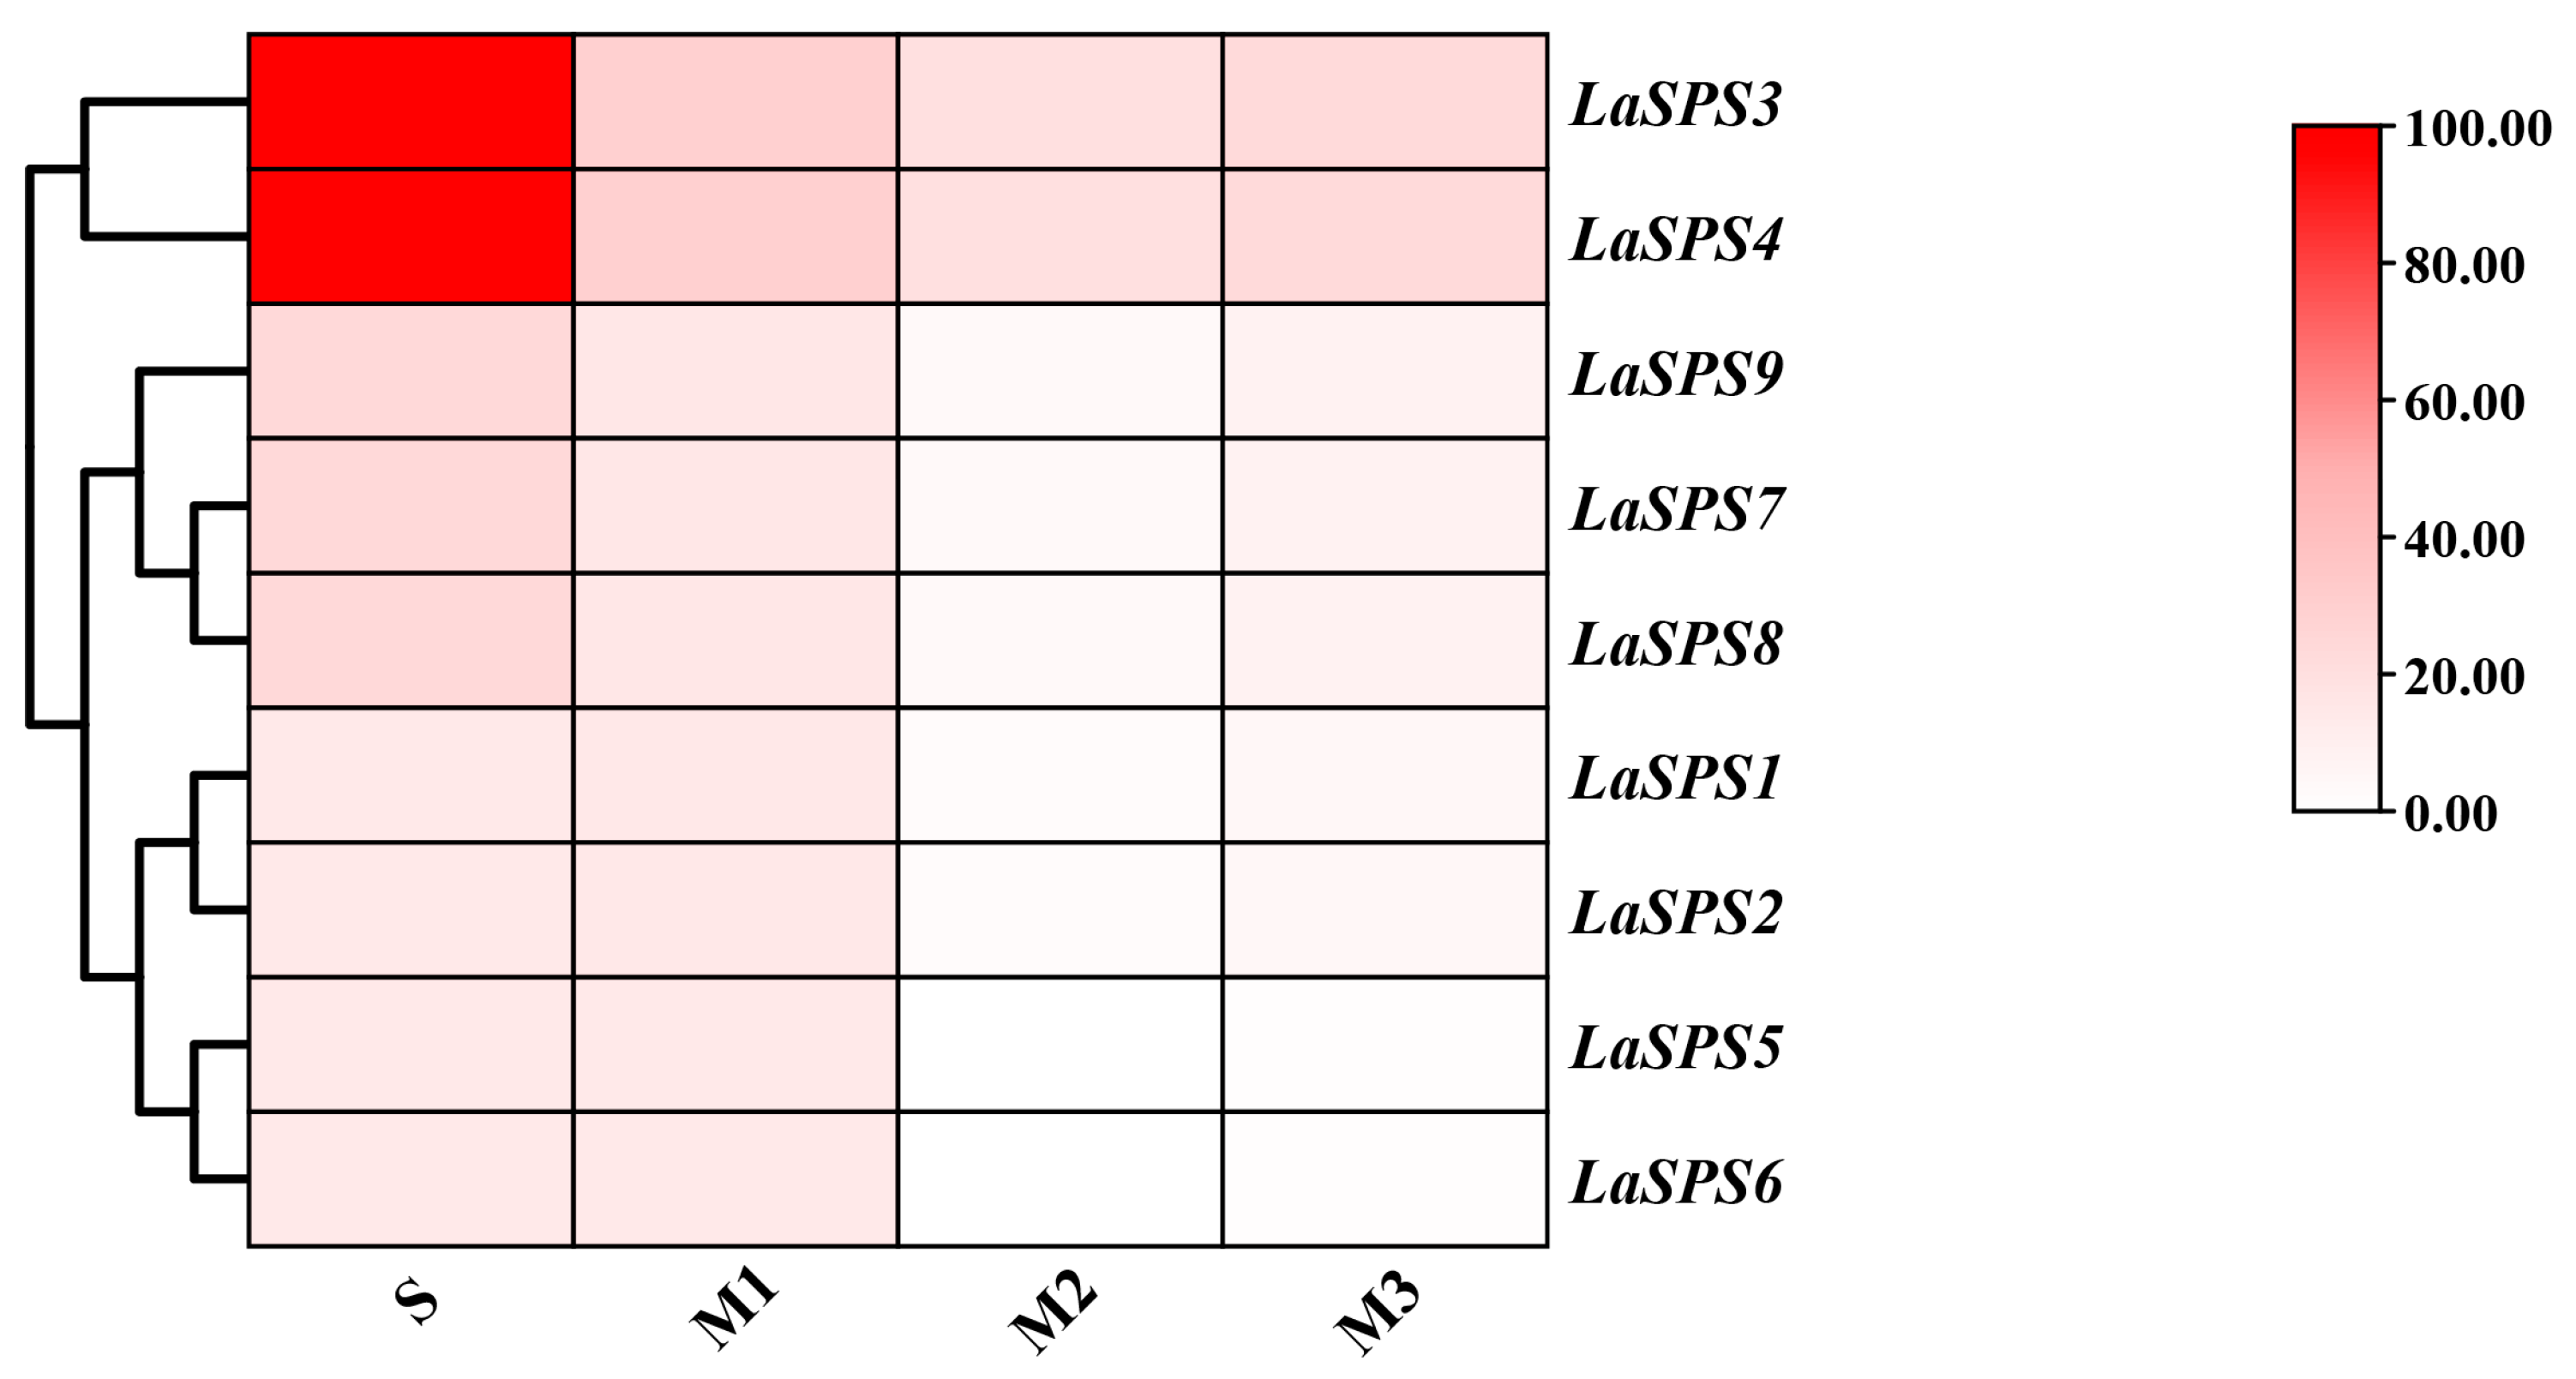
We focused on the senescence process of luffa fruits, dividing senescence into four phases (S, M1, M2, and M3 phases), and performed transcriptome sequencing (RNA-seq). The expression profiles of the LaSPS family were visualized by heat map analysis, showing the temporal expression pattern of each gene. The colors reflect the strength of the association (Figure 7). There was a general trend of decreasing transcript levels for all LaSPS genes from the S to M3 phase. In particular, the LaSPS3 and LaSPS4 showed high expression levels in the S phase. This suggests that LaSPS3 and LaSPS4 may play an important role in maintaining cell viability and function during the late stages of fruit senescence. Based on their origin as tandemly duplicated homologous genes on shared chromosomes and conserved gene/protein architectures, the nine LaSPS genes were classified into four clusters: T1 (LaSPS1/LaSPS2), T2 (LaSPS3/LaSPS4), T3 (LaSPS5/LaSPS6), and T4 (LaSPS7–LaSPS9). Correlation analysis revealed that except for LaSPS1/2, the expression levels of other LaSPS genes showed positive correlations with sucrose content (Table 2). As fruit senescence progressed, sucrose synthesis was progressively inhibited, likely due to the diversion of carbon precursors toward cellulose biosynthesis, thereby restricting sucrose accumulation.
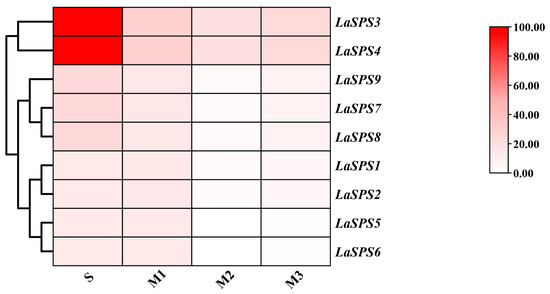
Figure 7.
The transcriptional levels of LaSPS genes during fruit senescence stages based on RNA-seq analysis. S-phase (Storage stage), M1 (Mature-senescence stage 1, which begins two weeks after the start of the storage stage), M2 (Mature-senescence stage 2, which begins four weeks after the start of the storage stage), and M3 (Mature-senescence stage 3, which begins six weeks after the start of the commercial period) for RNA-seq analysis. The color scale corresponds to the log2 FPKM expression value.
Table 2.
The correlation coefficient of the LaSPSs with the expression of sucrose during fruit senescence. One asterisk represents significant differences at p < 0.05 (one-way ANOVA). The genes were clustered into four distinct groups based on their sequence homology and consistent expression patterns. T1 (LaSPS1/LaSPS2), T2 (LaSPS1/LaSPS2), T3 (LaSPS3/LaSPS4), and T4 (LaSPS7/LaSPS8/LaSPS9). (* for p < 0.05, one-way ANOVA).
3.9. Expression Levels of LaSPS Genes in Fruit Under Ethylene and 1-MCP Treatment
Ethylene, as a senescence-related hormone, is released in the post-harvest period of fruit. To investigate whether LaSPS is regulated by ethylene, we treated luffa fruits in the S-phase with exogenous ethylene and ethylene inhibitor 1-methylcyclopropene (1-MCP), separately. The results showed that 200 mg·L−1 ethylene treatment significantly suppressed all LaSPSs expression, whereas 5 μL·L−1 1-MCP application counteracted this repression (Figure 8A–D). These findings demonstrated that ethylene, as a key hormone in the regulation of plant maturation and senescence, exerts significant inhibitory influence on the expression of LaSPSs.
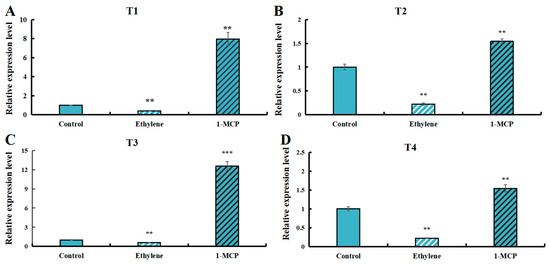
Figure 8.
Expression levels of LaSPSs genes in fruits treated with ethylene and 1-MCP. (A), LaSPS1/2; (B), LaSPS3/4; (C), LaSPS5/6; (D), LaSPS7/8/9. Based on the structural characteristics and evolutionary relationships of these nine genes, they were classified into four homologous gene clusters: T1 (LaSPS1/LaSPS2), T2 (LaSPS3/LaSPS4), T3 (LaSPS5/LaSPS6), and T4 (LaSPS7/LaSPS8/LaSPS9). Asterisks denote statistically significant differences (** for p < 0.01, *** for p < 0.001, one-way ANOVA).
3.10. Expression Patterns of LaSPS in Different Tissues of Luffa
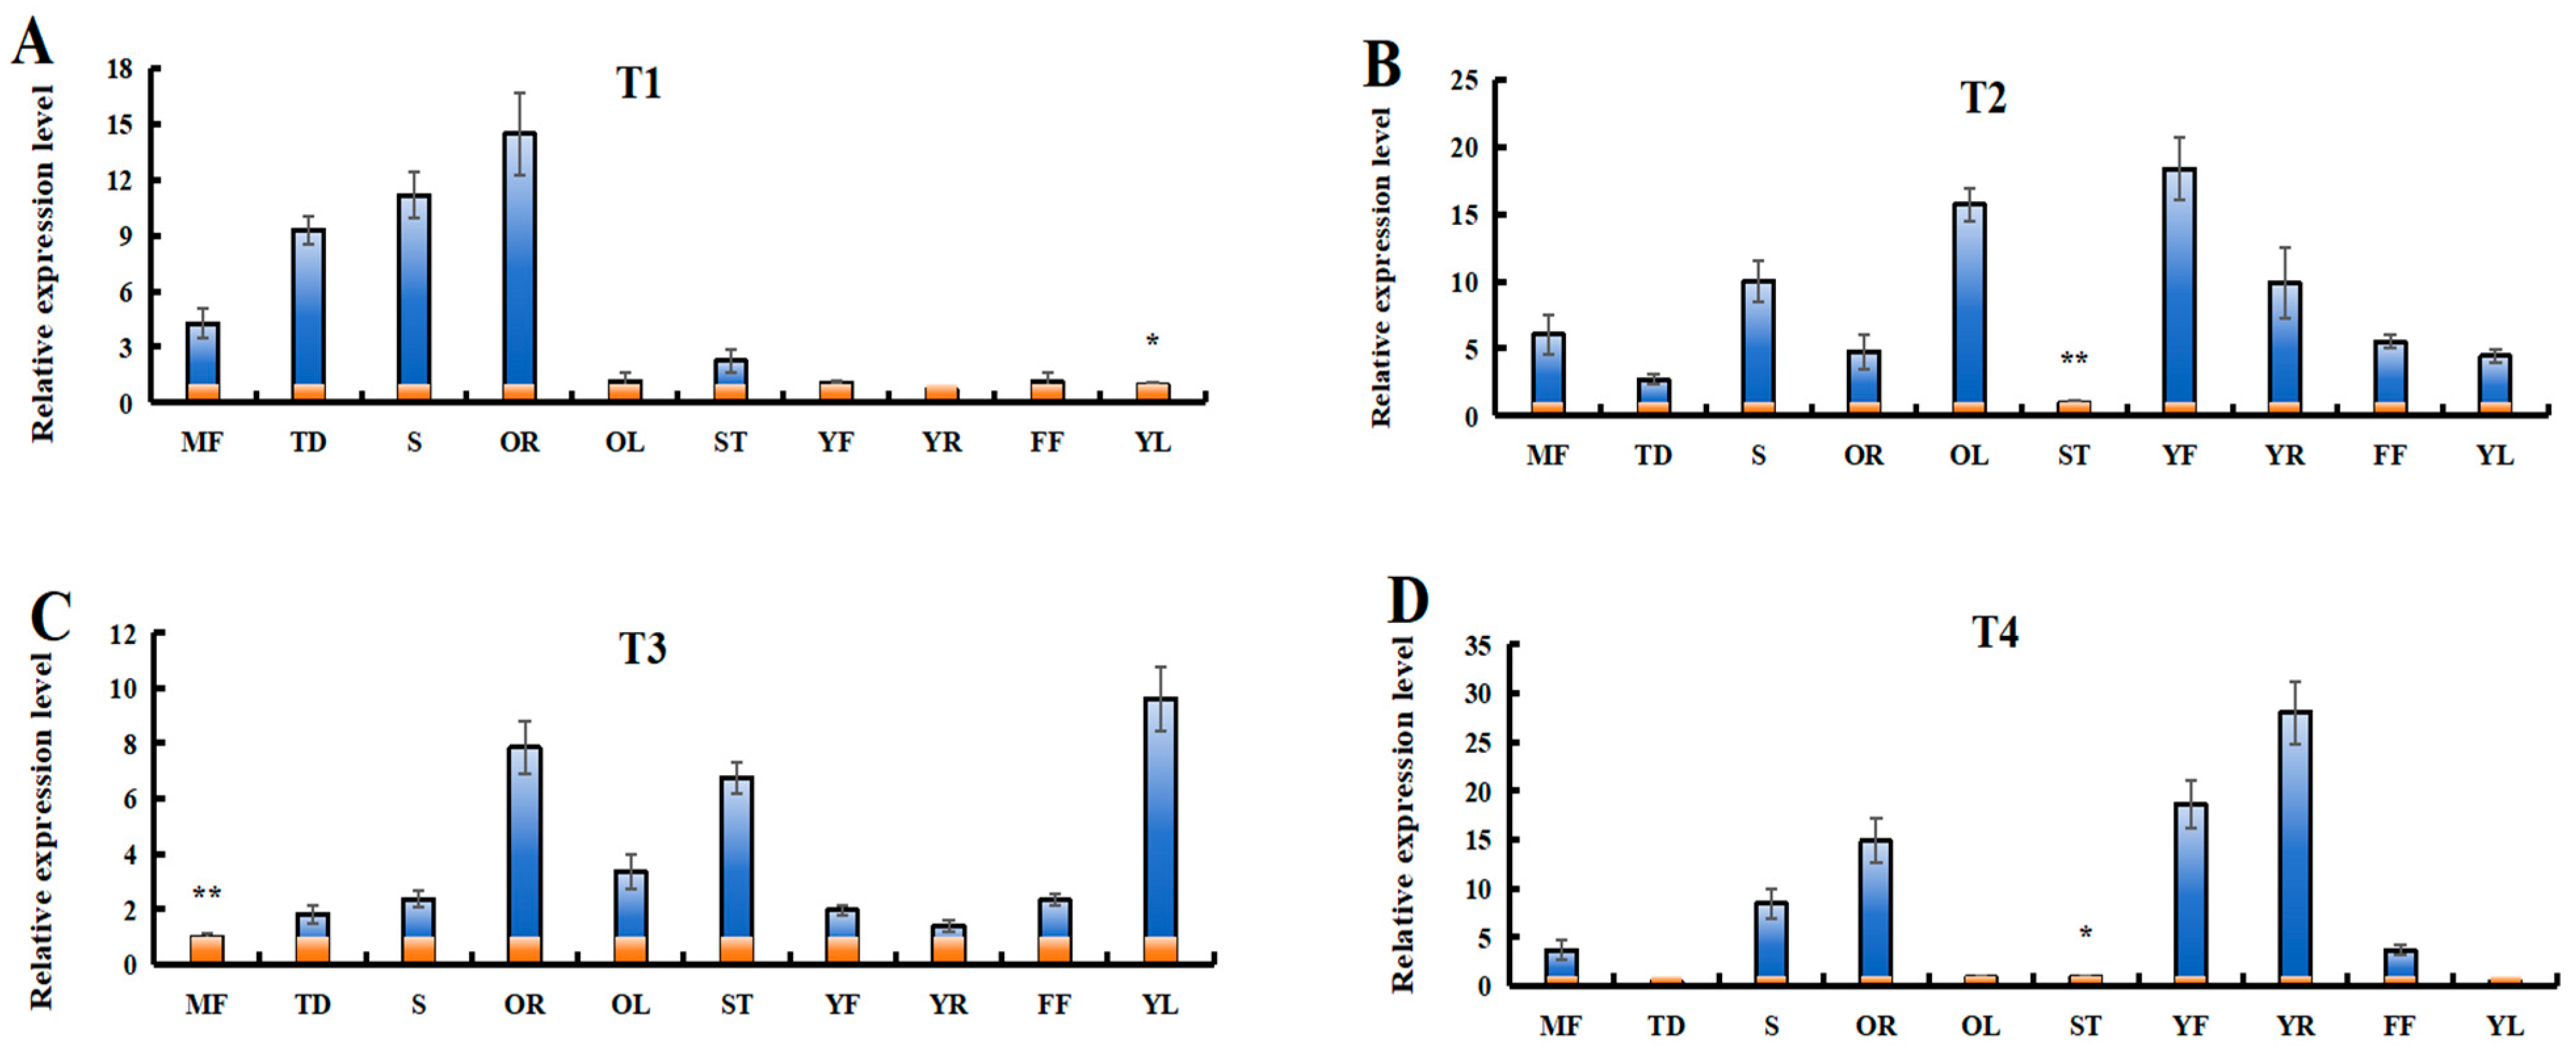
In order to further understand the potential functions of LaSPSs, the relative expression levels of LaSPSs in 10 luffa tissues were determined by RT-qPCR analysis (Figure 9). The results demonstrated distinct tissue-specific expression patterns among the transcripts. LaSPS1/2 was predominantly expressed in old roots (OR) and tendrils (TD); LaSPS3/LaSPS4 showed significant enrichment in stems (S), young fruits (YF), and old leaves (OL); LaSPS5/6 exhibited peak expression levels in OR, stem tips (ST), and young leaves (YL); whereas LaSPS7/8/9 displayed preferential expression in YF and young roots (YR), with minimal expression detected in other tissues. Overall, these results suggest that the LaSPS gene plays multiple roles in luffa growth and development.

Figure 9.
Expression of LaSPSs in different tissues were monitored using RT-qPCR, including old roots (OR); tendrils (TD); stems (S); young fruits (YF); old leaves (OL); stem tips (ST); young leaves (YL); young roots (YR); female flower (FF); and mature fruits (MF). (A), LaSPS1/2; (B), LaSPS3/4; (C), LaSPS5/6; (D), LaSPS7/8/9. In each gene expression level map, the lowest transcript value of 10 tissues was normalized to 1. Data are shown as the mean ± standard deviation of three independent replicate experiments.(* for p < 0.05, ** for p < 0.01, one-way ANOVA).
3.11. LaSPS Gene Expression Profiles Under Drought Stress
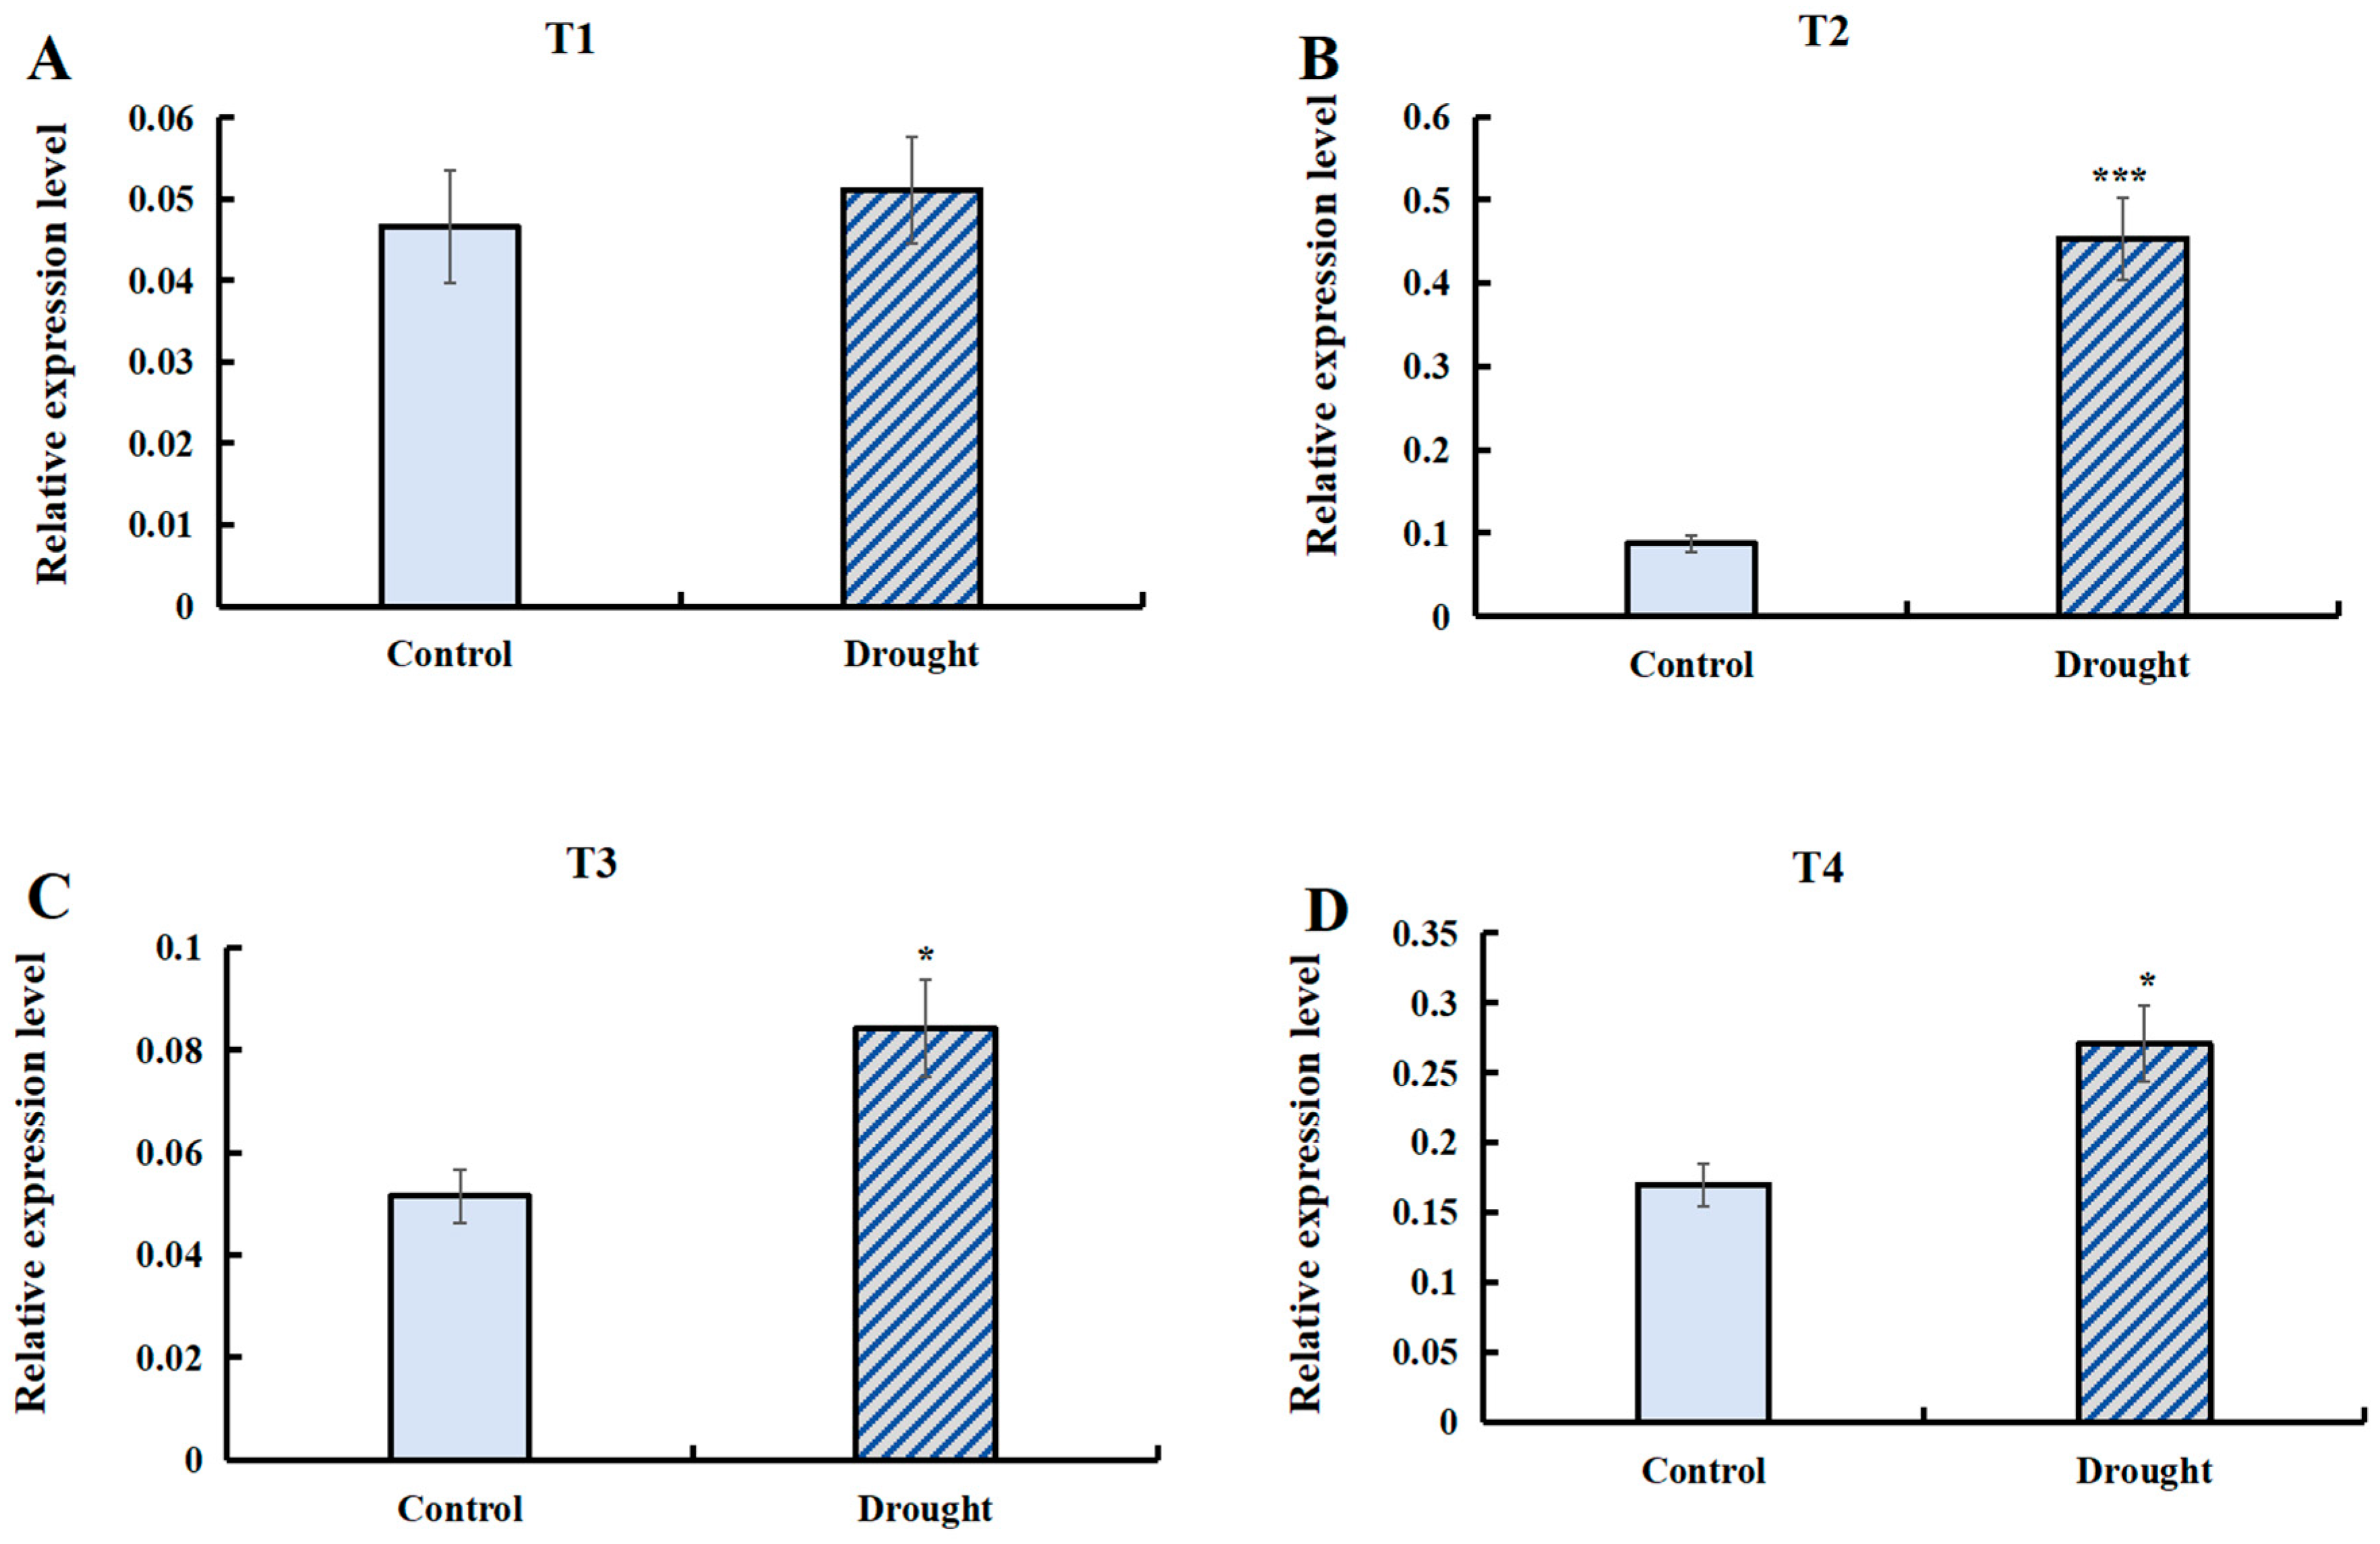
The transcript abundance of T1 (LaSPS1/2), T2 (LaSPS3/4), T3 (LaSPS5/6), and T4 (LaSPS7/8/9) of SPS genes under drought stress conditions was quantified by RT-qPCR analysis (Figure 10). The data showed that the expression of the most cluster genes was significantly higher than that of the control under drought conditions. The T2 (Figure 10B) group showed the most significant upregulation with about a 4-fold increase in gene expression under drought conditions compared to the control. LaSPS3/4 upregulation demonstrates their putative regulatory function in drought stress adaptation.
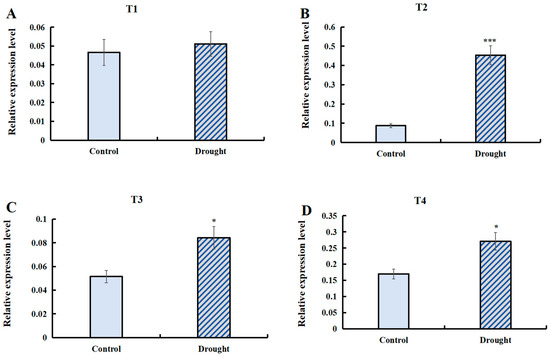
Figure 10.
The relative expression of LaSPSs under drought stress was determined by RT-qPCR. (A), LaSPS1/2; (B), LaSPS3/4; (C), LaSPS5/6; (D), LaSPS7/8/9. The control group was set as 1. The data of three biological experiments were statistically calculated as the mean ± standard deviation (n ≥ 3). Asterisks denote statistically significant differences (* for p < 0.05, *** for p < 0.001, one-way ANOVA).
3.12. Overexpression of LaSPS3/4 Improved Drought Resistance in Transgenic Tobacco
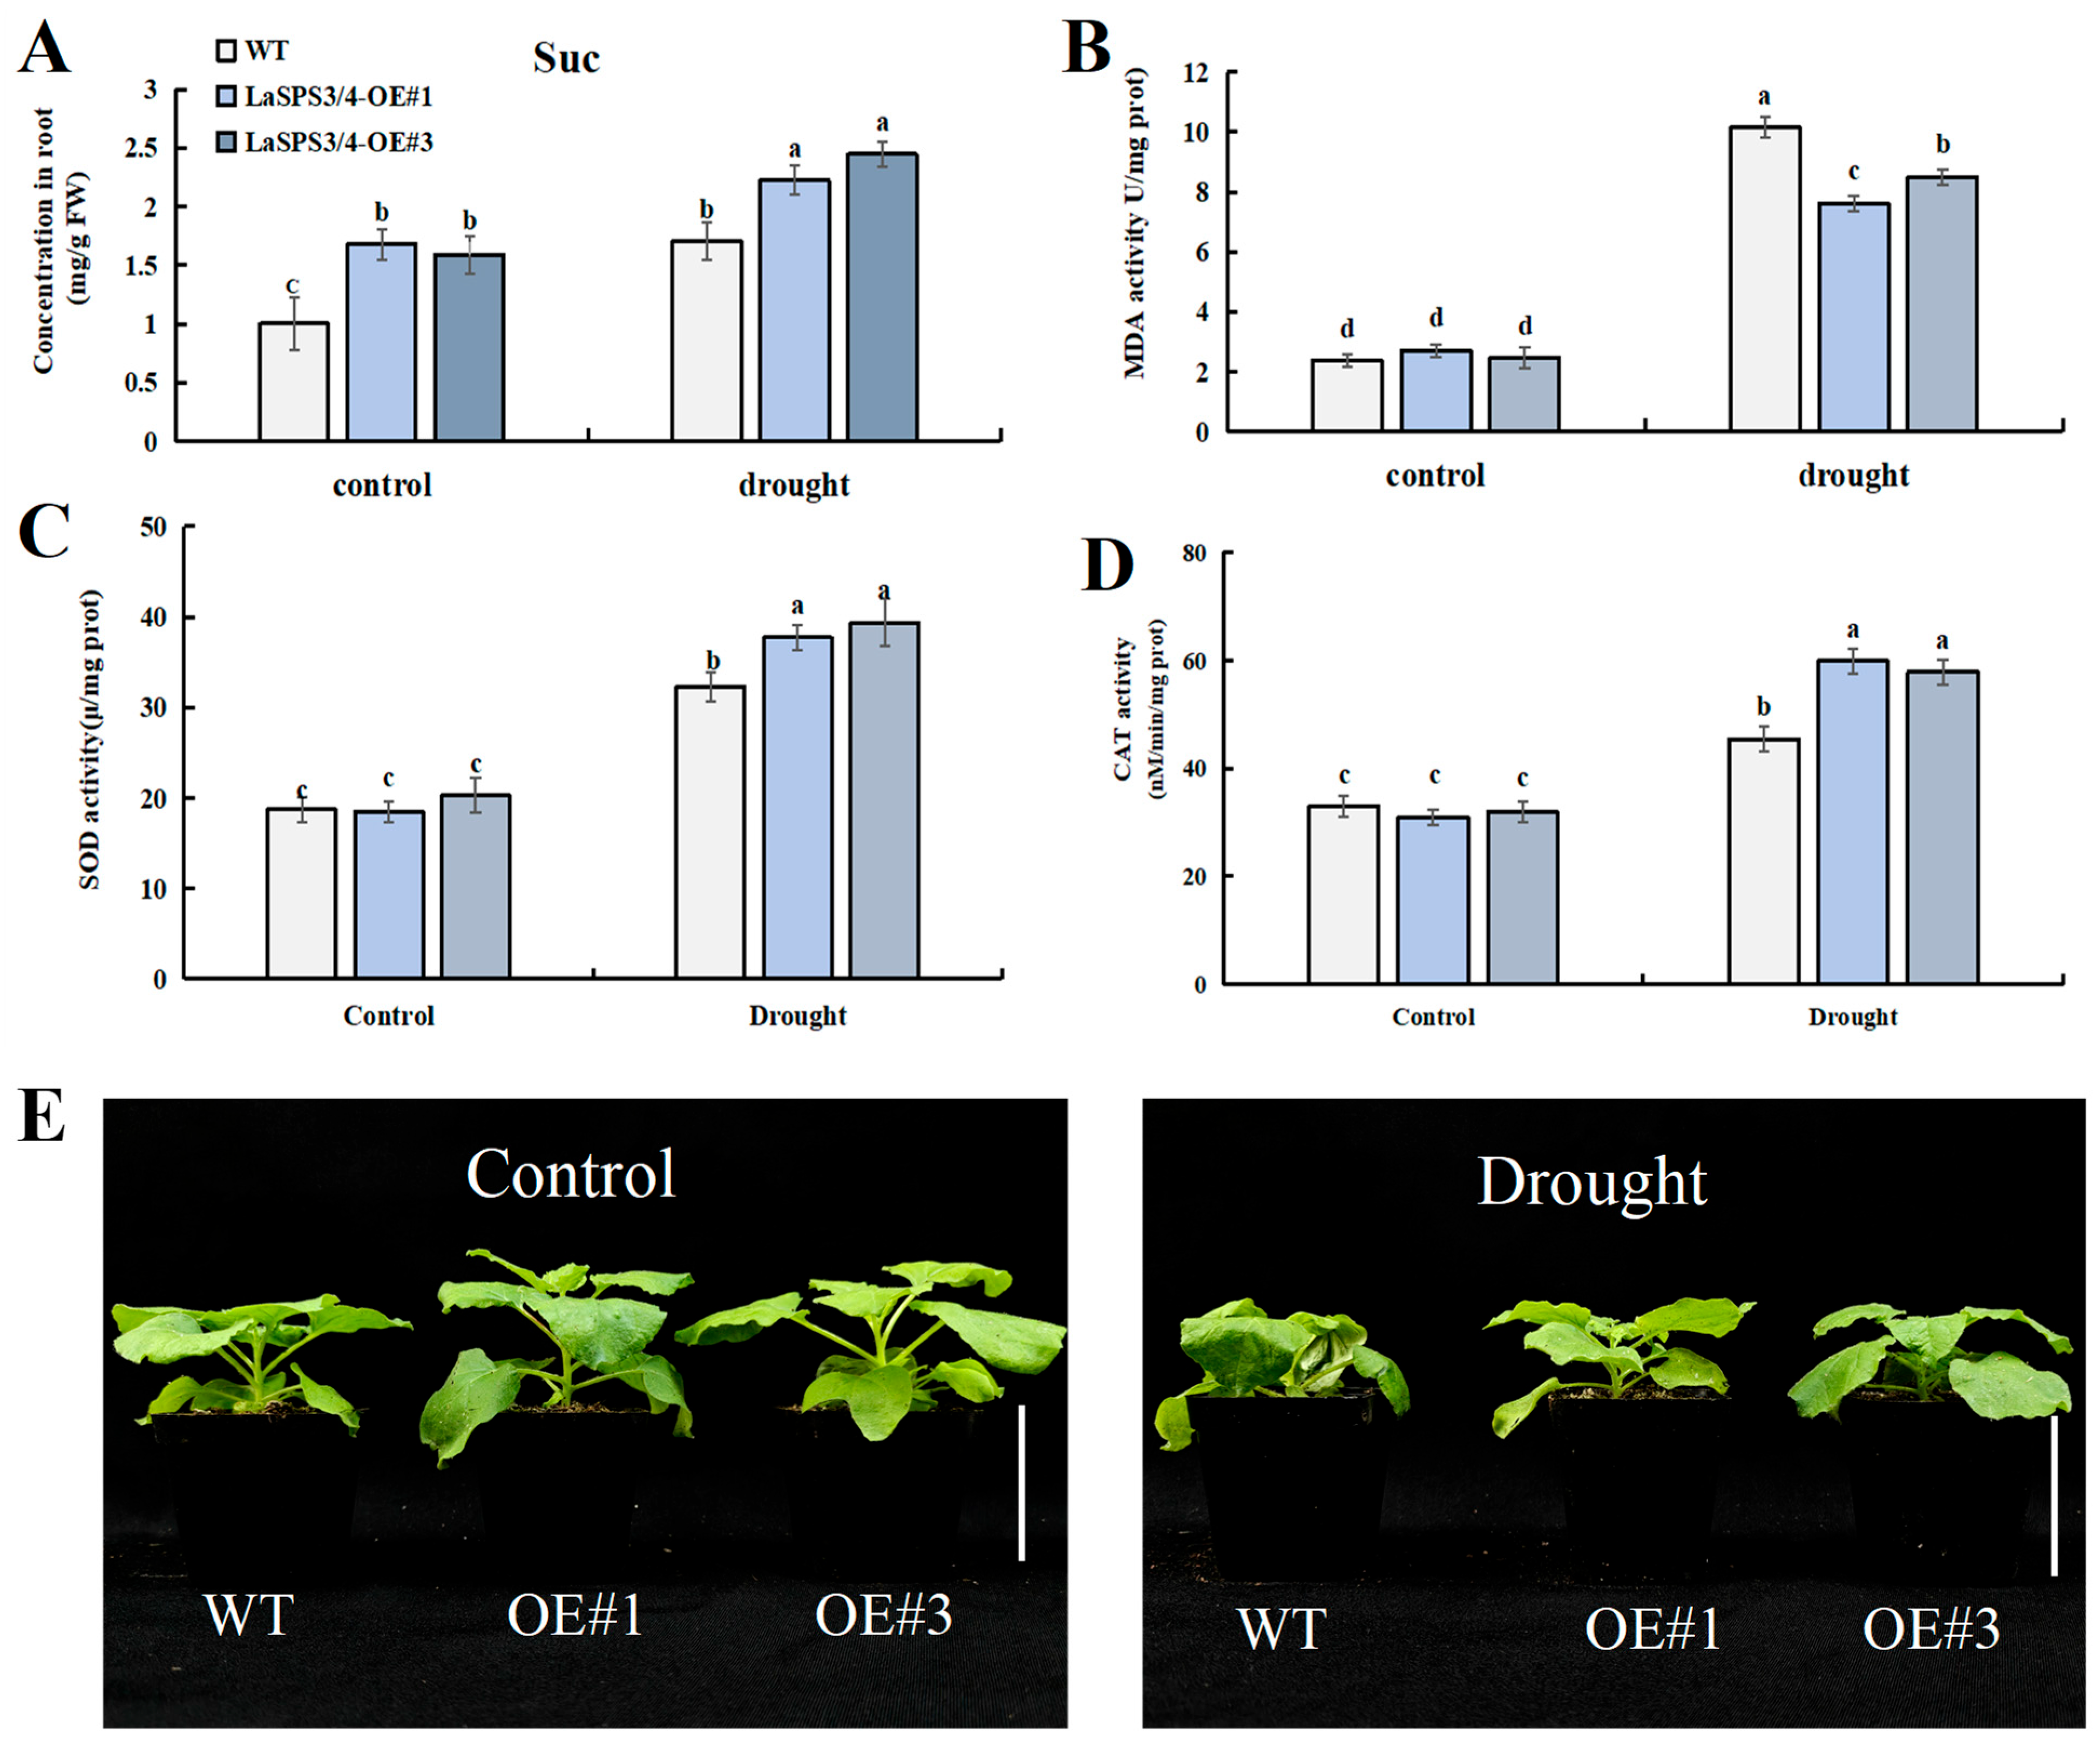
To characterize the function of LaSPS3/4 in drought stress response, we generated transgenic tobacco lines overexpressing LaSPS3/4 (LaSPS3/4-OE). Two T2 lines (OE#1 and OE#3) with distinct LaSPS3/4 transcript levels were selected for further investigation (Supplemental Figure S2). Then we subjected WT (Wild Type) and LaSPS3/4-OE lines (LaSPS3/4-OE#1 and OE#3) to drought stress treatment. The growth status of OE#1 and OE#3 lines was significantly better than that of WT plants, while the leaves of the control group showed obvious wilting due to water deprivation (Figure 11E).
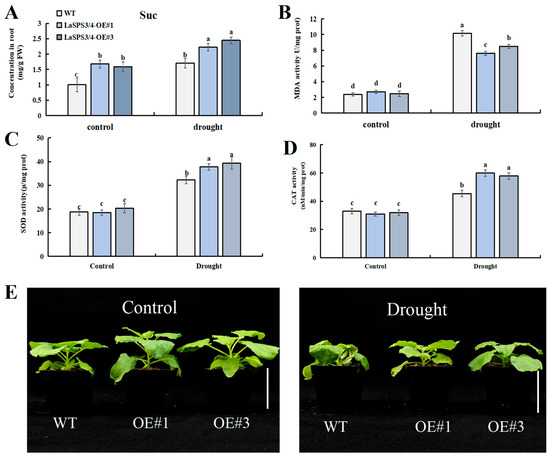
Figure 11.
Overexpression of LaSPS3/4 enhances drought resistance in transgenic tobacco plants. (A), Sucrose (Suc) concentration; (B), malondialdehyde (MDA) concentration; (C), superoxide dismutase (SOD) activity; (D), and catalase (CAT) activity were measured in leaf of WT and OE plants, under drought or normal growth conditions (control group). (E), Phenotypic comparison between wild-type and LaSPS3/4 overexpressing transgenic tobacco plants under drought stress conditions. Scale bar, 5 cm. Data represent mean ± SD values of three independent biological replicates. At the p < 0.05 level, the letters a, b, c, d indicate statistically significant differences (one-way ANOVA).
The measurement of malondialdehyde (MDA) content indicated the degree of membrane lipid peroxidation, and drought significantly induced MDA accumulation in WT and OE, but MDA was significantly lower in the overexpression strain than in the control (Figure 11B). Meanwhile, the sucrose content of the overexpression strain was significantly increased under drought treatment compared to WT (Figure 11A), indicating the regulation of osmotic homeostasis under drought stress. Under drought stress, the activities of catalase (CAT) (Figure 11D) and superoxide dismutase (SOD) (Figure 11C) in LaSPS3/4 overexpressing tobacco were significantly higher than those in wild-type plants. This suggests that it may activate related antioxidant enzymes and effectively scavenge ROS through the regulation of sucrose metabolism, resulting in a significant reduction in MDA levels to improve the ability of plants to cope with drought stress.
4. Discussion
Sucrose, the primary product of photosynthesis, is translocated via phloem from source tissues (e.g., leaves) to sink tissues (e.g., fruits, roots) to supply energy and carbon skeletons for plant growth and development [1,34,35]. Furthermore, sucrose plays a pivotal role in abiotic stress adaptation by modulating osmotic equilibrium and redox homeostasis [36,37]. To date, SPS genes have been cloned and functionally characterized in multiple species, such as rice [38], pineapple [39] and sugarcane [40]. However, a comprehensive analysis of the LaSPS gene family in luffa remains poorly understood. The present study provides a theoretical basis for a better understanding of the physicochemical properties, evolutionary characteristics, and physiological functions of LaSPS.
The SPS gene family has been studied in several species. Hu et al. constructed a phylogenetic tree of 177 homologous proteins from 13 species and found that they could be classified into three subgroups, SPSI, SPSII, and SPSIII [41]. Langenkamper et al. phylogenetically analyzed the full-length and conserved sequences of the known SPS genes in higher plants and classified them into three families: A, B, and C [42]. Intriguingly, our genome-wide analysis identified nine SPS candidate genes in luffa. Phylogenetic reconstruction using SPS protein sequences from Arabidopsis thaliana and cucurbit relatives (Cucurbita maxima, Cucumis sativus, Cucumis melo) revealed that the nine LaSPS members formed three distinct evolutionary clades (Figure 2). This finding is consistent with the conclusions of Castleden et al., who reported that the SPS family of dicotyledonous plants can be divided into three distinct classes [43]. Notably, chromosomal localization analysis demonstrated that these clustered genes were arranged in tandem or segmental duplication patterns. This unique tetra-paired paralog architecture establishes a novel model system for investigating the functional divergence and cooperative regulation of SPS genes in cucurbits.
Genetic structure analysis is indispensable for family identification. The structure of SPS has been extensively characterized in model species such as tomato (Solanum lycopersicum) and sugarcane (Saccharum officinarum) [44,45]. Here, we focused on the functional characteristics of the family and visualized the protein structural domains of the nine genes, which showed that the distribution of structural domains of the LaSPS family is both conserved and evolved. Most of the LaSPSs possess glycosyl transferase, in combination with a sucrose 6F-phosphate phosphohydrolase structural region. This finding is in line with the conclusions of Lunn et al., who determined that the SPS family is distinctive within its own context [4]. The distribution of these structural domains allows the luffa SPS family to perform the core function of sucrose synthesis, but also to expand its metabolic regulatory functions to meet different physiological needs [46]. When the cis-acting elements of the luffa SPS family were analyzed, similar distributional features were observed. The basic elements (TATA box, CAAT box, etc.) and functional elements (ABRE, GARE, etc.) were unevenly distributed in different promoter sequences. Protein structural domain components overlapped but were differentiated, and some members contained unique structural domains, suggesting that functional specialization may have occurred. The integrated gene structure, protein characteristics, and evolutionary relationships suggested that the luffa SPS gene family may belong to the paralogous gene clusters, which originated from gene duplications that expanded the family’s scale during the evolutionary process [47].
Spatiotemporal differences in LaSPSs expression may suggest functional differentiation. The expression of four transcripts in 10 tissues of luffa was identified by RT-qPCR and it was found that group T1 (LaSPS1/2) and group T2 (LaSPS3/4) are expressed at high levels in old roots and leaves, respectively, and both may have a tissue-specific division of labor to maintain basal metabolism and meet the structural maintenance requirements of mature tissues. Group T4 (LaSPS7/8/9) is highly expressed in active tissues, suggesting that they mainly provide energy and structural materials for cell growth. Group T3 (LaSPS5/6) is highly expressed in several tissues and organs, forming a functional complementarity with other members. RNA-seq is often used to screen for highly expressed differential genes. Zhu et al. used RNA-seq on Luffa cylindrica to screen for 27,301 Unigenes during the browning of its fruits [48]. Liu et al. used RNA-seq on Luffa cylindrica to analyze revealed tissue-specific expression patterns of LcCNGCs in various parts (roots, stems, leaves, flowers, and fruits) of the plant [49]. Lou et al. used RNA-seq on Luffa cylindrica to analyze differentially expressed genes caused by CMV infection. Tissue-specific expression patterns of LcCNGCs in various parts of the plant (roots, stems, leaves, flowers, and fruits) were revealed using RNA-seq. Differentially expressed genes induced by CMV infection were analyzed in Luffa cylindrica by Lou et al. [50]. Liu et al. used RNA-seq to reveal the effects of low-temperature stress on WRKY genes in luffa expression [51] RNA-seq analysis revealed that all LaSPS members during senescence showed consistent downregulation. Notably, LaSPS3/4 maintained significantly higher expression levels even at terminal senescence (M3). This persistent expression indicates their specialized role during late senescence, potentially by preserving sucrose biosynthesis to meet senescence-associated metabolic demands [52].
Consistent with its classical role in sucrose biosynthesis, a positive correlation was observed between SPS expression and sucrose content. As a climacteric fruit, luffa senescence involves respiratory bursts and ethylene upregulation [53]. It has been found that the ethylene-responsive factor PtrERF110 regulates PtrSPS4 and thus sugar to improve cold tolerance in citrus [54]. This suggests that ethylene in luffa may inhibit SPS activity, redirecting carbon flux from sucrose synthesis toward hexose accumulation. This metabolic shift potentially supplies glucose substrates for cellulose biosynthesis. The inverse relationship between sucrose anabolism and fiber formation probably implies a sink-driven resource reallocation strategy, where ethylene acts as a master switch diverting photoassimilates toward structural polysaccharides rather than storage sugars. This speculation aligns with the findings made by Liu et al. and Yu et al. [55,56]. This metabolic trade-off highlights the dual role of SPS in balancing developmental senescence and stress adaptation, with implications for optimizing post-harvest fiber quality in cucurbit crops.
Drought can cause damage to plants [57,58]. Drought stress significantly induced the expression level of SPS genes in luffa, with the T2 (LaSPS3/4) model being the most upregulated. Chen et al. verified the drought tolerance function of the OsSUT1 genes [59]. In this study, overexpressing experiments in tobacco revealed that the LaSPS3/4-OE lines had significantly lower MDA levels and increased cytoprotective enzyme activities (SOD and CAT) in the leaves, and sucrose content increased significantly (Figure 11). These results hint that LaSPS3/4 may enhance drought resistance by synthesizing sucrose to reduce intracellular osmotic pressure and protect membrane systems through osmotic regulation, while simultaneously activating antioxidant enzymes to scavenge ROS and mitigate drought-induced oxidative damage.
5. Conclusions
This study systematically identified and characterized nine LaSPS gene family members in the luffa genome. Chromosomal localization and evolutionary analysis showed that four homologous gene clusters were generated. In addition, their spatiotemporal expression differences in different fruit senescence stages and different tissues implied functional differentiation in sugar metabolism. Moreover, the candidate genes of LaSPS3/4 in response to drought stress were also identified. The overexpression of LaSPS3/4 could improve the drought resistance of transgenic tobacco plants. This study provides insights into the molecular evolutionary mechanism and biological role of the luffa LaSPS gene family. Our findings delineate the functional significance of luffa proteins in conferring drought tolerance, providing mechanistic insights for the targeted breeding of drought-resilient cultivars.
Supplementary Materials
The following supporting information can be downloaded at https://www.mdpi.com/article/10.3390/horticulturae11060689/s1, Figure S1: The number of cis-acting elements of the LaSPS family; Supplemental Table S1: Primer used in this study; Supplemental Table S2: Subcellular localization of LaSPSs.
Author Contributions
X.T., J.L.: data curation, investigation, validation, writing—original draft. G.H., F.Y.: investigation, visualization, writing—review and editing. H.W., L.H.: software, visualization, writing—review and editing. Y.Y., S.S.: investigation, data curation. C.M., G.W.: conceptualization, methodology, resources, supervision. H.Z. (Haisheng Zhu), H.Z. (Hongbo Zhao): conceptualization, methodology, Supervision, writing—review and editing. All authors have read and agreed to the published version of the manuscript.
Funding
This work was supported by the Program for the China Postdoctoral Science Foundation (2024M760971), and the Opening Foundation of Fujian Key Laboratory of Vegetable Genetics and Breeding (FJVRC-2023-02, FJVRC-2024-02).
Data Availability Statement
The original contributions presented in this study are included in the article material. Further inquiries can be directed to the corresponding authors.
Conflicts of Interest
The authors declare no conflicts of interest.
References
- Göbel, M.; Fichtner, F. Functions of sucrose and trehalose 6-phosphate in controlling plant development. J. Plant Physiol. 2023, 291, 154140. [Google Scholar] [CrossRef] [PubMed]
- Huh, H.; Jayachandran, D.; Sun, J.; Irfan, M.; Lam, E.; Chundawat, S.P.S.; Lee, S.-H. Time-resolved tracking of cellulose biosynthesis and assembly during cell wall regeneration in live Arabidopsis protoplasts. Sci. Adv. 2025, 11, eads6312. [Google Scholar] [CrossRef]
- Liang, Y.; Wei, G.; Ning, K.; Li, M.; Zhang, G.; Luo, L.; Zhao, G.; Wei, J.; Liu, Y.; Dong, L.; et al. Increase in carbohydrate content and variation in microbiome are related to the drought tolerance of Codonopsis pilosula. Plant Physiol. Biochem. 2021, 165, 19–35. [Google Scholar] [CrossRef] [PubMed]
- Lunn, J.E. Sucrose-phosphatase gene families in plants. Gene 2003, 303, 187–196. [Google Scholar] [CrossRef] [PubMed]
- Liao, G.; Li, Y.; Wang, H.; Liu, Q.; Zhong, M.; Jia, D.; Huang, C.; Xu, X. Genome-wide identification and expression profiling analysis of sucrose synthase (SUS) and sucrose phosphate synthase (SPS) genes family in Actinidia chinensis and A. eriantha. BMC Plant Biol. 2022, 1, 215. [Google Scholar] [CrossRef]
- Wei, Q.J.; Ma, Z.Z.; Le, S.; Lei, C.Y.; Ma, Q.L.; Koo, C.C. Identification and expression of the citrus phosphosucrose synthase gene CsSPS. J. HortScience 2020, 47, 334–344. [Google Scholar]
- Wang, P.; Wan, Z.; Luo, S.; Wei, H.; Zhao, J.; Wang, G.; Yu, J.; Zhang, G. Silencing the CsSnRK2.11 gene decreases drought tolerance of Cucumis sativus L. Int. J. Mol. Sci. 2023, 24, 15761. [Google Scholar]
- Yang, S.; Feng, Y.; Cao, X.; Hu, H.; Yang, J.; Li, W.; Hou, Y.; Ma, Z. Functional Analysis of the Apple SPS Gene Family in Response to Abiotic Stresses. Agronomy 2024, 14, 1237. [Google Scholar] [CrossRef]
- Bagnato, L.; Tosato, E.; Gurrieri, L.; Trost, P.; Forlani, G.; Sparla, F. Arabidopsis thaliana Sucrose Phosphate Synthase A2 Affects Carbon Partitioning and Drought Response. Biology 2023, 5, 685. [Google Scholar] [CrossRef]
- Park, J.Y.; Canam, T.; Kang, K.Y.; Unda, F.; Mansfield, S.D. Sucrose phosphate synthase expression influences poplar phenology. Tree Physiol. 2009, 7, 937–946. [Google Scholar] [CrossRef]
- Tu, T.Q.; Do, P.T.; Van Nguyen, D.; Pham, N.T.T.; Nguyen, T.T.; Chu, M.H. The columbamine O-methyltransferase gene (CoOMT) is capable of increasing alkaloid content in transgenic tobacco plants. Mol. Biol. Rep. 2022, 49, 2667–2675. [Google Scholar] [CrossRef] [PubMed]
- Li, Q.; Jin, C.; Wang, G.; Ji, J.; Guan, C.; Li, X. Enhancement of endogenous SA accumulation improves poor-nutrition stress tolerance in transgenic tobacco plants overexpressing a SA-binding protein gene. Plant Sci. 2020, 292, 110384. [Google Scholar] [CrossRef]
- Liu, L.; Gan, Y.; Luo, J.; Li, J.; Zheng, X.; Gong, H.; Liu, X.; Deng, L.; Zhao, G.; Wu, H. QTL mapping reveals candidate genes for main agronomic traits in Luffa based on a high-resolution genetic map. Front. Plant Sci. 2022, 13, 1069618. [Google Scholar] [CrossRef] [PubMed]
- Zhang, H.; Wang, H.; Yi, H.; Zhai, W.; Wang, G.; Fu, Q. Transcriptome profiling of Cucumis melo fruit development and ripening. Hortic. Res. 2016, 3, 16014. [Google Scholar] [CrossRef] [PubMed]
- Cheng, H.; Kong, W.; Tang, T.; Ren, K.; Zhang, K.; Wei, H.; Lin, T. Identification of Key Gene Networks Controlling Soluble Sugar and Organic Acid Metabolism During Oriental Melon Fruit Development by Integrated Analysis of Metabolic and Transcriptomic Analyses. Front. Plant Sci. 2022, 13, 830517. [Google Scholar] [CrossRef]
- Tamura, K.; Stecher, G.; Kumar, S. MEGA11: Molecular Evolutionary Genetics Analysis Version 11. Mol. Biol. Evol. 2021, 38, 3022–3027. [Google Scholar] [CrossRef]
- Chen, C.; Wu, Y.; Li, J.; Wang, X.; Zeng, Z.; Xu, J.; Liu, Y.; Feng, J.; Chen, H.; He, Y.; et al. TBtools-II: A “one for all, all for one” bioinformatics platform for biological big-data mining. Mol. Plant. 2023, 16, 1733–1742. [Google Scholar] [CrossRef]
- Chou, K.C.; Shen, H.B. Plant-mPLoc: A top-down strategy to augment the power for predicting plant protein subcellular localization. PLoS ONE 2010, 5, e11335. [Google Scholar] [CrossRef]
- Chou, K.C.; Shen, H.B. Cell-PLoc: A package of web-servers for predicting subcellular localization of proteins in various organisms. Nat Protoc. 2008, 3, 153–162. [Google Scholar] [CrossRef]
- Chou, K.C.; Shen, H.B. Large-Scale Plant Protein Subcellular Location Prediction. J. Cell Biochem. 2007, 100, 665–678. [Google Scholar] [CrossRef]
- Chou, K.C. Using amphiphilic pseudo amino acid composition to predict enzyme subfamily classes. Bioinformatics 2005, 21, 10–19. [Google Scholar] [CrossRef] [PubMed]
- Chou, K.C.; Shen, H.B. Ensemble classifier for protein folding pattern recognition. Bioinformatics 2006, 22, 1717–1722. [Google Scholar]
- Lescot, M.; Déhais, P.; Thijs, G.; Marchal, K.; Moreau, Y.; Van de Peer, Y.; Rouzé, P.; Rombauts, S. PlantCARE, a Database of Plant Cis-Acting Regulatory Elements and a Portal to Tools for in Silico Analysis of Promoter Sequences. Nucleic Acids Res. 2002, 30, 325–327. [Google Scholar] [CrossRef] [PubMed]
- Tian, X.; Zou, H.; Xiao, Q.; Xin, H.; Zhu, L.; Li, Y.; Ma, B.; Cui, N.; Ruan, Y.L.; Ma, F.; et al. Uptake of glucose from the rhizosphere, mediated by apple MdHT1.2 regulates carbohydrate allocation. Plant Physiol. 2023, 15, 221. [Google Scholar] [CrossRef] [PubMed]
- Du, H.; Wang, N.L.; Xiong, L.Z. Determination of superoxide dismutase (SOD) activity in rice. Bio-101 2018, 101, e1010162. [Google Scholar] [CrossRef]
- Aebi, H. Catalase in vitro. Methods Enzymol. 1984, 105, 121–126. [Google Scholar]
- Kunchur, G.; Reddy, B.V.; Pandit, M.W. Correlation between stability of a protein and its dipeptide composition: A novel approach for predicting in vivo stability of a protein from its primary sequence. Protein Eng. 1990, 2, 155–161. [Google Scholar]
- Atsushi, I. Thermostability and Aliphatic Index of Globular Proteins. J. Biochem. 1980, 6, 1895–1898. [Google Scholar]
- Waterhouse, A.; Bertoni, M.; Bienert, S.; Studer, G.; Tauriello, G.; Gumienny, R.; Heer, F.T.; de Beer, T.A.P.; Rempfer, C.; Bordoli, L.; et al. SWISS-MODEL: Homology modelling of protein structures and complexes. Nucleic Acids Res. 2018, 46, W296–W303. [Google Scholar] [CrossRef]
- Bienert, S.; Waterhouse, A.; de Beer, T.A.P.; Tauriello, G.; Studer, G.; Bordoli, L.; Schwede, T. The SWISS-MODEL Repository-new features and functionality. Nucleic Acids Res. 2017, 45, D313–D319. [Google Scholar] [CrossRef]
- Studer, G.; Tauriello, G.; Bienert, S.; Biasini, M.; Johner, N.; Schwede, T. ProMod3—A versatile homology modelling toolbox. PLoS Comput. Biol. 2021, 1, e1008667. [Google Scholar] [CrossRef] [PubMed]
- Studer, G.; Rempfer, C.; Waterhouse, A.M.; Gumienny, R.; Haas, J.; Schwede, T. QMEANDisCo—Distance constraints applied on model quality estimation. Bioinformatics 2020, 36, 1765–1771. [Google Scholar] [CrossRef] [PubMed]
- Bertoni, M.; Kiefer, F.; Biasini, M.; Bordoli, L.; Schwede, T. Modeling protein quaternary structure of homo- and hetero-oligomers beyond binary interactions by homology. Sci. Rep. 2017, 7, 10480. [Google Scholar] [CrossRef]
- Braun, D.M. Phloem Loading and Unloading of Sucrose: What a Long, Strange Trip from Source to Sink. Annu. Rev. Plant. Bio. 2022, 1, 553–584. [Google Scholar] [CrossRef]
- Miret, J.A.; Griffiths, C.A.; Paul, M.J. Sucrose homeostasis: Mechanisms and opportunity in crop yield improvement. J. Plant. Physiol. 2024, 294, 154188. [Google Scholar] [CrossRef]
- Hu, L.P.; Zhang, F.; Song, S.H.; Tang, X.W.; Hui, X.; Liu, G.M.; Yaqin, W.; He, H.J. Genome-wide identification, characterization, and expression analysis of the SWEET gene family in cucumber. J. Integr. Agric. 2017, 7, 1486–1501. [Google Scholar] [CrossRef]
- Shah, I.H.; Jinhui, W.; Li, X.; Hameed, M.K.; Manzoor, M.A.; Li, P.; Zhang, Y.; Niu, Q.; Chang, L. Exploring the role of nitrogen and potassium in photosynthesis implications for sugar: Accumulation and translocation in horticultural crops. Sci. Hort. 2024, 327, 112832. [Google Scholar] [CrossRef]
- Yang, J.; Zhang, J.; Wang, Z.; Zhu, Q. Activities of starch hydrolytic enzymes and sucrose-phosphate synthase in the stems of rice subjected to water stress during grain filling. J. Exp. Bot. 2001, 364, 2169–2179. [Google Scholar] [CrossRef]
- Zhang, X.M.; Wang, W.; Du, L.Q.; Xie, J.H.; Yao, Y.L.; Sun, G.M. Expression patterns, activities and carbohydrate-metabolizing regulation of sucrose phosphate synthase, sucrose synthase and neutral invertase in pineapple fruit during development and ripening. Int. J. Mol. Sci. 2012, 8, 9460–9477. [Google Scholar] [CrossRef]
- Anur, R.M.; Mufithah, N.; Sawitri, W.D.; Sakakibara, H.; Sugiharto, B. Overexpression of Sucrose Phosphate Synthase Enhanced Sucrose Content and Biomass Production in Transgenic Sugarcane. Plants 2020, 2, 200. [Google Scholar] [CrossRef]
- Hu, J.; Duan, Y.; Hu, J.; Zhang, S.; Li, G. Phylogenetic and expression analysis of the sucrose synthase and sucrose phosphate synthase gene family in potatoes. Metabolites 2024, 14, 70. [Google Scholar] [CrossRef] [PubMed]
- Langenkämper, G.; Fung, R.W.; Newcomb, R.D.; Atkinson, R.G.; Gardner, R.C.; MacRae, E.A. Sucrose phosphate synthase genes in plants belong to three different families. Mol. Evol. 2002, 54, 322–332. [Google Scholar] [CrossRef] [PubMed]
- Castleden, C.K.; Aoki, N.; Gillespie, V.J.; MacRae, E.A.; Quick, W.P.; Buchner, P.; Foyer, C.H.; Furbank, R.T.; Lunn, J.E. Evolution and function of the sucrose-phosphate synthase gene families in wheat and other grasses. Plant Physiol. 2004, 135, 1753–1764. [Google Scholar] [CrossRef]
- Duan, Y.; Yang, L.; Zhu, H.; Zhou, J.; Sun, H.; Gong, H. Structure and expression analysis of sucrose phosphate synthase, sucrose synthase and invertase gene families in Solanum lycopersicum. Int. J. Mol. Sci. 2021, 22, 4698. [Google Scholar] [CrossRef]
- Niazi, R.; Parveen, G.; Noman, M.; Mukhtar, N.; Hadayat, N.; Sami, A.; Khaliq, B.; Shrestha, J.; Ullah, I. Comparative expression analysis of sucrose phosphate synthase gene family in a low and high sucrose Pakistani sugarcane cultivars. PeerJ 2023, 11, e15832. [Google Scholar] [CrossRef]
- Wu, J.Y.; Chen, M.; Yao, Y.L. Progress of plant sucrose phosphate synthase (SPS) gene. Mol. Plant Breed. 2022, 20, 2597–2606. [Google Scholar]
- Wang, Q.; Yin, X.; Chen, Q.; Xiang, N.; Sun, X.; Yang, Y.; Yang, Y. Genome-wide survey indicates diverse physiological roles of the turnip (Brassica rapa var. rapa) calcium-dependent protein kinase genes. Sci. Rep. 2017, 1, 15803. [Google Scholar] [CrossRef] [PubMed]
- Zhu, H.; Liu, J.; Wen, Q.; Chen, M.; Wang, B.; Zhang, Q.; Xue, Z. De novo sequencing and analysis of the transcriptome during the browning of fresh-cut Luffa cylindrica ‘Fusi-3’ fruits. PLoS ONE 2017, 12, e0187117. [Google Scholar] [CrossRef]
- Liu, J.; Wang, Y.; Peng, L.; Chen, M.; Ye, X.; Li, Y.; Li, Z.; Wen, Q.; Zhu, H. Genome-wide identification of the cyclic nucleotide-gated ion channel gene family and expression profiles under low-temperature stress in Luffa cylindrica L. Int. J. Mol. Sci. 2024, 25, 11330. [Google Scholar] [CrossRef]
- Lou, L.; Su, X.; Liu, X.; Liu, Z. Transcriptome analysis of Luffa cylindrica (L.) Roem response to infection with Cucumber mosaic virus (CMV). Gene 2020, 737, 144451. [Google Scholar] [CrossRef]
- Liu, J.; Peng, L.; Cao, C.; Bai, C.; Wang, Y.; Li, Z.; Zhu, H.; Wen, Q.; He, S. Identification of WRKY family members and characterization of the low-temperature-stress-responsive WRKY genes in luffa (Luffa cylindrica L.). Plants 2024, 13, 676. [Google Scholar] [CrossRef] [PubMed]
- Asim, M.; Hussain, Q.; Wang, X.; Sun, Y.Z.; Liu, H.; Khan, R.; Du, S.; Shi, Y.; Zhang, Y. Mathematical Modeling Reveals That Sucrose Regulates Leaf Senescence via Dynamic Sugar Signaling Pathways. Int. J. Mol. Sci. 2022, 23, 6498. [Google Scholar] [CrossRef] [PubMed]
- Migicovsky, Z.; Yeats, T.H.; Watts, S.; Song, J.; Forney, C.F.; Burgher-MacLellan, K.; Somers, D.J.; Gong, Y.; Zhang, Z.; Vrebalov, J.; et al. Apple Ripening Is Controlled by a NAC Transcription Factor. Front. Genet. 2021, 12, 671300. [Google Scholar] [CrossRef] [PubMed]
- Khan, M.; Dahro, B.; Wang, Y.; Wang, M.; Xiao, W.; Qu, J.; Zeng, Y.; Fang, T.; Xiao, P.; Xu, X.; et al. The transcription factor ERF110 promotes cold tolerance by directly regulating sugar and sterol biosynthesis in citrus. Plant J. 2024, 119, 2385–2401. [Google Scholar] [CrossRef]
- Yu, D.; Li, X.; Li, Y.; Ali, F.; Li, F.; Wang, Z. Dynamic roles and intricate mechanisms of ethylene in epidermal hair development in Arabidopsis and cotton. New Phytol. 2022, 234, 375–391. [Google Scholar] [CrossRef]
- Liu, C.; Chen, X.; Ma, P.; Zhang, S.; Zeng, C.; Jiang, X.; Wang, W. Ethylene Responsive Factor MeERF72 Negatively Regulates Sucrose synthase 1 Gene in Cassava. Int. J. Mol. Sci. 2018, 5, 1281. [Google Scholar] [CrossRef]
- Zi, X.; Zhou, S.; Wu, B. Alpha-Linolenic Acid Mediates Diverse Drought Responses in Maize (Zea mays L.) at Seedling and Flowering Stages. Molecules 2022, 3, 771. [Google Scholar] [CrossRef]
- Xu, Y.; Hu, W.; Song, S.; Ye, X.; Ding, Z.; Liu, J.; Wang, Z.; Li, J.; Hou, X.; Xu, B.; et al. MaDREB1F confers cold and drought stress resistance through common regulation of hormone synthesis and protectant metabolite contents in banana. Hortic. Res. 2023, 10, uhac275. [Google Scholar] [CrossRef]
- Chen, G.; Lian, W.; Geng, A.; Wang, Y.; Liu, M.; Zhang, Y.; Wang, X. pOsHAK1:OsSUT1 promotes sugar transport and enhances drought tolerance in rice. Int. J. Mol. Sci. 2024, 25, 2158. [Google Scholar] [CrossRef]


Disclaimer/Publisher’s Note: The statements, opinions and data contained in all publications are solely those of the individual author(s) and contributor(s) and not of MDPI and/or the editor(s). MDPI and/or the editor(s) disclaim responsibility for any injury to people or property resulting from any ideas, methods, instructions or products referred to in the content. |
© 2025 by the authors. Licensee MDPI, Basel, Switzerland. This article is an open access article distributed under the terms and conditions of the Creative Commons Attribution (CC BY) license (https://creativecommons.org/licenses/by/4.0/).