Abstract
Efficient nitrogen management is key to maximizing production and minimizing the environmental impact of horticultural crops. This study analyses the effect of different doses of nitrogen on the development of broccoli (Brassica oleracea var. italica) (cultivar Parthenon), processing tomato (Solanum lycopersicum) (cultivar H1015), and processing pepper (Capsicum annuum) (cultivar Ramonete Lamuyo) in open fields in Extremadura and evaluates rapid and efficient methods for diagnosing their nutritional status. Trials were carried out at the La Orden Experimental Farm (CICYTEX) with different nitrogen fertilization rates. The N doses were 0–60–120–180 kg N/ha for peppers in 2020 and 2021 and 0–200–300 kg N/ha for 2022. For broccoli, the N doses were 0–100–200–300 kg N/ha in 2020 and 0–200–300 kg N/ha for 2022. For tomatoes, the N doses were 0–100–200–300 kg N/ha in 2021 and 0–200–350 kg N/ha for 2022. The following three indicators were compared: chlorophyll content measured with optical sensors, petiole sap nitrate concentration, and the nitrogen nutrition index (NNI). The results indicate that chlorophyll measurement is not suitable for broccoli due to the characteristics of its leaves, but is useful for tomatoes and peppers, providing a quick and non-destructive diagnosis. Nitrate concentration in sap, although more laborious and destructive, was found to be effective in discriminating nutritional status in the three species. However, the NNI did not prove to be a good reference method in open field conditions. These results highlight the importance of adapting nutrient monitoring strategies to the crop and management conditions, contributing to a more efficient use of nitrogen and a reduction in the environmental impact of nitrate leaching.
1. Introduction
The area of pepper, tomato, and broccoli crops cultivated in Extremadura amounts to 31,335 ha (23,508 ha tomato, 5240 ha broccoli, and 608 ha pepper) [1], representing 94% of the area of vegetables produced in the region. Processing tomato is the main crop in terms of surface area, followed by broccoli, asparagus, and pepper. Therefore, it is the main economic engine of the region.
Market competition and the intervention of intermediaries mean very tight profit margins for farmers, who want to ensure the maximum production of their crops. This often means over-fertilization in order to avoid production losses. In addition, the low nitrogen uptake efficiency of horticulture crops [2] and over-irrigation [3] cause pollution by nitrate leaching into the groundwater of intensive agricultural areas. An increasing number of cultivated areas are being classified as nitrate vulnerable zones [4].
Optimal nitrogen (N) management requires that the rate and timing of available N matches the N demand of crops [5,6]. In addition, adjusting the fertilizer dose to the specific needs of the crop represents a significant economic benefit for farmers [7]. The nitrogen cycle is complex and depends on a balance between inputs, outputs, and chemical transformations that varies with agro-climatic conditions. A fertilization plan adapted to the crop uptake rate would be optimal but very difficult to achieve as it would require accurate real-time quantification of all the processes involved. An effective approach to managing a fertilization plan is to accurately and rapidly assess the N status of the crop in the field [8,9,10].
There are different ways to assess the nutritional status of crops. The traditional method of foliar analysis consists of quantifying the concentration of nutrients in plant leaf tissues. This method has been widely used as a reference tool in agricultural management because of its ability to provide detailed and accurate information on the nutritional composition of crops. The main advantages of foliar analysis are its accuracy and reliability as it allows direct quantification of nutrient levels in the plant, providing information on possible deficiencies or imbalances. It also serves as a basis for calibrating other diagnostic techniques, such as rapid sensor-based methods. However, foliar analysis has significant limitations. It is a destructive method that requires the collection of plant samples, and it is relatively slow and laborious to implement because it involves laboratory analysis, which delays decision making in the field. In addition, results can vary greatly depending on factors such as the time of sampling, the age of the plant, and environmental conditions, making interpretation difficult. Despite these challenges, foliar analysis remains a valuable tool, particularly for long-term studies or as a benchmark for validating faster, non-destructive methods.
Other options include rapid methods. Hyperspectral image analysis or multispectral sensors have been used by some authors to determine the nutritional status of horticultural crops [11,12], or even to make comparisons with different vegetation indices [13]. Optical sensors are also used to indirectly determine the nutritional status of crops [14] by measuring leaf reflectance, which provides a measure of chlorophyll content. It is a very interesting method because it is fast and non-destructive. Chlorophyll content is closely related to N content [9,15,16]. Another method is to measure the nitrate concentration in sap extracted from the petioles of the plant. This is performed using ion-selective electrode devices. Nitrate is a mobile element in the plant and is concentrated to a higher degree in the petioles, therefore providing instant information on the N mobilized by the crop. It is important to evaluate this measure under the climatic and crop management conditions of the area where the crop is grown, as factors such as species, growing conditions, and the timing of N fertilizer application affect leaf N content [17]. Both types of measurement can contribute to improved horticulture crop N management [18]. However, little information is available on these techniques for analyzing the nutritional status of these crops under open field conditions. These rapid methods need to be validated with theoretical models linking crop N uptake and plant growth dynamics, yield component formation, soil N supply, and climatic conditions, as well as critical N concentration [19]. In addition to soil and plant monitoring devices, there are studies that present other alternatives to mitigate nitrogen pollution, such as predictive models [20].
The critical nitrogen curve (CNC) is a reference tool used to evaluate the N nutritional status of a crop. This curve provides information about the minimum N concentration in the plant that is required to achieve the highest biomass production throughout the productive cycle [21]. The CNC has been extensively studied in different conditions and for different crops such as rice [22], processing pepper, processing tomato, lettuce [23], broccoli [24], artichoke, carrot, cauliflower, chard, Chinese cabbage, early potato, leek, lettuce, onion, red cabbage, romanesco, and spinach [25]. Employing the CNC as a reference, the nutritional nitrogen index (NNI) can subsequently be obtained. The NNI is calculated as the ratio between the actual N content in the plant and the critical content defined by the CNC. NNI values below 1 indicate a N deficiency, while higher values reflect an excess. However, the practical application of the CNC and the NNI requires specific data for local conditions and varieties, and continuous validation against faster methods such as the chlorophyll index or petiole sap nitrate concentration. Therefore, it is important to study these concepts with the variety of crops and the conditions of each location so that they can be used as a reference to check the accuracy of other quicker and easier methods such as those based on petiole sap nitrate concentration or chlorophyll index measurements.
One aspect to bear in mind is the difficulty of interpreting the results of different diagnostic methods. Although the immediate goal is to determine the nutritional status of the crop, the ultimate goal is to obtain the optimum nutritional status of the crop to maximize production.
The aims of this work are as follows: (i) to develop a rapid method for monitoring the nutritional status for open field processing tomato, processing pepper and broccoli; (ii) to analyze the NNI reference method; (iii) to verify that these methods are able to detect differences in N nutritional status in processing tomato, processing pepper, and broccoli crops; and (iv) to propose methods of interpretation.
2. Materials and Methods
2.1. Field Experiment Descriptions
Several field trials were carried out at the experimental farm of Finca La Orden (CICYTEX, Badajoz, Spain, 38°51′24.10″ N, 6°40′2.5″ W, datum WGS84), representing the intensive horticultural industry of the area. The trials involved three seasons of processing pepper (Capsicum annuum L. cv. Ramonete Lamuyo) (2020, 2021, and 2022), two seasons of broccoli (Brassica oleraceae cv. Parthenon) (2020 and 2022), and two seasons of processing tomato (Solanum lycopersicon cv. H1015) (2021 and 2022). All trials consisted of 4 N treatments and 4 replicates, resulting in 16 plots, except for the 2022 field experiments of the three crops which involved 3 treatments with 4 replicates (12 plots). The nitrogen source for establishing the different treatments was simple liquid fertilizer with a nitrogen content of 20% (ammoniacal nitrogen 10% and nitric nitrogen 10%). Each elemental plot was 12 × 6 m and included 6 beds, separated by 1.5 m. Fertigation was employed, with the irrigation lines placed in the middle of the bed. The distance between two consecutive drip lines was 1.5 m, and there was 0.3 m between emitters within the line. The discharge flow rate of the emitters was 1.1 L/h. In the last campaign, the N3 treatment was not implemented because the treatments in the last campaign were focused on the calibration and validation of a fertilization model, which was the subject of another study with common objectives. In addition, with the treatments established in the last campaign, we were able to generate differences in the nutritional status of the crops.
The processing pepper was transplanted in staggered rows, with a plant spacing of 0.40 m in each row. The broccoli was transplanted both years in paired rows with a distance between plants of 0.25 m. The processing tomato was transplanted in a single line with plant spacing of 0.25 m. As can be seen in Table 1, the dataset includes the transplanting and harvesting dates, the resulting plant density, and the N fertilizer doses for each treatment and trial.

Table 1.
Transplanting and harvesting dates, plant density, and the nitrogen (N) fertilizer doses for each treatment and field trial.
Meteorological data was obtained from the nearest station in the Extremadura irrigation advisory network (REDAREX), which is located on the farm itself.
The soil is Alfisol [26], with a loamy texture (19.4% clay, 40.4% sand, and 40.2% slime), pH of 7, low organic matter content (0.62%), high bulk density (1.41 g/cm3), and low cation exchange capacity (9.41 meq/100 g). Initial soil mineral N content (N-NO3 and N-NH4) was determined just before transplanting in the top 0.20 m and from 0.20 to 0.40 m. The climate is Mediterranean, with a dry season from June to September. Average annual precipitation is 500 mm, 80% of which is concentrated from October to May.
2.2. Crop Yield and Dry Matter Production
To quantify crop yield, we took samples from a strip of three meters of plants in the center of each plot. The harvest was then carried out manually, according to specific criteria for each crop. Peppers were harvested in several stages, picking the fruit once it had reached the required size. Broccoli was harvested using the same criteria as peppers, while tomatoes were harvested all at once, grouping the production as is customary in the area.
At each harvest, the fruits were weighed, and the yield per hectare was extrapolated from the harvested area.
Measurement of seasonal aerial crop dry matter (DM) was carried out after sampling 4 plants/plot at the end of the crop cycle. Plants were split into leaves, flowers, stems, and fruits, weighed separately, and then dried in a dryer at 65 °C to a constant weight. Total dry weight was calculated as the sum of the weight of the four organs and then referred to kg/ha, considering the planting density [27].
2.3. Critical Nitrogen Curve (CNC)
The CNCs used for the processing pepper and processing tomato were taken from the literature, while that for broccoli was developed using data from the trials undertaken for the present study. The critical N concentration was determined as proposed by Greenwood et al. and Justes et al. [21,28].
In all cases, the CNC was calculated to find the critical amount of N uptake (Ncrit, the minimum amount of N uptake by the crop for the maximum dry matter production (DMP)). Ncrit was calculated using the following equation:
for a crop biomass higher than 1 t of DMP ha−1 [29], where ‘a’ represents the N concentration in the dry biomass when DMP = 1 t ha−1, and ‘b’ is a statistical parameter governing the slope of the relationship.
Ncrit = a × DMP(−b)
2.4. Nutritional Nitrogen Index (NNI)
The NNI provides a measure of crop N status at a given time [30] and was calculated based on the CNC of each crop.
The NNI values for each treatment at each biomass sampling date were determined as follows:
where Nact is the actual plant %N and Ncrit is the critical plant %N [30] (Equation (1)). NNI values close to 1 indicate that, at that date, the crop had a N supply that was neither limiting nor excessive. NNI values > 1 indicate N excess, whereas NNI values < 1 indicate N deficiency [16].
NNI = Nact/Ncrit
2.5. Nutritional Status Indicators
2.5.1. Leaf Nitrogen Content
Leaf samples were taken from four plants every two weeks and then dried in an oven at 65 °C. Once dried, each sample was ground until it was homogeneous and in powder form. Once the sample was ready for analysis, the %N in the leaves was analyzed using a Eurovector EA3000 elemental analyser (Eurovector Srl, Pavia, Italy).
2.5.2. Chlorophyll Content
Measurements were carried out with a MC-100 device (Apogge Instruments Inc., Logan, UT, USA). This optical sensor estimates the chlorophyll content by means of the ratio between transmittance in the red (653 nm) and near-infrared (931 nm) wavelengths.
The sampling period started 21 days after transplanting, when the plants were well-established and had fully developed leaves for the measurements. Each final datum is the average of the measurements made on 10 plants per plot and 1 leaf per plant. These measurements were taken weekly between 08:00 a.m. and 10:00 a.m. The measurements were made on the youngest fully developed and illuminated leaves, between the edge and the vein. The measurement obtained is expressed as the chlorophyll content index (CCI).
2.5.3. Petiole Sap Nitrate [NO3−]
The petioles of the youngest fully developed leaves were taken from 10 plants per plot, except in the processing pepper crop where 15 had to be collected because the nitrate concentration in the sap was lower. The sampling was carried out between 08:00 and 10:00 a.m., once every two weeks. The petioles from each plot were placed in a sealed plastic bag, with the air extracted from the bag. The petioles were crushed to break their cells and release the sap. Subsequently, one drop of sap was measured using a LAQUAtwin ion-selective electrode system LAQUAtwin (Horiba, Kyoto, Japan) for nitrate. The results were expressed in ppm NO3−.
3. Results
3.1. Growing Conditions
Over the three years of the trial, the average monthly maximum temperature ranged from 13.6 to 38.4 °C, and the average minimum ranged from 4.3 to 18.3 °C. As shown in Table 2, the warmest months were July in 2020 and 2022, and August in 2021. The warmest year was 2022, with an average maximum temperature of 38.4 °C in July. The year 2022 saw both the driest summer and the rainiest month, December (174 mm).
Table 2.
Climate data for 2020, 2021, and 2022, based on each season’s crop cycle.
Figure 1 shows the daily evolution of the mean temperature recorded during the 2020, 2021, and 2022 campaigns. A clear seasonal trend can be observed, with a progressive increase in temperature until reaching a maximum during the months of July and August, followed by a decrease towards the end of the year. In comparative terms, 2022 saw slightly higher temperatures during the seasonal rise (June–July), while in the decline phase (October–November), temperatures in 2021 were on average lower than in the other two years.
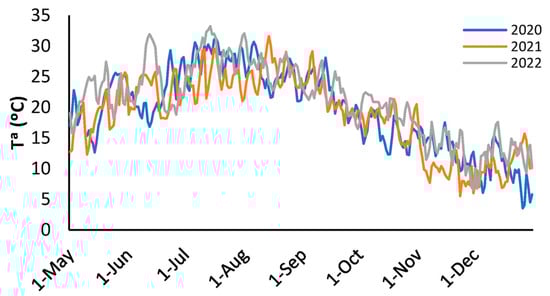
Figure 1.
Daily evolution of the mean temperature during the 2020, 2021, and 2022 campaigns.
3.2. Crop Yield and Dry Matter Production
Figure 2 summarizes the effect of nitrogen fertilization treatments on the total above-ground biomass production and fresh commercial yield of bell peppers for industry, broccoli, and tomatoes for industry, evaluated in different growing seasons. For processing pepper (Figure 2a,d), a clear response to nitrogen fertilization was observed in both dry matter and fresh yield, with progressive increases up to the treatment with 180 kg N/ha (years 2020 and 2021), and up to 300 kg N/ha in 2022. The latter campaign showed the highest production values, which can be attributed to more favorable weather conditions and the higher dose-range evaluated.
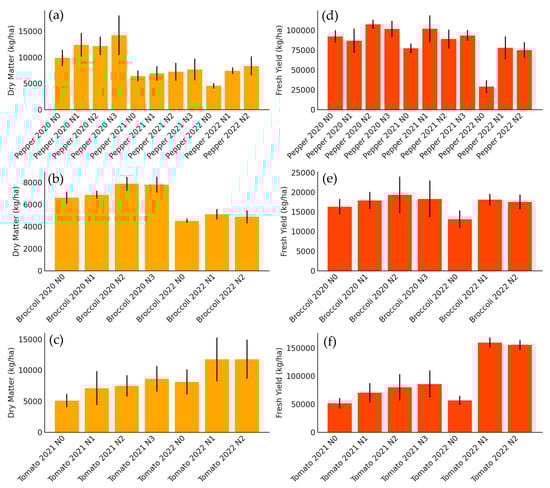
Figure 2.
Bar chart showing total aerial dry matter (kg/ha) differentiated by treatments and seasons for (a) processing peppers, (b) broccoli, and (c) tomatoes, and fresh yield (kg/ha) differentiated by treatments and seasons for (d) processing peppers, (e) broccoli, and (f) tomatoes. Each bar represents a specific treatment within each crop.
In the case of broccoli (Figure 2b,e), increases in biomass and yield with nitrogen fertilization were more moderate and less consistent between seasons. In 2020, significant increases were recorded up to 200 kg N/ha, while in 2022, although there was also a positive effect of fertilization, the differences between treatments were less marked. This could be related to environmental factors that limited growth in that season. It is noteworthy that, despite its high N demand, the commercial yield of broccoli showed less sensitivity to the fertilization levels evaluated compared to the other crops. Ref. [31] states that broccoli genotypes and nutritional protocols play an important role in nitrogen use efficiency in this crop. Therefore, maintaining the same plant genetics and nutritional protocols in both years and in the present trials results in no significant differences in nitrogen use efficiency.
For processing tomato (Figure 2c,f) the results indicate a marked response to increased N doses in both seasons. In particular, the 2022 season showed a very significant increase in yield and dry matter with the 350 kg N/ha dose, far exceeding the lower treatments. This greater sensitivity of tomatoes to nitrogen fertilization reflects their high nutritional requirements under high-production conditions. In addition, the high correlation between accumulated biomass and fresh yield suggests that proper N management can optimize both parameters simultaneously.
In summary, a number of significant differences were observed between the campaigns in terms of the biomass production and fresh yield of the three crops evaluated. These variations can be attributed to the contrasting climatic conditions characteristic of outdoor crops, particularly the higher average temperature and lower accumulated precipitation during the summer of 2022 (Table 2 and Figure 1). In that particular campaign, both tomato and pepper exhibited a more pronounced response to elevated nitrogen (N) doses. This phenomenon may be attributed to enhanced soil N mineralization [32] and increased water consumption. Conversely, during the years 2020 and 2021, the presence of more moderate conditions may have imposed partial limitations on the response to fertilization. Furthermore, factors such as the number of treatments applied and the different experimental strategy in 2022 (aimed at validating fertilization models) may also have influenced the magnitude of the responses observed. This underscores the necessity of incorporating the climatic and agronomic context when assessing the efficacy of nitrogen management strategies.
3.3. CNC for Processing Pepper, Broccoli, and Processing Tomato
The CNC used for processing peppers () was developed by Vadillo et al. [7], while that used for processing tomatoes [33] was developed with crops from several seasons and different locations, where DMP stands for dry matter production, and %Ncrit is the percentage of critical nitrogen. Some of the experiments for the development of the CNC for processing tomatoes were carried out in the same location as the one used in this work and so it is considered suitable for our conditions.
The CNC presented in Figure 3 for broccoli was developed using data from the 2020 and 2022 seasons (in the process of being published).
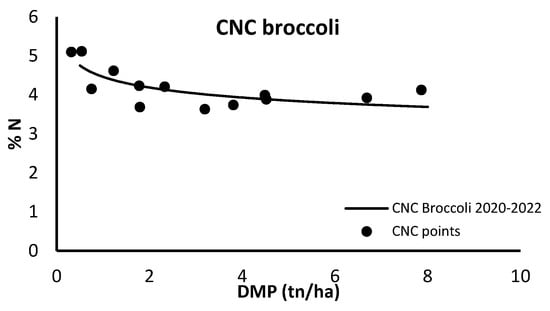
Figure 3.
Critical N curve (CNC) for broccoli grown in open field using total crop N content and total dry matter production (DMP).
3.4. Nutritional Nitrogen Index (NNI) Seasonal Evolution
3.4.1. Processing Pepper
As evidenced by Figure 4a–c, the NNI demonstrated the capacity to differentiate between treatments, with the most significant disparities observed in 2022. When referenced against the line NNI = 1 in 2020, N0 was situated below and N3 above, while the two intermediate treatments showed an approximation to the reference line. In 2021, N0 and N1 exhibited the closest approximation to the reference line, with N3 positioned slightly above. Notably, the most pronounced differences were observed in 2022, with the extreme treatments markedly below and above the reference line, and N1 above it. This final year, characterized by the generation of the most substantial gradients, witnessed NNI values ranging from 0.4 to 1.5, a notable increase from the previous years.
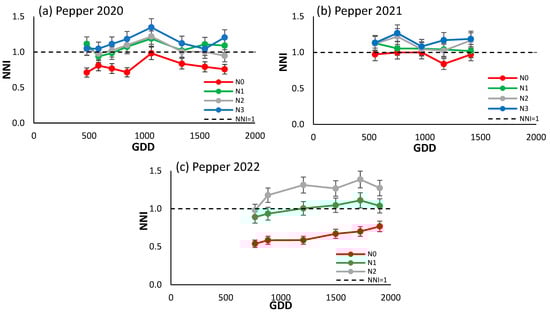
Figure 4.
Evolution of the NNI of processing peppers (a) in 2020, (b) in 2021, and (c) in 2022 for the different N treatments. Each point is the average of the 4 elementary plots of each treatment.
3.4.2. Broccoli
The trend of the NNI of both seasons for broccoli (Figure 5a,b) was similar, tending overall to decrease over the course of the season. The most notable difference between the two campaigns is that in 2020 the NNI value fell after around 1100 growing degree days (GDDs), while in 2022 the opposite happened. The values of the NNI varied between 0.8 and 1.3. In both seasons, the values of the treatments increased according to the N inputs, but there were no major differences between them. It is observed that N3 exhibited a marginal increase above the reference line in 2020, while N0 demonstrated a decrease below it in 2022, in the central portion of the growing season.
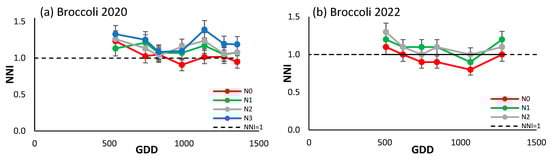
Figure 5.
Evolution of the NNI of (a) broccoli in 2020, and (b) broccoli in 2022 for the different N treatments. Each point is the average of the 4 elementary plots of each treatment.
3.4.3. Processing Tomato
The NNI of the processing tomato showed an increasing trend over the two-year period considered (Figure 6a,b), indicating a possible alternative source of N, such as strong mineralization, since even the N0 treatment saw an increase in the NNI values throughout the cycle. In the 2022 season, the difference between N0 and the other treatments was more marked than in 2021, when N0 and N1 had similar values, with a clear differentiation from the N2 and N3 treatments which were above the reference line.
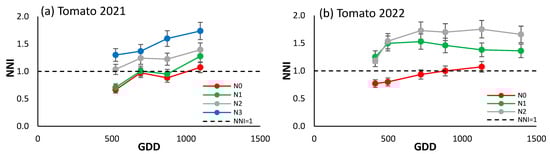
Figure 6.
Evolution of the NNI of (a) processing tomato in 2021, and (b) processing tomato in 2022 for the different N treatments. Each point is the average of the 4 elementary plots of each treatment.
3.5. Seasonal Trend of Nutritional Indexes
3.5.1. Processing Pepper
The foliar nitrogen concentration (Figure 7c,f,i) had a decreasing trend in 2020 and 2021, and only in 2022 was a stabilization period between 1000 and 2000 GDDs observed. Although the N0 treatment had lower values than the other treatments in the three years, there were only significant differences at two points in time in 2020 and 2021, although in 2022 clear differences were observed between the three treatments from the second sampling date.
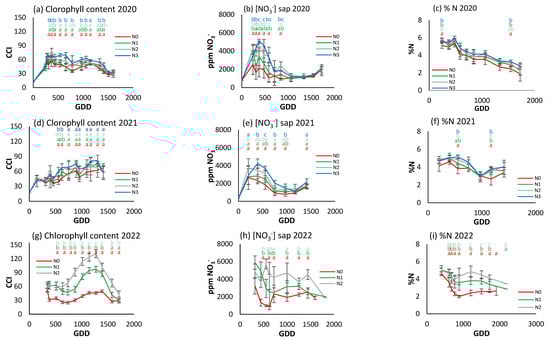
Figure 7.
For the different N treatments of processing pepper, the evolution of leaf reflectance expressed as the chlorophyll content index (CCI) in (a) 2020, (d) 2021, and (g) 2022; nitrate concentration in sap expressed in ppm NO3− in (b) 2020, (e) 2021, and (h) 2022; and leaf nitrogen content (%N) in (c) 2020, (f) 2021, and (i) 2022. Letters indicate whether there are significant differences between treatments in each sample where p ≤ 0.05. Samples where no letters appear indicate no significant differences between treatments. Each point is the average of the 4 elementary plots of each treatment.
Figure 7a,d,g show a different CCI trend along the crop cycle in each season. In 2020, the CCI increased to about 300 GDDs and then decreased over the rest of the cycle (Figure 7a). In 2021, it showed an upward trend over the course of the cycle (Figure 7d), and in 2022 it increased to about 1200 GDDs and then decreased rapidly (Figure 7g). In the first year of the trial, N2 and N3 had significantly higher values than in the other two. The differences were most obvious at around 500–1500 GDDs, with N2 and N3 reaching around 70–80 CCI, while N0 had values around 40–50 CCI. From 1500 GDDs, the CCI tended to decrease for all treatments. In the second year, N3 continued to show higher CCI values, although with no statistically significant differences until around 750 GDDs. The CCI values showed a gradual increase up to 1200 GDDs, with a slight decrease at the end of the cycle. In 2022, the difference between treatments was much more pronounced (Figure 7g). N2 had a much higher CCI than N1 and N0, reaching 120 CCI compared to 50 and 70 CCI for N0 and N1, respectively.
The trend of the petiole sap nitrate concentration was similar in 2020 and 2021 (Figure 7b,e), increasing to about 350 GDDs and then decreasing progressively. In 2022 (Figure 7h), although there was an initial increase similar to that of the previous two years, it was followed by a more stable period and a decrease from 1500 GDDs. In 2020, peak petiole sap nitrate concentration was between 4000 and 5000 ppm NO3−, and more pronounced in N2 and N3. After the peak (around 500 GDDs), nitrate levels fell and remained stable. The N2 and N3 treatments had significantly higher values than N0 and N1 for most of the cycle. In 2021, nitrate concentration increased to 500 GDDs and then decreased. In general, the maximum concentrations were lower compared to 2020, with values close to 4000 ppm NO3−. N0 had the lowest values and N3 the highest, but with no significant differences between treatments throughout the cycle. In 2022 (Figure 7h), N2 had significantly higher concentrations throughout the cycle, while N0 continued to have the lowest.
Comparing the three indicators, it can be seen that in 2020 the rapid indicators were more effective in discriminating between treatments, while in 2022, with a higher gradient, all three were able to establish differences depending on the level of fertilization. However, it does not seem possible to establish reference values of optimal nutritional status in any of the three indicators, nor any other applicable criterion at three years. There does not seem to be a similar seasonal trend among the indicators.
3.5.2. Broccoli
The highest foliar N concentration (Figure 8c,f) is observed at the beginning of the cycle, but with a slight seasonal decrease to around 5% during most of the season for the fertilized treatments. There were no statistically significant differences between treatments in any case, although N0 concentrations were slightly lower than the rest throughout the season in 2022.
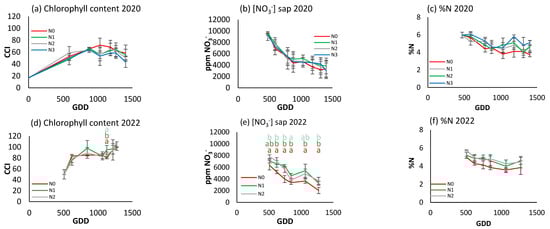
Figure 8.
For the different N treatments of broccoli, the evolution of leaf reflectance expressed as the chlorophyll content index (CCI) in (a) 2020 and (d) 2022; petiole sap nitrate concentration expressed in ppm NO3− in (b) 2020 and (e) 2022; and leaf nitrogen content (%N) in (c) 2020 and (f) 2022. Letters indicate whether there are significant differences between treatments in each sample where p ≤ 0.05. Samples where no letters appear indicate no significant differences between treatments. Each point is the average of the 4 elementary plots of each treatment.
The CCI in both years (Figure 8a,d) showed a similar trend, although this measure was not able to differentiate the fertilization treatments in either year. In both years, there was a stabilization period between 600 and 1200 GDDs, but it was different each year (at around 60 in 2020 and 80 in 2022).
A similar seasonal trend is also observed for petiole sap nitrate concentration in both years (Figure 8b,e), with values decreasing over the cycle from 9000 ppm NO3− in 2020 to 7000 ppm NO3− in 2021. No significant differences between treatments were observed in 2020, but in 2022 there were significant differences, with N0 lower than the other two treatments.
Of the three indicators used, petiole sap nitrate concentration was able to detect statistically significant differences between fertilizer levels in all samples in 2022. However, the CCI was only able to do so on one sampling day of the same year, while the leaf N concentration technique failed to show any significant differences.
3.5.3. Processing Tomato
As Figure 9c,f illustrate, foliar N concentration exhibited a modest increase at the cycle’s inception, up to 200 GDDs, followed by a gradual decline until its conclusion. Interestingly, no stabilization period can be observed. In 2021, N0 and N1 maintained similar values, both below N2 and N3, which marked the upper limit at 500 GDDs. In 2022, N0 diverged from the other two treatments at 300 GDDs, with N2 attaining the highest value, although it was closely followed by N1. No significant differences were observed between treatments in any of the samples.
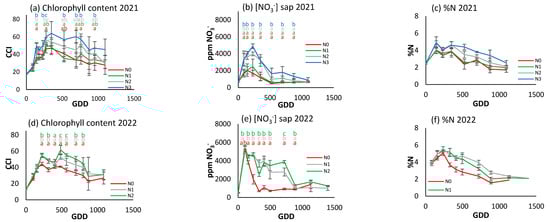
Figure 9.
For the different N treatments of processing tomato, the evolution of leaf reflectance expressed as the chlorophyll content index (CCI) in (a) 2021 and (d) 2022; petiole sap nitrate concentration expressed in ppm NO3− in (b) 2021 and (e) 2022; and leaf nitrogen content (%N) in (c) 2021 and (f) 2022. Letters indicate whether there are significant differences between treatments in each sample where p ≤ 0.05. Samples where no letters appear indicate no significant differences between treatments. Each point is the average of the 4 elementary plots of each treatment.
Figure 9a and Figure 8d show the CCI evolution in processing tomatoes in 2021 and 2022. All treatments show a similar initial increase, but from about 200 GDDs there is a progressive decrease, with differences established between treatments according to the level of fertilization. In 2021, N3 had significantly higher CCI values throughout most of the growth cycle, reaching over 60 CCI around 500 GDDs, while N0 only reached about 40 CCI. In 2022, N2 had the highest values, reaching 60 CCI, while N0 reached 45 CCI around 500 GDDs. Both years present very similar data.
A marked increase in the petiole sap nitrate concentration was observed in both seasons (Figure 9b,e), peaking at approximately 250 GDDs. This was followed by a sharp decrease in 2021 in all treatments, which was even more marked in 2022 for the N0 treatment. The decline in the cases of N1 and N2 in 2022 was delayed to 900 GDDs. In 2021, during the initial peak, disparities between the two most and least fertilized treatments could be discerned. However, this was not the case in 2022, although significant variations between treatments were observed on nearly all sampling days in both years. The maximum value was recorded at 5000 ppm NO3− in both years.
In contrast to the patterns observed in processing pepper and broccoli, a degree of congruence emerged in the developmental trajectories of foliar N concentration and CCI in processing tomato, though not in petiole sap nitrate concentration. Differences between treatments were more evident when using the CCI and sap nitrate concentration methods, but less so with foliar N concentration.
3.6. Comparative NNI with Rapid Measures
3.6.1. Processing Pepper
Figure 10 shows the relationship between CCI and petiole sap nitrate concentration and the corresponding NNI for each sampling date. In the first two years, the coefficients of determination were found to be negligible for both indices. However, at 71 days after transplanting (DATs) with CCI and at 38 and 45 DATs with petiole sap nitrate concentration, the coefficients of determination were found to be significant. In 2022, the R2 values ranged between 0.66 and 0.89, and were found to be significant on all sampling days. With petiole sap nitrate concentration, in this last year significant correlations were only obtained on two dates.
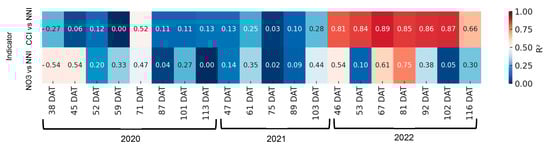
Figure 10.
Heatmap showing the coefficient of determination (R2) between rapid nitrogen status indicators—chlorophyll content index (CCI) and petiole sap nitrate concentration ([NO3−])—and the nitrogen nutrition index (NNI) across different days after transplanting (DATs) in processing pepper. Each cell represents the R2 value for the corresponding indicator and sampling date. Stronger correlations (R2 closer to 1) are shown in warmer colors.
As can be seen in Figure 11, the fitted line changes throughout the cycle and therefore the value corresponding to NNI = 1, which would be the reference for the optimal nitrogen nutritional status, also changes.
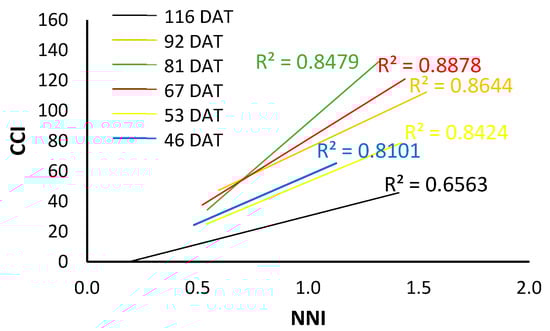
Figure 11.
Trend lines between CCI and NNI differentiated by days after transplanting for the 2022 processing pepper crop.
3.6.2. Broccoli
As demonstrated in Figure 12, there was an absence of a satisfactory correlation between the rapid indices of nitrogen nutritional status and the NNI in 2020 and 2022. It was only in the 40 days period that a significant linear coefficient of determination was observed between the NNI and the petiole sap nitrate concentration.
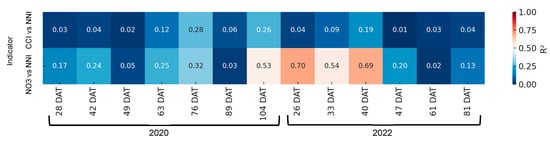
Figure 12.
Heatmap showing the coefficient of determination (R2) between rapid nitrogen status indicators—chlorophyll content index (CCI) and petiole sap nitrate concentration ([NO3−])—and the nitrogen nutrition index (NNI) across different days after transplanting (DATs) in broccoli. Each cell represents the R2 value for the corresponding indicator and sampling date. Stronger correlations (R2 closer to 1) are shown in warmer colors.
3.6.3. Processing Tomato
In the context of processing tomatoes (Figure 13), a more substantial fit was observed between the NNI and petiole sap nitrate concentration than the carbon-nitrogen CCI. The correlations between the CCI and NNI were found to be significant on two days in 2022, but between petiole sap nitrate concentration and NNI they were found to be significant on five days in both 2021 and 2022. In a manner analogous to that observed in processing pepper, the fitting equations, despite being significant, exhibited changes at each date without demonstrating a progressive pattern over time.
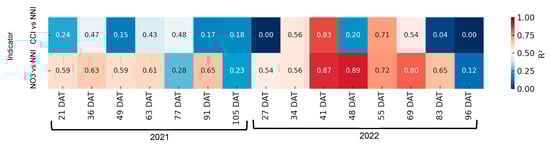
Figure 13.
Heatmap showing the coefficient of determination (R2) between rapid nitrogen status indicators—chlorophyll content index (CCI) and petiole sap nitrate concentration ([NO3−])—and the nitrogen nutrition index (NNI) across different days after transplanting (DATs) in processing tomato. Each cell represents the R2 value for the corresponding indicator and sampling date. Stronger correlations (R2 closer to 1) are shown in warmer colors.
4. Discussion
A fundamental step in evaluating the efficacy of an indicator of nutritional status for a specific element is to demonstrate its capacity to differentiate between plants with varying levels of that element available to them. This paper uses data from a total of seven field trials with three vegetable species, processing pepper, broccoli, and processing tomato, grown outdoors. In each trial, different levels of N fertilization were applied, always including a non-fertilized treatment, with a range between 0 and 300 kg/ha N units applied to processing peppers and broccoli and between 0 and 350 kg/ha to processing tomatoes. As Figure 2 shows, there were differences between treatments in total aerial DMP and yield, but the large variability between years is remarkable. This last point must be considered to understand the results since the evaluation of the nutritional status of a plant does not consider other aspects that may have acted, such as limiting factors in production.
4.1. Were the Indicators Able to Discriminate Between Treatments?
Although the values obtained in this work do not coincide very closely with those published in the literature, we support the conclusion, as Ulissi et al. [34] indicate, that the sap test has good potential for the management of N fertilization in processing tomatoes, and in our case other horticultural crops, taking into account the variability resulting from variety, location, etc.
Chlorophyll meters have been successfully used to assess the N status of vegetable crops in numerous studies with species such as fresh tomato, processing tomato, melon, cucumber, processing pepper, or potato [35]. In addition, Padilla et al. [14] compares different chlorophyll measurement devices such as SPAD-502 m, atLEAF sensor, and MC-100 m, stating that MC-100 (the device used in this study) is the most accurate device for pepper. On the other hand, Gianquinto et al. [13] conducts a study of different vegetative indices to determine the nitrogen nutritional status of processing tomato crops, obtaining good results with some of them. Furthermore, Basyouni et al. [36] compares vegetative indices and chlorophyll meters to determine the nitrogen nutritional status of potted poinsettias and claims to obtain better correlations with chlorophyll meters.
Farneselli et al. [37] reported a strong relationship between chlorophyll content and crop N content in processing tomato. These findings were supported by Güler & Büyük [38]. Ulissi et al. [34] found results contrary to those mentioned for processing and fresh tomatoes, where the weak relationships between chlorophyll content values and crop N contents were probably caused by the narrow range of crop N contents evaluated. Vadillo et al. [19] obtained a priori results similar to those of Ulissi et al. [34]. However, they also conducted a literature review, with data from other studies in similar conditions being added to their work. They found that their data, which initially had no correlation between the variables, comprised a cloud of points with a small range of values. When these were added to those existing in the literature then agreement was found with the relationships given by the other authors. On the other hand, Padilla et al. [16] also relied on the NNI as a reference method for obtaining threshold values for rapid measurements to monitor nitrogen nutritional status in tomato crops.
For broccoli, no logical values related to the nutritional status of the crop were observed. These findings differ greatly from those obtained by Ambrosino et al. and Vidigal et al. [39,40] as neither group found significant differences in the chlorophyll content measured with a SPAD meter at different levels of nitrogen fertilization. Vidigal et al. [40] obtained a correlation between SPAD measurements and N content of R2 = 0.93. This discrepancy with the literature may be due to nitrogen availability in the more restrictive treatments due to mineralization in the first months of cultivation or to the dark green leaf color of this crop. There is consistent evidence that chlorophyll meters can become partially saturated at high N and chlorophyll contents [41,42]. Therefore, the color of the broccoli leaves may saturate the chlorophyll meter.
According to Schröder et al. [43], chlorophyll meter readings are poor indicators of N excess because not all absorbed N is converted to chlorophyll, but N deficiency is better reflected by chlorophyll content. Padilla et al. [35] state that the use of absolute sufficiency values for crop N management with optical sensors may be affected by cultivar and growing conditions. In addition, El-Shikha et al. [44] found that differences between different N treatments were less apparent in chlorophyll content measurements than in petiole sap nitrate concentration data. However, the speed and repeatability of data collection with chlorophyll meters and the ability to cover more control points or more area in a short time with these non-destructive measurements, which indicate the deficiencies of many more horticultural crops compared to other methods, should be appreciated.
4.2. Interpretation of the Results
Hochmuth [45] found nitrate sufficiency values in pepper petiole sap of 1400–1600 ppm NO3-N, which are in line with those published by Rodríguez et al. [46] (1300–1750 ppm NO3-N), depending on the phenological stage of the crop. However, the data obtained in the present study are much lower, with values of (1300–1800 ppm NO3−) 300–400 ppm NO3-N in the first two campaigns and (2300 ppm NO3−) 520 ppm NO3-N in the third. This suggests that the growing conditions or nutrient management may have influenced nitrate availability and uptake. Despite the discrepancy with the reference values, previous studies have shown that factors such as cultivar [34], temperature, or solar radiation [47] can cause variations in the sap nitrate concentration.
For broccoli, Hochmuth [45] reported values between 800 and 1000 ppm NO3-N, while in this study even lower concentrations were obtained, with a value of 450 ppm NO3-N (2000 ppm NO3−). This contrasts with the literature and suggests that the crop may have been exposed to conditions that limited nitrate uptake. However, a decrease in nitrate concentration was observed throughout the growth cycle in both seasons (Figure 14), which is consistent with Villeneuve et al. [48], who indicated that nitrate in the sap of broccoli stalks is highly sensitive to variations in fertilization. In this case, it is confirmed that sap nitrate was useful for differentiating the nutritional status of the plant, while the chlorophyll meter did not show the same sensitivity.
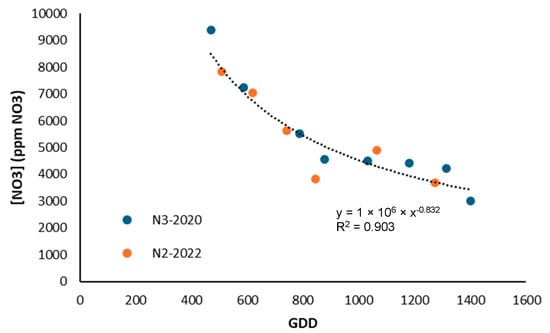
Figure 14.
Evolution of nitrate content in broccoli sap for treatments with higher nitrogen supply in 2020 and 2022.
Except for the first part of the crop cycle (from 300 to 500 GDDs) of processing tomatoes, where the values were very high, we obtained a sap nitrate concentration between 600 and 1000 ppm NO3− in the N0 treatment, which obtained DMP limits (unpublished work) with respect to the rest of the treatments. Farneselli et al. [37] found values between 400 and 900 ppm NO3-N depending on the crop stage for processing tomatoes, while Hochmuth [45] carried out a comprehensive study on many crops in which he set the reference values for processing tomatoes at 600–800 ppm NO3-N. These values reported in the literature are not consistent with the results of this study as they are even higher than those obtained in this work in the nitrogen deficient treatments.
Sufficiency values for different rapid measurements have been established in other works using the NNI as a reference. For example, Padilla et al. [16,49] used it as a reference for reflectance and the authors of [18] used it for nitrate in sap. It has been reported in various studies that plants are in optimal nutritional conditions when NNI = 1 [30,50,51]. Therefore, correlations are established between NNI and the values obtained from the rapid measurements by creating models that, when the variable NNI = 1, give us the theoretical sufficiency values of these rapid measurements. Although the literature suggests that the NNI is a useful tool, it is not universal for all nutrients. Its main limitation is that it focuses mainly on N and does not always reflect other nutrient deficiencies and other factors that may also affect plant nutrition and limit plant growth. This is particularly a problem in the field as there are many factors involved.
Rodríguez et al. [46] obtained a good R2 between NNI and petiole sap nitrate concentration in pepper in the flowering, fruit set, and harvesting phases, while the R2 values were lower for the initial vegetative phase. This is also evident from our results, in that not only did we obtain poor correlations at the beginning of the vegetative phase of peppers, but also we obtained poor correlations in the last samplings of the trials, coinciding with the harvesting season. The same was true for both broccoli and processing tomatoes in all the seasons of this study. We do not consider these results to be very negative, as we do not believe that it is very important to obtain good results at the end of the crop cycle. What is of interest is the early stages, when there is still time to modify fertilizer inputs. Bélanger et al. [52] obtained R2 values of 0.29–0.62 for three different periods for two potato varieties, which are in line with the data of this work for the different crops. However, we consider that these values are too poor to reliably determine fixed thresholds that would indicate discrepancies between nutritional states. Furthermore, given the large inter-annual variability of the data obtained, it is risky to suggest thresholds to growers. However, it would be very interesting to use these methods following the approach proposed by Tremblay et al. [53], who suggested that the use of N requirement indicators for N recommendations should be based on a relative assessment of crop conditions based on a well-fertilized reference plot. This strategy would probably reduce the significant effect of year and sampling procedures on the absolute measurements.
5. Conclusions
This study demonstrated that petiole sap nitrate concentration ([NO3−]) and chlorophyll content are effective indicators for assessing nitrogen (N) status in open-field processing tomato and processing pepper crops. For tomatoes, petiole sap nitrate concentrations between 600 and 1000 ppm NO3− and chlorophyll content index (CCI) values of 40–60 were associated with optimal N nutrition, while peppers showed optimal ranges of 1300–1800 ppm NO3− and CCI values of 50–80, depending on the growth stage. Chlorophyll measurements provided rapid, non-destructive assessments, but were less reliable for broccoli due to leaf characteristics that saturate optical sensors. In contrast, petiole sap nitrate analysis effectively discriminated N status across all three crops, including broccoli, where values below 2000 ppm NO3− indicated potential deficiencies.
The nitrogen nutrition index (NNI) proved inconsistent as a reference method under field conditions, likely due to variability in environmental factors and crop-specific responses. For practical applications, we recommend the following:
These findings underscore the importance of selecting crop-specific tools to optimize N management, reduce environmental impacts, and improve fertilization efficiency in horticultural systems.
Author Contributions
Conceptualization, J.M.V., C.C. and H.P.; methodology, C.C. and H.P.; formal analysis, J.M.V., C.C., S.M. and H.P.; investigation, J.M.V., C.C., S.M. and H.P.; data curation, J.M.V.; writing—original draft preparation, J.M.V.; writing—review and editing, C.C., S.M. and H.P.; supervision, C.C. and H.P.; project administration, C.C.; funding acquisition, C.C. All authors have read and agreed to the published version of the manuscript.
Funding
This work was supported by the Ministry of Science, Innovation and Universities: Project RTI2018-095298; Project PDC2022-133936-I00.
Data Availability Statement
The original contributions presented in this study are included in the article. Further inquiries can be directed to the corresponding author.
Conflicts of Interest
The authors declare no conflicts of interest.
References
- MAPA. Avance de Superficies y Producciones de Cultivo 2022. In 2022 Anuario de Estadística; Ministerio de Agricultura, Pesca y Alimentación: Madrid, Spain, (In Spanish). Available online: https://www.mapa.gob.es/es/estadistica/temas/publicaciones/anuario-de-estadistica/2023/default.aspx?parte=3&capitulo=07&grupo=6&seccion=27 (accessed on 8 July 2024).
- Thompson, R.B.; Martínez-Gaitan, C.; Gallardo, M.; Giménez, C.; Fernández, M.D. Identification of Irrigation and N Management Practices That Contribute to Nitrate Leaching Loss from an Intensive Vegetable Production System by Use of a Comprehensive Survey. Agric. Water Manag. 2007, 89, 261–274. [Google Scholar] [CrossRef]
- Fereres, E.; Goldhamer, D.A.; Parsons, L.R. Irrigation Water Management of Horticultural Crops. HortScience 2003, 38, 1036–1042. [Google Scholar] [CrossRef]
- Directive 91/676/EEC. Directive 91/676/EEC of 12 December 1991 Concerning the Protection of Waters against Pollution Caused by Nitrates from Agricultural Sources. Off. J. 1991, 375, 1–8.
- Gebbers, R.; Adamchuk, V.I. Precision Agriculture and Food Security. Science 2010, 327, 828–831. [Google Scholar] [CrossRef] [PubMed]
- Meisinger, J.J.; Schepers, J.S.; Raun, W.R. Crop Nitrogen Requirement and Fertilization. Nitrogen Agric. Syst. 2015, 49, 563–612. [Google Scholar] [CrossRef]
- Vadillo, J.M.; Campillo, C.; González, V.; Prieto, H. Assessing Nitrogen Fertilization in Processing Pepper: Critical Nitrogen Curve, Yield Response, and Crop Development. Horticulturae 2024, 10, 1141. [Google Scholar] [CrossRef]
- Thompson, R.B.; Gallardo, M.; Voogt, W. Optimizing Nitrogen and Water Inputs for Greenhouse Vegetable Production. Acta Hortic. 2015, 1107, 15–29. [Google Scholar] [CrossRef]
- Padilla, F.M.; Teresa Peña-Fleitas, M.; Gallardo, M.; Thompson, R.B. Evaluation of Optical Sensor Measurements of Canopy Reflectance and of Leaf Flavonols and Chlorophyll Contents to Assess Crop Nitrogen Status of Muskmelon. Eur. J. Agron. 2014, 58, 39–52. [Google Scholar] [CrossRef]
- Fox, R.H.; Walthall, C.L. Crop Monitoring Technologies to Assess Nitrogen Status. Nitrogen Agric. Syst. 2015, 647–674. [Google Scholar] [CrossRef]
- Cerasola, V.A.; Bona, S.; Borsato, D.; Gavioli, L.; Moretti, G.; Manfrini, L.; Pennisi, G.; Orsini, F.; Buscaroli, E.; Sambo, P.; et al. Exploring Dynamic Nitrogen (N) Fertigation Guided by Multispectral Sensors: A Sustainable Optimization of N Fertilization in Processing Tomato. Sci. Hortic. 2025, 345, 114124. [Google Scholar] [CrossRef]
- Cerasola, V.A.; Orsini, F.; Pennisi, G.; Moretti, G.; Bona, S.; Mirone, F.; Verrelst, J.; Berger, K.; Gianquinto, G. Hyperspectral Imaging for Precision Nitrogen Management: A Comparative Exploration of Two Methodological Approaches to Estimate Optimal Nitrogen Rate in Processing Tomato. Smart Agric. Technol. 2025, 10, 100802. [Google Scholar] [CrossRef]
- Gianquinto, G.; Orsini, F.; Pennisi, G.; Bona, S. Sources of Variation in Assessing Canopy Reflectance of Processing Tomato by Means of Multispectral Radiometry. Sensors 2019, 19, 4730. [Google Scholar] [CrossRef] [PubMed]
- Padilla, F.M.; de Souza, R.; Peña-Fleitas, M.T.; Gallardo, M.; Giménez, C.; Thompson, R.B. Different Responses of Various Chlorophyll Meters to Increasing Nitrogen Supply in Sweet Pepper. Front. Plant Sci. 2018, 871, 01752. [Google Scholar] [CrossRef] [PubMed]
- Gianquinto, G.; Sambo, P.; Borsato, D. Determination of SPAD Threshold Values for the Optimisation of Nitrogen Supply in Processing Tomato. Acta Hortic. 2006, 700, 159–166. [Google Scholar] [CrossRef]
- Padilla, F.M.; Peña-Fleitas, M.T.; Gallardo, M.; Thompson, R.B. Threshold Values of Canopy Reflectance Indices and Chlorophyll Meter Readings for Optimal Nitrogen Nutrition of Tomato. Ann. Appl. Biol. 2015, 166, 271–285. [Google Scholar] [CrossRef]
- Goffart, J.P.; Olivier, M.; Frankinet, M. Potato Crop Nitrogen Status Assessment to Improve N Fertilization Management and Efficiency: Past–Present–Future. Potato Res. 2008, 51, 355–383. [Google Scholar] [CrossRef]
- Peña-Fleitas, M.T.; Gallardo, M.; Thompson, R.B.; Farneselli, M.; Padilla, F.M. Assessing Crop N Status of Fertigated Vegetable Crops Using Plant and Soil Monitoring Techniques. Ann. Appl. Biol. 2015, 167, 387–405. [Google Scholar] [CrossRef]
- Vadillo, J.M.; Gimenez, C.; Campillo, C.; González, V.; Prieto, M.H. Development of a Methodology to Characterize the Nitrogen Nutritional Status of Open Field Processing Tomato by Means of Fast Indicators. Acta Hortic. 2022, 1351, 89–94. [Google Scholar] [CrossRef]
- Cameira, M.D.R.; Mota, M. Nitrogen Related Diffuse Pollution from Horticulture Production—Mitigation Practices and Assessment Strategies. Horticulturae 2017, 3, 25. [Google Scholar] [CrossRef]
- Greenwood, D.J.; Lemaire, G.; Gosse, G.; Cruz, P.; Draycott, A.; Neeteson, J.J. Decline in Percentage N of C3 and C4 Crops with Increasing Plant Mass. Ann. Bot. 1990, 66, 425–436. [Google Scholar] [CrossRef]
- Ata-Ul-Karim, S.T.; Zhu, Y.; Liu, X.; Cao, Q.; Tian, Y.; Cao, W. Comparison of Different Critical Nitrogen Dilution Curves for Nitrogen Diagnosis in Rice. Sci. Rep. 2017, 7, srep42679. [Google Scholar] [CrossRef] [PubMed]
- Benincasa, P.; Guiducci, M.; Tei, F. The Nitrogen Use Efficiency: Meaning and Sources of Variation-Case Studies on Three Vegetable Crops in Central Italy. Horttechnology 2011, 21, 266–273. [Google Scholar] [CrossRef]
- Conversa, G.; Lazzizera, C.; Bonasia, A.; Elia, A. Growth, N Uptake and N Critical Dilution Curve in Broccoli Cultivars Grown under Mediterranean Conditions. Sci. Hortic. 2019, 244, 109–121. [Google Scholar] [CrossRef]
- de Paz, J.M.; Ramos, C.; Visconti, F. Critical Nitrogen Dilution Curve and Dry Matter Production Parameters for Several Mediterranean Vegetables. Sci. Hortic. 2022, 303, 111194. [Google Scholar] [CrossRef]
- Survey Staff, S. Soil Taxonomy A Basic System of Soil Classification for Making and Interpreting Soil Surveys; United States Department of Agriculture Natural Resources Conservation Service: Washington, DC, USA, 1999.
- Rodríguez, A.; Peña-Fleitas, M.T.; Gallardo, M.; de Souza, R.; Padilla, F.M.; Thompson, R.B. Sweet Pepper and Nitrogen Supply in Greenhouse Production: Critical Nitrogen Curve, Agronomic Responses and Risk of Nitrogen Loss. Eur. J. Agron. 2020, 117, 126046. [Google Scholar] [CrossRef]
- Justes, E.; Mary, B.; Meynard, J.M.; Machet, J.M.; Thelier-Huche, L. Determination of a Critical Nitrogen Dilution Curve for Winter Wheat Crops. Ann. Bot. 1994, 74, 397–407. [Google Scholar] [CrossRef]
- Sadras, V.O.; Lemaire, G. Quantifying Crop Nitrogen Status for Comparisons of Agronomic Practices and Genotypes. Field Crops Res. 2014, 164, 54–64. [Google Scholar] [CrossRef]
- Lemaire, G.; Gastal, F. N Uptake and Distribution in Plant Canopies. In Diagnosis of the Nitrogen Status in Crops; Springer: Berlin, Germany, 1997; pp. 3–43. [Google Scholar] [CrossRef]
- Garcia, G.; Treccarichi, S.; Calì, R.; Arena, D.; Tribulato, A.; Branca, F. Nitrogen Use Efficiency of Microbial and Amino Acid Treatments for Organic Broccoli (Brassica oleracea L. var. italica Plenk) Seed Production. Horticulturae 2025, 11, 253. [Google Scholar] [CrossRef]
- Miller, K.S.; Geisseler, D. Temperature Sensitivity of Nitrogen Mineralization in Agricultural Soils. Biol. Fertil. Soils 2018, 54, 853–860. [Google Scholar] [CrossRef]
- Giménez, C.; Thompson, R.B.; Prieto, M.H.; Suárez-Rey, E.; Padilla, F.M.; Gallardo, M. Adaptation of the VegSyst Model to Outdoor Conditions for Leafy Vegetables and Processing Tomato. Agric. Syst. 2019, 171, 51–64. [Google Scholar] [CrossRef]
- Ulissi, V.; Antonucci, F.; Benincasa, P.; Farneselli, M.; Tosti, G.; Guiducci, M.; Tei, F.; Costa, C.; Pallottino, F.; Pari, L.; et al. Nitrogen Concentration Estimation in Tomato Leaves by VIS-NIR Non-Destructive Spectroscopy. Sensors 2011, 11, 6411–6424. [Google Scholar] [CrossRef] [PubMed]
- Padilla, F.M.; Gallardo, M.; Peña-Fleitas, M.T.; De Souza, R.; Thompson, R.B. Proximal Optical Sensors for Nitrogen Management of Vegetable Crops: A Review. Sensors 2018, 18, 2083. [Google Scholar] [CrossRef] [PubMed]
- Basyouni, R.; Dunn, B.L.; Goad, C. Use of Nondestructive Sensors to Assess Nitrogen Status in Potted Poinsettia (Euphorbia pulcherrima L. (Willd. Ex Klotzsch)) Production. Sci. Hortic. 2015, 192, 47–53. [Google Scholar] [CrossRef]
- Farneselli, M.; Tei, F.; Simonne, E. Reliability of Petiole Sap Test for N Nutritional Status Assessing in Processing Tomato. J. Plant Nutr. 2014, 37, 270–278. [Google Scholar] [CrossRef]
- Güler, S.; Büyük, G. Relationships among Chlorophyll-Meter Reading Value, Leaf n and Yield of Cucumber and Tomatoes. Acta Hortic. 2007, 729, 307–311. [Google Scholar] [CrossRef]
- Ambrosini, V.G.; Voges, J.G.; Benevenuto, R.F.; Vilperte, V.; Silveira, M.A.; Brunetto, G.; Ogliari, J.B. Single-Head Broccoli Response to Nitrogen Application. Científica 2015, 43, 84–92. [Google Scholar] [CrossRef][Green Version]
- Vidigal, S.M.; Puiatti, M.; Lopes, I.P.D.C.; Sediyama, M.A.N. Nitrogen Content, SPAD Index and Production of Single Head Broccoli. Hortic. Bras. 2021, 39, 52–57. [Google Scholar] [CrossRef]
- Novichonok, E.V.; Novichonok, A.O.; Kurbatova, J.A.; Markovskaya, E.F. Use of the AtLEAF+ Chlorophyll Meter for a Nondestructive Estimate of Chlorophyll Content. Photosynthetica 2016, 54, 130–137. [Google Scholar] [CrossRef]
- Parry, C.; Blonquist, J.M.; Bugbee, B. In Situ Measurement of Leaf Chlorophyll Concentration: Analysis of the Optical/Absolute Relationship. Plant Cell Environ. 2014, 37, 2508–2520. [Google Scholar] [CrossRef]
- Schröder, J.J.; Neeteson, J.J.; Oenema, O.; Struik, P.C. Does the Crop or the Soil Indicate How to Save Nitrogen in Maize Production?: Reviewing the State of the Art. F. Crop. Res. 2000, 66, 151–164. [Google Scholar] [CrossRef]
- El-Shikha, D.M.; Waller, P.; Hunsaker, D.; Clarke, T.; Barnes, E. Ground-Based Remote Sensing for Assessing Water and Nitrogen Status of Broccoli. Agric. Water Manag. 2007, 92, 183–193. [Google Scholar] [CrossRef]
- Hochmuth, G.J. Efficiency Ranges for Nitrate-Nitrogen and Potassium for Vegetable Petiole Sap Quick Tests. Horttechnology 1994, 4, 218–222. [Google Scholar] [CrossRef]
- Rodríguez, A.; Peña-Fleitas, M.T.; Padilla, F.M.; Gallardo, M.; Thompson, R.B. Petiole Sap Nitrate Concentration to Assess Crop Nitrogen Status of Greenhouse Sweet Pepper. Sci. Hortic. 2021, 285, 110157. [Google Scholar] [CrossRef]
- Justes, E.; Meynard, J.M.; Mary, B.; Plénet, D. Diagnosis Using Stem Base Extract: JUBIL Method. In Diagnosis of the Nitrogen Status in Crops; Springer: Berlin, Germany, 1997; pp. 163–187. [Google Scholar] [CrossRef]
- Villeneuve, S.; Coulombe, J.; Bélec, C.; Tremblay, N. A Comparison of Sap Nitrate Test and Chlorophyll Meter for Nitrogen Status Diagnosis in Broccoli (Brassica Oleracea L. Spp. Italica). Acta Hortic. 2002, 571, 171–177. [Google Scholar] [CrossRef]
- Padilla, F.M.; Peña-Fleitas, M.T.; Gallardo, M.; Giménez, C.; Thompson, R.B. Derivation of Sufficiency Values of a Chlorophyll Meter to Estimate Cucumber Nitrogen Status and Yield. Comput. Electron. Agric. 2017, 141, 54–64. [Google Scholar] [CrossRef]
- Mistele, B.; Schmidhalter, U. Estimating the Nitrogen Nutrition Index Using Spectral Canopy Reflectance Measurements. Eur. J. Agron. 2008, 29, 184–190. [Google Scholar] [CrossRef]
- Ziadi, N.; Bélanger, G.; Claessens, A.; Lefebvre, L.; Cambouris, A.N.; Tremblay, N.; Nolin, M.C.; Parent, L.É. Determination of a Critical Nitrogen Dilution Curve for Spring Wheat. Agron. J. 2010, 102, 241–250. [Google Scholar] [CrossRef]
- Bélanger, G.; Walsh, J.R.; Richards, J.E.; Milburn, P.H.; Ziadi, N. Critical Petiole Nitrate Concentration of Two Processing Potato Cultivars in Eastern Canada. Am. J. Potato Res. 2003, 80, 251–261. [Google Scholar] [CrossRef]
- Tremblay, N.; Bélec, C.; Jenni, S.; Fortier, E.; Mellgren, R. The Dualex—A New Tool to Determine Nitrogen Sufficiency in Broccoli. Acta Hortic. 2009, 824, 121–132. [Google Scholar] [CrossRef]


Disclaimer/Publisher’s Note: The statements, opinions and data contained in all publications are solely those of the individual author(s) and contributor(s) and not of MDPI and/or the editor(s). MDPI and/or the editor(s) disclaim responsibility for any injury to people or property resulting from any ideas, methods, instructions or products referred to in the content. |
© 2025 by the authors. Licensee MDPI, Basel, Switzerland. This article is an open access article distributed under the terms and conditions of the Creative Commons Attribution (CC BY) license (https://creativecommons.org/licenses/by/4.0/).