Article

Simulation of the Number of Strawberry Transplants Produced by an Autotrophic Transplant Production Method in a Plant Factory with Artificial Lighting

1
Indoor Farm and Protected Horticulture Laboratory, Farm8 Co., Ltd., Pyeongtaek 17706, Korea
2
Department of Horticultural Science, Kyungpook National University, Daegu 41566, Korea
3
Division of Smart Horticulture, Yonam College, Cheonan 31005, Korea
4
Department of Plant Science, Seoul National University, Seoul 08826, Korea
5
Research Institute of Agriculture and Life Sciences, Seoul National University, Seoul 08826, Korea
*
Author to whom correspondence should be addressed.
Horticulturae 2020, 6(4), 63; https://doi.org/10.3390/horticulturae6040063
Submission received: 22 August 2020 / Revised: 1 October 2020 / Accepted: 2 October 2020 / Published: 6 October 2020
(This article belongs to the Section Propagation and Seeds)

Abstract

:
To verify the productivity of the autotrophic transplant production method (ATPM), a novel propagation method in a plant factory with artificial lighting for transplant production (T-PFAL), strawberry transplants were produced by the ATPM for 365 days. A total of 3497 transplants were produced by the ATPM over 365 days with nine propagules in a cultivation area of 3.6 m2 in the T-PFAL. When the simulated results were fit with the measured results, the propagation cycle timescales from planting propagules to producing the first, second, and third runner plants were 15, 27, and 43 days, respectively. The cumulative number of transplants (CNT) produced from 5, 10, and 20 initial propagules in a cultivation area of 36 m2 over 365 days was simulated by the verified program along with the propagation cycles, and these values were 27,970, 30,010, and 31,900, respectively. The simulated CNTs from nine initial propagules in 18 and 72 m2 over 365 days were 15,950 and 55,940, respectively. These results indicate that the ATPM is an appropriate propagation method to produce transplants rapidly in a T-PFAL, especially when the number of propagules or propagules is limited.

1. Introduction

Programs for the production of certified disease-free plants have been developed in major strawberry production countries to prevent the spread of diseases during the propagation and supplementation of high-quality propagules [1]. In terms of certified strawberry plants, there are several different grading systems that include nuclear transplants, elite transplants, prebasic transplants, basic transplants, and disseminative transplants under the Korean system [2]. In 2016, the required numbers of transplants for each step were 100 nuclear transplants, 4000 elite transplants, one hundred thousand prebasic transplants, two million basic transplants, and thirty-four million disseminative transplants. Higher grade transplants are grown under very strict conditions, and they are propagated under careful control. However, the low propagation rate of transplants under conventional propagation methods is a major problem for the rapid distribution of certified plants, as 40 transplants are produced from a propagule per year with conventional methods [3].
A plant factory with artificial lighting for transplant production (T-PFAL) is a thermally insulated warehouse-like structure in which disease-free transplants can be produced rapidly under a controlled environment in a protected area free from pest insects/pathogens and the disturbance of outside weather [4,5,6]. Although conventional methods can be used for upper-level transplant production in the program, e.g., elite transplants and prebasic transplants, these methods are not appropriate for use in a T-PFAL. Therefore, Chun et al. [7] developed a novel propagation method, named the autotrophic transplant production method (ATPM), for strawberry propagation in a T-PFAL. The ATPM differs from conventional methods in terms of the size of propagules. The propagules for the ATPM are smaller than those for conventional methods for propagation in a T-PFAL with multilayer propagation beds. Park et al. [8] showed that runner plants with a crown diameter of approximately 5 mm and two leaves were appropriate for use as propagules in the ATPM due to shorter propagation cycles (timescales from planting propagules to producing the first, second, and third runner plants) and greater production of transplants. Moreover, propagation cycles in the ATPM were shorter and more replicative than those in conventional methods. Runner plants produced from propagules in the ATPM were used as propagules for the subsequent propagation generation (timescale from planting a propagule to producing three runner plants from the propagule), while runner plants in the conventional methods were only used as transplants for just one propagation generation. Kubota and Kozai [9] reported that the propagation rate of transplants can be precisely controlled and predicted using modeling and simulation; however, the accuracy of predicting the number of transplants produced may be decreased after many repetitions of propagation generations. In addition, Kim et al. [10] claimed that high PPF levels promote the formation of runners and runner plants of strawberry and that the rapid propagation method with high PPF levels can be feasible for the production of vigorous transplants in a closed transplant production system.
When producing transplants using a T-PFAL, the number of transplants produced should be calculated because propagation space is more limited than in a greenhouse or field. As the required numbers of elite transplants and prebasic transplants to be produced in provincial agriculture research centers during one season are usually decided ahead of time, a T-PFAL for the ATPM could be designed based on these numbers to reduce the initial investment costs for a facility. Moreover, elite transplants and prebasic transplants should be produced from nuclear transplants that are generated by tissue culture to eliminate viruses and other pathogens [2]. In tissue culture, one meristem induces one plant because of problems with variant types, such as the hyperflowering trait, as reported by Jemmali et al. [11]; thus, the number of initial propagules is also limited. Moreover, the efficiency of the propagation and distribution system can be improved by reducing the time for dissemination of disease-free or new cultivar transplants if prebasic or basic transplants can be produced from 100 nuclear transplants per year.
To verify the productivity of strawberry propagules in the ATPM, we produced transplants by the ATPM for 365 days and compared the accumulated number of transplants to the number simulated by the program. We also evaluated strawberry transplant production by the ATPM based on the number of initial propagules and propagation area simulated by the program to predict the production of strawberry transplants and determined the required cultivation areas to produce prebasic and basic transplants from 100 nuclear transplants for a year.

2. Materials and Methods

2.1. Runner Plants Production over One Year

Nine strawberry plants (Fragaria × ananassa Duch. cv. Maehyang) were selected as initial propagules based on a crown diameter of ca. 5 mm, two compound leaves and one runner with an unfolded bract. We planted them into 150 mL containers using a 32-cell cutting plug tray (Bumnong Co. Ltd., Jeongeup, Korea) filled with commercial medium (Plant World; Nongwoo Bio Co. Ltd., Suwon, Korea). We grew them to produce runner plants (new plants produced from their propagules and grown independently) and new propagules (runner plants can be used as starting materials for propagation) for next propagation generation in the T-PFAL using ATPM for 365 days. During propagation, we arranged eight propagules in a row on a 32-cell plug tray, placed four trays on a cultivation bed (1.2 m × 0.6 m; Figure 1), and used 5 beds as propagation area in the T-PFAL. Therefore, propagation area was 3.6 m2 and the maximum number of propagules placed in the propagation area was 160 propagules in this study. Figure 1 shows a propagation process diagram of propagules in the ATPM. When crown diameter of the runner plants reached the initial crown diameter (more than 5 mm), we separated them from their propagules and measured number of days after placing initial propagules in the T-PFAL and counted cumulated number of runner plants. The separated runner plants were placed in an area for propagules on the bed and cultivated as propagules in the next propagation generation. The propagules that produced three runner plants were released from the T-PFAL. When the number of propagules in the T-PFAL exceeded the maximum number of propagules (160 propagules) that could be cultivated in the propagation area, the new propagules that were runner plants just separated from their propagules were also released from the T-PFAL. The cumulated number of propagules and runner plants released were each measured. The strawberry plants were grown in a T-PFAL with a 32 W cool white fluorescent lamp (TLD32W830RS, Philips Electronics, The Netherlands) for each bed, and the PPF level above the bed was 230 μmol∙m−2∙s−1 (Figure 1). The air temperature during the photo/dark period was maintained at 27 °C/23 °C, and the photoperiod and CO2 concentration were 16 h∙d−1 and 800 μmol∙mol−1, respectively. A closed irrigation system was applied to the plant factory used in this study, and plants were subirrigated with Yamazaki nutrient solution for strawberries (pH 6.0 and EC 0.7 dS∙m−1) [12] for 10 min once a day.

2.2. Description of the Program to Predict Production of Strawberry Transplants for the ATPM

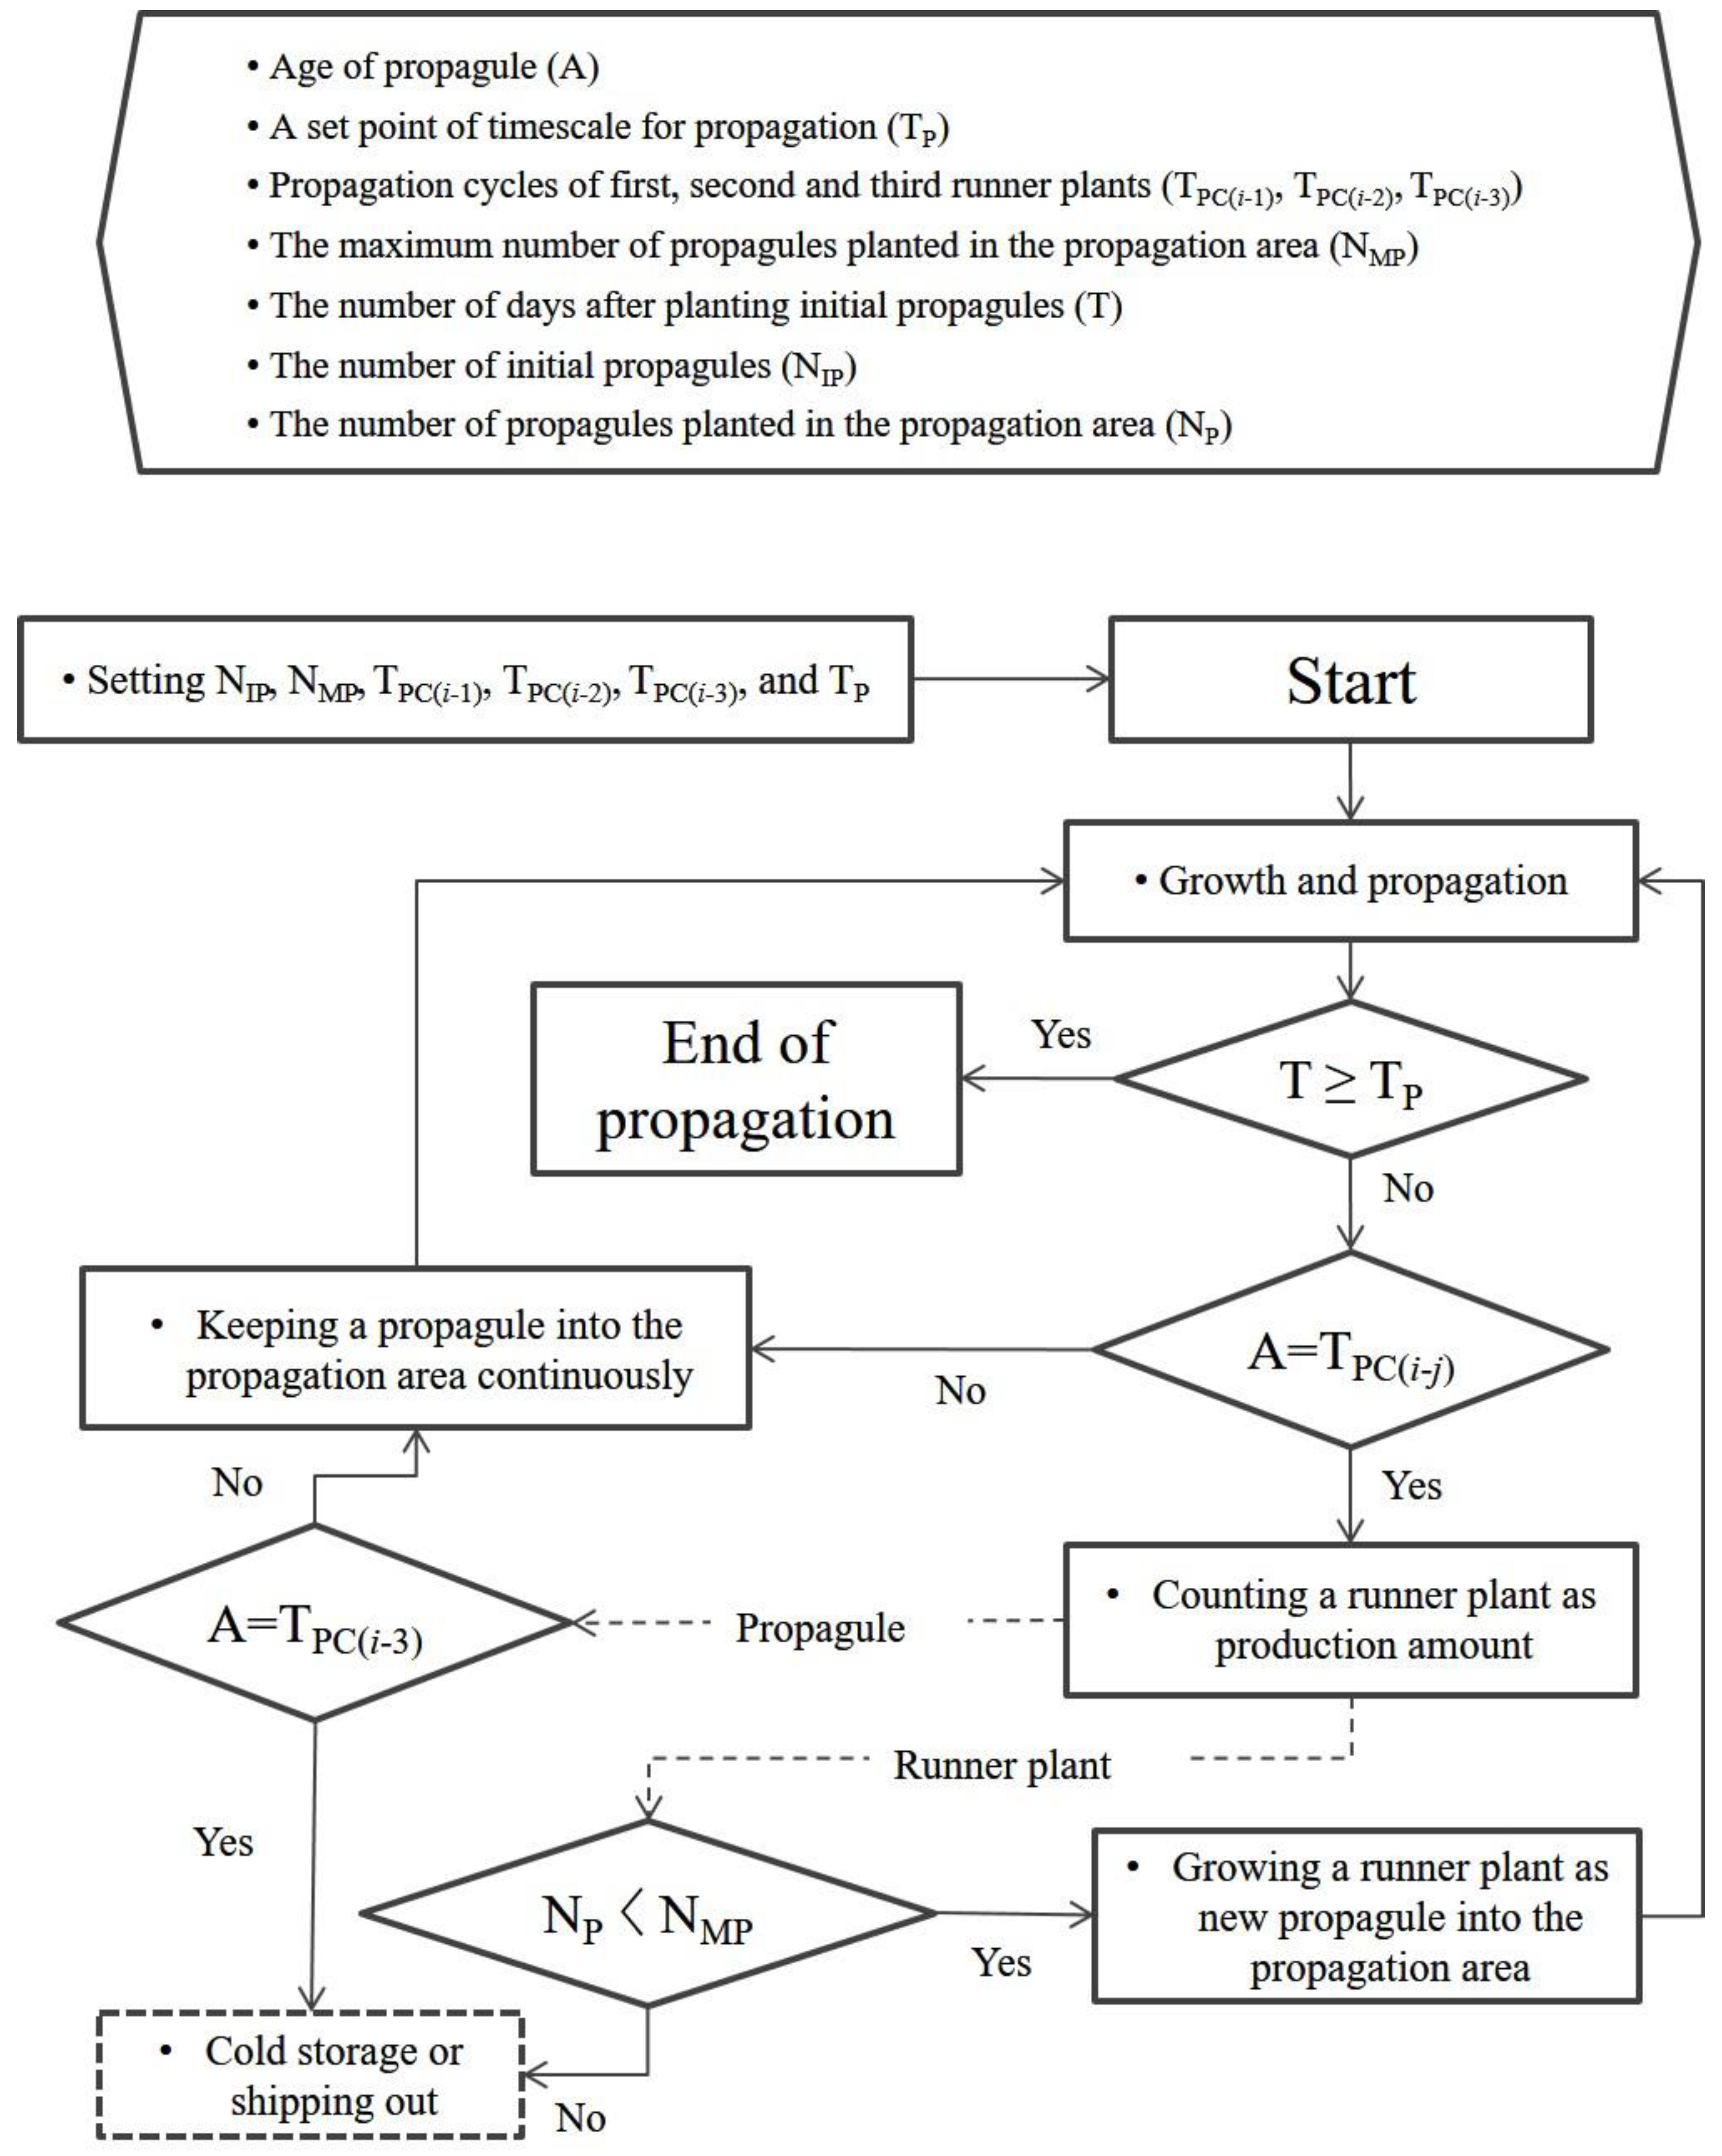
Figure 2 shows a flow chart of the program to predict the production of strawberry transplants for the ATPM. The variables in this program were propagation period (TP), propagation cycle of the first, second, and third runner plans {TPC (i−1), TPC (i−2), and TPC (i−3)}, cultivation area (maximum number of propagules placed in the cultivation area; NMP), and the initial number of propagules (NIP). These variables should be set first to run the program. First, the number of days after placing the initial propagules is compared to TP to determine when propagation should end. When an age of propagule (the number of days from a time separation from their propagules; A) is equal to TPC (i−1), TPC (i−2), or TPC (i−3), a runner plant is counted in the production amount. Then, the runner plant and its propagule are evaluated separately. When A is equal to TPC (i−3), the propagule is appraised as either a non-activated propagule and released from the propagation area, or it is appraised as an activated propagule and maintained in the propagation area for propagation. The runner plants are appraised as an activated runner plant and planted into the propagation area as new propagules when the number of propagules in the propagation area is smaller than NMP. Otherwise, they are appraised as a non-activated runner plant and released from the propagation area like non-activated propagules.
We ran the program to determine propagation cycles {TPC (i−1), TPC (i−2), and TPC (i−3)} through fitting with measured results for one year, and the results were compared to the measured results by regression analysis. The accumulated number of transplants over 365 days as affected by NIP and NMP was simulated by the program. The required propagation areas to produce prebasic (100,000 plants) from 100 nuclear transplants for a year were also determined to confirm the possibility of one-year reduction in the propagation and distribution system for domestic cultivars in Korea through the removal of elite transplants production process.

2.3. Data Analysis

We derived equations of cumulative number of runner plants produced from nine initial propagules in 3.6 m2 propagation area in a T-PFAL by the ATPM separated exponential and linear increasing sections by regression analysis using SigmaPlotTM software (Systat Software, San Jose, CA, USA). We calculated the root mean square error (RMSE) between measured and simulated results of cumulated numbers of transplants on Figure 5:
RMSE   = i = 1 n ( S i M i ) 2 n
where Si and Mi are simulated results and measured results. Regression analysis of Figure 4 was conducted using the SigmaPlotTM software to estimate the coefficient of determination by linear equation.

3. Results and Discussion

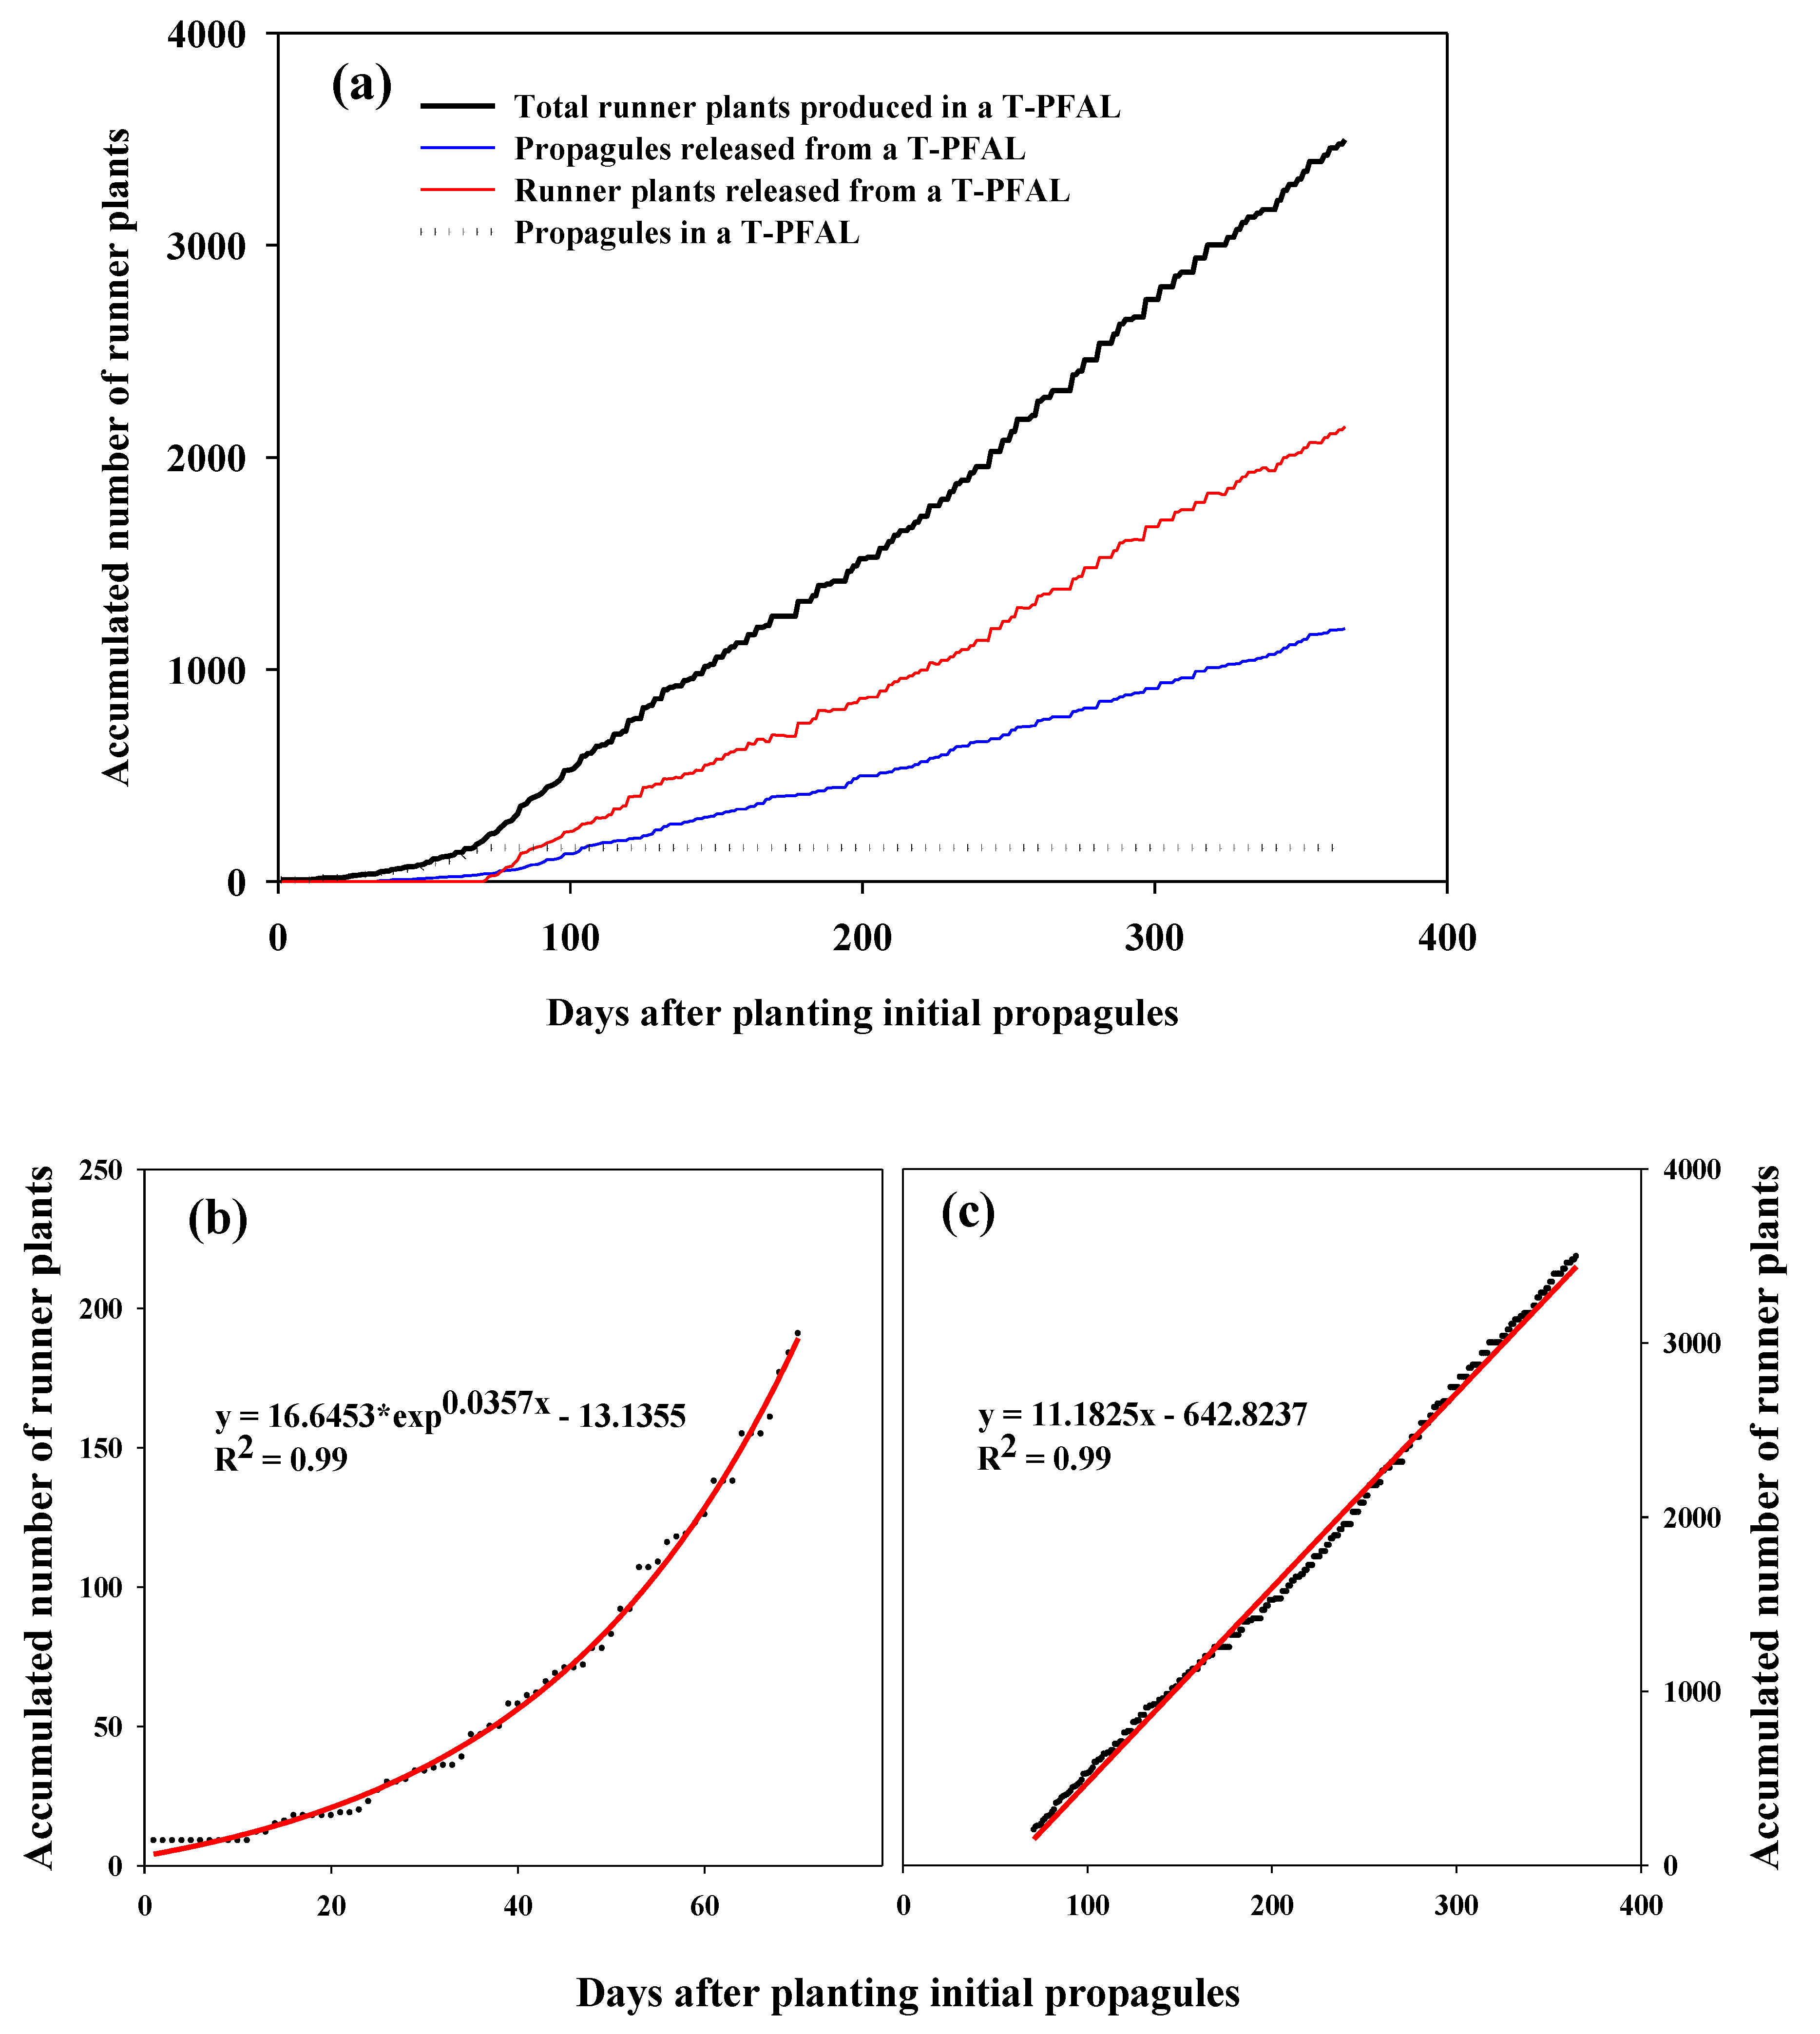
The cumulative number of transplants (CNT) produced from nine initial propagules in 3.6 m2 propagation area in a T-PFAL by the ATPM over 365 days was 3497 plants (Figure 3). This result was about ten times greater than that in the conventional methods (3). The number of transplants increased exponentially before the number of propagules planted in the propagation area (NP) reached the maximum number of propagules planted in the propagation area (NMP; y = 16.6453 e 0.0357 x 13.1355 ); however, the number increased linearly after NP reached NMP ( y = 11.1827 x 642.8237 ) . At 35 days after planting the initial propagules in the T-PFAL (DAP), propagules producing three runner plants were released from the T-PFAL. Runner plants were also released at 71 DAP due to limitations in the propagation area in the T-PFAL. The numbers of propagules and runner plants released were 1193 and 2144, respectively. Before NP reached NMP, the runner plants just separated from their propagules were used as new propagules in the next propagation generation; however, the third runner plants were used as propagules after NP reached NMP because the propagules were released after producing their third runner plant. Therefore, the number of runner plants released was approximately twice as high as the number of propagules released.
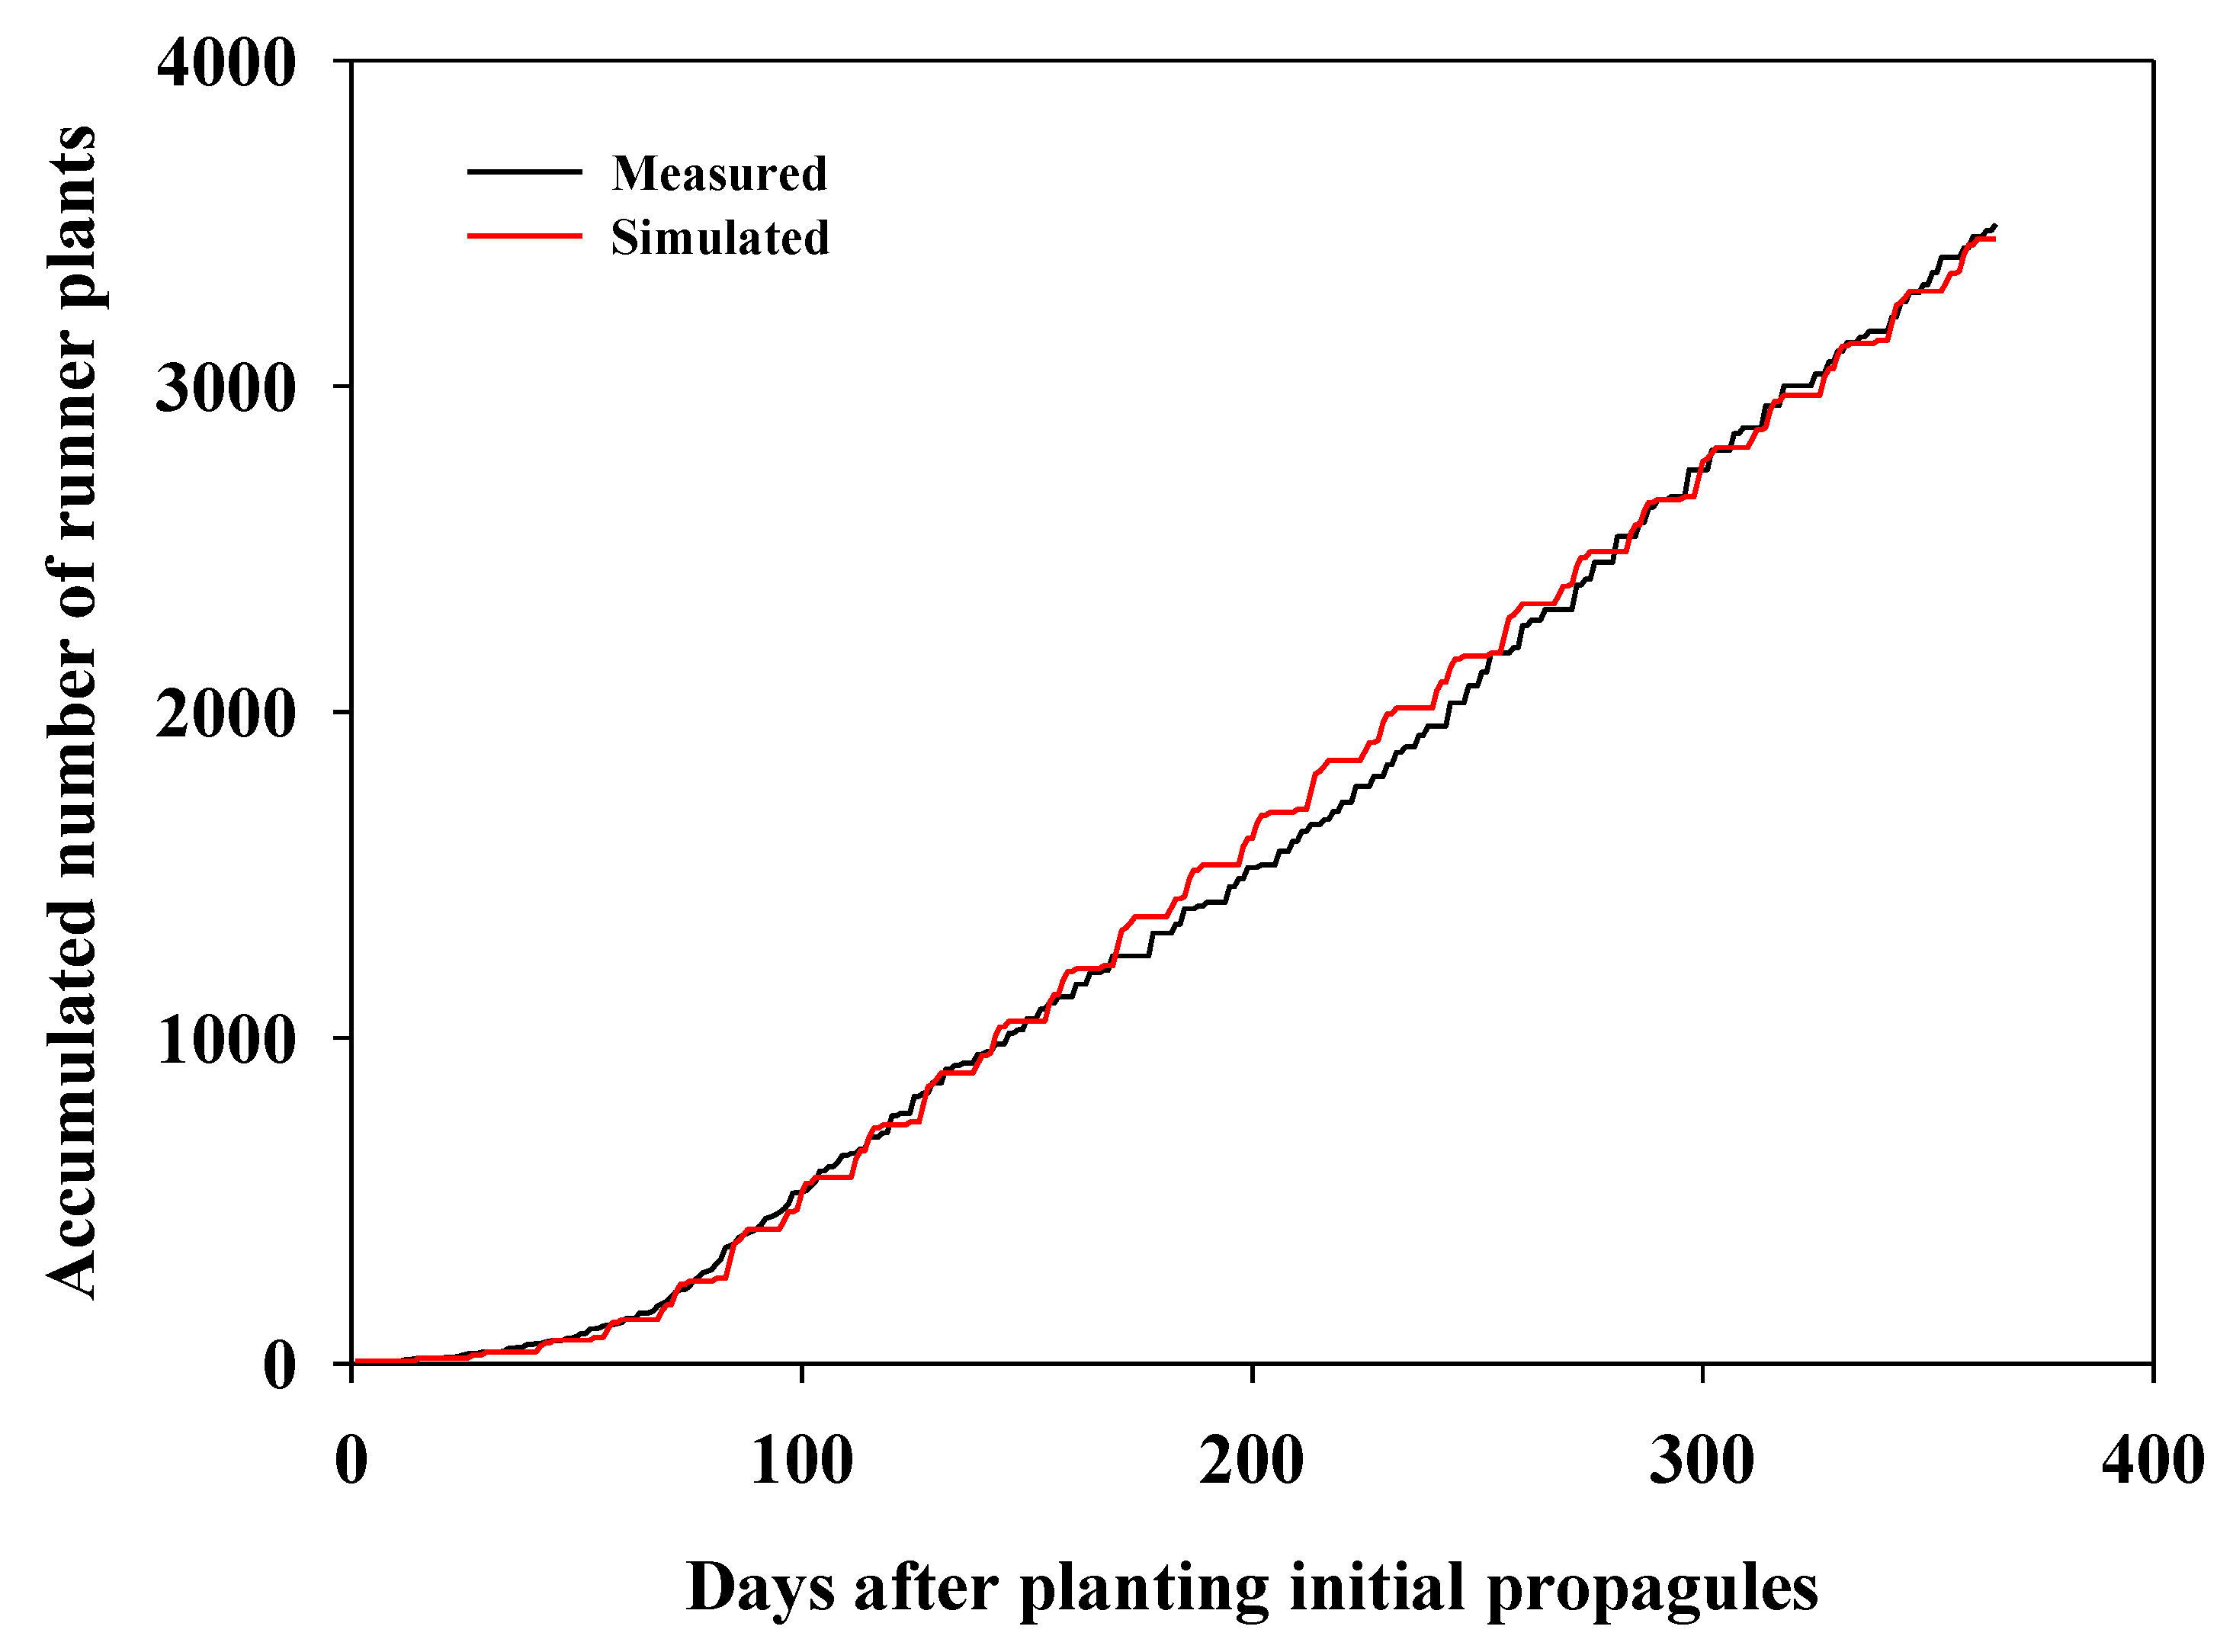
We fit the simulated results to be close to the measured results and determined propagation cycles of 15, 27, and 43 days (Figure 4). The CNT simulated by the program was 3452, which was smaller than the measured CNT. The linearly and exponentially increasing sectors of the simulated results were similar to the measured results. RMSEs between measured and simulated results were 15.9 on the exponential increasing section (0 to 70 DAP) and 65.1 on the linear increasing section (71 to 365 DAP).
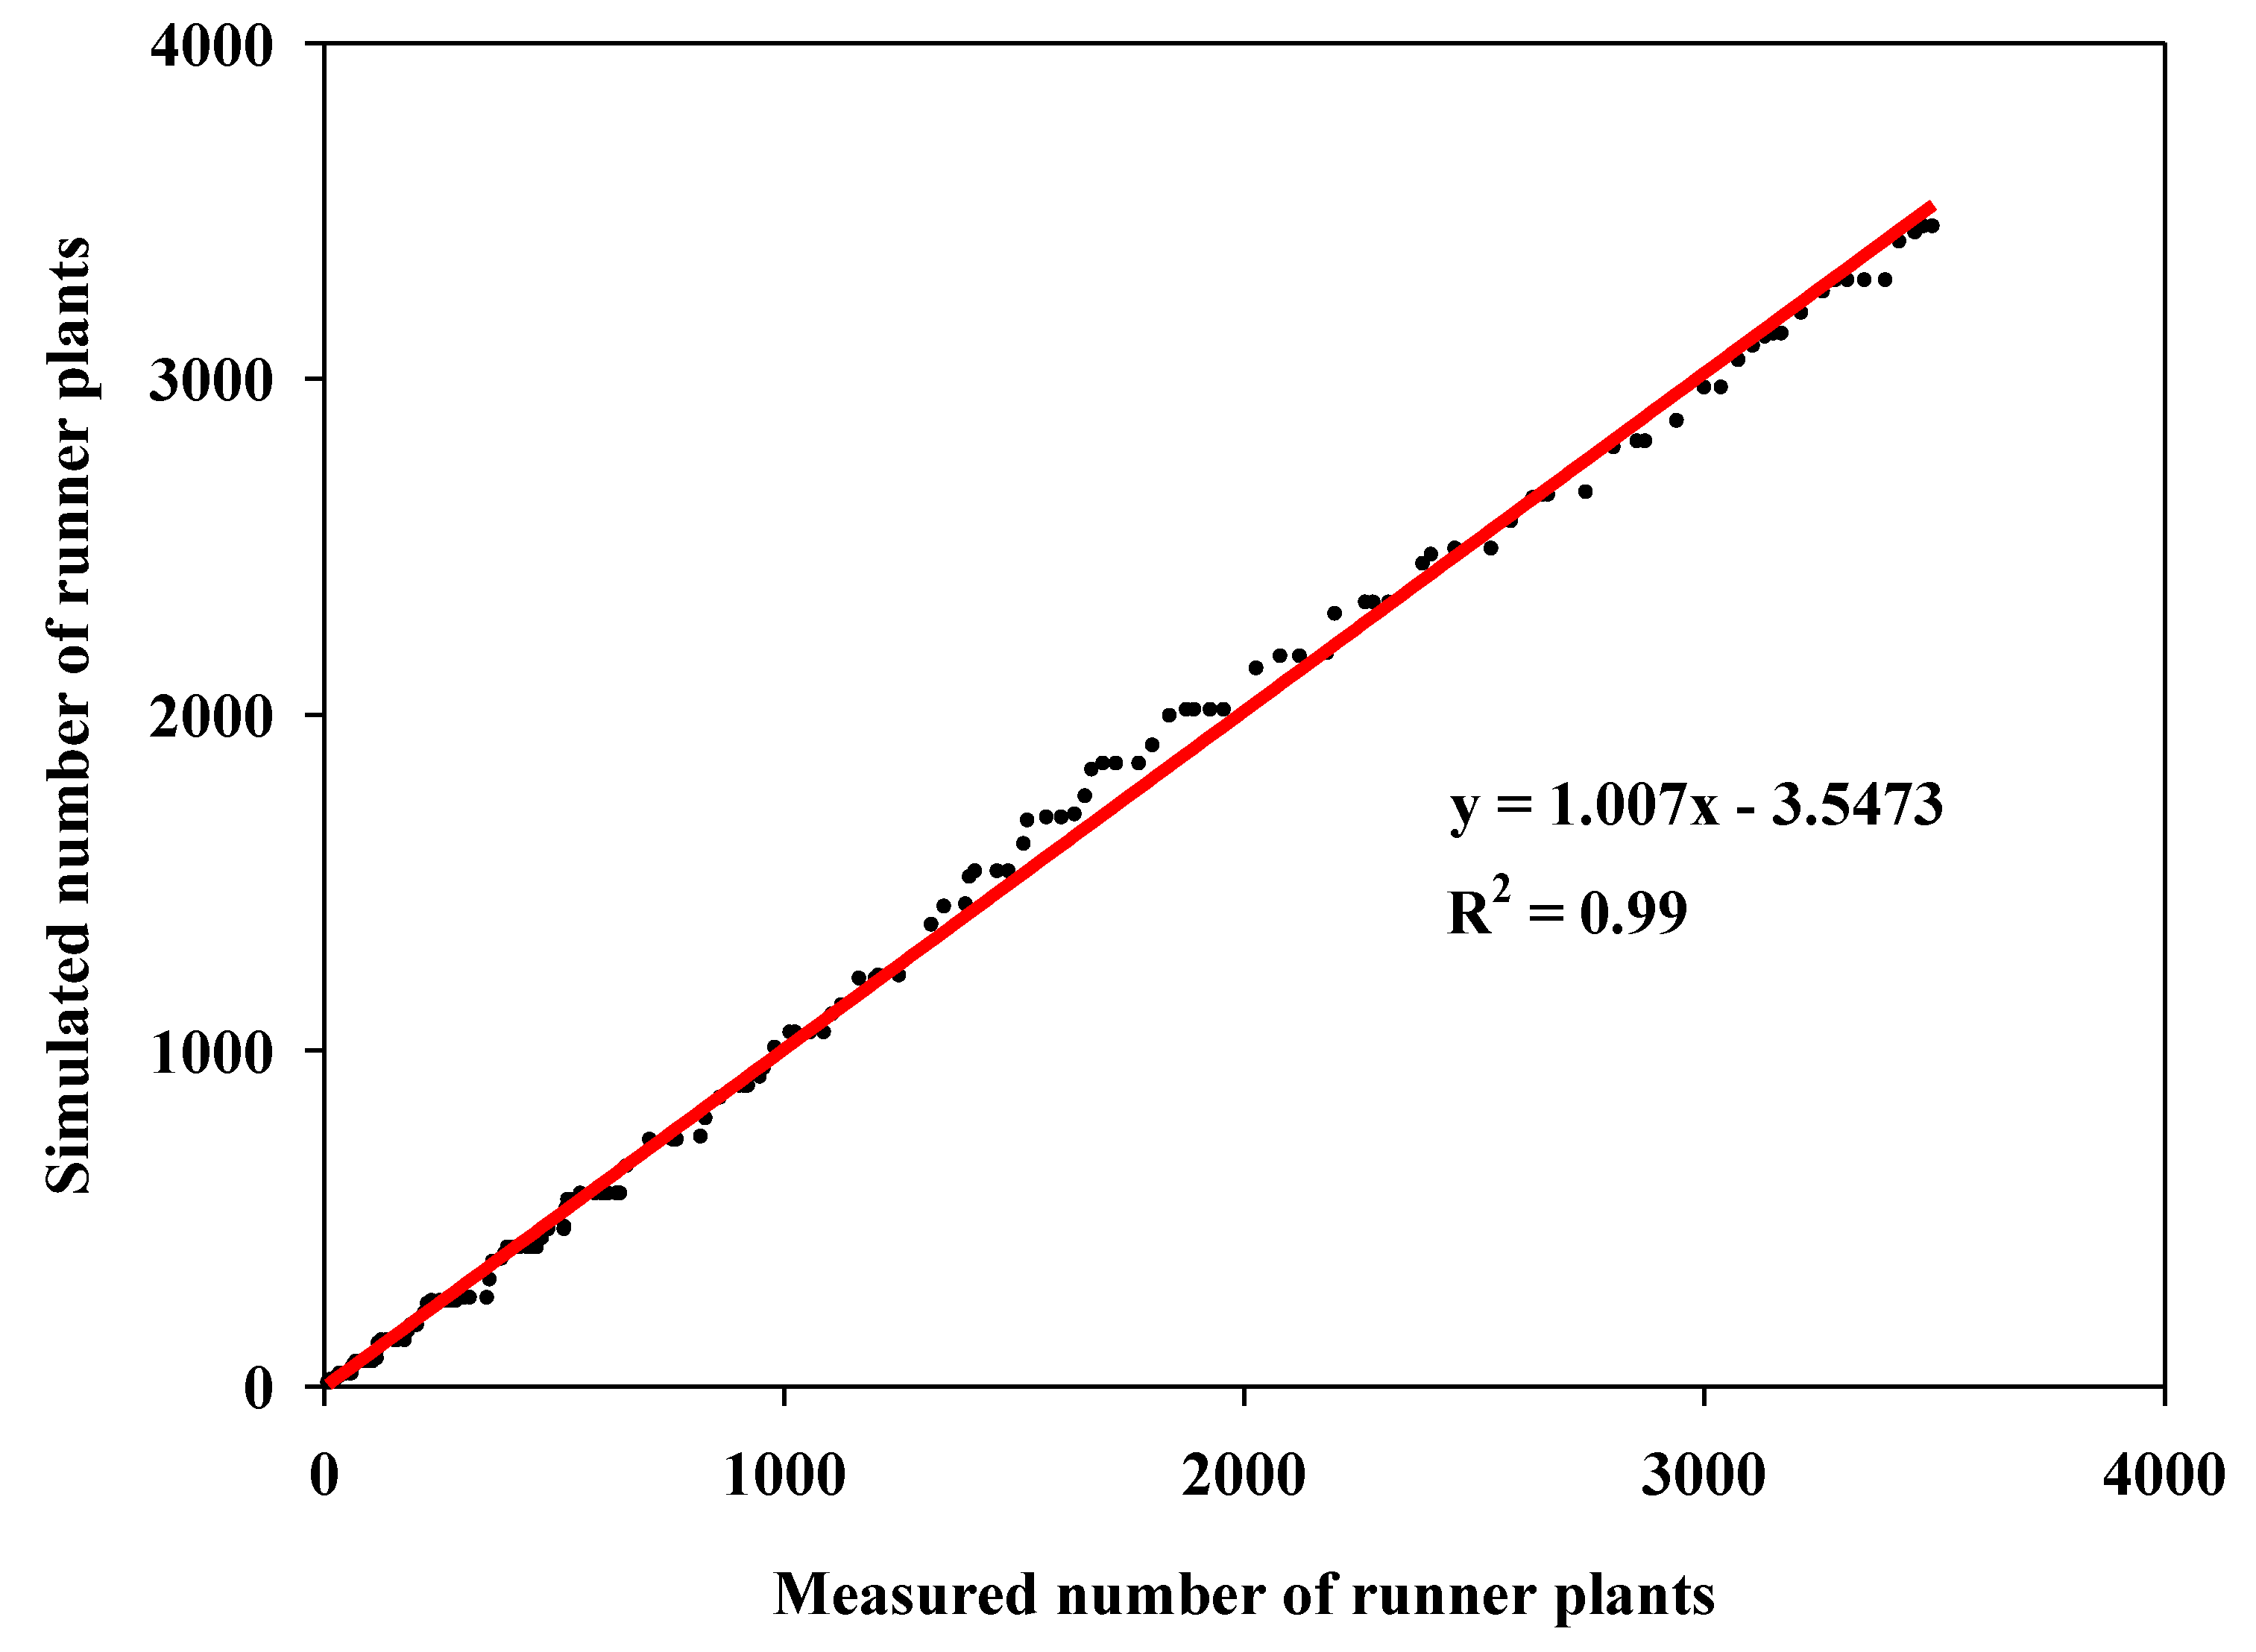
Figure 5 shows a scatter plot of the transplants produced over 365 days measured and simulated by the prediction program and simple linear regression. The linear regression equation was y = 1.007x−3.547, which indicates that the measured and simulated results were very similar. Moreover, the coefficient of determination value for the model was 0.99. Therefore, we concluded that the program is appropriate to predict the number of transplants produced by the ATPM in a T-PFAL.
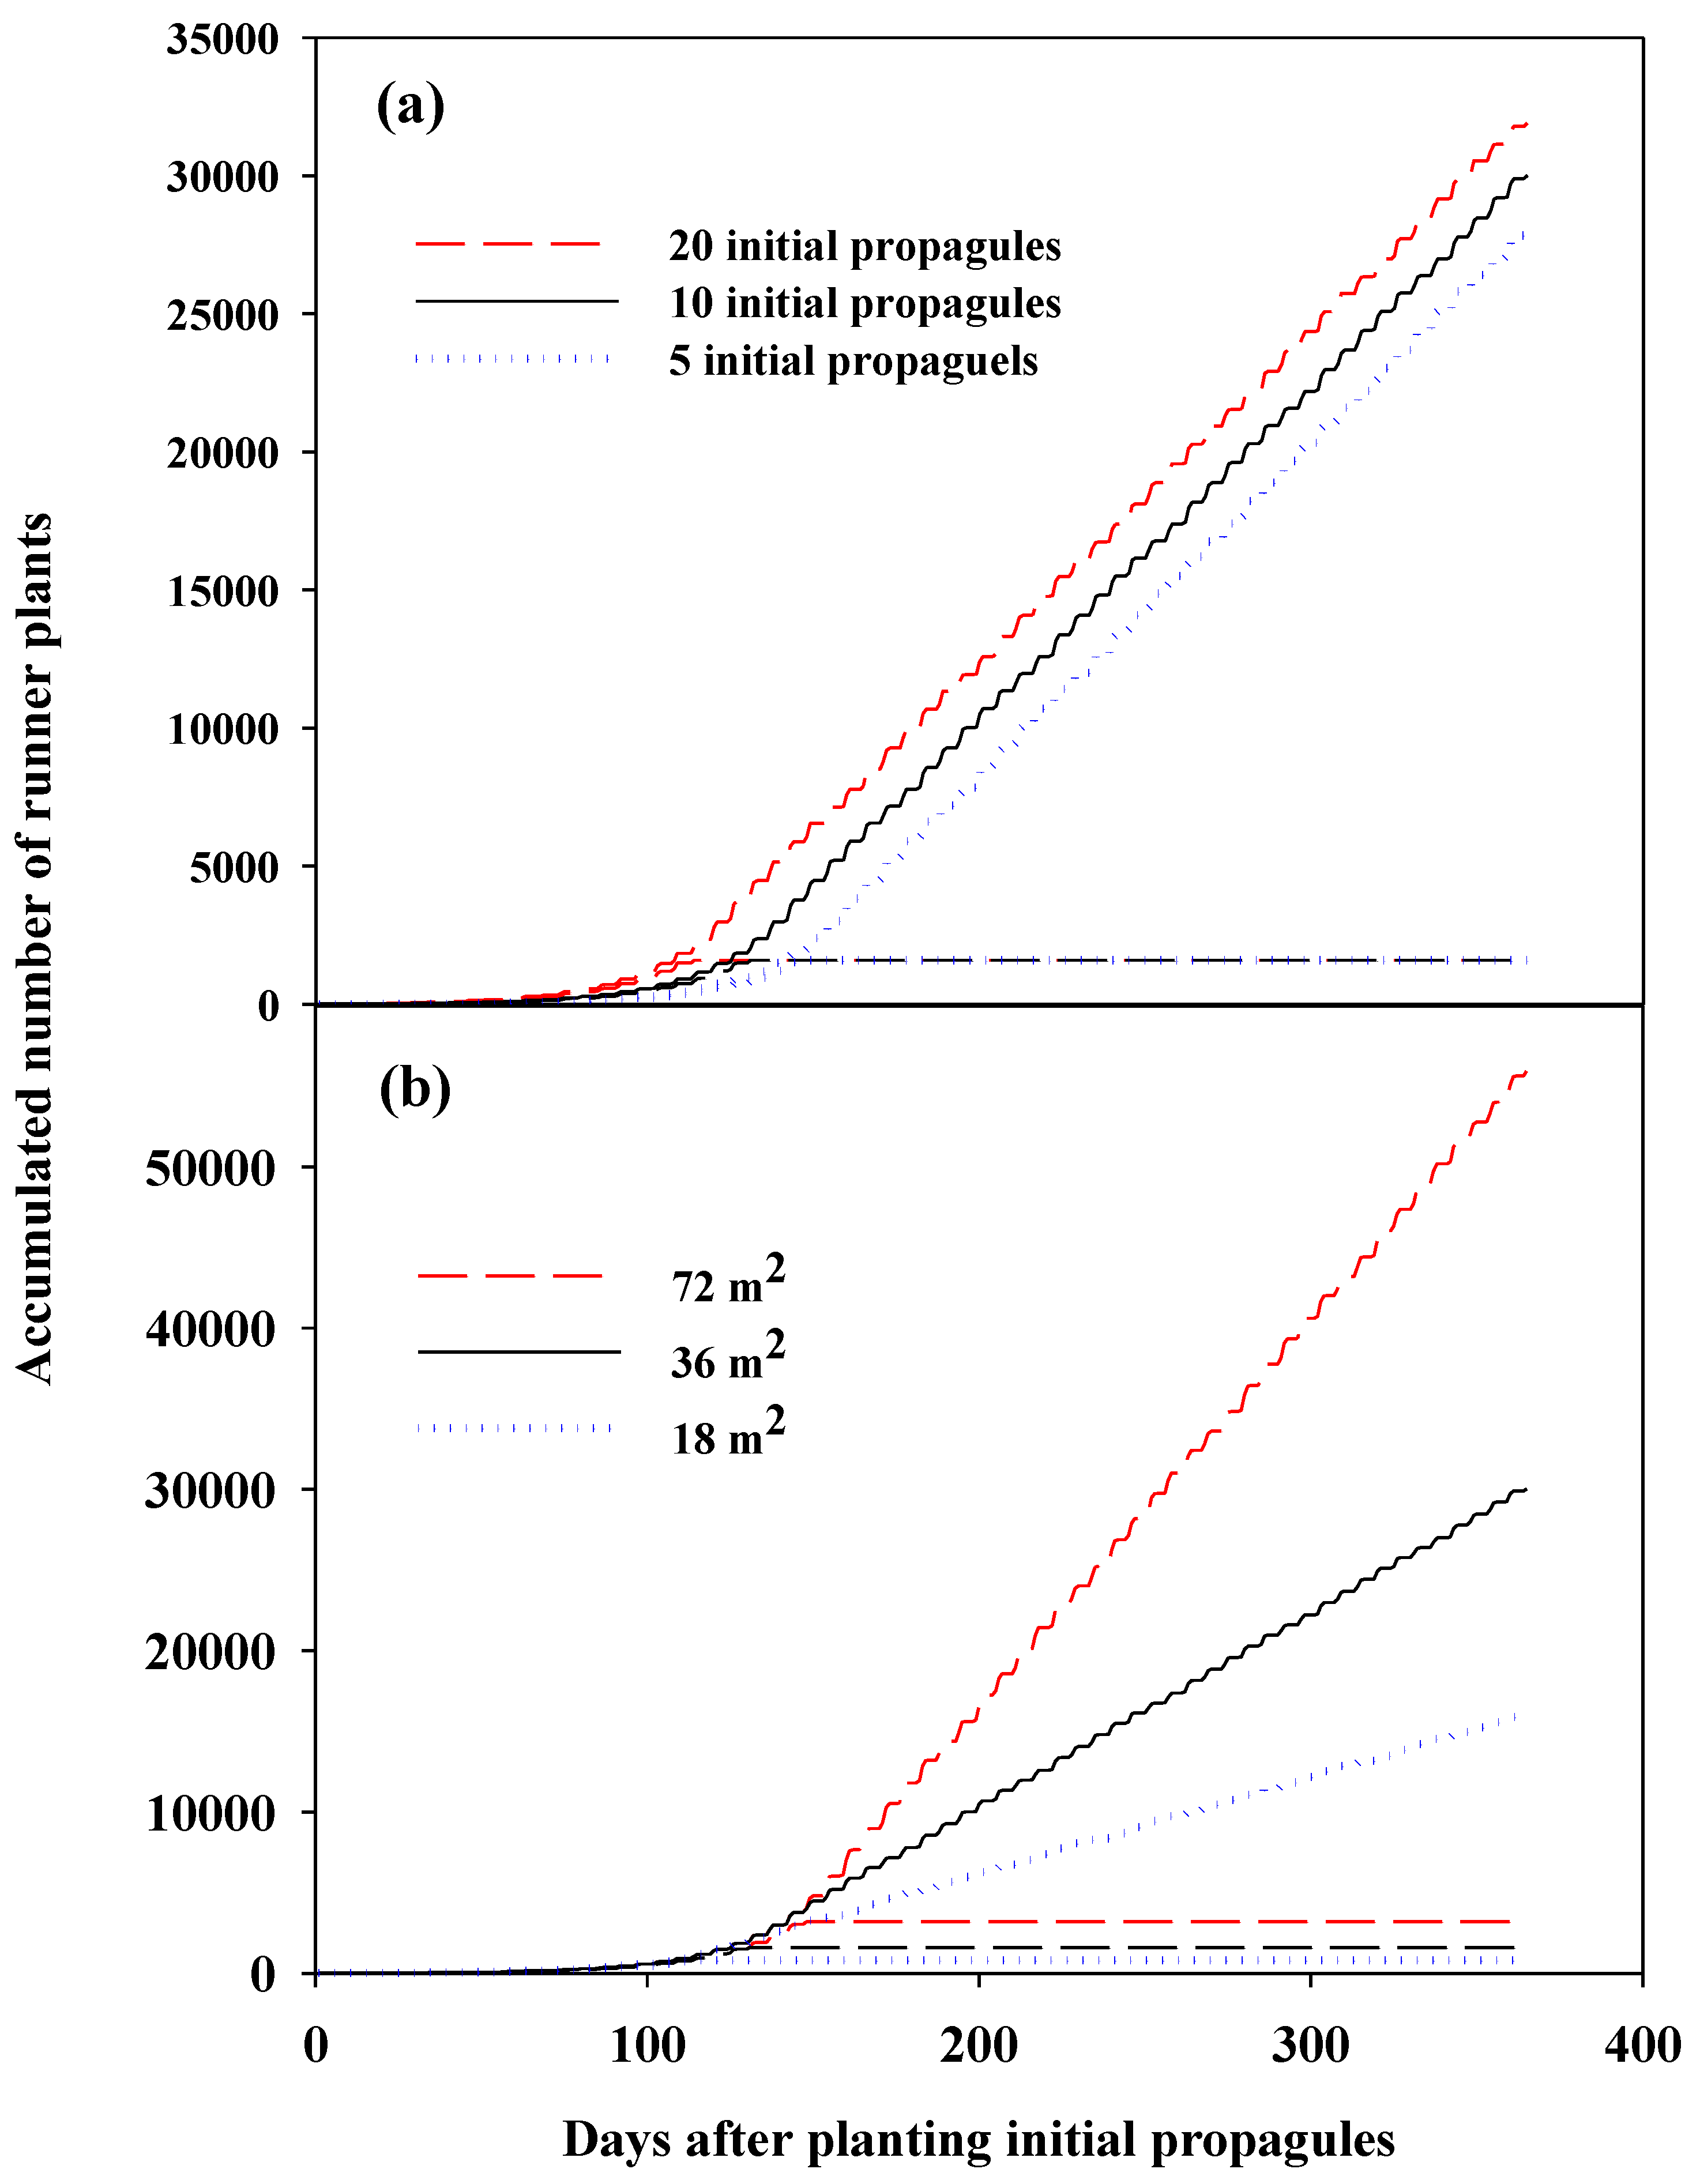
Using the program, we investigated the productivity of the ATPM based on the number of initial propagules and cultivation area (Figure 6). The CNTs produced from 5, 10, and 20 initial propagules in 36 m2 over 365 days were 27,970, 30,010, and 31,900, respectively. The CNT produced from 20 initial propagules over 365 days was 1.14 times higher than the number produced from 5 initial propagules even though the number of initial propagules was four times larger. The NMP produced from 5, 10, and 20 initial propagules was 1600 plants; however, the timescale needed to reach the NMP produced from 20 initial propagules was 114 DAS, which was shorter than the timescale needed from 5 and 10 initial propagules (148 and 131 DAP, respectively). The slopes of the linearly increasing section were the same regardless of the NIP. The CNTs produced from 10 initial propagules in cultivation areas of 18 and 72 m2 were 15950 and 55940, respectively. The transplants produced in 18 and 72 m2 were approximately 53% smaller and 186% higher in number than those produced in 36 m2, whereas the cultivation areas were 50% smaller and 200% higher in number. The NMPs produced in 18 and 72 m2 were 800 and 3200 plants, respectively. The timescales required to reach these NMP values were 114 and 148 DAP, and the timescale increased as the propagation area was expanded. The propagation rates of the linearly increasing sections of 18, 36, and 72 m2 were approximately 59, 120, and 240 plants∙d−1, respectively, and the difference between them was similar to differences in the propagation area. In other words, the wider the propagation area, the longer the timescale needed to reach the start of the linearly increasing section and the higher the slope of the linearly increasing section. Therefore, the increase in the CNT based on the increase in cultivation area was higher than that based on the increase in the NIP.
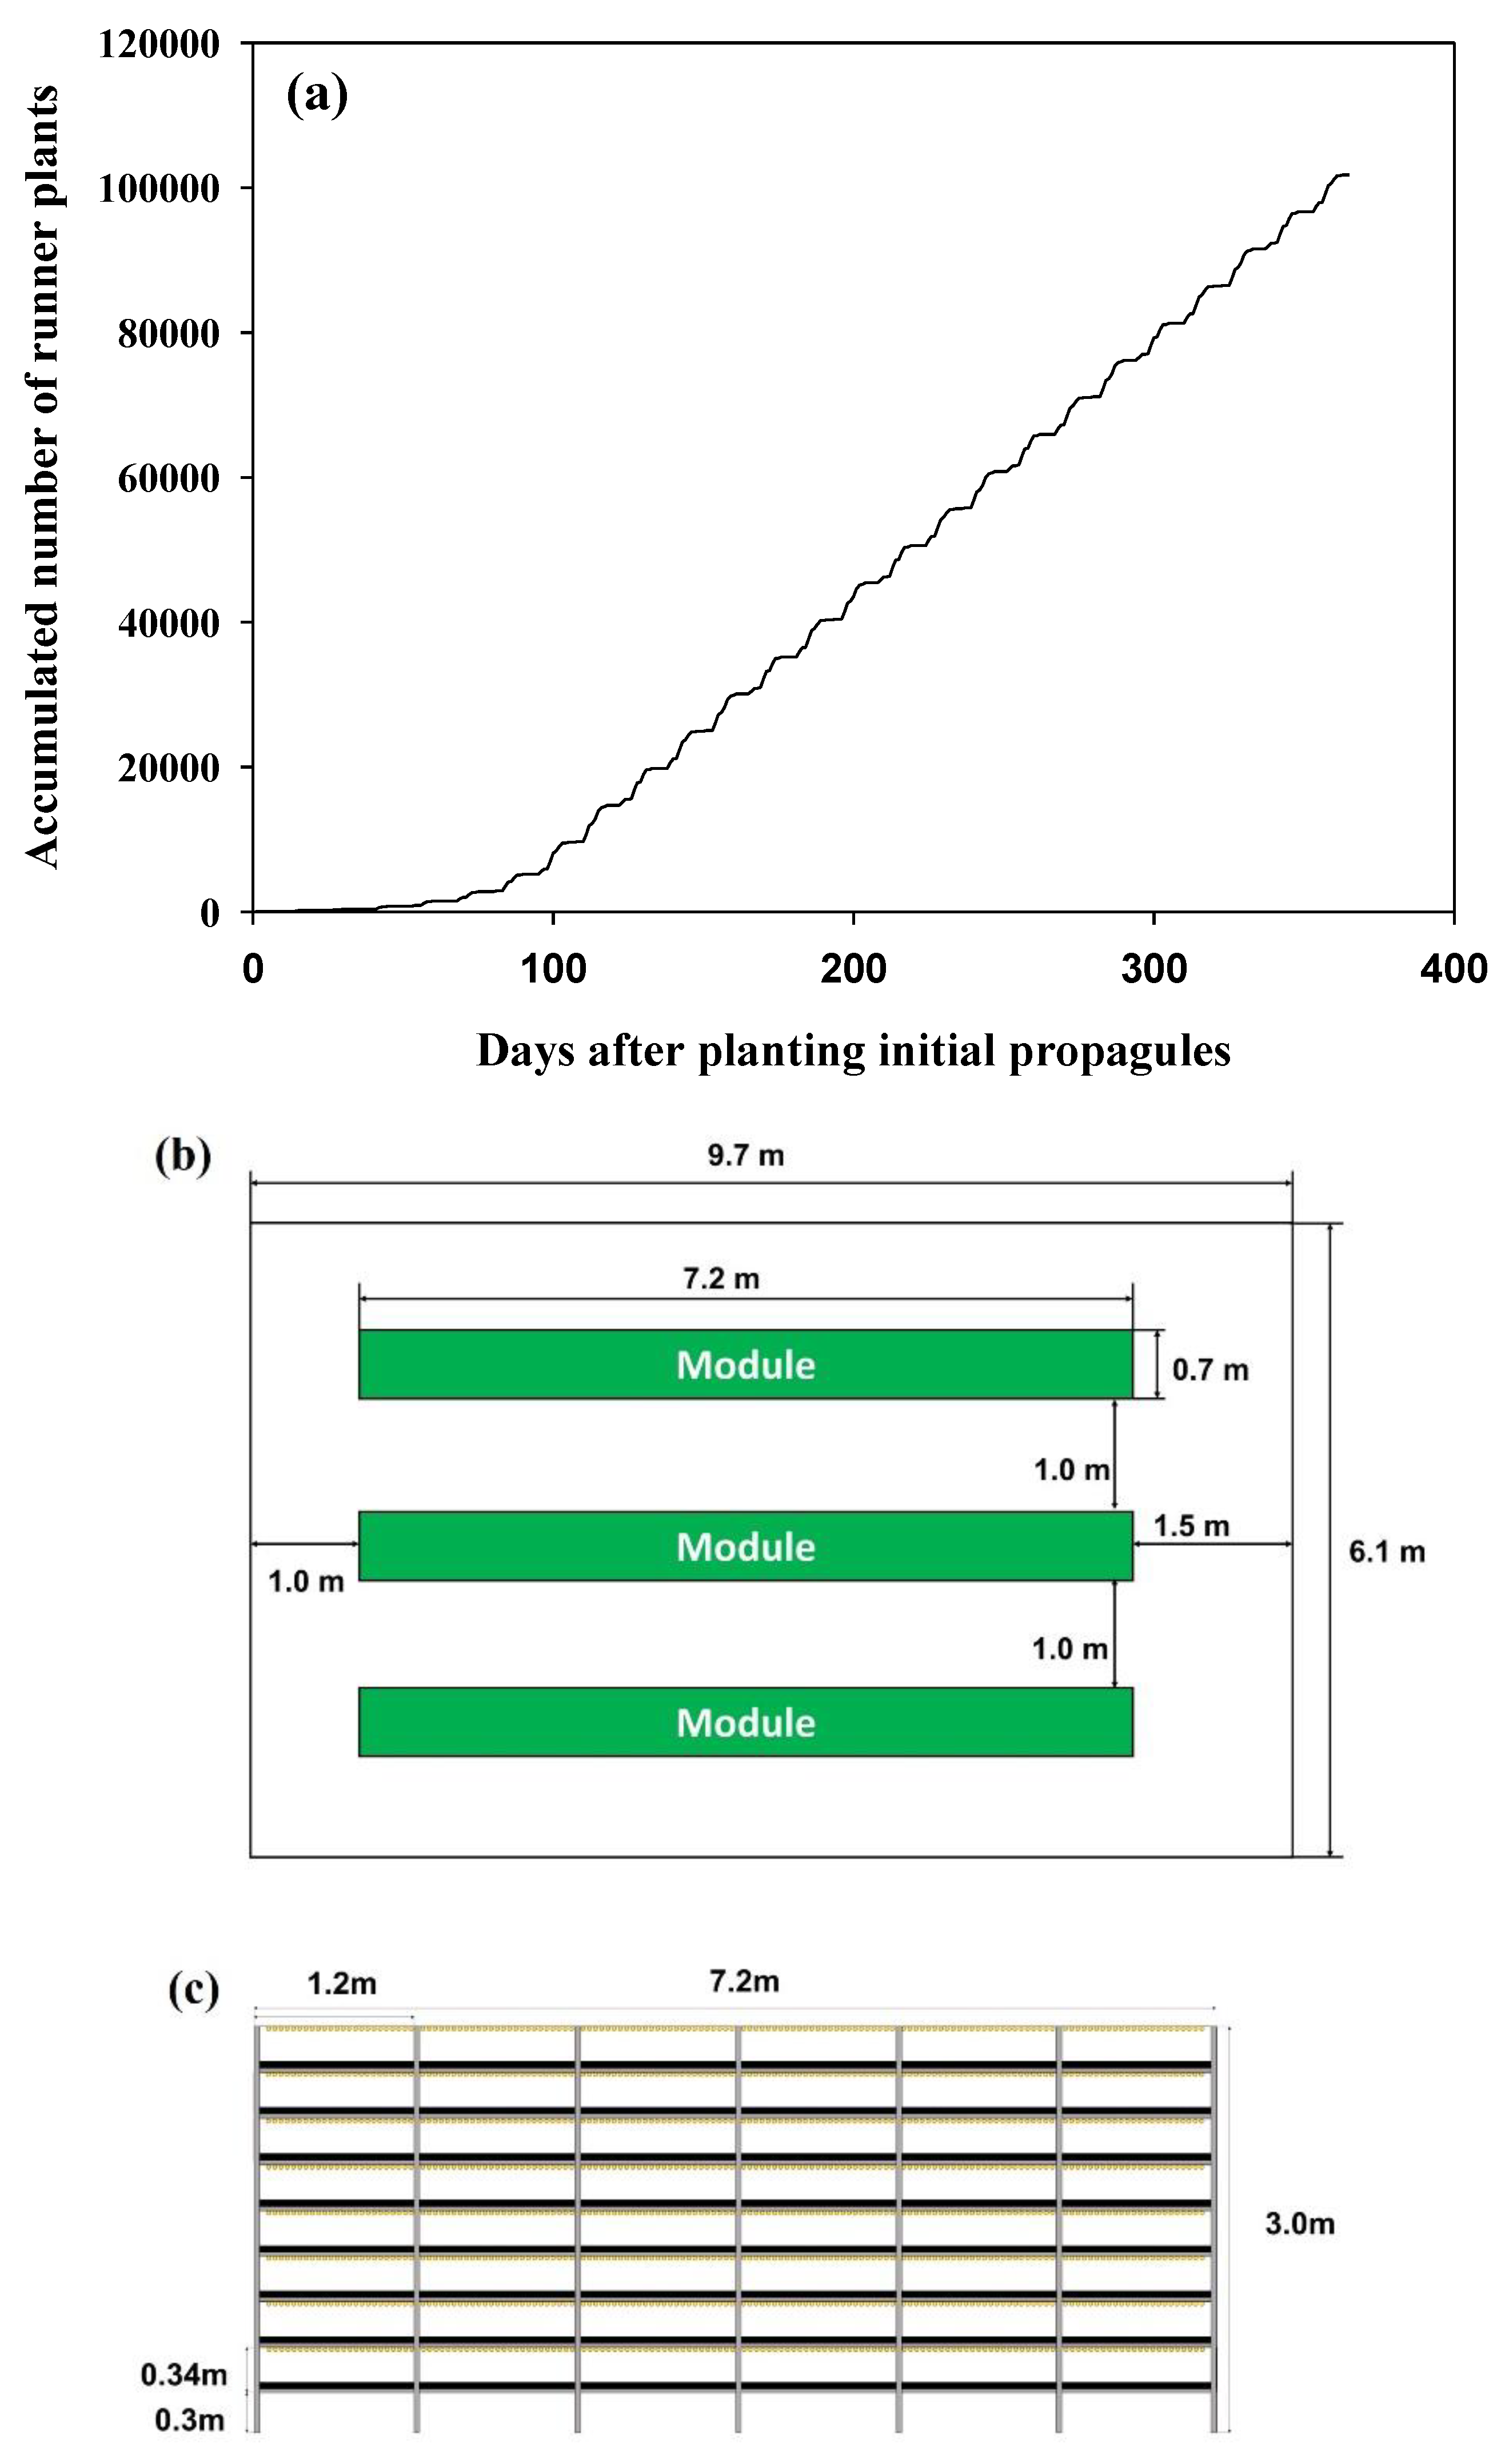
The required propagation areas to produce one hundred thousand runner plants (prebasic transplants) from 100 propagules (100 nuclear transplants) were 115 m2 (Figure 7). In the case of using three modules {a module: eight beds; 8.0 m × 0.6 m × 3.0 m (L × W × H); width for every aisle: 1.0 m} for the production of one hundred thousand runner plants, maximum 60 m2 was needed to build a T-PFAL. Therefore, the timescale for propagation and distribution systems for domestic cultivars in Korea can be shortened by one to two years if the T-PFAL can be built large.
The results indicate that the ATPM is an appropriate propagation method to produce strawberry transplants rapidly in a T-PFAL, and it could be a suitable method to enhance the propagation and distribution system for domestic strawberry cultivars in Korea, especially if the number of propagules is limited.

Author Contributions

Conceptualization, S.W.P. and C.C.; methodology, S.W.P., S.K.K. and Y.K.; resources, C.C.; writing—original draft preparation, S.W.P.; writing—review and editing, C.C., S.K.K. and Y.K.; supervision, C.C.; project administration, C.C.; funding acquisition, C.C. All authors have read and agreed to the published version of the manuscript.

Funding

This study was supported by the National Joint Agricultural Research Project “Establishment of propagation system for elite-transplants of strawberry using a plant factory and investigation of their physiological characteristics (Project No. PJ01186304)”, Rural Development Administration, Republic of Korea.

Conflicts of Interest

The authors declare no conflict of interest.

References

  1. Broome, O.C.; Goff, L.M. The Production, Testing and Certification of Virus-Tested Strawberry Stock. Adv. Straw. Prod. 1987, 6, 3–5. [Google Scholar]
  2. Chun, C. Propagation and Production of Strawberry Transplants. In Plant Factory; Kozai, T., Niu, G., Takagaki, M., Eds.; Academic Press Elsevier: San Diego, CA, USA, 2016; pp. 260–266. [Google Scholar]
  3. Savini, G.; Giorgi, V.; Scarano, E.; Neri, D. Strawberry Plant Relationship through the Stolon. Physiol. Plant. 2008, 134, 421–429. [Google Scholar] [CrossRef] [PubMed]
  4. Black, B.L.; Swartz, H.J.; Deitzer, G.F.; Butler, B.; Chandler, C.K. The Effects of Conditioning Strawberry Plug Plants under Altered Red/Far-red Light Environments. HortScience 2005, 40, 1263–1267. [Google Scholar] [CrossRef] [Green Version]
  5. Kozai, T. Closed Systems for High Quality Transplants Using Minimum Resources. In Plan Tissue Culture Engineering; Gupta, S.D., Ibaraki, Y., Eds.; Springer: Dordrecht, The Netherlands, 2008; pp. 275–312. [Google Scholar]
  6. Zheng, J.; Ji, F.; He, D.; Niu, G. Effect of Light Intensity on Rooting and Growth of Hydroponic Strawberry Runner Plants in a LED Plant Factory. Agronomy 2019, 9, 875. [Google Scholar] [CrossRef] [Green Version]
  7. Chun, C.; Park, S.W.; Jeong, Y.W.; Ko, K.D. Strawberry Propagation Method Using Closed Transplant Production Systems. Korean Patent Application No. 10-1210680, 2012. [Google Scholar]
  8. Park, S.W.; Kwack, Y.; Chun, C. Growth and Propagation Rate of Strawberry Transplants Produced in a Plant Factory with Artificial Lighting as Affected by Separation Time from Stock Plants. Hortic. Environ. Biotechnol. 2018, 59, 199–204. [Google Scholar] [CrossRef]
  9. Kubota, C.; Kozai, T. Mathematical Models for Planning Vegetative Propagation under Controlled Environments. Hortic. Sci. 2001, 36, 15–19. [Google Scholar] [CrossRef]
  10. Kim, S.K.; Jeong, M.S.; Park, S.W.; Kim, M.J.; Na, H.Y.; Chun, C. Improvement of Runner Plant Production by Increasing Photosynthetic Photon Flux During Strawberry Transplant Propagation in a Closed Transplant Production System. Hortic. Sci. Technol. 2010, 28, 535–539. [Google Scholar]
  11. Jemmali, A.; Boxus, P.; Kevers, C.; Gaspar, T. Carry-over of Morphological and Biochemical Characteristics Aßociated with Hyperflowering of Micropropagated Strawberries. Plant. Physiol. 1995, 147, 435–440. [Google Scholar] [CrossRef]
  12. Yamazaki, K. Yoeki Saibai zenpen; Hakuyu sha Tokyo: Tokyo, Japan, 1978; p. 41. [Google Scholar]
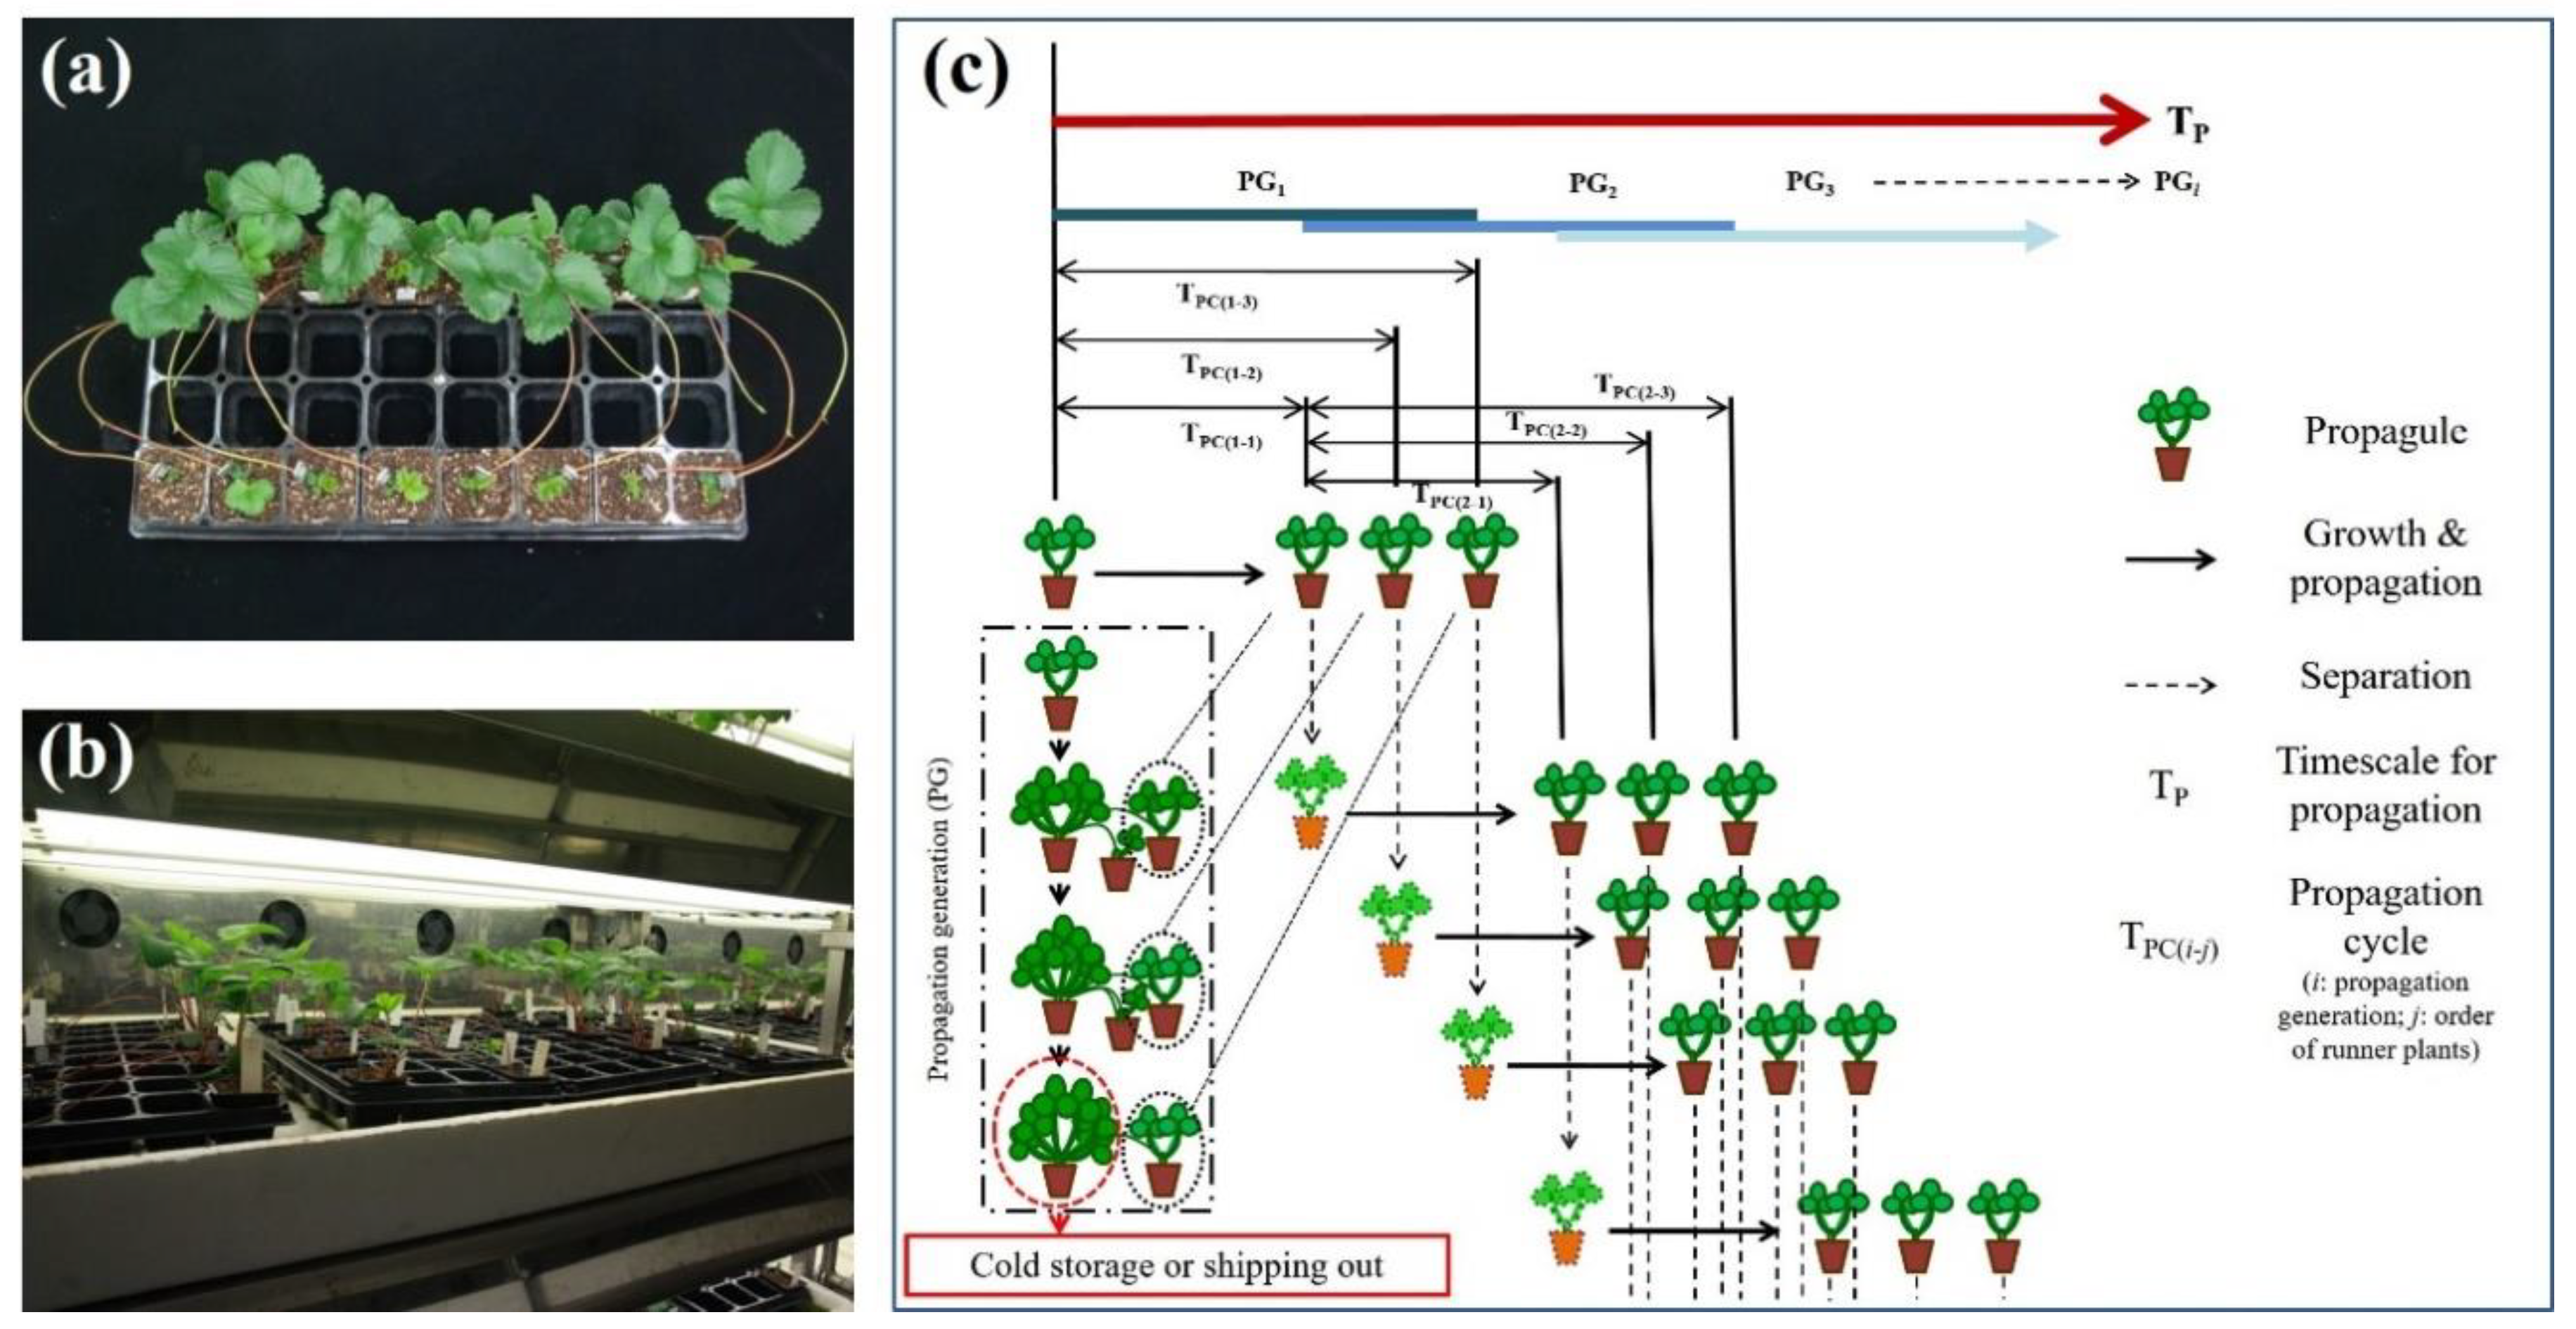
Figure 1. Arrangement of propagules on a 32-cell plug tray (a) and a cultivation bed (1.2 m × 0.6 m; (b) in a T-PFAL, and schematic diagram of runner plant production in ATPM (c).
Horticulturae 06 00063 g001
Figure 2. A flow chart of a program to predict the production of strawberry transplants for the autotrophic transplant production method.
Horticulturae 06 00063 g002
Figure 3. Time courses of cumulated numbers of total runner plants, runner plants released from a PFAL, and propagules producing runner plants in a plant factory using artificial lighting (PFAL) by autotrophic transplant production method (a). The runner plants were annually produced from nine initial propagules in 3.6 m2 propagation area (five cultivation beds; maximum capacity number of propagules: 160). The accumulated number of total runner plants two different regression, exponential (b) and linear types (c) depends on days after planting initial propagules.
Horticulturae 06 00063 g003
Figure 4. Time course of cumulated numbers of runner plants measured for 365 days and simulated by a program to predict number of transplants for autotrophic transplant production method. The runner plants were annually produced from nine initial propagules in 3.6 m2 propagation area (five cultivation beds; maximum capacity number of propagules: 160) and the simulated result was also simulated by the same conditions as measured one. RMSEs between measured and simulated results were 15.9 on the exponential increasing section (0 to 70 days) and 65.1 on the linear increasing section (71 to 365 days).
Horticulturae 06 00063 g004
Figure 5. Measured and simulated numbers of runner plants for 365 days at same time. Simulated results were derived from a program to predict number of transplants for autotrophic transplant production method. The runner plants were annually produced from nine initial propagules in 3.6 m2 propagation area (five cultivation beds; maximum capacity number of propagules: 160) and the simulated result was also simulated by the same conditions as measured one. Propagation cycles used for the program were 15, 27 and 43. The coefficients of determination were estimated by regression analysis.
Horticulturae 06 00063 g005
Figure 6. Time courses of cumulated numbers of runner plants simulated by a program to predict number of transplants for autotrophic transplant production method as affected by number of initial propagules (a) and propagation area (b). The solid lines are simulated results by propagation cycles (15, 27 and 43) and ten propagules in 36 m2 propagation area (maximum capacity number of propagules: 1600) and dash and dotted lines are results simulated by increasing and reducing propagation area or number of initial propagules by two times the result of solid line.
Horticulturae 06 00063 g006
Figure 7. Time courses of cumulated numbers of runner plants simulated by a program to predict number of transplants for autotrophic transplant production method in a plant factory using artificial lighting (a). The result was simulated by propagation area 115 m2 to produce 100,000 runner plants from 100 initial propagules for a year. Floor plan of a T-PFAL (b) and a side view of a module in the T-PFAL (c) for production of 100,000 runner plants by ATPM.
Horticulturae 06 00063 g007