Article

Study on the Growth Performance of Lettuce (Lactuca sativa) and Pak Choi (Brassica chinensis) in Different Aquaponic Growing Systems

by
Laurence Shiva Sundar
and
Guangyau Stanley Chen
*
Department of Tropical Agriculture and International Cooperation, National Pingtung University of Science and Technology, Pingtung 912301, Taiwan
*
Author to whom correspondence should be addressed.
Horticulturae 2020, 6(4), 69; https://doi.org/10.3390/horticulturae6040069
Submission received: 27 September 2020 / Revised: 14 October 2020 / Accepted: 16 October 2020 / Published: 19 October 2020
(This article belongs to the Section Vegetable Production Systems)

Abstract

:
Aquaponics is a human-made recirculating ecosystem that integrates the cultivation of crops and aquaculture to produce higher-quality, safe, and nutritious food. However, limited studies have been conducted to investigate the performance of different aquaponic plant growing systems. As such, the current research focuses on evaluating the overall performance of four different aquaponic growing systems in the growth and yield of lettuce and pak choi. The data on the shoot and root biomass and growth parameters were collected, and the growth analysis was performed. The relative growth rate results indicated that the appropriate environmental conditions were provided for lettuce and pak choi to grow successfully in all the four aquaponic growing systems. The crop growth rate results revealed that all four aquaponic growing systems tested in this experiment were able to grow crops and provide yield successfully. However, the substrate-based closed capillary water distribution system (CCWD) had the best overall result, which showed great potential for aquaponic applications to promote alternative agriculture production under unfavored climate conditions.

1. Introduction

The world population is expected to increase from 7.7 billion people in 2020 to about 9.7 billion people by 2050 [1]. As a result, the global food demand is expected to double by the 2050s [2,3]. Continuing population and consumption growth will mean that the global demand for food will increase for at least another 40 years [2]. The production of crops in the future will be stressful, as climate change is expected to impact crop yields negatively. The climate attributes expected to have the most direct impacts on agricultural productivity are the rise in temperature, the change in the frequency and intensity of precipitation and extreme weather phenomena, and the increase in the level of CO2 available for photosynthesis [3]. Many countries in tropical and sub-tropical regions are expected to be more vulnerable to climate change, which will affect their marginal water balance and harm their agricultural sectors [4].
Agriculture composed of crops and livestock emits greenhouse gases aggravating the problem; therefore, agricultural practices need to be modified to reduce the problem [5]. On an annual basis over the past decade, developing countries have absorbed US$35 billion a year in damages from natural disasters [6]. Islands are highly vulnerable to climate change impacts on water supplies and agricultural productivity, including exports of cash crops, coastal ecosystems, and tourism as important foreign exchange sources for many islands [7]. Therefore, alternative farming methods can be used to enhance crop production in an era of climate change.
Aquaponics offers a solution to several sustainability issues, such as limited water availability, environmental pollution, increasing fertilizer cost, and the depletion of fertile soils [8]. Aquaponics is a human-made recirculating ecosystem that integrates the cultivation of crops and aquaculture. It is an environmentally friendly, natural food-growing method that harnesses the best attributes of aquaculture and hydroponics without the need to discard any water or filtrate or add chemical fertilizers [9]. This cropping method enables farmers to produce high-quality organic crops as well as freshwater fishes. Aquaponic growing systems can be operated almost waste-free, and therefore, they have no measurable effects on the soil [10]. Fish species suitable for aquaponic farming include tilapia, common carp, silver carp, grass carp, barramundi, jade perch, catfish, trout, salmon, Murray cod, and largemouth bass [11]. To date, more than 150 different vegetables, herbs, flowers, and small trees have been grown successfully in aquaponic growing systems, including research, domestic, and commercial units [11].
Growth analysis is still the most accessible and accurate way to evaluate plant growth and the contribution of physiological processes to plant behavior [12]. Development to analyze crop growth has provided a better understanding of the growth process and yield limitations [13]. Several studies have been conducted to evaluate the growth of plants under different conditions. A study carried out by a researcher used different growth analysis methods to investigate the growth of plants that experience periodic losses of leaf mass [14]. These include absolute growth rate (g day−1), relative growth rate (g g−1 day−1), net assimilation ratio (g m−2 day−1), leaf area ratio (m−2 g−1), leaf lamina production (g g−1), and the fractional daily change in mean specific leaf area of the plants (m2 kg−1day−1). Another study carried out to evaluate lettuce growth under a different substrate identifies a simple yet effective method to calculate the growth of leafy vegetables [12]. These include leaf number, the dry mass of a plant, leaf area index, culture growth rate, net assimilation rate, specific foliar area, foliar area ratio, and foliar weight ratio. A similar study evaluates lettuce’s growth and quality in a closed recirculating hydroponic system uses similar growth analysis methods [15]. These include the plant’s total dry mass, leaf area index, relative growth rate, absolute growth rate, and net assimilation rate.
For this study, four aquaponic growing systems, i.e., floating raft (FR), closed capillary water distribution (CCWD) [16], nutrient film technique (NFT), and ebb and flow (E&F) systems were developed. These aquaponic growing systems were formed by incorporating a specific plant growing system with the crayfish aquaculture system. The present study’s objective was to evaluate four different aquaponic plant growing systems’ overall performance in the growth and yield of lettuce and pak choi.

2. Materials and Methods

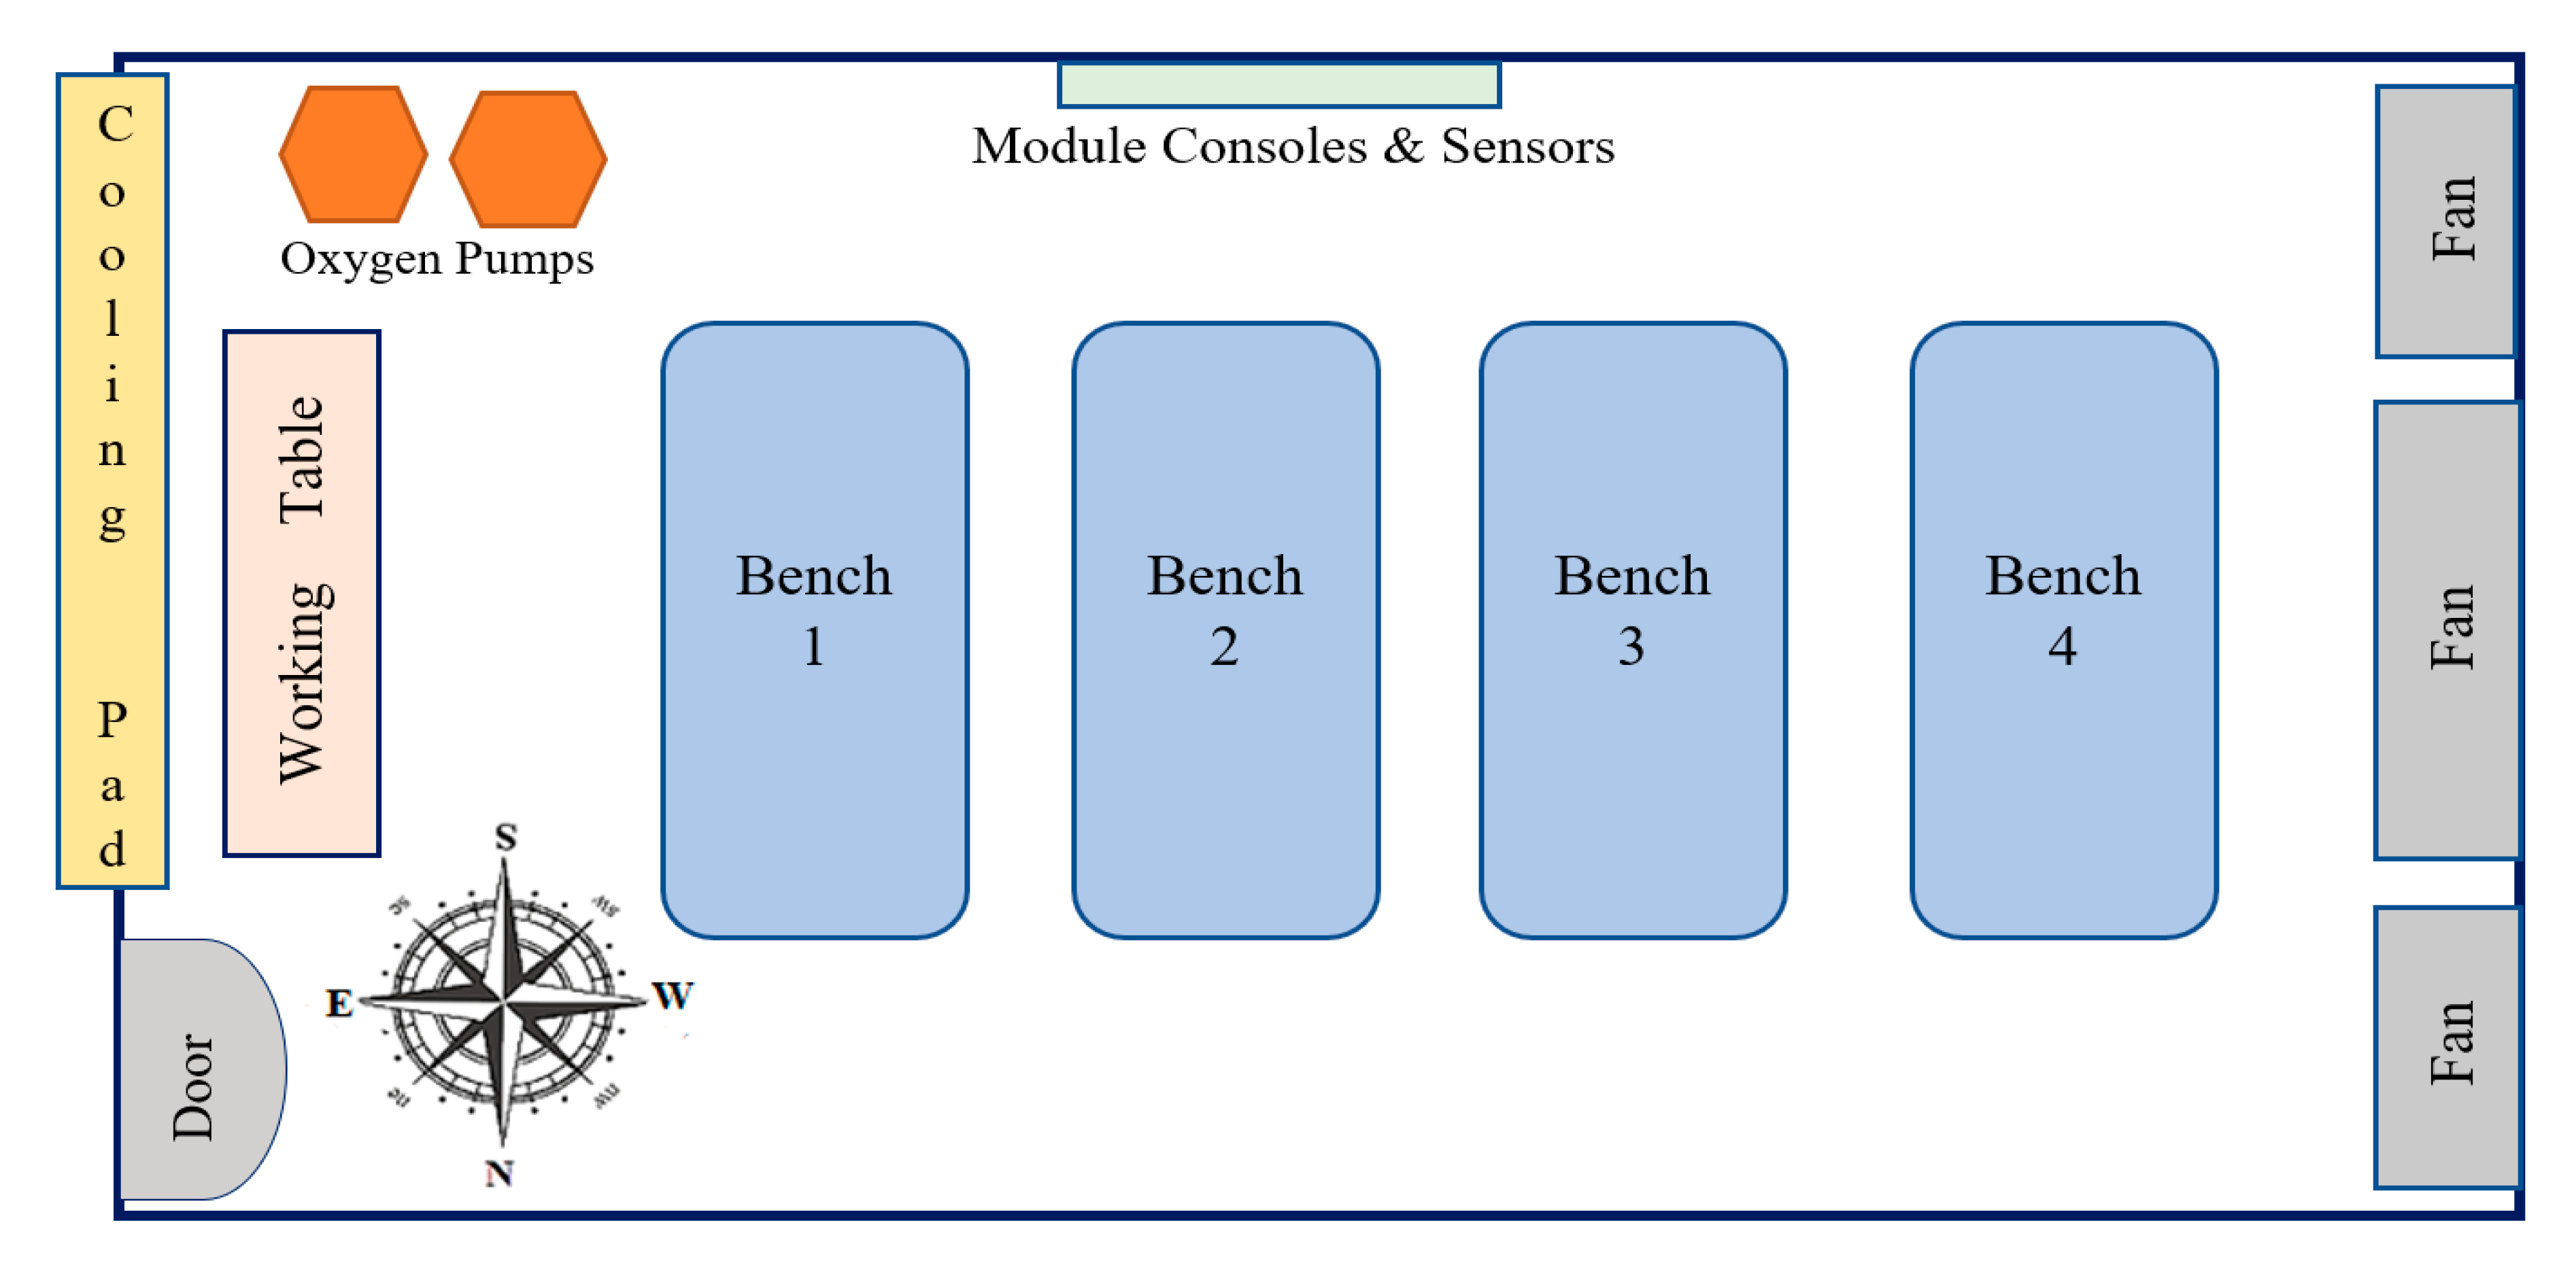
2.1. Experimental Location, Setup, and Design

The present study was conducted in the controlled environment greenhouse of the Department of Tropical Agriculture and International Cooperation (DTAIC), National Pingtung University of Science and Technology (NPUST), Taiwan, R.O.C. Located on the west side of the DTAIC building, the greenhouse provided a general growing environment for crop and aquaculture production (Figure 1). Four different aquaponic growing systems (FR, CCWD, NFT, and E&F systems) were used to fulfill the plant’s water and nutrient needs. For each aquaponic system, the upper two tanks were used as the growing tank, while the bottom two were the aquaculture and filtration tank, respectively (Figure 2). Each of these tanks was 100 cm long, 70 cm wide, and 30 cm high. A red rapid variety of lettuce (Lactuca sativa) and A. Feng variety of pak choi (Brassica chinensis) was used for the experiment, while the red claw crayfish (Cherax quadricarinatus) was the aquaculture animal. The randomized complete block design was hired to conduct this experiment to eliminate the greenhouse position factors.
The environmental conditions, such as air temperature, relative humidity, and light intensity, were closely monitored and recorded throughout the experiment. The environment temperature and relative humidity were monitored using a Xiaomi lywsd02 temperature and humidity sensor. At the same time, the light intensity was monitored at the plant level using a quantum sensor (LI-190SA) and the LI-1400 data logger (LI-COR, Inc., Lincoln, NE, USA).

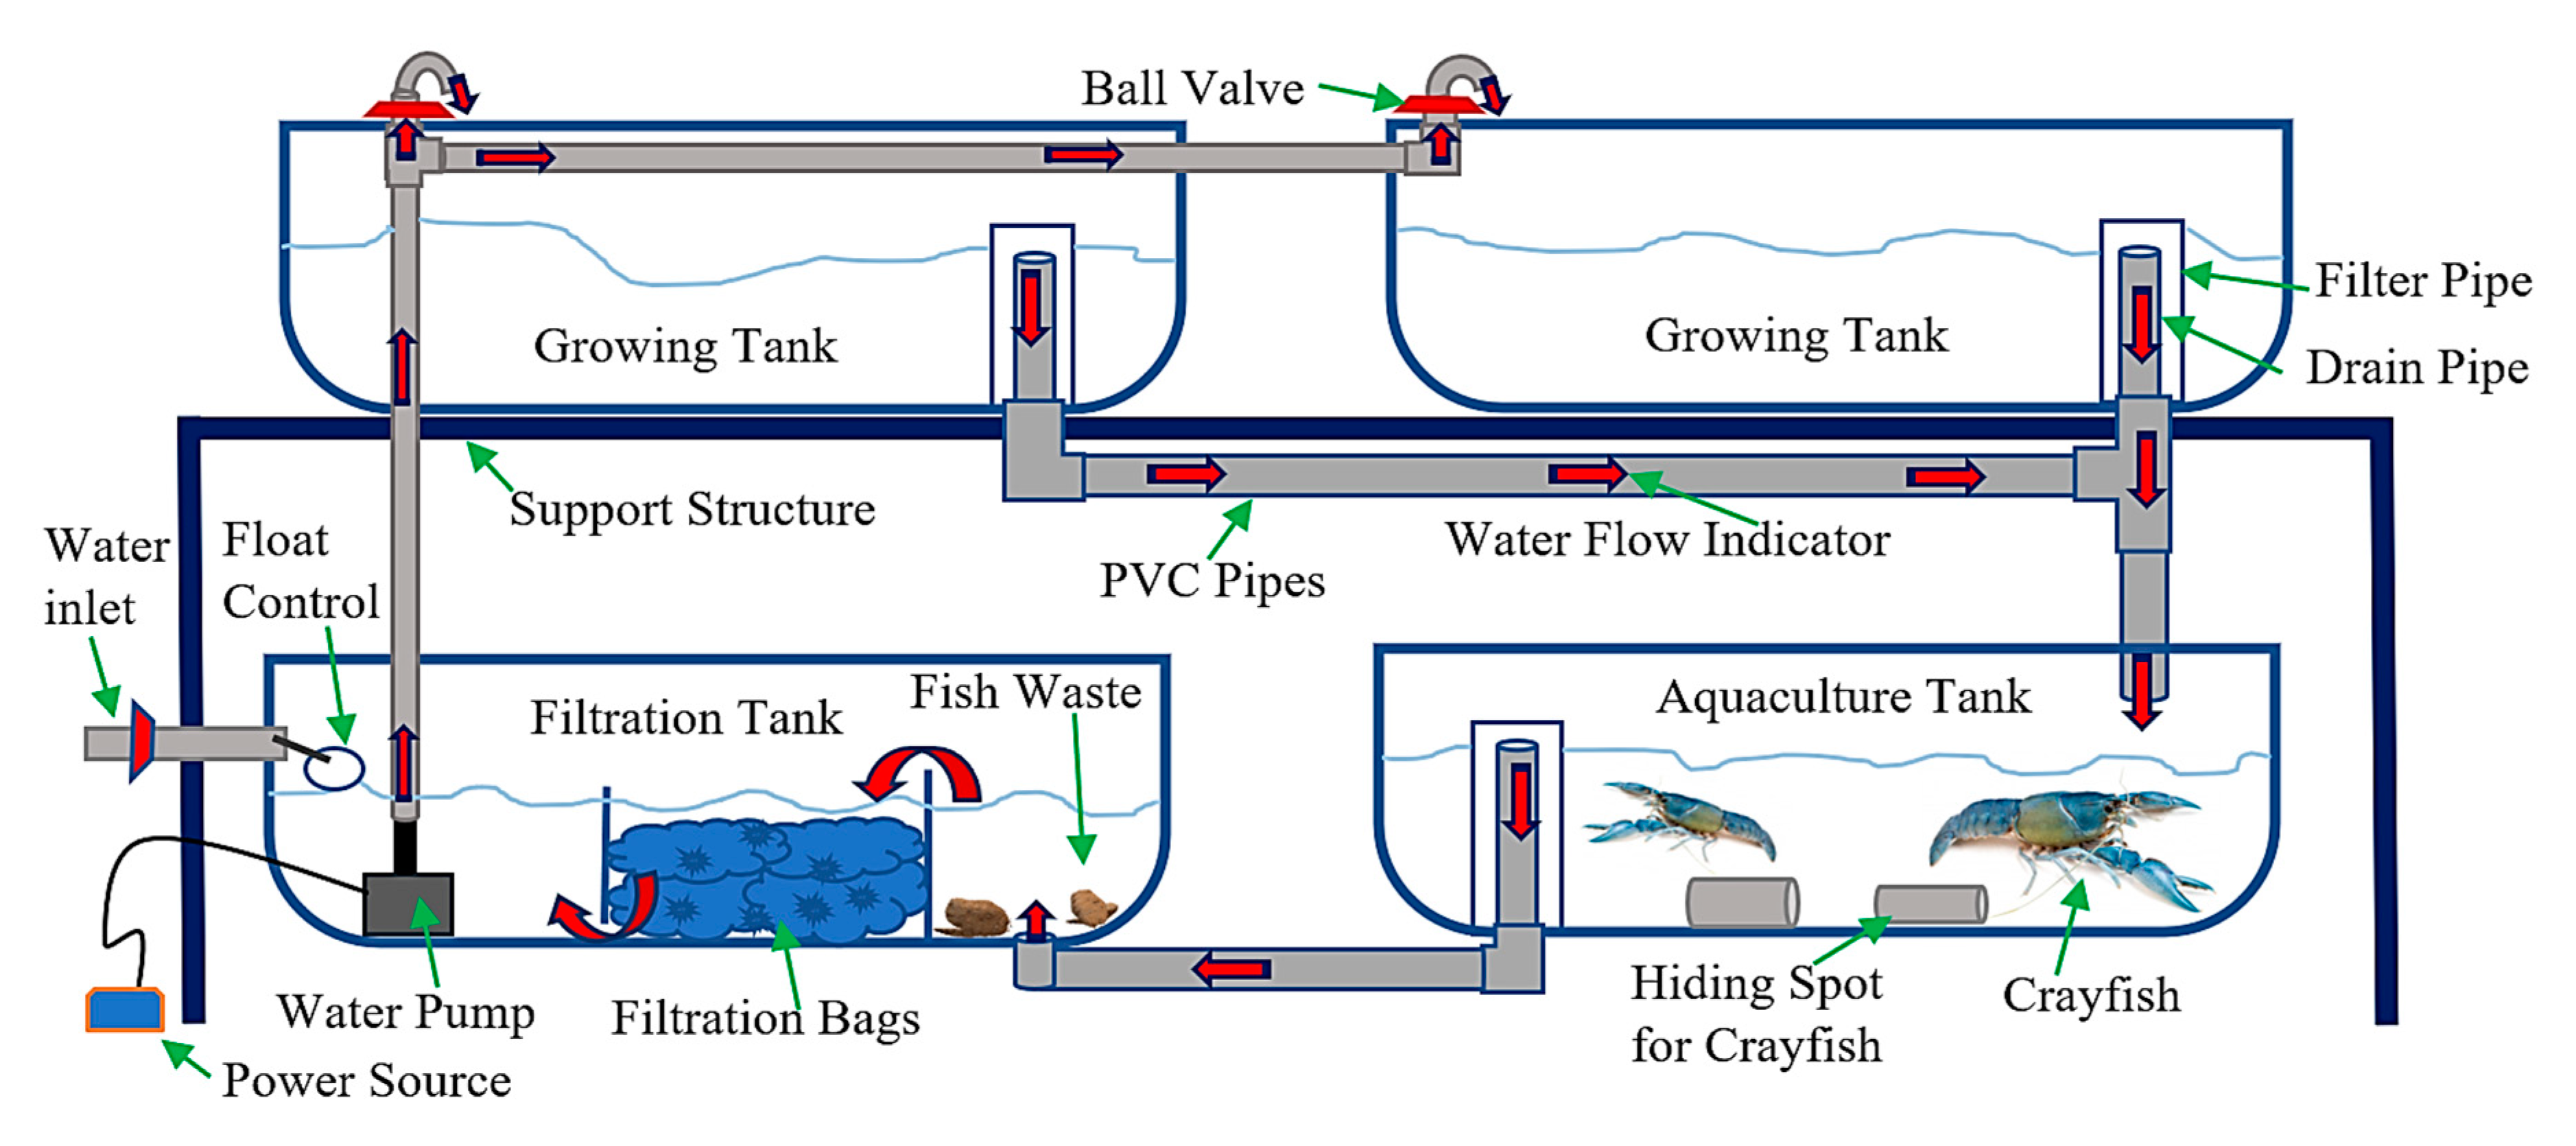
2.2. Aquaculture Management Practices

A total of 13 red claw crayfish were reared in each tank. The red claw crayfish management practices such as number count, body weight, body length, mortality count, and feeding rate were recorded before and after each trial to monitor the population and general health. The red claw crayfish were fed with the 37% protein shrimp diet (sinking pallet) with 3% of their body weight, as suggested by the Aqua Molecular Genetic Laboratory of the Department of Tropical Agriculture and International Cooperation, National Pingtung University of Science and Technology, Taiwan, R.O.C. The water quality parameters such as nitrate, nitrite, ammonia, and pH were measured using the API freshwater master test kit (Mars Fishcare North America. Inc., Chalfont, PA, USA).

2.3. Crop Management Practices

For the current study, four different trials were conducted from October 2019 until April 2020, with each trial having 42 days. Seeding was geminated in the soilless mix prepared by mixing three parts peat moss, one part perlite, one part vermiculite, and one part water. Germination percentage count and thinning of seedlings were done at the three-leaf stage. Seedlings were kept inside the same greenhouse until 28 days before transplanting. In each system, 20 lettuce and 20 pak choi were grown with an average growing area of 400 cm2 per plant. The media moisture content in the CCWD system was taken every 7 days after transplanting (DAT) using the HH2 soil moisture meter with the SM200 moisture sensor (Delta-T Devices Ltd., Cambridge, UK). The soil moisture meter was pre-calibrated using the standard curve designed by Can and Chen [17]. The crops cultivated in all four aquaponic growing systems showed iron deficiency symptoms during the test run. Therefore, the Fe-DTPA-11 was purchased from the First Chemical Works, Taipei, Taiwan, and supplemented into the systems with a concentration of 2 mg/L once every three weeks (week 1 and week 3 in each trial) [18]. This form of iron was selected based on the water pH for the individual systems.

2.4. Harvesting and Measurements

Harvesting of crops was done at DAT 7, DAT 14, DAT 21, DAT 28, DAT 35, and DAT 42. Three pak choi and three lettuce were randomly selected at each harvest, making 6 samples from each system, with 24 samples harvested and analyzed every 7 days until DAT 42. During harvesting, the plants were carefully removed from the growing cells making sure no roots were damaged, as this can affect the final results.
After harvesting, the plants were transferred to the laboratory where the shoots were detached from the roots using a sterilized scalpel blade, and the fresh shoot and root weight were taken using a top-loading balance (Shimadzu UX6200H, Shimadzu Corporation, Kyoto, Japan) with an accuracy to 0.001 g. Then, the SPAD-502 chlorophyll meter was used to determine the relative amount of chlorophyll present in the crop leaves. Three newly matured leaves of lettuce and pak choi were selected from each harvested plant, and the readings were taken at six different points of each leaf. The meter was inserted in the leaf at the maximum sliding depth of 2 cm for consistent results. Readings were carefully taken to avoid leaves getting damaged.
Then, the samples were carefully packed in the paper bags and labeled with appropriate identification. Then, these bags were placed in a precision oven (HIPoint, JIH Her Tyan Scientific Co., Ltd., Taiwan R.O.C) for drying at 80 °C for 24 h, as described in the SOP-2034 [19]. After 24 h, the samples were removed from the drying oven and cooled in a tray for 15 min before the dry shoot and root weight were measured.

2.5. Statistical Analysis

The collected results were subjected to two-way analysis of variance (ANOVA) using International Business Machines SPSS statistics for Windows, version 26 (International Business Machines Corporation, Armonk, NY, USA). The effects of system location and the growing systems were analyzed. Within each system, the separation of means was performed using Duncan’s multiple range test at p = 0.05. All the results were expressed as means ± standard error. The graphs and charts were produced using Microsoft Excel® 2019 (Microsoft Corporation, Washington, DC, USA) and Origin 2018 software (Origin Lab Corporation., Northampton, MA, USA).

3. Results

3.1. Growing Environment Condition

For this experiment, the natural light was used in the greenhouse to grow crops; however, the light distribution within the greenhouse was affected by several factors, such as nearby buildings, trees, and the season change. In Trial 1, the significantly highest light intensity was recorded in the FR and E&F systems, followed by the CCWD and the NFT systems. In Trial 2, the CCWD system significantly had the highest light intensity, followed by the NFT, FR, and E&F systems. A significantly highest light intensity in Trial 3 was observed in the NFT system, followed by the E&F and CCWD systems, while the FR system had the lowest. In the final trial (Trial 4), the light intensity was significantly higher in the NFT and CCWD systems, which was followed by the FR system, while the E&F system had the lowest (Table 1). The results in Table 1 clearly show that the light intensity was higher in location B throughout the experiment. The results also indicated that location C had the highest light intensity in Trial 1, Trial 2, and Trial 4; however, in Trial 3, the highest light intensity was recorded at location A (Table 1).
The greenhouse temperature was affected by the growing season throughout the experiment. The average temperature in Trial 1 was 25.4 °C, which was lowered in Trial 2 to 20.7 °C. In Trial 3, the average temperature was 20.3 °C, which increased to about 24.2 °C in Trial 4. The highest greenhouse temperature was recorded in Trial 1 (28.1 °C) at DAT 9 and in Trial 4 (28.1 °C) at DAT 28, which gradually lowered down until Trial 3, after which a slight increase in temperature was seen. The coldest temperature was recorded in Trial 3 (11.3 °C). The daily temperature throughout each trial did not vary significantly, except in Trial 4, where the lowest temperature was recorded at DAT 17 (Figure 3a).
The average relative humidity in Trial 1 was 84.3%, which increased to 89.6% in Trial 2. In Trial 3, the relative humidity was 87.2%, which further decreased to 86% in Trial 4. The highest relative humidity was recorded in Trial 2 (98.5%), while the lowest relative humidity was recorded in Trial 1 (76.0%). The relative humidity graph for the experiment showed that there were not many variations observed throughout each trial (Figure 3b).

3.2. Aquaculture Management Practices

The red claw crayfish’s body weight changes were calculated by subtracting the previous body weight from the initial body weight. From Trial 1 to Trial 2, crayfish total body weight decreased to about 54% in FR, 14% in CCWD, and 8% in the NFT system. The decrease in the average body weight of the crayfish was due to the concentration of the chelated form of iron added to the systems, which was corrected in the later trials by lowering the concentration to 1 mg/l. However, no increase in the total body weight of crayfish was observed in the E&F system. In Trial 3, the crayfish body weight increased to 38% in FR, 4% in CCWD, 9% in NFT, and 5% in the E&F systems. A further increase in the total body weight of crayfish was observed in Trial 4 with a 30% increase in FR, 19% in CCWD, 12% in NFT, and 13% in the E&F system. A fixed feeding rate of 3% of the total body weight was provided to the crayfish, as shown in Table 2 below.
Specific water quality parameters, such as dissolved oxygen, nitrate, nitrite, ammonia, and pH levels, were monitored throughout the study. The nitrate concentration was kept within the range of 5–160 ppm, while the pH was kept within 6.6–8.2. The ammonia and nitrite concentrations were kept below 0.50 ppm, while the dissolved oxygen was above 6 ppm. Throughout this study, all these water quality parameters were within the specific range, as specified in the previous study [11].

3.3. Leaf Chlorophyll Content and Total Leaf Number

The final results of the four trials indicated that the leaf chlorophyll content of lettuce was significantly higher in the FR and the E&F systems, followed by the CCWD and the NFT systems. For pak choi, the leaf chlorophyll content was significantly the highest in the CCWD system, followed by the NFT system, while the E&F and the FR systems had the lowest (Table 3).
The two-way ANOVA results indicated that the system location significantly affected the leaf chlorophyll content of both lettuce and pak choi, while the growing systems significantly affected the leaf chlorophyll content of pak choi (Table 3).
The total leaf number of lettuce was significantly the highest in the CCWD system, followed by the NFT and FR systems, and the E&F system. For pak choi, the total leaf number was significantly the highest in the CCWD system, followed by the NFT, FR, and E&F systems (Table 3).
The two-way ANOVA results indicated that the system location significantly affected the total leaf number of pak choi, while the growing systems significantly affected the total leaf number of both lettuce and pak choi (Table 3).

3.4. Root and Shoot Biomass

For lettuce, the results showed that the shoot fresh weight was significantly higher in the CCWD, NFT, and the FR systems, while the E&F system had the lowest. The shoot dry weight was significantly higher in the CCWD and the NFT systems, followed by the FR and the E&F systems. A higher root fresh weight in the NFT and the FR systems were observed, followed by the CCWD and the E&F systems. The root dry weight was significantly the highest in the CCWD system, followed by the NFT, FR, and E&F systems. The two-way ANOVA indicated that the growing systems significantly affected the shoot and root biomass. However, the system location only affected the root dry weight of lettuce (Table 4).
For pak choi, the result indicated that the shoot fresh weight was significantly higher in the CCWD, NFT, and the FR systems, while the E&F system had the lowest. The significantly highest shoot dry weight was observed in the CCWD system, followed by the FR and the NFT systems, while the E&F system had the lowest. The root fresh weight was significantly the highest in the NFT system, followed by the CCWD and the FR systems, while the E&F system had the lowest. A significantly highest root dry weight was observed in the CCWD system, followed by the NFT and the FR systems, while the E&F system had the lowest. The two-way ANOVA indicated that both the system location and growing systems significantly affected the shoot and root biomass of pak choi (Table 4).

3.5. Growth Analysis

For lettuce, the result showed that the leaf area index was significantly the highest in the CCWD system, while the E&F system recorded the lowest. The crop growth rate was significantly the highest in the CCWD system, followed by the NFT and the FR systems, while the E&F system had the lowest. No significant differences in the net assimilation rate, relative growth rate, and the root to shoot ratio of lettuce were observed among the four aquaponic growing systems.
The two-way ANOVA indicated that the system location did not significantly affect the leaf area index, net assimilation rate, relative growth rate, and the root to shoot ratio. However, the growing system significantly affected the leaf area index and the lettuce’s crop growth rate. (Table 5).
In the case of pak choi, the results indicated that the leaf area index, net assimilation rate, and the crop growth rate were significantly the highest in the CCWD system compared to the other systems. No significant differences in the relative growth rate and the root-to-shoot ratio were observed among the four aquaponic growing systems.
The two-way ANOVA indicated that the system location and the growing systems significantly affected the leaf area index, net assimilation rate, and the crop growth rate. However, the system location and growing systems did not significantly affect the relative growth rate and the root-to-shoot ratio of pak choi (Table 5).

4. Discussion

The experimental greenhouse was constructed with a concrete and metal framework, the sides were covered with polyethylene materials, and there were glass rooftops. It measured 19.5 m long, 8.2 m wide, and 3.7 m high and was divided into three different growing rooms. The experimental room located on the southern side of the greenhouse measured 3.7 m long, 5.9 m wide, and 3.7 m high. This experimental greenhouse room was equipped with a fan and pad cooling system, shading net, and the growing environment monitoring system.
All four aquaponic growing systems were able to grow lettuce and pak choi with adequate root-to-shoot ratios and the relative growth rate (RGR) results. The root-to-shoot ratio indicated the potential of supportive functions (water and nutrient uptake) relative to the potential of growth functions (light energy harvest) [20]. An increase in the root-to-shoot ratio could lead to abnormal growth and physiological disorders in plants [21,22]. On the other hand, the RGR expresses the dry weight increase in a time interval in relation to the initial weight [23,24]. The current study showed that both lettuce and pak choi had stable root-to-shoot ratios and RGR results, which indicated that the plants were provided with enough resources to grow successfully without any forms of stress. Similar results were obtained in another study, indicating that a stable RGR was achieved when enough resources (light, nutrients, water) were available for plants to grow successfully [25].
Furthermore, the importance of vegetative growth is simply to produce a large enough photosynthetic factory to obtain maximum yields; therefore, the shoot fresh weight of the leafy vegetables can be used to determine the final yield [13]. However, the total leaf number and the LAI of leafy vegetables can also determine the final yield [26,27,28]. The results of this study showed that the total leaf number and the LAI of both lettuce and pak choi were significantly the highest in the CCWD system. At the same time, the net assimilation rate (NAR) could be used to determine the net gain of photosynthate per unit leaf area and can be used to determine the photosynthetic efficiency of a plant [13,24]. The results of this study showed that the NAR of lettuce had no significant differences among the four aquaponic growing systems; however, the NAR of pak choi was significantly the highest in the CCWD system. The CGR is a derivative of the LAI, and the NAR and is used to measure the growth of a plant on a unit growing area per unit time basis and can be used to interpret the yield differences among the crops [13]. The highest CGR results in this study for both lettuce and pak choi were observed in the CCWD system. The study showed that the LAI of lettuce had the highest contribution toward the CGR results, while for the pak choi, both LAI and the NAR contributed equally toward the CGR results. Both shoot fresh weight and the CGR results indicated that the substrate-based cultivation system incorporated with aquaculture had the best performances throughout the experiment.
The chlorophyll content of leafy vegetables can be used as visible parameters of the quality of vegetables [29]. The results of this study showed that the CCWD system could be used to cultivate a better quality of both lettuce and pak choi, while the FR and the E&F systems could be used to cultivate a better quality of lettuce only.

5. Conclusions

This experiment’s overall results indicated that the CCWD system, a water-saving, energy-free, and low-maintenance capillary sub-irrigation system [16,30], had the best performance throughout the experiment, followed by the NFT, FR, and the E&F systems. These aquaponic growing systems showed potential in alternative farming applications and could be promoted as a backyard, balcony, or indoor growing system. The advantages of these aquaponic growing systems over the traditional farming systems are higher density growth, lower water usage, year-round crop production, eradication of pests and diseases, and elimination of weeds. These advantages can be directly applied to the Pacific Island countries or regions facing problems related to food security issues. However, further research on the feasibility of each system in a specific situation is needed.

Author Contributions

Conceptualization, L.S.S.; Data curation, L.S.S.; Formal analysis, L.S.S.; Investigation, L.S.S.; Methodology, L.S.S.; Supervision, G.S.C.; Validation, G.S.C.; Writing—original draft, L.S.S.; Writing—review and editing, G.S.C. All authors have read and agreed to the published version of the manuscript.

Funding

This research received no external funding.

Acknowledgments

The authors would like to thank the Controlled Environment Plant Physiology laboratory members, Peiliti Sosene and Rusta Bidari, for their help throughout the research. The authors also would like to thank the Aqua Molecular Genetic laboratory of the Department of Tropical Agriculture and International Cooperation, National Pingtung University of Science and Technology, Taiwan, R.O.C., for assisting us in providing information and the feed for crayfishes.

Conflicts of Interest

The authors declare no conflict of interest.

References

  1. United Nations; Department of Economic and Social Affairs; Population Division. World Population Prospects 2019: Highlights; UN: New York, NY, USA, 2019; ISBN 978-92-1-148316-1. [Google Scholar]
  2. Godfray, H.C.J.; Beddington, J.R.; Crute, I.R.; Haddad, L.; Lawrence, D.; Muir, J.F.; Pretty, J.; Robinson, S.; Thomas, S.M.; Toulmin, C. Food security: The challenge of feeding 9 billion people. Science 2010, 327, 812–818. [Google Scholar] [CrossRef] [PubMed] [Green Version]
  3. Nastis, S.A.; Michailidis, A.; Chatzitheodoridis, F. Climate change and agricultural productivity. Afr. J. Agric. Res. 2012, 7, 4885–4893. [Google Scholar] [CrossRef]
  4. Lemi, T. Effects of Climate Change Variability on Agricultural Productivity. Int. J. Environ. Sci. Nat. Resour. 2019, 17. [Google Scholar] [CrossRef]
  5. Pant, K.P. Effects of Agriculture on Climate Change: A Cross Country Study of Factors Affecting Carbon Emissions. J. Agric. Environ. 2009, 10, 84–102. [Google Scholar] [CrossRef] [Green Version]
  6. Mirza, M.M.Q. Climate change and extreme weather events: Can developing countries adapt? Clim. Policy 2003, 3, 233–248. [Google Scholar] [CrossRef]
  7. Nurse, L.A.; McLean, R.F.; Agard, J.; Briguglio, L.P.; Duvat-Magnan, V.; Pelesikot, N.; Tompkins, E.; Webb, A. Small Islands. In Climate Change 2014: Impacts, Adaptation, and Vulnerability. Part B: Regional Aspects. Contribution of Working Group II to the Fifth Assessment Report of the Intergovernmental Panel on Climate Change; Cambridge University Press: Cambridge, UK; New York, NY, USA, 2014; pp. 1613–1654. [Google Scholar]
  8. Yep, B.; Zheng, Y. Aquaponic trends and challenges–A review. J. Clean. Prod. 2019, 228, 1586–1599. [Google Scholar] [CrossRef]
  9. Bernstein, S. Aquaponic Gardening: A Step-by-Step Guide to Raising Vegetables and Fish Together; New Society Publishers: Gabriola, BC, Canada, 2011; ISBN 978-1-55092-489-3. [Google Scholar]
  10. Rizal, A.; Dhahiyat, Y.; Andriani, Y.; Handaka, A.A.; Sahidin, A. The economic and social benefits of an aquaponic system for the integrated production of fish and water plants. In Proceedings of the IOP Conference Series: Earth and Environmental Science, Banda Aceh, Indonesia, 26–27 September 2018; IOP Publishing: Bristol, UK, 2018; Volume 137, p. 012098. [Google Scholar]
  11. Somerville, C.; Cohen, M.; Pantanella, E.; Stankus, A.; Lovatelli, A. Small-Scale Aquaponic Food Production: Integrated Fish and Plant Farming; FAO Fisheries and Aquaculture Technical Paper 589; FAO: Rome, Italy, 2014; pp. 1–262. [Google Scholar]
  12. Schneider, J.; Thiesen, L.; Engroff, T.; Holz, E.; Altíssimo, B. Growth analysis of lettuce under different substrate compositions. Adv. Hortic. Sci. 2018, 32, 221–227. [Google Scholar]
  13. Brown, R.H. Growth of the Green Plant. In Physiological Basis of Crop Growth and Development; John Wiley & Sons, Ltd.: Hoboken, NJ, USA, 2015; pp. 153–174. ISBN 978-0-89118-572-7. [Google Scholar]
  14. Anten, N.P.R.; Ackerly, D.D. A new method of growth analysis for plants that experience periodic losses of leaf mass. Funct. Ecol. 2001, 15, 804–811. [Google Scholar] [CrossRef]
  15. Fraile-Robayo, R.D.; Álvarez-Herrera, J.G.; Reyes, A.J.M.; Álvarez-Herrera, O.F.; Fraile-Robayo, A.L. Evaluation of the growth and quality of lettuce (Lactuca sativa L.) in a closed recirculating hydroponic system. Agron. Colomb. 2017, 35, 216–222. [Google Scholar] [CrossRef]
  16. Chen, G.S. Closed Capillary Water Distribution System For Planters. People’s Republic of China Patent ZL 200910224303.0, 17 November 2009. [Google Scholar]
  17. Can, K.J.; Chen, G.S. Automated Capillary Water Distribution System for Greenhouse Vegetable Production, Department of Tropical Agriculture and International Cooperation; National Pingtung University of Science and Technology: Pingtung, Taiwan, 2019. [Google Scholar]
  18. Rakocy, J.E.; Bailey, D.S.; Shultz, R.C.; Thoman, E.S. Update on tilapia and vegetable production in the UVI aquaponic system. In Proceedings of the New dimensions on farmed Tilapia: Sixth international symposium on Tilapia in Aquaculture, Manila, Philippines, 12–16 September 2004; pp. 12–16. [Google Scholar]
  19. Scientific Engineering Response and Analytic Services. Standard Operating Procedure: Plant Biomass Determination. Available online: https://clu-in.org/download/ert/2034-R00.pdf (accessed on 6 August 2020).
  20. Agathokleous, E.; Belz, R.G.; Kitao, M.; Koike, T.; Calabrese, E.J. Does the root to shoot ratio show a hormetic response to stress? An ecological and environmental perspective. J. For. Res. 2019, 30, 1569–1580. [Google Scholar] [CrossRef] [Green Version]
  21. Taiz, L.; Zeiger, E. Responses and adaptations to abiotic stress. In Plant Physiology, 5th ed.; Sinauer Associates Inc.: Sunderland, MA, USA, 2010; pp. 755–778. [Google Scholar]
  22. Kalb, T.; Chang, L.-C. Suggested cultural practices for heading Chinese cabbage. AVRDG Pub. 2005, 5, 642. [Google Scholar]
  23. Pandey, R.; Paul, V.; Das, M.; Meena, M.; Meena, R.C. Plant Growth Analysis. In Physiological Techniques Analyze the Impact Climate Change on Crop Plants; Indian Agricultural Research Institute (IARI): New Delhi, India, 2017; 103p. [Google Scholar]
  24. Pearce, R.B.; Mitchell, R.L.; Gardner, F.P. Physiology of Crop Plants. In Physiology of Crop Plants; Iowa State University Press: Iowa, IA, USA, 1985; pp. 187–208. [Google Scholar]
  25. BLACKMAN, V.H. The Compound Interest Law and Plant Growth. Ann. Bot. 1919, 33, 353–360. [Google Scholar] [CrossRef] [Green Version]
  26. Gil, M.I.; Tudela, J.A.; Martínez-Sánchez, A.; Luna, M.C. Harvest maturity indicators of leafy vegetables. Stewart Postharvest Rev. 2012, 8, 1–9. [Google Scholar]
  27. Pelil, P.; Biradar, P.; Bhagawathi, A.U.; Hejjigar, I.S. Area Index of horticulture crops and its importance. Int. J. Curr. Microbiol. Appl. Sci. 2018, 7, 505–513. [Google Scholar]
  28. Sadik, S.K.; Al-Taweel, A.A.; Dhyeab, N.S.; Khalaf, M.Z. New computer program for estimating leaf area of siveral vegetable crops. Am. Eurasian J. Sustain. Agric. 2011, 5, 304–310. [Google Scholar]
  29. Limantara, L.; Dettling, M.; Indrawati, R.; Indriatmoko; Brotosudarmo, T.H.P. Analysis on the Chlorophyll Content of Commercial Green Leafy Vegetables. Procedia Chem. 2015, 14, 225–231. [Google Scholar] [CrossRef] [Green Version]
  30. Yang, T.-H.; Chen, G.S. Interior Living Wall Water Consumption and Its Effect on Surface Temperature. J. Int. Coop. 2020, 15, 81–94. [Google Scholar]
Figure 1. Top view of the indoor layout of the experimental greenhouse room.
Horticulturae 06 00069 g001
Figure 2. Schematic diagram of the general design of the four aquaponic growing systems used in this experiment.
Horticulturae 06 00069 g002
Figure 3. The growing environment conditions within the experimental greenhouse. (a) The average greenhouse temperature recorded in each trial; (b) The average relative humidity recorded in each trial. Values in parentheses are mean ± SD (n = 24).
Horticulturae 06 00069 g003
Table 1. Average light intensity (µmol m−2 s−1) recorded in each aquaponic growing system throughout the experiment.
SystemTrial 1Trial 2Trial 3Trial 4
FR185 ± 10.2 a B158 ± 9.30 c D381 ± 34.2 c C341 ± 39.4 b A
CCWD182 ± 11.2 ab A179 ± 11.6 a C450 ± 49.0 b D365 ± 42.3 a B
NFT170 ± 14.5 b D177 ± 16.2 b B520 ± 56.0 a A370 ± 42.2 a C
E&F191 ± 9.50 a C149 ± 10.6 d A456 ± 56.9 b B310 ± 34.2 c D
Values are mean ± SE (n = 6). Means in the same column, followed by the same letter(s) are not significantly different (p ≤ 0.05). The capital letter represents the system location in each trial. A—location 1; B—location 2; C—location 3; D—location 4. FR—floating raft; CCWD—closed capillary water distribution; NFT—nutrient film technique; E&F—ebb and flow.
Table 2. The average body weight (g) and feeding rate (g) of red claw crayfish in each aquaponic growing systems throughout the experiment.
TrialFRCCWDNFTE&F
Body WeightFeed RateBody WeightFeed RateBody WeightFeed RateBody WeightFeed Rate
12276.802176.511414.231414.22
21474.401905.701313.931414.23
32397.171995.961444.321484.44
434310.32467.371634.901715.14
FR—floating raft; CCWD—closed capillary water distribution; NFT—nutrient film technique; E&F—ebb and flow.
Table 3. Leaf chlorophyll content and the total leaf number of lettuce and pak choi cultivated under different aquaponic growing systems.
Aquaponic Growing SystemsChlorophyll Content (SPAD Value)Total Leaf Number
LettucePak ChoiLettucePak Choi
FR15.7 ± 2.09 a22.3 ± 2.28 c9.00 ± 0.60 b7.08 ± 0.43 bc
CCWD13.9 ± 1.20 ab32.1 ± 1.60 a11.9 ± 0.76 a10.9 ± 0.89 a
NFT13.3 ± 0.65 b26.5 ± 0.99 b10.0 ± 0.62 b7.75 ± 0.35 b
E&F15.6 ± 1.75 a23.0 ± 1.81 c6.42 ± 0.48 c6.00 ± 0.49 c
System Location (SL)******ns**
Growing Systems (GS)ns*********
SL × GS*****ns**
Values are mean ± SE (n = 12). Means in the same column followed by different letter(s) are significantly different (p ≤ 0.05). *** = p < 0.001; ** = p < 0.01; ns = not significant at (p ≤ 0.05). SL—system location; GS—growing systems. FR—floating raft; CCWD—closed capillary water distribution; NFT—nutrient film technique; E&F—ebb and flow.
Table 4. Average shoot and root fresh weight (FW) and dry weight (DW) of lettuce and pak choi cultivated in different aquaponic growing systems.
Growing SystemsShoot FW (g)Shoot DW (g)Root FW (g)Root DW (g)
Lettuce
FR26.2 ± 3.61 a1.40 ± 0.19 ab5.54 ± 0.76 a0.41 ± 0.12 bc
CCWD37.1 ± 6.00 a2.09 ± 0.45 a4.46 ± 0.78 ab0.80 ± 0.24 a
NFT27.8 ± 4.48 a1.49 ± 0.24 a5.61 ± 0.94 a0.62 ± 0.18 ab
E&F11.0 ± 1.53 b0.60 ± 0.08 b2.40 ± 0.84 b0.27 ± 0.08 c
SLnsnsns*
GS******
SL × GSnsnsns***
Pak choi
FR55.3 ± 16.9 a3.51 ± 1.31 b4.87 ± 1.32 b0.47 ± 0.12 bc
CCWD71.4 ± 8.51 a5.99 ± 0.90 a7.62 ± 1.18 ab1.06 ± 0.20 a
NFT56.6 ± 9.59 a3.40 ± 0.65 b8.24 ± 1.46 a0.68 ± 0.10 b
E&F20.4 ± 4.11 b1.23 ± 0.25 d1.12 ± 0.33 c0.23 ± 0.12 c
SL*****
GS**********
SL × GS*nsnsns
Values are mean ± SE (n = 12). Means in the same column followed by different letter(s) are significantly different (p ≤ 0.05). *** = p < 0.001; ** = p < 0.01; * = p < 0.05; ns = not significant at (p ≤ 0.05). SL—system location; GS—growing systems. FR—floating raft; CCWD—closed capillary water distribution; NFT—nutrient film technique; E&F—ebb and flow.
Table 5. Leaf area index (LAI), net assimilation rate (NAR), crop growth rate (CGR), relative growth rate (RGR), and the root-to-shoot ratio (R:S) of lettuce and pak choi cultivated in different aquaponic systems.
GSLAINAR (mg m−2 d−1)CGR (g cm−2 d−1)RGR (g g−1 d−1)R:S Ratio
Lettuce
FR1.85 ± 0.24 b2.14 ± 0.19 a3.80 ± 0.54 ab0.91 ± 0.01 a0.21 ± 0.02 a
CCWD2.85 ± 0.40 a1.96 ± 0.35 a5.79 ± 1.24 a0.90 ± 0.02 a0.20 ± 0.02 a
NFT1.90 ± 0.32 b2.29 ± 0.19 a4.12 ± 0.69 ab0.88 ± 0.02 a0.23 ± 0.02 a
E&F0.83 ± 0.11 c2.05 ± 0.12 a1.70 ± 0.26 b0.91 ± 0.02 a0.19 ± 0.03 a
SLnsnsnsnsns
GS***ns*nsns
SL × GSnsnsnsns***
Pak choi
FR1.86 ± 0.64 b3.00 ± 0.28 b6.43 ± 2.94 b0.87 ± 0.03 a0.17 ± 0.01 a
CCWD4.02 ± 0.40 a4.25 ± 0.52 a17.3 ± 2.57 a0.89 ± 0.03 a0.18 ± 0.02 a
NFT2.20 ± 0.28 b3.16 ± 0.45 b7.72 ± 1.81 b0.80 ± 0.11 a0.23 ± 0.03 a
E&F1.61 ± 0.32 b2.72 ± 0.27 b4.88 ± 1.40 b0.86 ± 0.05 a0.15 ± 0.04 a
SL****nsns
GS******nsns
SL × GS**nsnsnsns
Values are mean ± SE (n = 12). Means in the same column followed by different letter(s) are significantly different (p ≤ 0.05). *** = p < 0.001; ** = p < 0.01; * = p < 0.05; ns = not significant at (p ≤ 0.05). SL—system location; GS—growing systems. FR—floating raft; CCWD—closed capillary water distribution; NFT—nutrient film technique; E&F—ebb and flow.
Publisher’s Note: MDPI stays neutral with regard to jurisdictional claims in published maps and institutional affiliations.

