Article

Continuous Monitoring of Olive Fruit Growth by Automatic Extensimeter in Response to Vapor Pressure Deficit from Pit Hardening to Harvest

1
Department of Agricultural, Food and Environmental Science, Marche Polytechnic University, 60131 Ancona, Italy
2
Department of Information Engineering, Marche Polytechnic University, 60131 Ancona, Italy
*
Author to whom correspondence should be addressed.
Horticulturae 2021, 7(10), 349; https://doi.org/10.3390/horticulturae7100349
Submission received: 29 July 2021 / Revised: 16 September 2021 / Accepted: 17 September 2021 / Published: 30 September 2021

Abstract

:
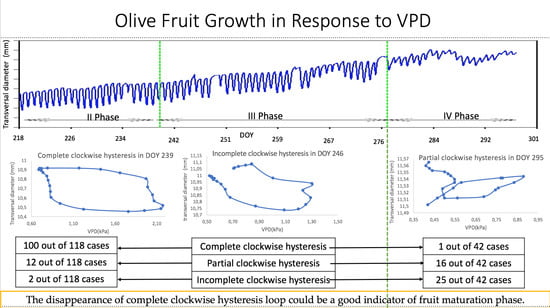
Recently, several studies on olive fruit growth have focused on circadian monitoring as an important orchard management tool. The olive fruit growth trend is described by double sigmoid model with four growth phases, where the third phase spans from the end of pit hardening to initial fruit maturation, and the last phase includes olive maturation up to fruit drop. Environmental factors play an important role in fruit growth, with vapor pressure deficit (VPD) being a keystone factor. Our experiment was designed to hourly monitor olive (Olea europaea L. cv. ‘Frantoio’) fruit transversal diameter from approximately initial pit hardening (II Phase), extension (III Phase) until harvest time (IV Phase) in the attempt to determine whether fruit growth dynamically responds to environmental variables such as diurnal VPD change in different stages of fruit development. Automatic extensimeters were applied in open field and VPD was calculated from data of our weather station. Throughout the experiment period, the circadian model of fruit growth showed two steps: shrinkage and expansion. Almost in all days of the third phase of fruit growth, daily response of transversal diameter to VPD formed complete clockwise hysteresis loops. During the fourth phase of fruit growth, with increasing fruit maturation, the complete clockwise hysteresis loop experienced some abnormality. At the fourth stage of fruit growth there were incomplete and partial clockwise hysteresis loops. We conclude that hysteresis can be employed to detect the shift between the end of the third phase (cell expansion) and the beginning of the fourth phase (fruit maturation) of fruit growth. The disappearance of the complete clockwise hysteresis loop and the substitution with incomplete, or partial clockwise hysteresis loops was observable only in the fourth stage of fruit growth. These results can be valuable for any smart fruit management of olive fruit production.

Graphical Abstract

1. Introduction

Olive (Olea europaea L.) is an evergreen tree or shrub which was originally domesticated in the Fertile crescent region, from where it spread later on, to many parts of the world with Mediterranean climate. Maintaining constant and high olive yields requires an application of specific knowledge and techniques. Olive fruit growth and maturation is a combination of physiological and biochemical changes influenced by environmental and agronomic conditions [1,2,3]. Olive fruit growth can be described by a double-sigmoid growth curve [4,5], which is divided in four growth phases. The first phase (I Phase) is characterized by rapid cell division, which induces an exponential expansion of the volume; in the second phase (II Phase) the speed of cell division diminishes, while pit is hardening and fruit size increases slowly; in the third phase (III Phase) the fruit dimension increases with rapid and linear growth continues and leads to a beginning of fruit maturation; the fourth phase (IV Phase) finishes with full ripening and eventually fruit drop.
In addition to this, the growth of the fruit is the result of complex genetic, metabolic, hormonal and environmental interactions that determine the size, shape and oil composition [5]. It is influenced and regulated by endogenous factors such as genetic differences and fruit load, and exogenous factors such as water availability and ambient temperature [6,7]. One of the most significant environmental variables is vapor pressure deficit (VPD). According to research of Amitrano et al. [8], VPD is a driver for transpiration in plants and it is critical for plants’ growth and productivity. Such degree of complexity in olive fruit growth demands a more accurate management in cultivating this crop.
Precision farming system is a management approach that has been implemented in agriculture in recent years. The ‘precision farming’ concept is based upon observing, measuring and responding to inter and intra-field variability in crops or in various aspects of animal husbandry [9]. One of its main research foci in pomology consist in monitoring of fruit transversal diameter by an application of sensors, to represent fruit growth. Observation of circadian cycles applied to fruit growth contributes to gathering information regarding this phenological stage and to yield more data for developing precision farming technologies [10,11].
Monitoring of fruit growth by following diurnal fluctuation of transversal diameter has been investigated in several species. For instance, Fishman and Génard [12] simulated a model for seasonal and diurnal growth of peach (Prunus persica (L.) Batsch), whereas Brüggenwirth et al. [13] showed the diurnal growth of sweet cherry (Prunus avium (L.) Sam). Monitoring fruit growth provided good estimations of fruit size and harvest date and granted better satisfaction of the target market in apple production [14]. Olive fruits have been studied in this regard by Fernandes et al. [15], that showed fruit growth and diurnal changes in olive (Olea europaea (L.) cv Arbequina), grown under different water regimes.
Production of highly precise instruments for accurate measurement of fruit growth has been developed and there are various experimental as well as commercial instruments [16]. Nevertheless, Morandi et al. [16] described that, in most cases, the instrument consists of a sensor, supported by a frame, placed in contact with the epidermis of the growing fruit. One aspect that bears considerably on the choice of sensor and of the materials used in constructing field probes is their ruggedness and accuracy under varying environmental conditions, including large temperature, precipitation, and air moisture changes [16].
Monitoring of fruit growth can help the Regulated Deficit Irrigation (RDI) index to optimize water consumption without diminishing yields or fruit quality. According to research of Goldhamer [17], Tavor et al. [18] and Tognetti et al. [19], pit hardening is the best phenological phase for employing RDIs in olive trees but in many cases, differences among growth stages are not evident, neither easy to access [20]. Thus, in a smart farming approach, it is hence important to find physiological parameters that can be continuously measured by the sensors. A common challenge with tree-based sensors is to adjust their output to physiologically meaningful parameters in a consistent manner [10,21,22].
The phenomenon of hysteresis in plant systems has been known for a long time, attracting the attention of many investigators for years [23]. The root of the word hysteresis is Greek and means to “lag behind”. Hysteresis is non-linear loop like behavior that does not show affine similarity with respect to time [24,25]. In other words, when the time argument of an input function is stretched or compressed, the corresponding output function is not stretched in the same way [25,26]. For instance, hysteresis as a relation between environmental factor (e.g., meteorological factors) and sap flow has been investigated in various eco systems in different geographical regions [26,27,28,29,30,31,32,33]; hysteresis was found also in the relationship between canopy conductance and temperature [34]. Furthermore, Scalisi et al. [35], examined two different olive cultivars under different irrigation regimes and explained hysteresis between fruit diameter and leaf pressure on two different olive cultivars. According to this research, there was a completely different mechanism of leaf and fruit water exchange in response to increasing water deficit in the two cultivars, which might be driven by different osmotic adjustments, cell-wall elasticity and tissue water content [35]. Recently, in the cherry fruit growth relationship with VPD, full hysteresis was found only during the maturation phase while during fruit extension phase the hysteresis was null or partial [11].
This work examined olive fruit transversal diameter versus VPD and evaluated the presence of hysteresis curves. The specific objective is to continuously describe the ‘Frantoio’ olive growth by automatic extensimeter. Besides, the fruit color ‘veraison’ was used to detect the transition between fruit growth phases. It was automatically recorded the by time-lapse video. To our knowledge, no other studies have yet evaluated the hysteresis curve of diurnal variation of olive fruit dimensions vs. VPD.

2. Materials and Methods

2.1. Site Description and Phenology

The study was conducted in 2019 in the olive grove (Olea europaea L., cv. ‘Frantoio’) of the experimental research station and botanical garden of Polytechnic University of Marche at Gallignano of Ancona (AN), Italy (43°34′06.2″ N 13°25′24.2″ E). Trees were planted 6 × 6 m and trained as free open vase. These were about 40 years old at the time of experiment. The agricultural operations, pest control and fertilization practices were accomplished following organic agricultural methods. Olive trees were grown in rainfed condition and with permanent grass cover, with mowing 3–4 times during the growing season. According to Köppen–Geiger climate classification, Gallignano is classified in the Cfb category and this is characterized by warm temperature, highly humid and warm summer [36].

2.2. Fruit Growth

In 2019, the transversal diameter (synonym of equatorial diameter) of two olive fruits (fruit A and fruit B) was measured from August 6th to October 24th (DOY (Day Of the Year) 118 to DOY 297), from the phase of pit hardening, about 55 days after blooming (DAB), until harvest. The two different fruits were selected on one representative tree. Fruit diameter was measured with highly precise DEX20 extensimeters (Dynamax Inc., Houston, TX, USA). DEX20 extensimeters measure the size of small fruits (0–25 mm). This is a caliper style device with a full bridge strain gage attached to a flexible arm. The accuracy of the extensimeter was 0.05 mm at 20 °C and the output signal expressed in millivolt varied with a range of ±5 mV. The sensor output showed both diurnal and long-term growth of fruit. Data were recorded by CR1000X data logger (Campbell scientific, Inc., Logan, UT, USA) every hour and sent to our own cloud service base on Amazon Web Service (AWS) twice per day (Figure 1). The measured daily data were normalized by Min-Max method through the equation:
x′ = 0.9 × ((xxmin)/xmaxxmin) + 0.05
where x′ is the normalized value, x is the value of the existing data, and xmin and xmax are the minimum and maximum values of the data, respectively [11].

2.3. Time-Lapse Video

The camera acquisition system was based on a custom 5Mpix RGB camera (Raspberry Pi Foundation, Cambridge, UK) with S-mount camera lens option. The device was attached to the mini-CSI port of a Raspberry Pi Zero W module (Raspberry Pi Foundation, Cambridge, UK). An IP65 enclosure ensured protection from water. Vision system was powered by a 10 W solar panel. A dedicated scheduler ensured the acquisition of images at the desired time. The acquired data were then synchronized to AWS S3 storage. Data connection was ensured by a Wi-Fi 3.5/4G powered by the solar panel. The camera was set on the orchard near to the tree to take pictures hourly (Figure 1). The images from the camera were labeled by olive maturation experts using Labelbox platform (Labelbox Inc., San Francisco, CA, USA); for each olive, the experts assigned a ripening stage according to 0–4 of Jaen index [37]. Labelbox is fully configurable platform which enables us to create and manage machine learning training data. It is able to label data accurately with automated labeling workflows. Moreover, all data and processes are connected through a single platform with a central system of record. It accelerates model training and increases performance with faster iterations (https://labelbox.com/product/platform, accessed on 15 September 2021). The ripening index yielded by the camera images illustrated the maturity phase of the population of olive fruits. On the contrary, the extensimeter did not represent data of population of olive fruits; it represented single olive fruit data. Meanwhile, the single olive fruit data was inside the data of the population of olive fruits. Therefore, the parameter of 50% ripening of population of olive fruits was employed to approve maturation phase; monitoring of population of olive fruits was performed until countable full black fruits reached 50% of all countable fruit on the picture.

2.4. Meteorological Data

Meteorological data were recorded by a Vantage pro2 precision weather station (Davis Instruments Corporation, Hayward, CA, USA) located in the olive orchard. Vantage pro2 consists of weather-link software and data logger, which transfer weather data to a computer. For the calculation of vapor pressure deficit (VPD), air temperature (T) and relative humidity (RH) data were collected from our weather station. Vapor pressure deficit was calculated as:
VPD = (1 − (RH/100)) × SVP and SVP (Pascals) = 610.7 × 107.5T/(237.3+T)
The VPD formula was recommended by Monteith and Unsworth [38]; where RH is relative humidity, SVP is saturated vapor pressure and T is temperature (°C). Our instrument was set to legal Rome time. In some part of analysis for better comparison between VPD and diameter, normalized VPD was considered. Data were normalized by Min-Max method and the equation was like Equation (1). Moreover, the other parameter used was VPD daily variation, expressed as the percentage of changing VPD in comparison with the same measured the day before. The VPD daily variation was employed to describe the possible daily different growth trend of fruit.

2.5. Hysteresis Curves

In this research, we studied the hysteresis curve of transversal diameter versus VPD. The latter has been shown to be especially important in woody plants, where it is the main variable affecting their diurnal evolution of transpiration [39]. For description of the hysteresis curve, the terms of clockwise and anticlockwise loops (or curves) were used. To obtain the whole-day picture of the hysteresis curve, the best starting point for drawing each circadian graph was sunrise, due to the physiological effect of solar energy and its role in the photosynthesis and fruit growth. Consequently, our day started from sunrise and continued for 24 h. According to the data of our weather station, sunrise time from 6th of August to 5th of September (DOY 218 to 248) was set to 6 AM, from 6th of September to 24th of October (DOY 249 to 297) was set to 7 AM. Furthermore, the graphic representation of daily fruit growth and its fluctuations were reported from the time of sunrise. To obtain the seasonal model of hysteresis, the data should be categorized dividing the growing season into different stages [34]. Therefore, with consideration of fruit growth trend in 24 h and its response to VPD, the experiment data were divided in two periods. The first period was from August 6th to October 3th (DOY 218–276) and the second period was from October 4th until end of experiment, on October 24th (DOY 277–297).

2.6. Data Analysis and Presentation

Data were analyzed using correlation and regression analysis. Pearson correlation test was used in order to determine the association between fruit diameter and VPD. From DOY 253 to 276, linear regression analyses between sensor output and time were performed to separate different slopes of fruit diameter in the third step of fruit growth. All data analyses and graph design were carried out by Sigmaplot 14.5 (Systat Software, Inc., San Jose, CA, USA).

3. Results

3.1. Fruit Growth

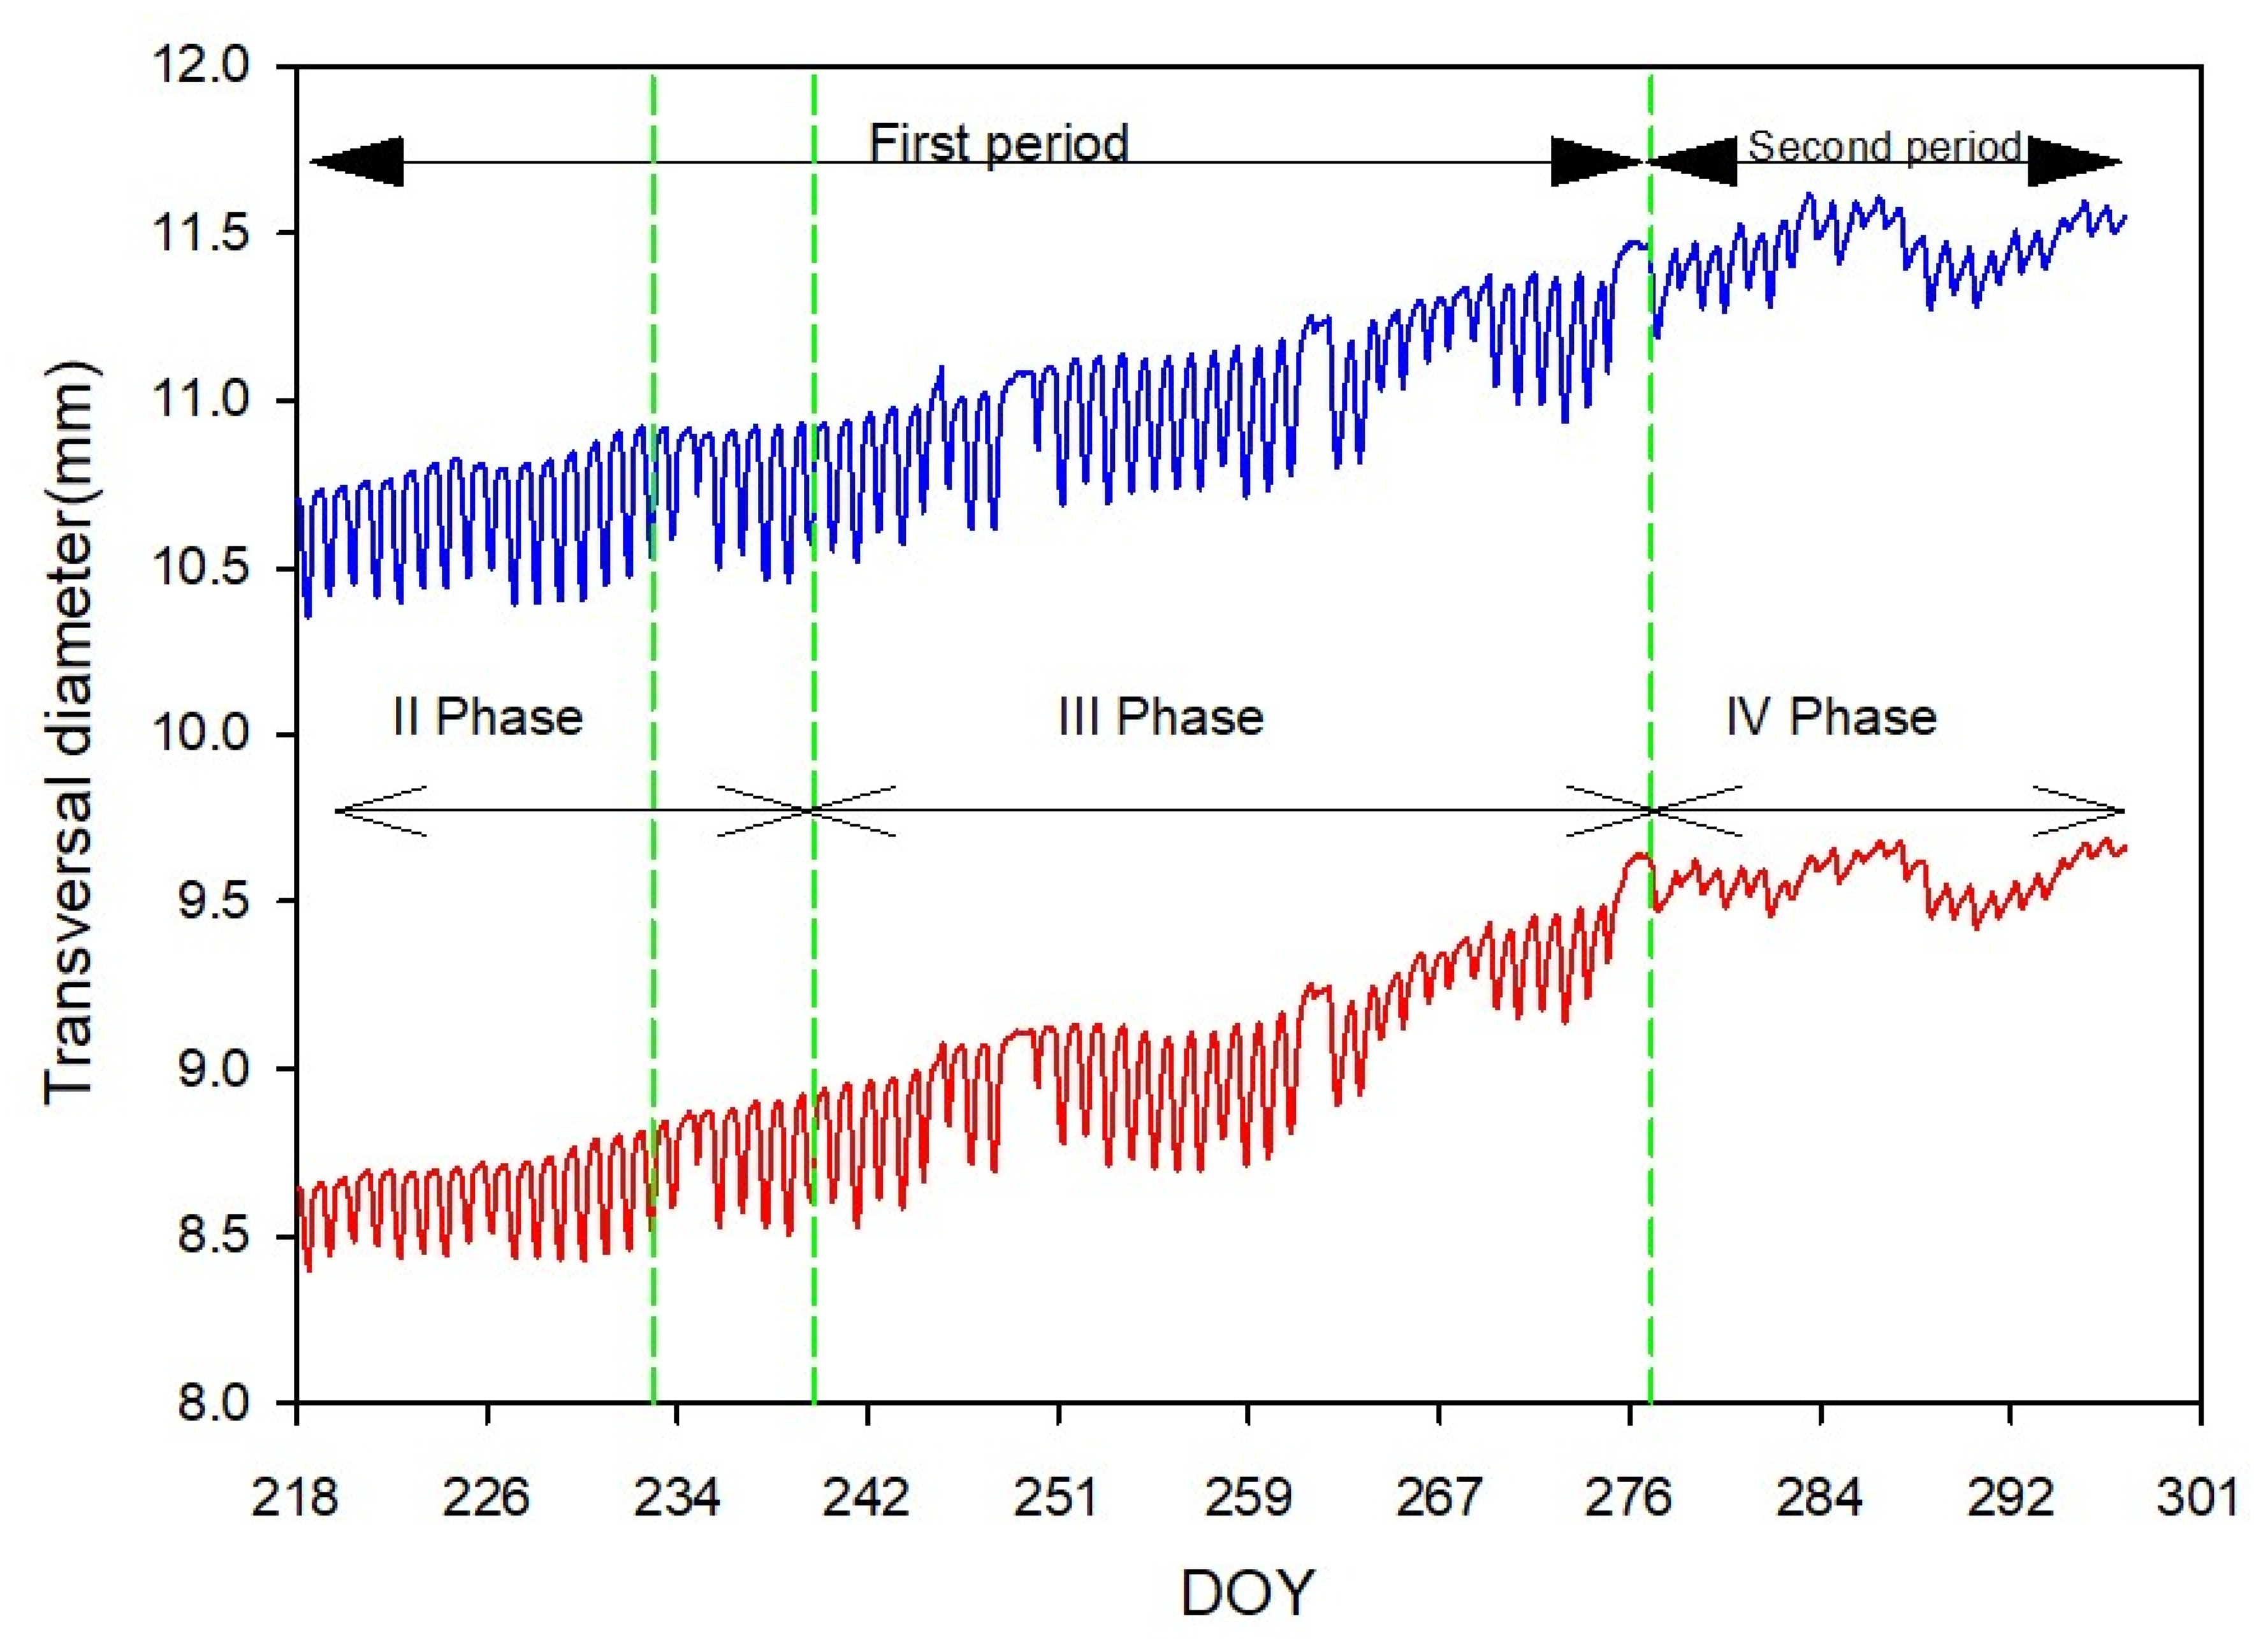
The transversal diameters of the two different fruits (fruit A and fruit B) are reported (Figure 2). Transversal diameter of fruit A started at 10.71 mm and reached 11.55 mm at harvest time, whereas for fruit B started from 8.64 mm up to 9.66 mm. Fruit transversal diameter growth was described as continuous increase with diurnal fluctuation.
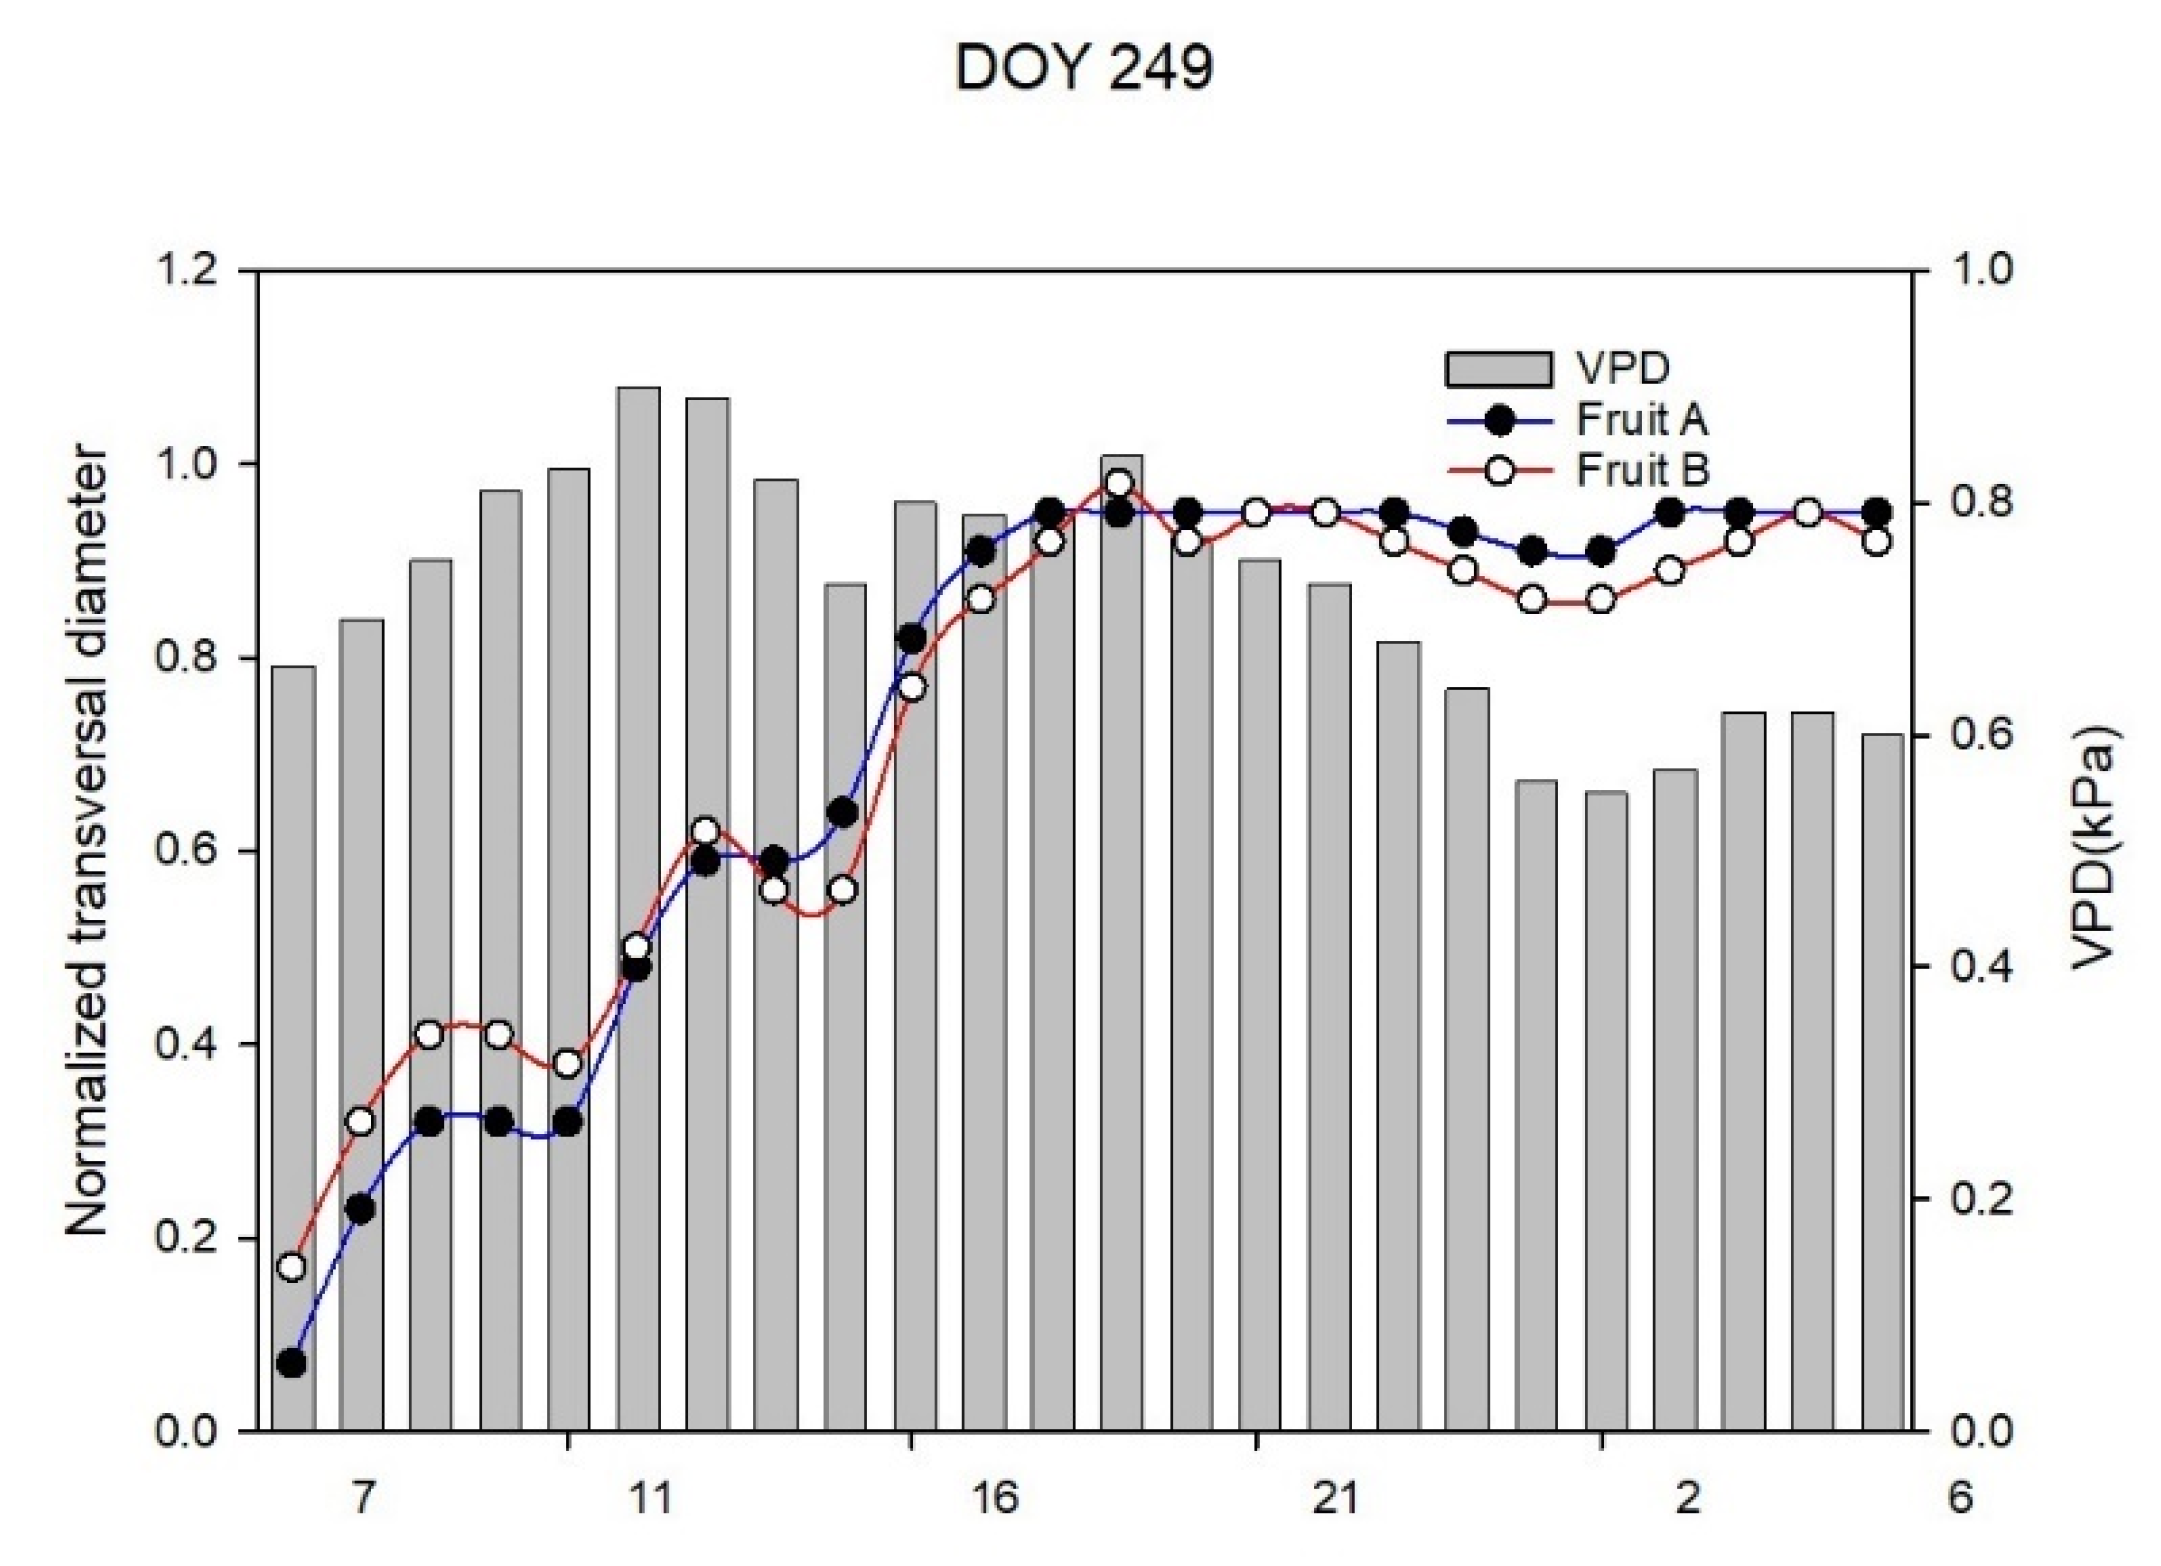
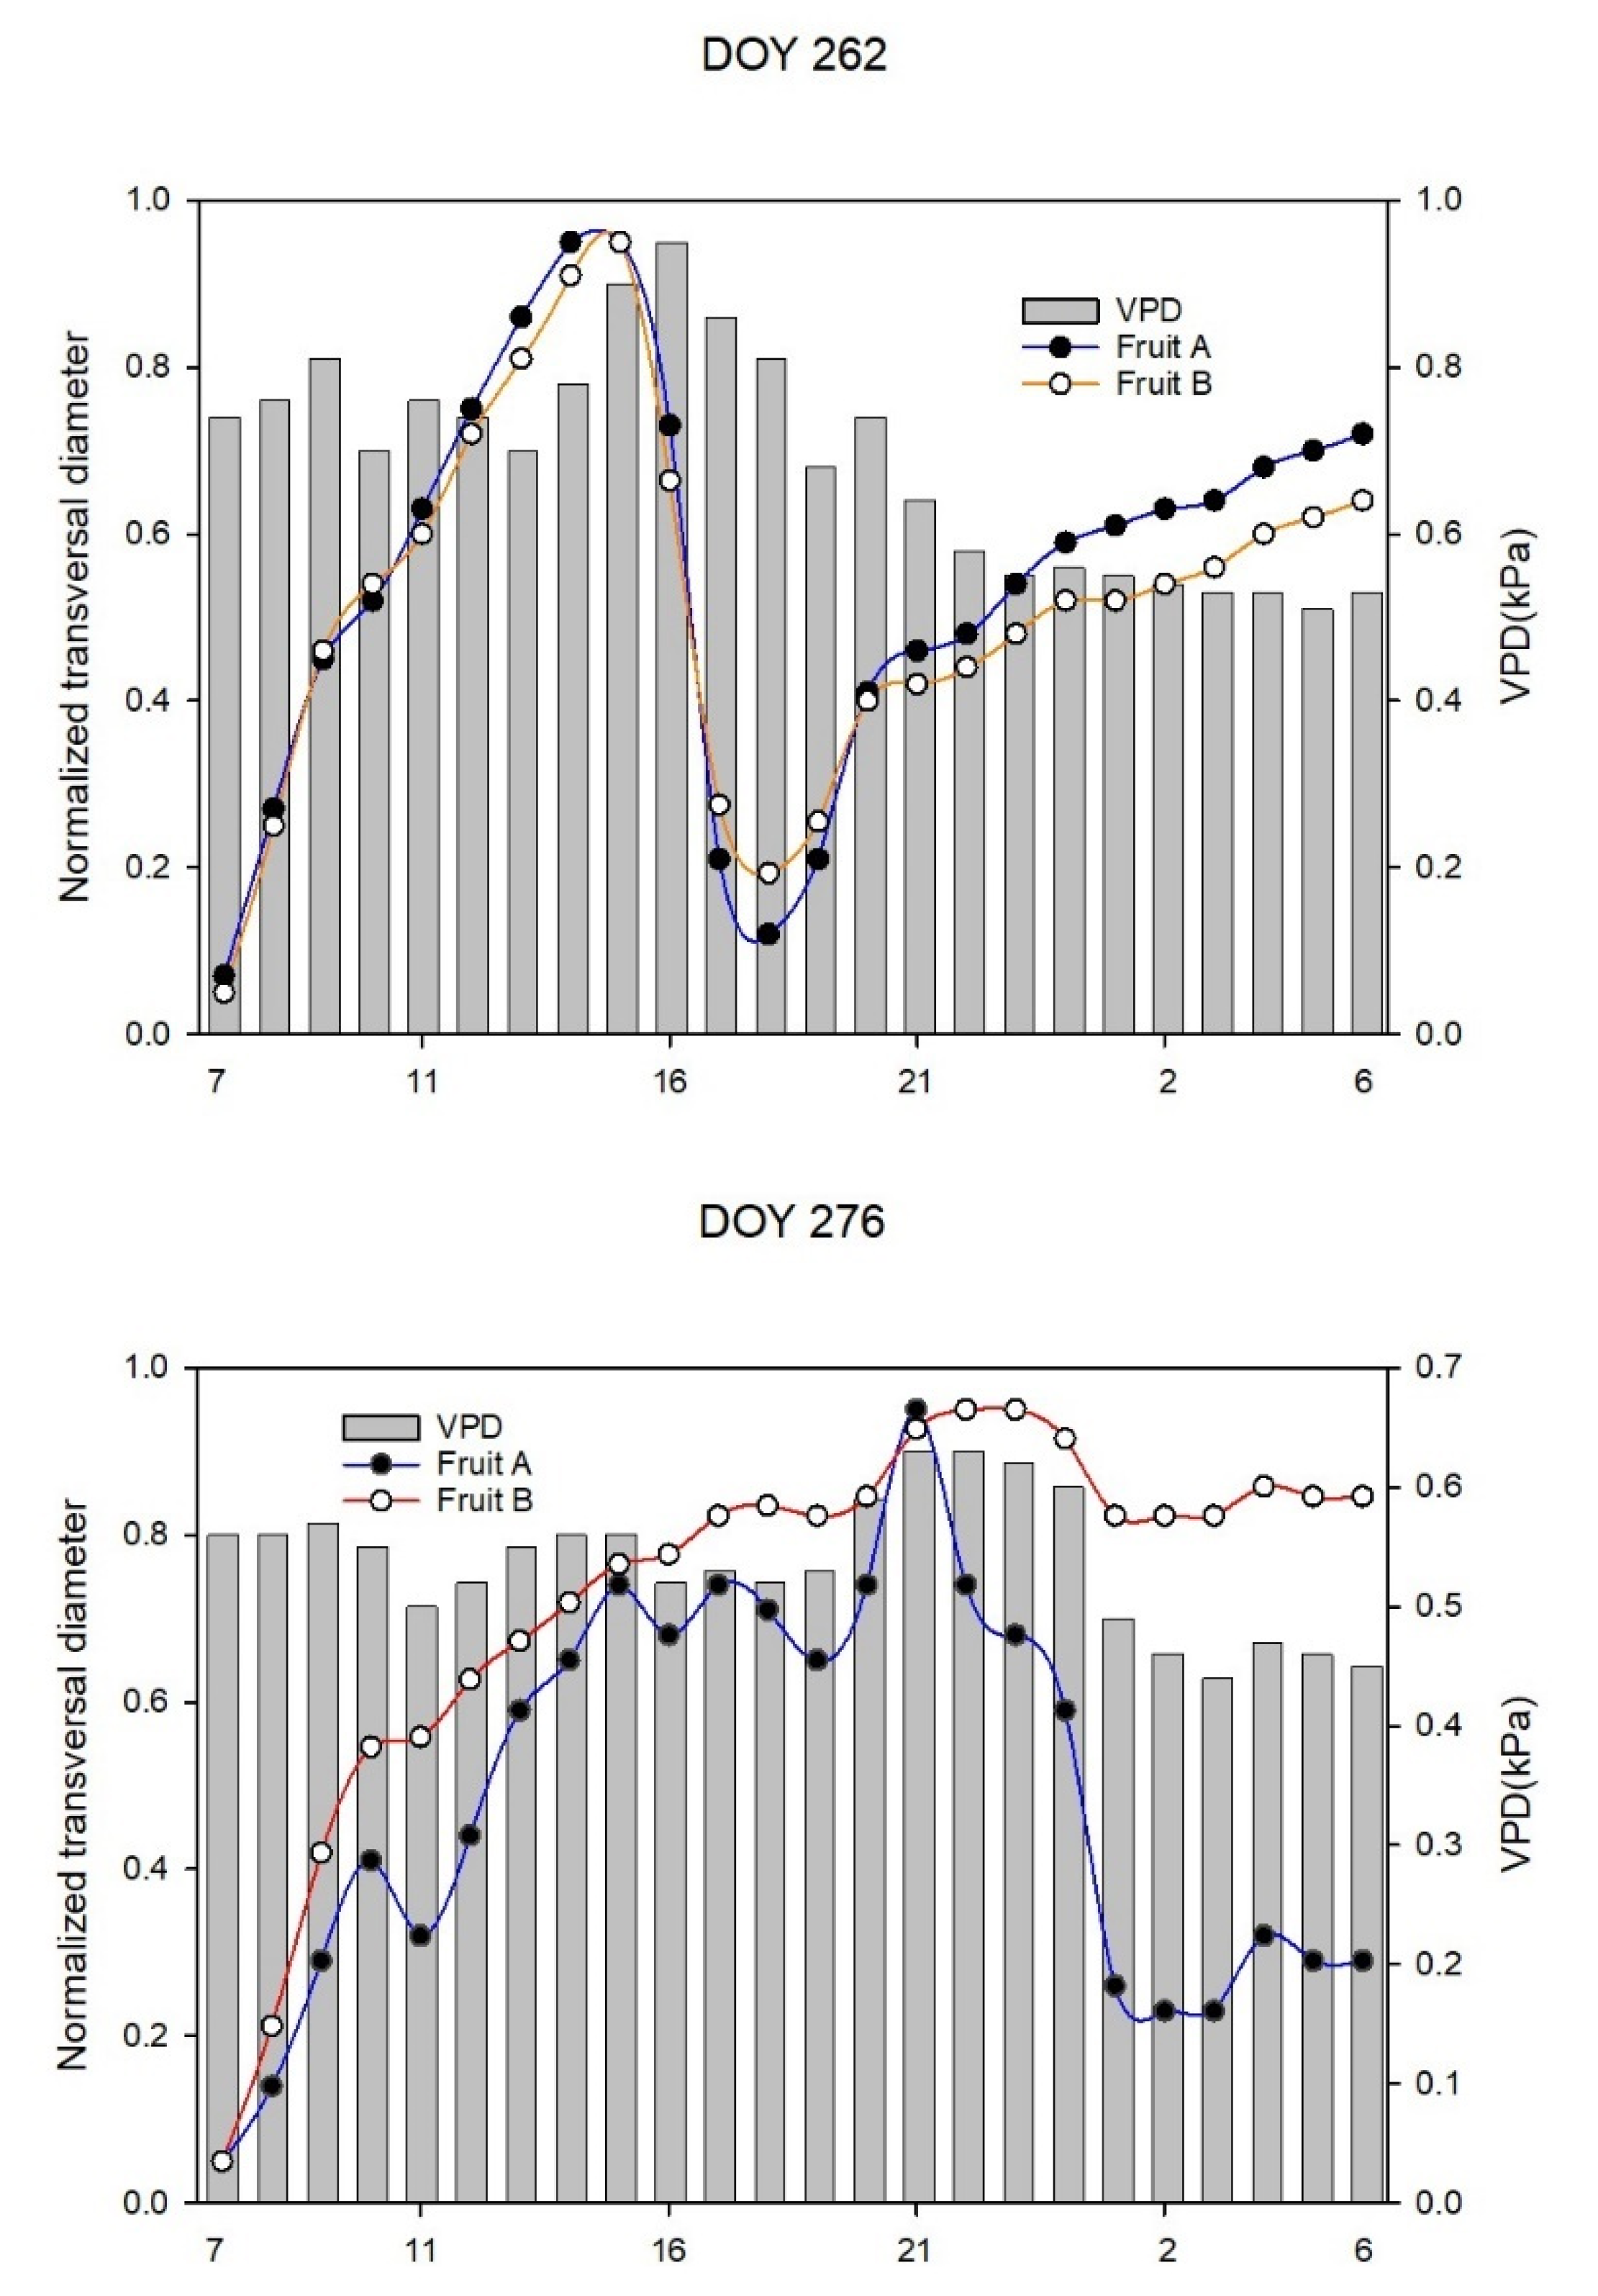
The fruit’s growth phase was divided in two periods. The first period (DOY 218–276) included II phase and the whole III phase of fruit growth. In this period, there was a sequence of fruit diameter stability, followed by a decrease and finally by a fruit diameter increase (Figure 3). Fruit transversal diameter daily trend can be described with a three steps model: stability, decreasing and increasing. Fruit transversal diameter at the end of each day was bigger than at the starting point of the same day. Nevertheless, there were 3 days (DOY 246, 263, 274) for fruit A and 1 day (DOY 263) for fruit B in which transversal diameter at the end of the day was smaller than at the starting point of same day and categorized as a day with significant transversal diameter reduction. When normalized transversal diameter of fruit at the ending point of the day had at least 0.05 units reduction in comparison with the starting point of the same day, then it was considered as a significant transversal diameter reduction. The first step of fruit growth started at sunrise, but it was different throughout the days. At the second step, the diameter downsized with dissimilar duration and slope in different days. The last step was continuous growth of diameter and continued till the end of the 24th hour of one experimental day. During this step, the diameter increased with two different slopes from DOY 218 to 252, with a steep slope followed by flatter slope. However, from DOY 253 to 276 just the steep slope was observed (Figure 3). As starting point of each experimental day was set by sunrise, there is time lag aspect which should be considered. In other words, the real time argument of sunrise should be considered with a delay. According to the findings of Novick et al. [40], it could be hypothesized that the first step of fruit growth was the sequence of fruit growth step from the day before, consequently the daily fruit growth could be explainable with two real steps (decreasing and increasing diameter), in the transversal diameter. In this first period, there were only 3 days (DOY 249, 262, 276) which did not show similar daily growth trends (Figure 4). There was no unique pattern for description of the three exception days (DOY 249, 262, 276).
In the second period of the experiment (DOY 277–297) which corresponded to the IV phase of fruit growth, daily trends of fruit growth for both fruits A and B were similar. It can be described in three steps: increasing diameter followed by decreasing diameter and again increasing diameter. Here, it also could be hypothesized that the first step of fruit growth represents a sequence of fruit growth steps from the day before, and daily fruit growth could be explainable with two real steps (decreasing and increasing growth). Moreover, data of transversal diameter at the beginning point of the day and ending point of the same day showed that there were 11 days for fruit A and 9 days for fruit B in which transversal diameter at the end of the day was smaller than the starting point of the same day. All days of the second period showed a similar pattern, two example days are shown in Figure 5.

3.2. Analysis of Diameter Growth versus VPD and Hysteresis Curves

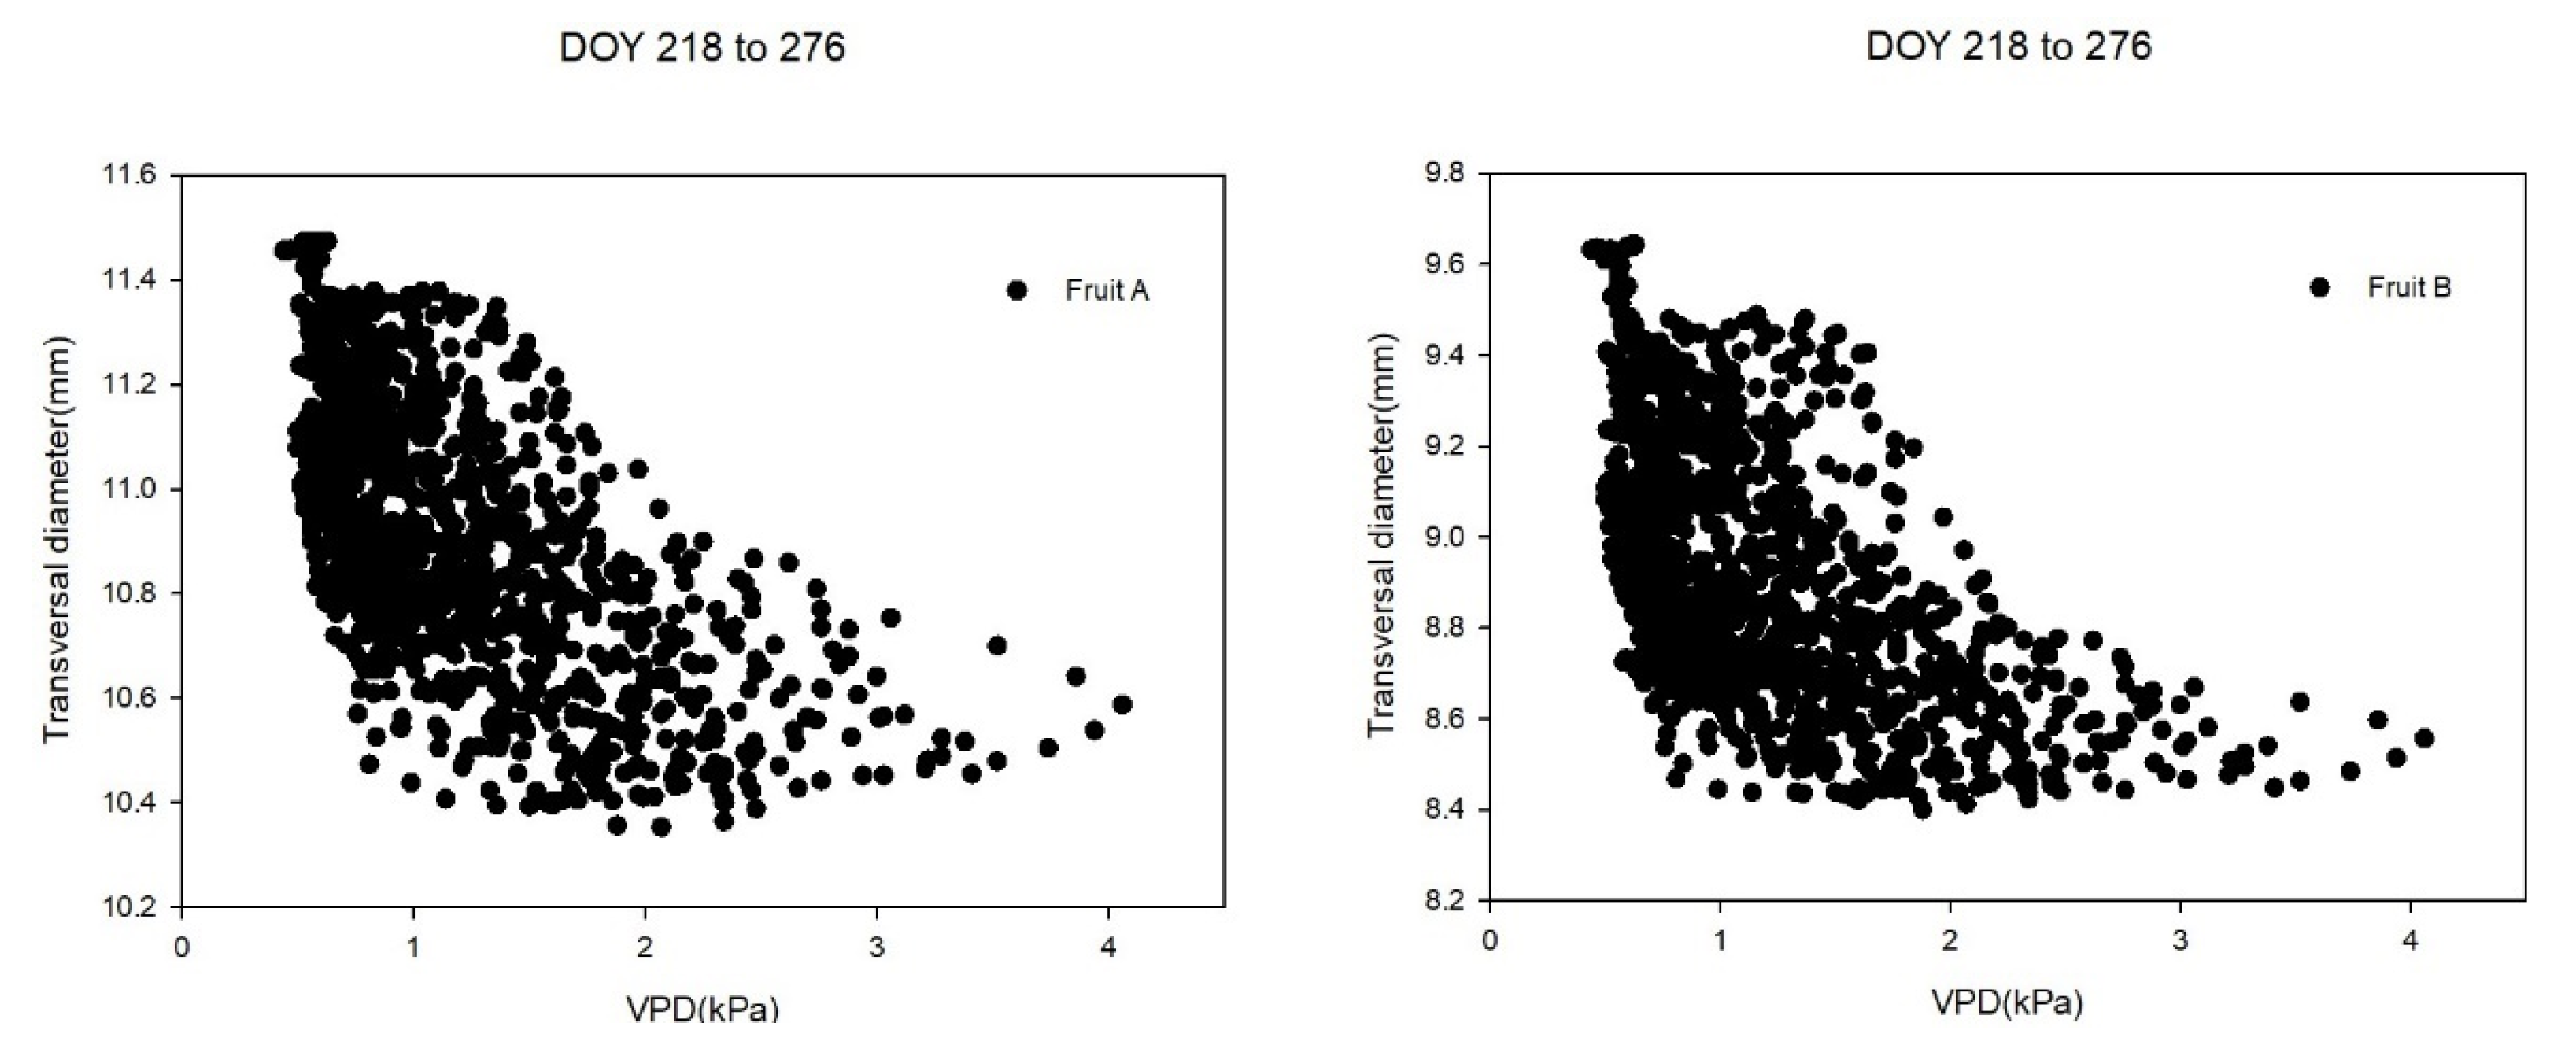
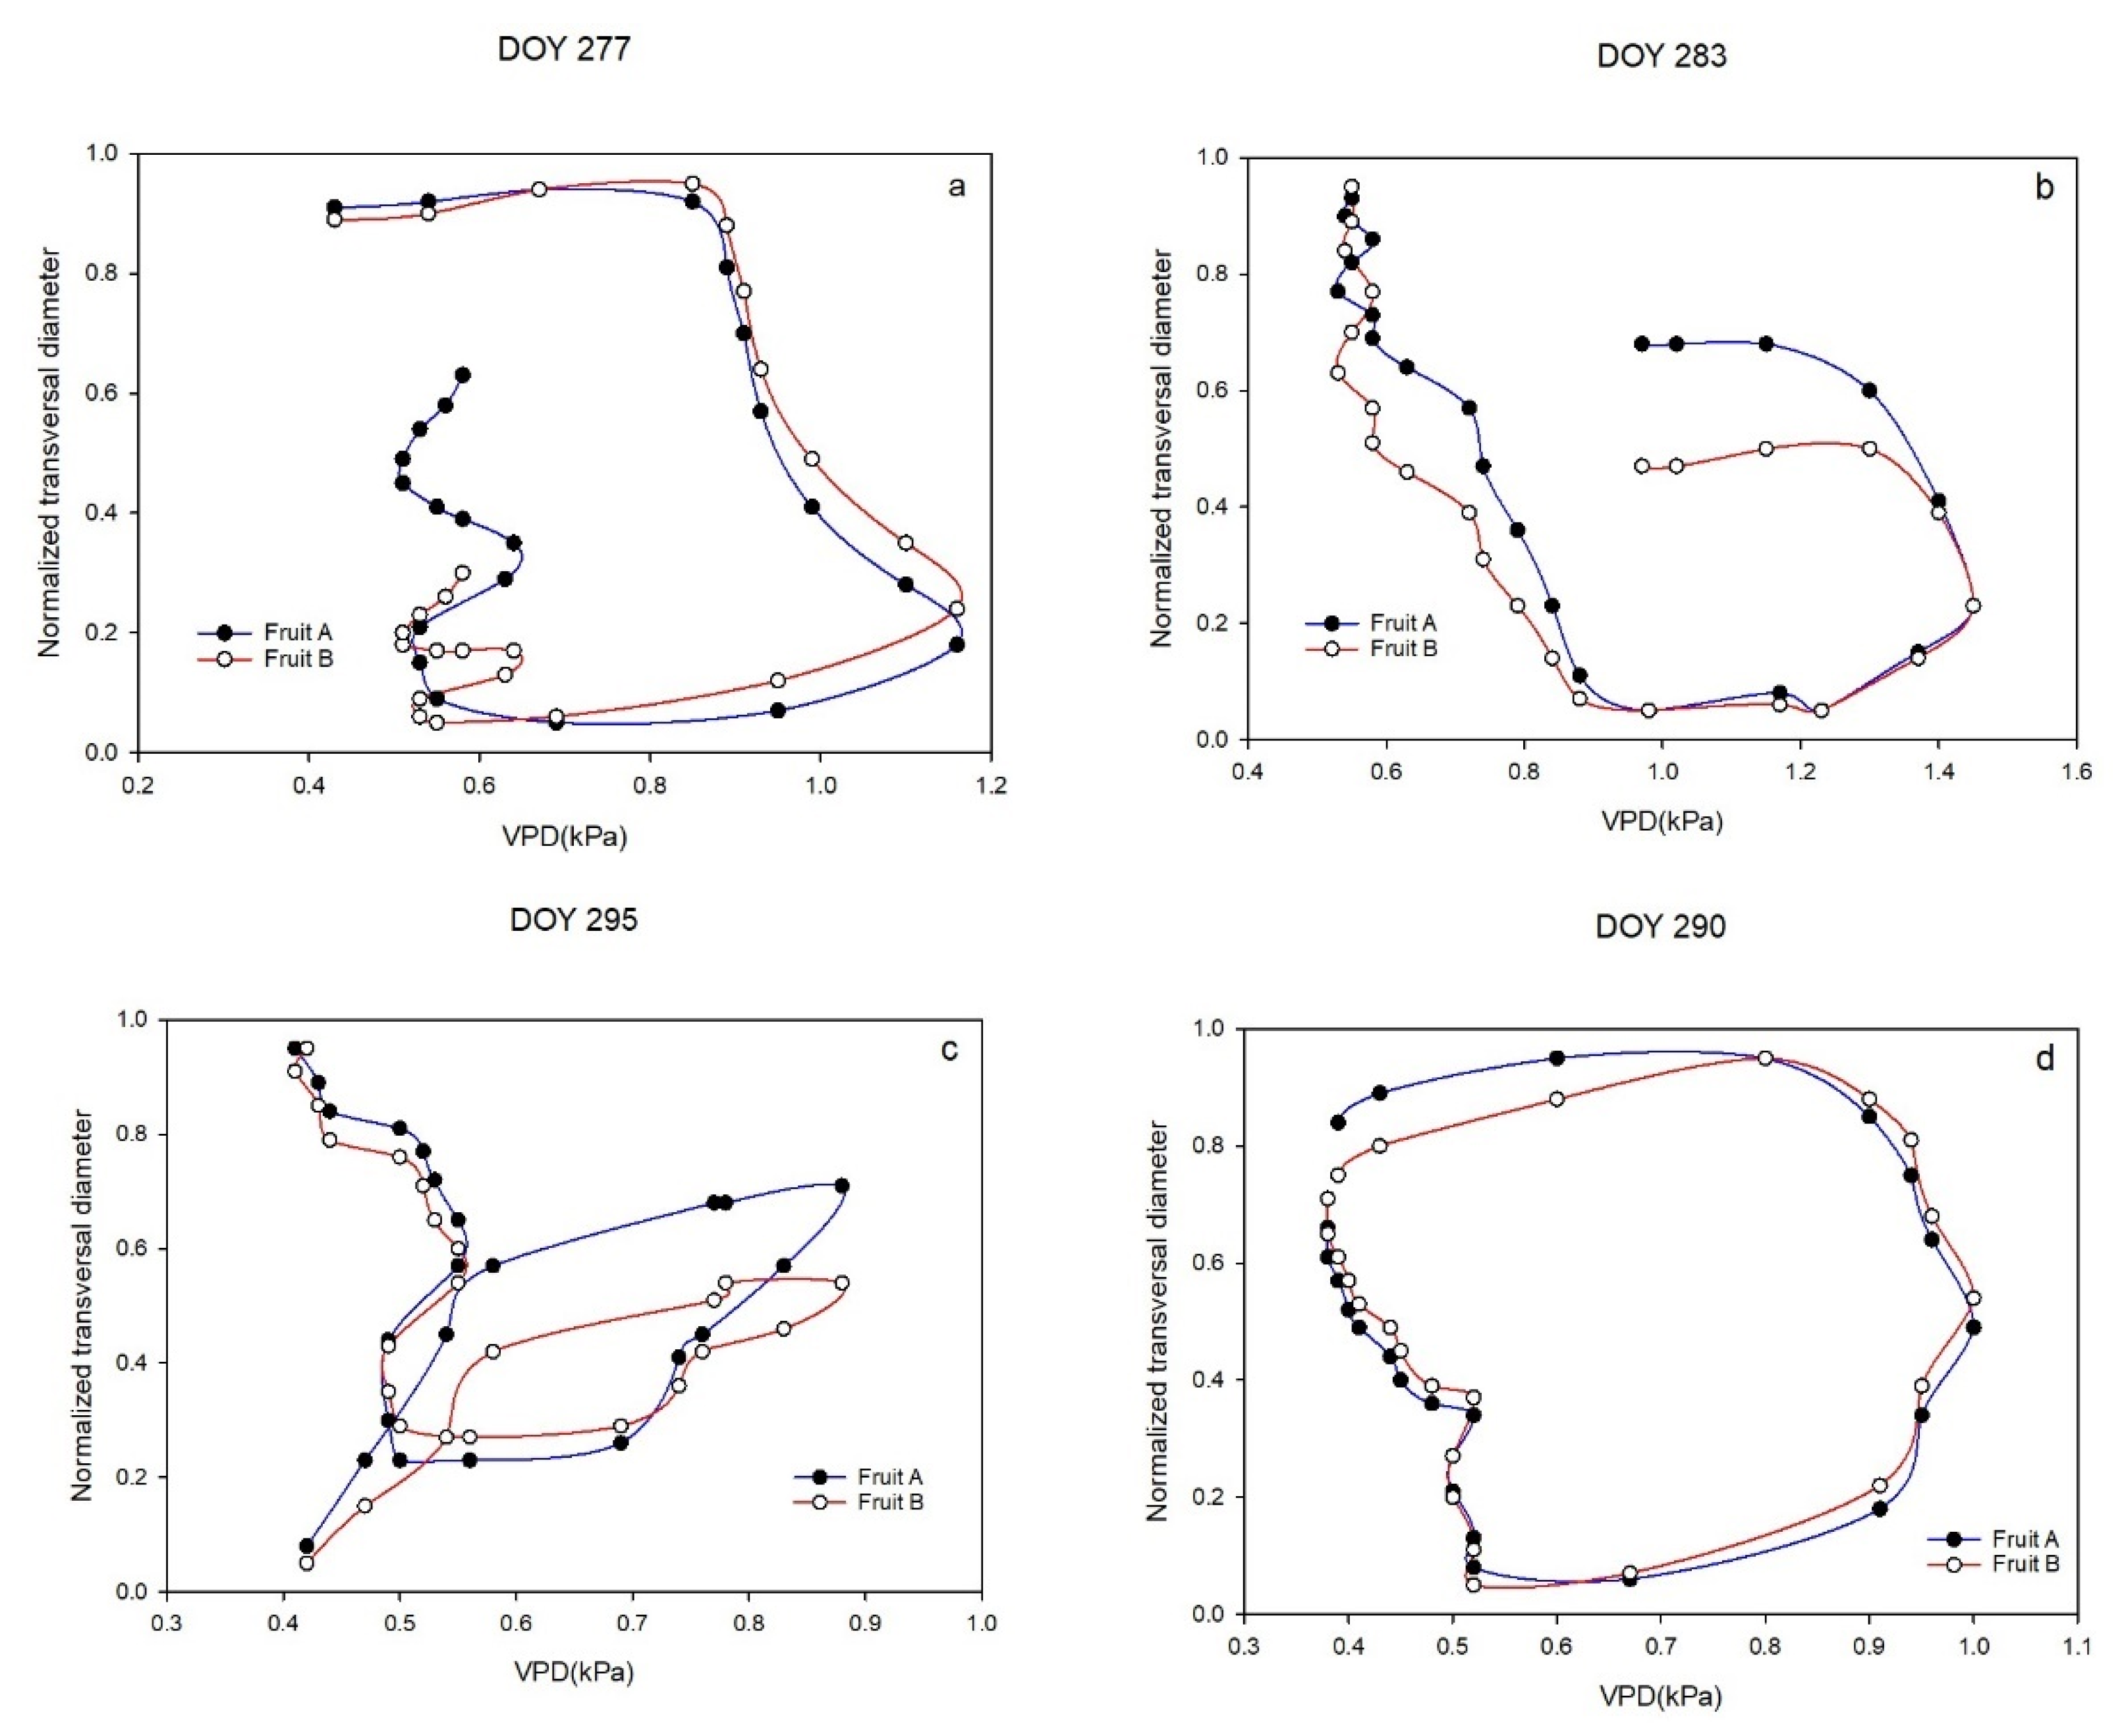
In the first period of experiment (DOY 218–276), daily growth of fruit transversal diameter versus VPD formed a model which was the same for both fruit A and fruit B. The model was explainable with three steps. After sunrise, the value of transversal diameter decreased nonlinearly, and VPD had the opposite trend and increased. Then, there was a period of stability of the transversal diameter, during which VPD decreased. The final step consisted of a rapid increase of transversal diameter with decreasing VPD. In 84.75% of cases (50 out of 59), the mentioned three steps model formed a loop, which appeared as a complete clockwise hysteresis curve throughout the day (Figure 6a). The magnitude of hysteresis loops differed from day to day, but a complete clockwise hysteresis was observed, all the time. There were nine exceptional days of a total of 59 days in which it did not appear complete clockwise hysteresis. In 10.17% of cases (6 out of 59), the clockwise hysteresis curve appeared in some part of the day and was not representative of the whole day, so it is called partial clockwise hysteresis (Figure 6c). In 1.69% of cases (1 out of 59), the ending point of the hysteresis loop did not reach the same level of the starting point of the loop, so the loop was not completely closed, and it was hence called incomplete clockwise hysteresis curve. Hysteresis loops were considered incomplete when the loop “opening” was less than 0.05 points (Figure 6d). Only in 3.39% of cases (2 out of 59), the pattern of daily transversal diameter versus VPD was not related to any noticeable model (Figure 6b). Figure 7 shows all 59 (from DOY 218 to 276) circadian measure series of transversal diameter versus VPD, providing an overall view of the first period of the experiment. The magnitude and shape of graphs for fruits A and B were similar.
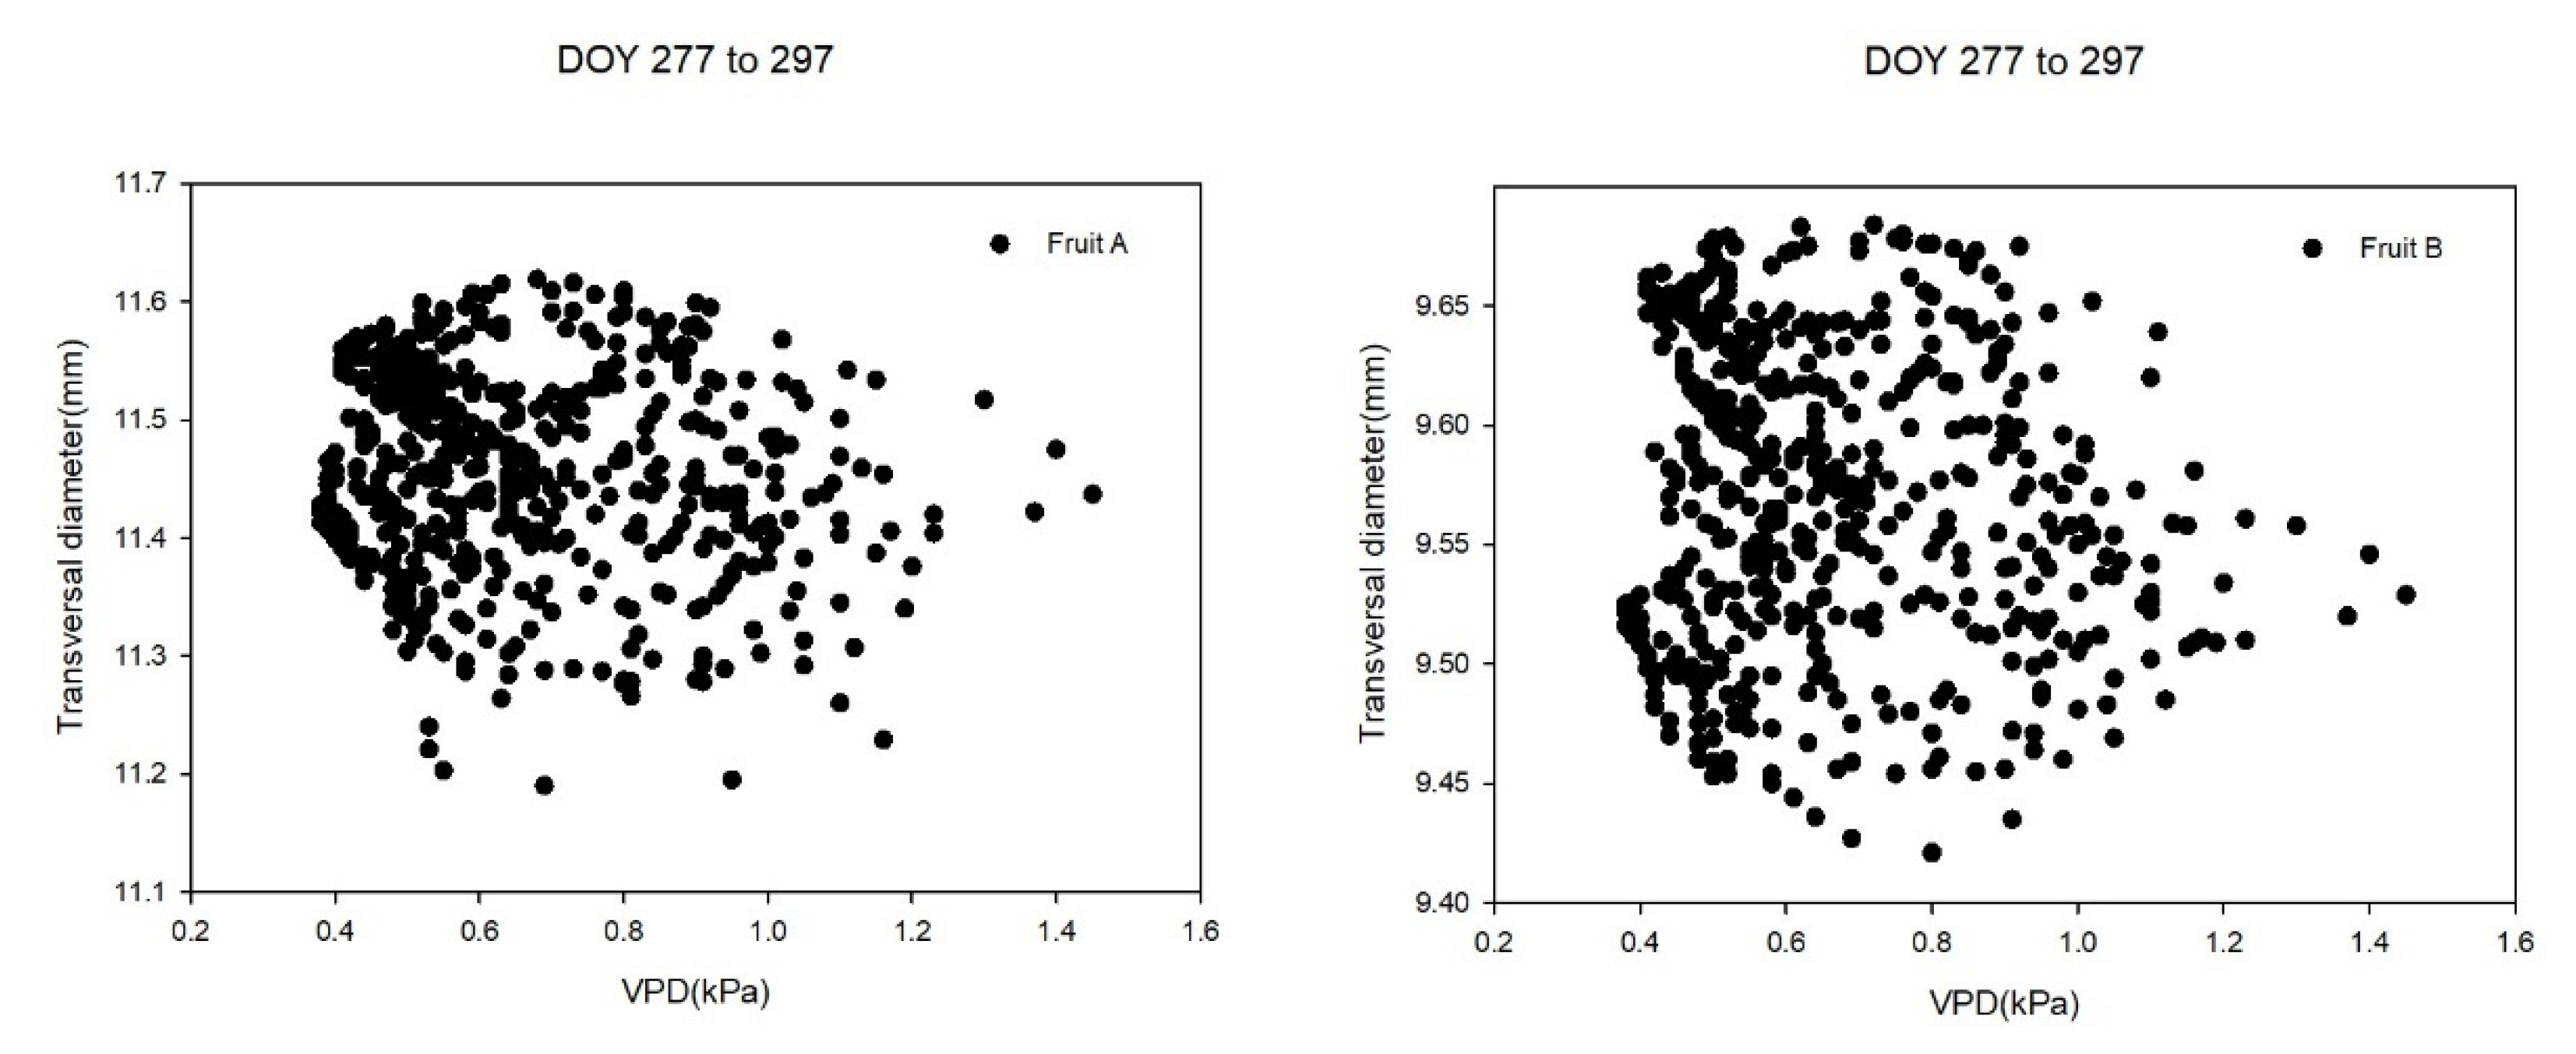
In the second period of the experiment (DOY 277–297), trends of daily fruit transversal diameter versus VPD formed partial clockwise hysteresis and incomplete clockwise hysteresis (Figure 8a–c). There were 7 days where the hysteresis pattern of fruits A and B was not the same. In fact, fruit A, in 71.43% of cases (15 out of 21), showed incomplete clockwise hysteresis and in 28.57% of cases (6 out of 21) showed partial clockwise hysteresis. The percentage of incomplete clockwise hysteresis and partial clockwise hysteresis in fruit B was 47.62 (10 out of 21) for each one. The only exception from these two models was in fruit B which showed complete clockwise hysteresis in 4.76% of cases (1 out of 21) (Figure 8d). The average of VPD at the second period of experiment was 0.85 ± 0.37 (kPa). It showed 58.2% reduction in comparison with first period of the experiment. There were 9 days with daily average of VPD lower than periodic average (average of second period of experiment) of VPD. Meanwhile, just 3 days (DOY 285, 296 and 297) for fruit A and 2 days (DOY 285 and 297) for fruit B were days with reduction of transversal diameter at the end of day. Moreover, there were 2 days (DOY 286 and 287) with normalized diameter smaller than 0.1. Finally, changing VPD in comparison with the previous day did not demonstrate any specific results (Table 1). Consequently, the VPD alone was not able to explain the changing pattern of fruit growth in this second period in comparison with the first period, because in some situations decreasing VPD scores caused an increase of fruit transversal diameter. The whole pattern of transversal diameter versus VPD for the second period of the experiment is shown in Figure 9, where 21 circadian measure series (DOY 277–297) of transversal diameter versus VPD are displayed. The shape of the graph was dissimilar from the one obtained from the first period of the experiment; besides, fruit A and fruit B showed diverse growth patterns.
The correlation coefficients of fruit A diameter versus VPD at the first and second period of the experiment were −0.527 and −0.286 and for fruit B were −0.453 and −0.232. The data showed moderate negative relationships between VPD and fruit diameter at the first period of the experiment and very weak negative relationships at the second period of the experiment. Furthermore, correlation data for the first part (DOY 218–252) and the second part (DOY 253–276) of the first period of the experiment were −0.608 and −0.377 for fruit A and −0.541 and −0.256 for fruit B, showing that correlations between fruit diameter and VPD decreased during the experiment, as fruits completed their development.
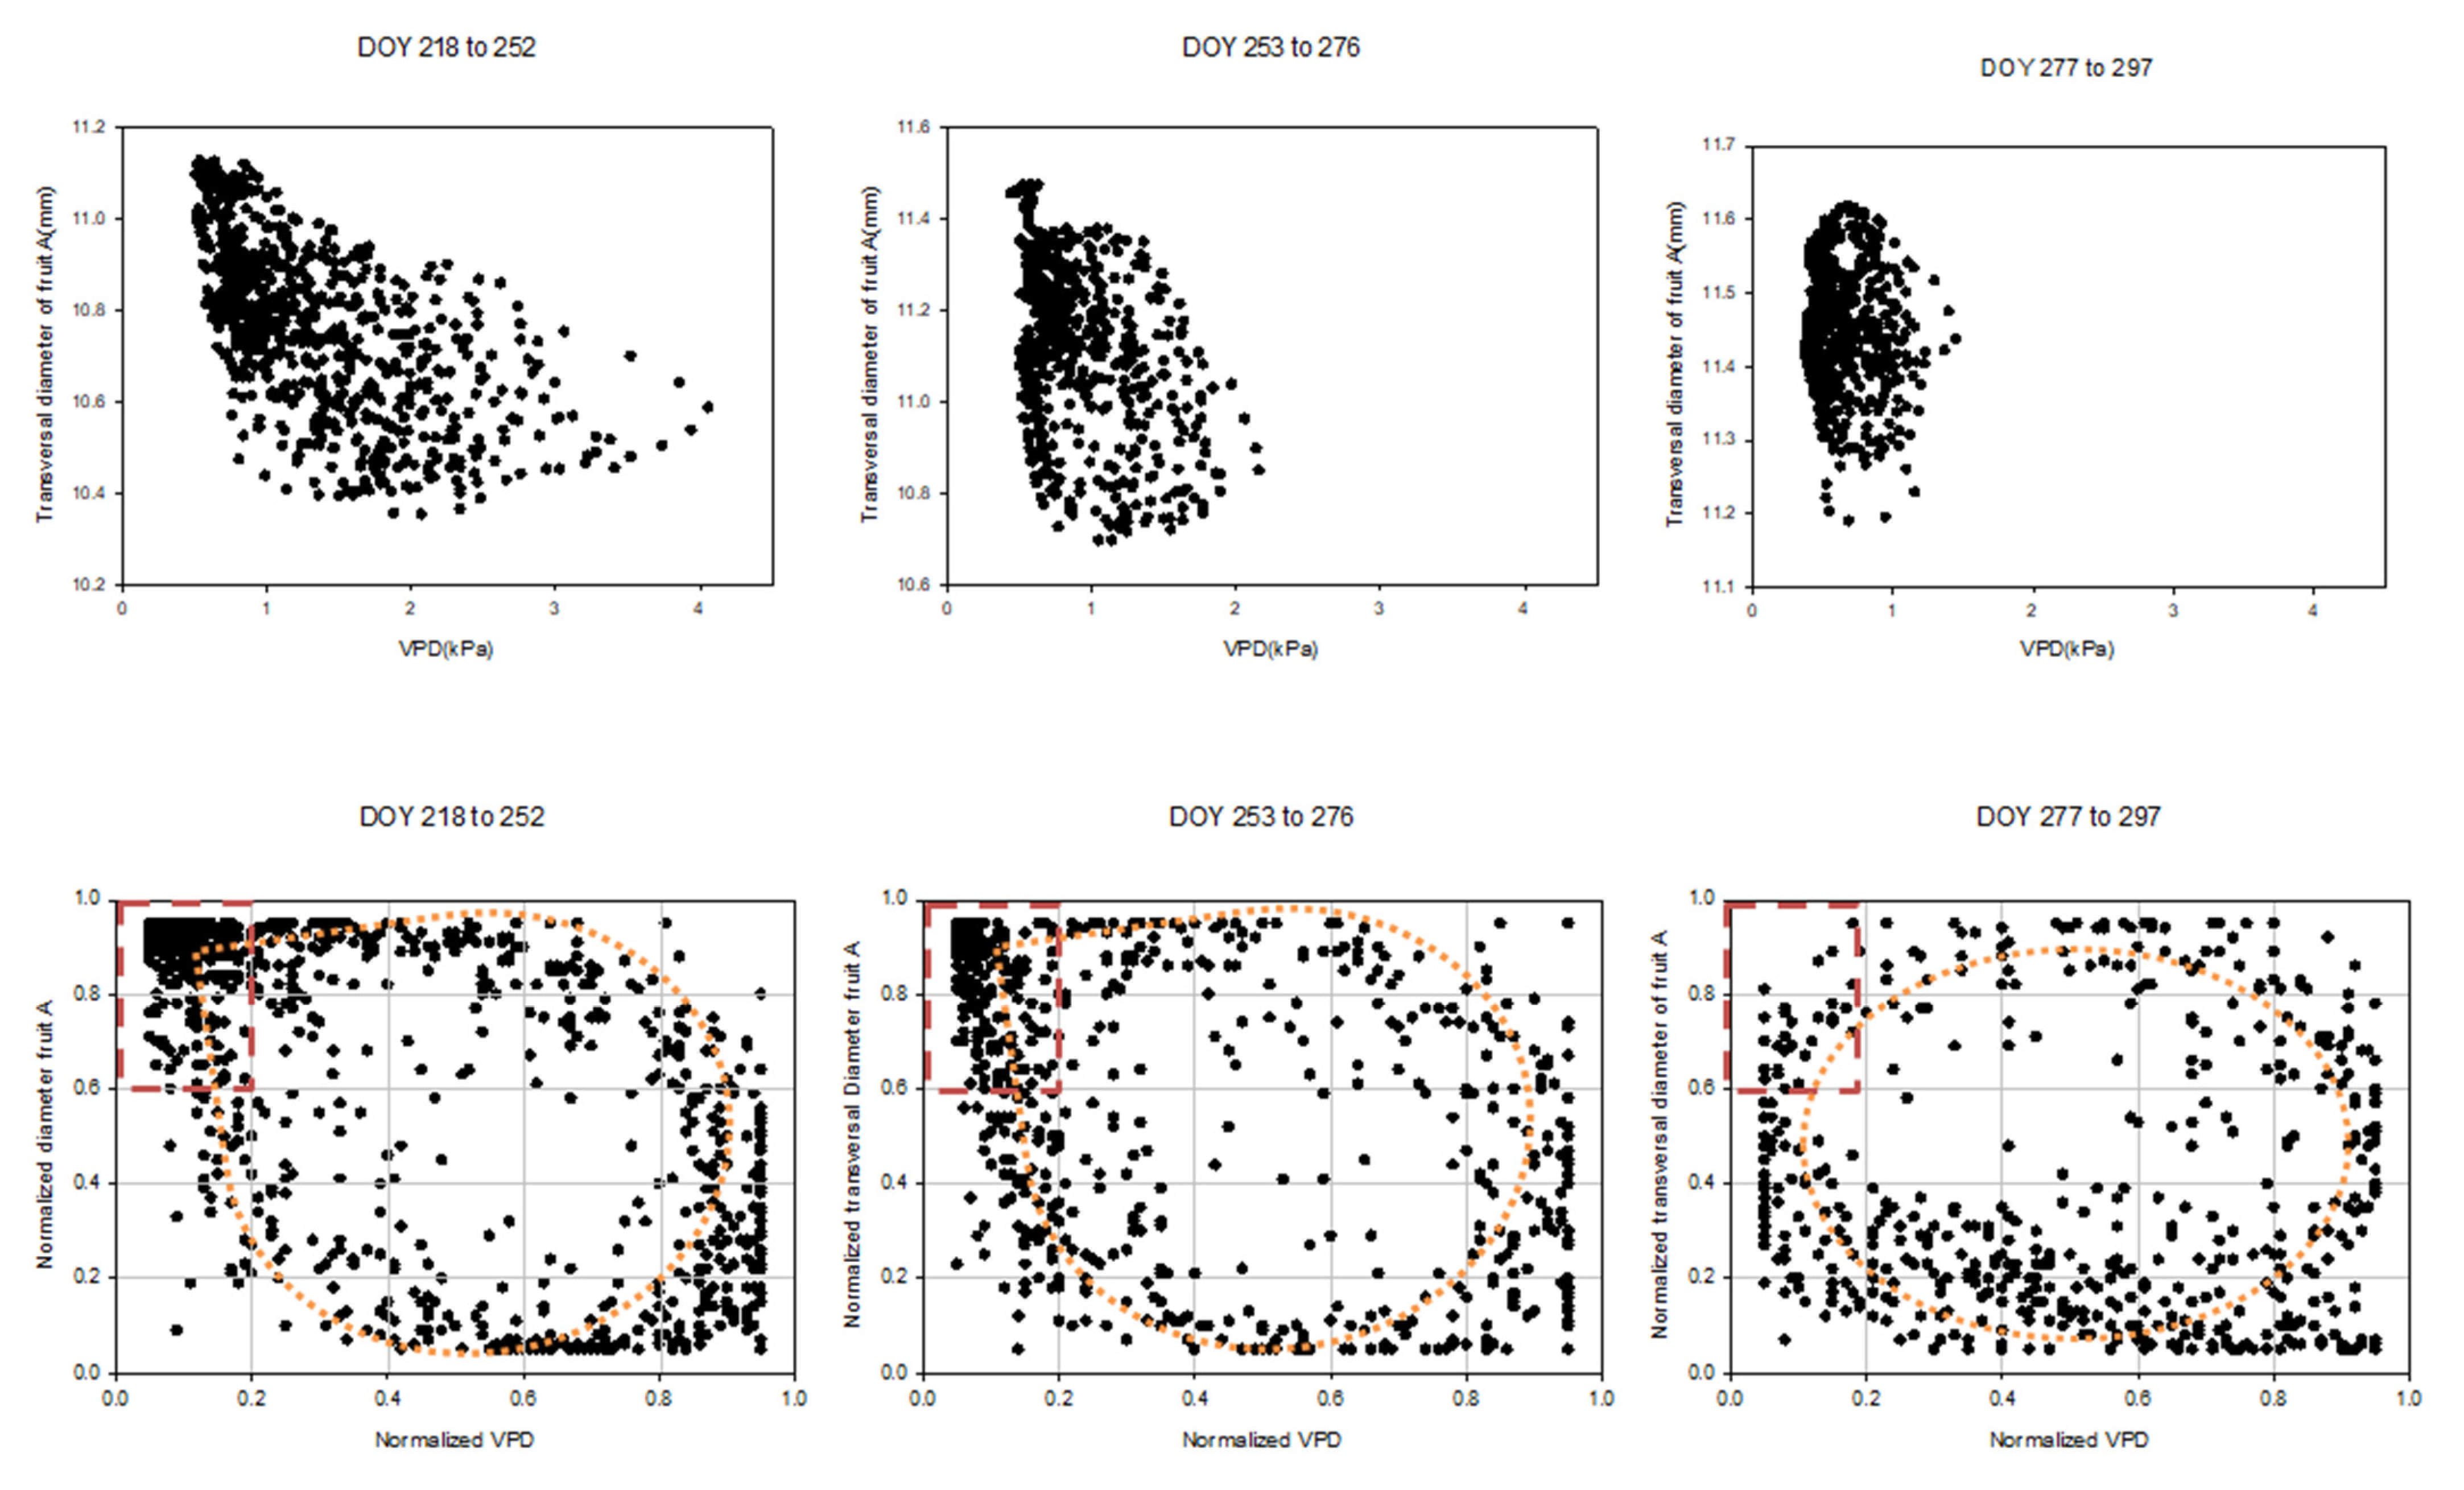
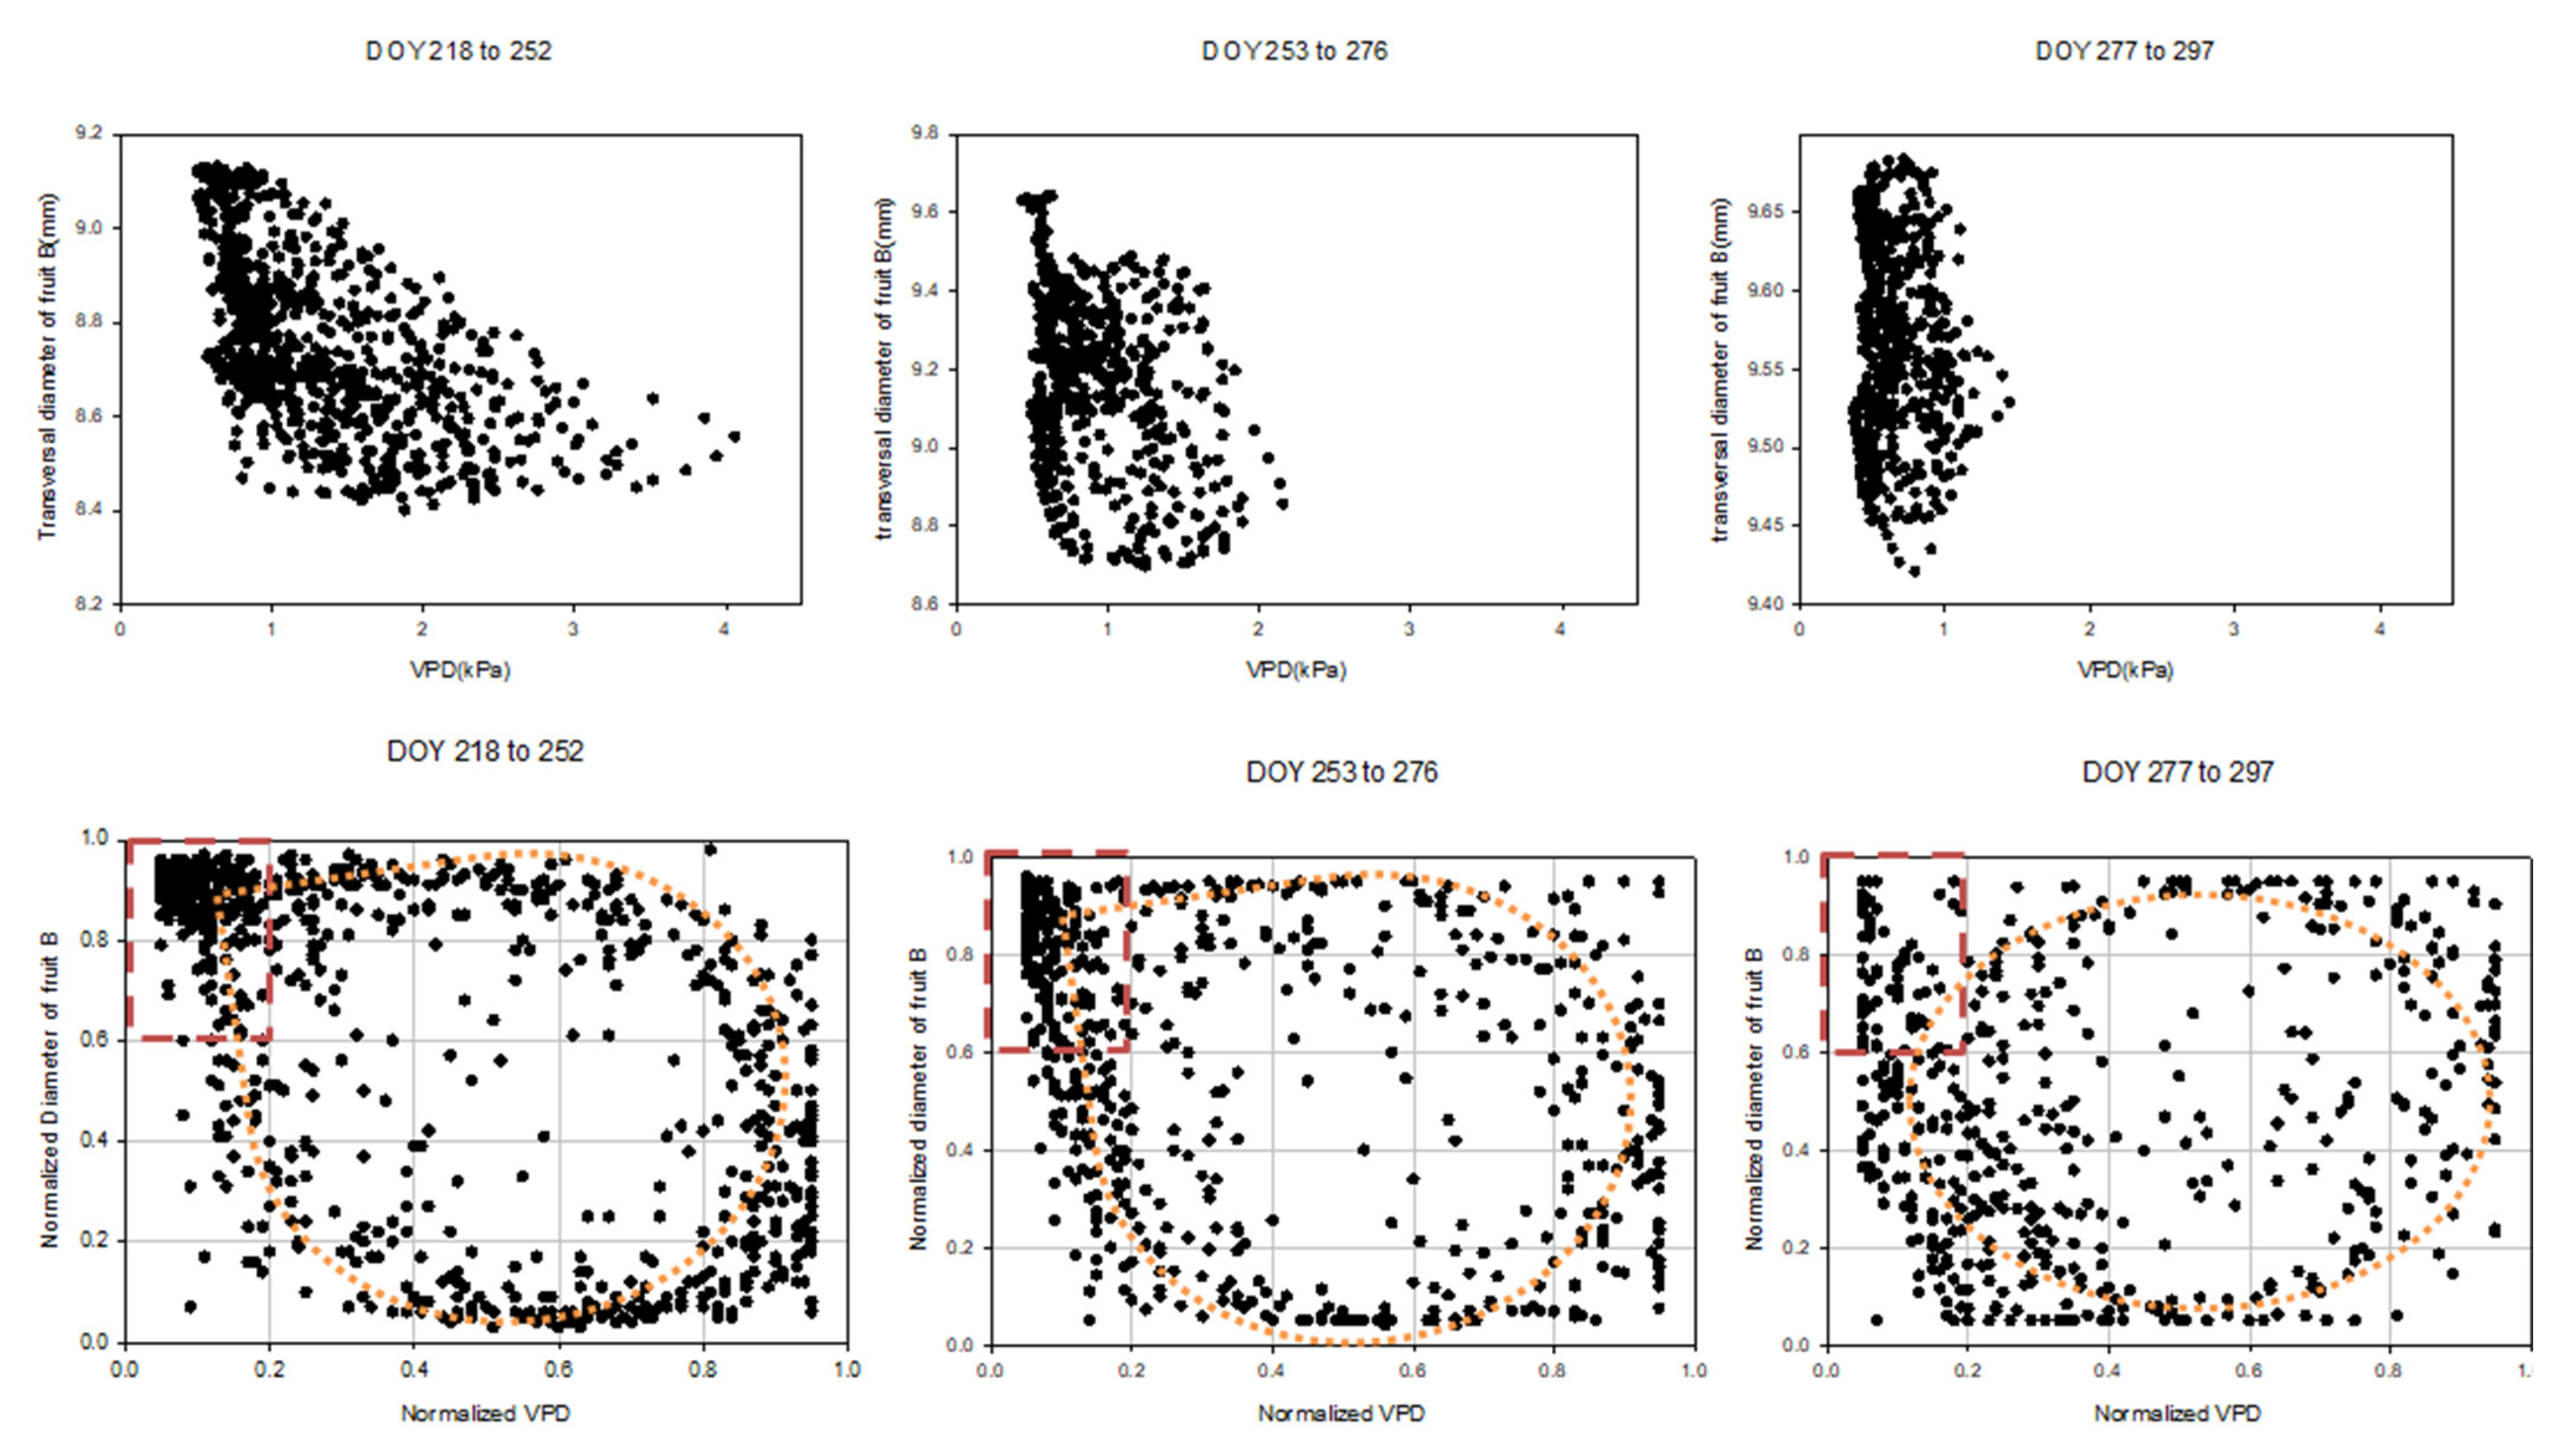
Additionally, the magnitude of hysteresis loops changed and became more compact during the experiment, flattening along the VPD axes, due to a reduction of VPD (Figure 10). Normalized graphs (Figure 10) show that the trend of transversal diameter versus VPD in the first period of the experiment was different from the second period. In both time intervals in the first period (i.e., 219–252 and 253–276 DOYs), maximum transversal diameter almost occurred at the minimum range of VPD, however, in the second period this trend was not observable.

3.3. Fruit Monitoring by Time-Lapse Camera

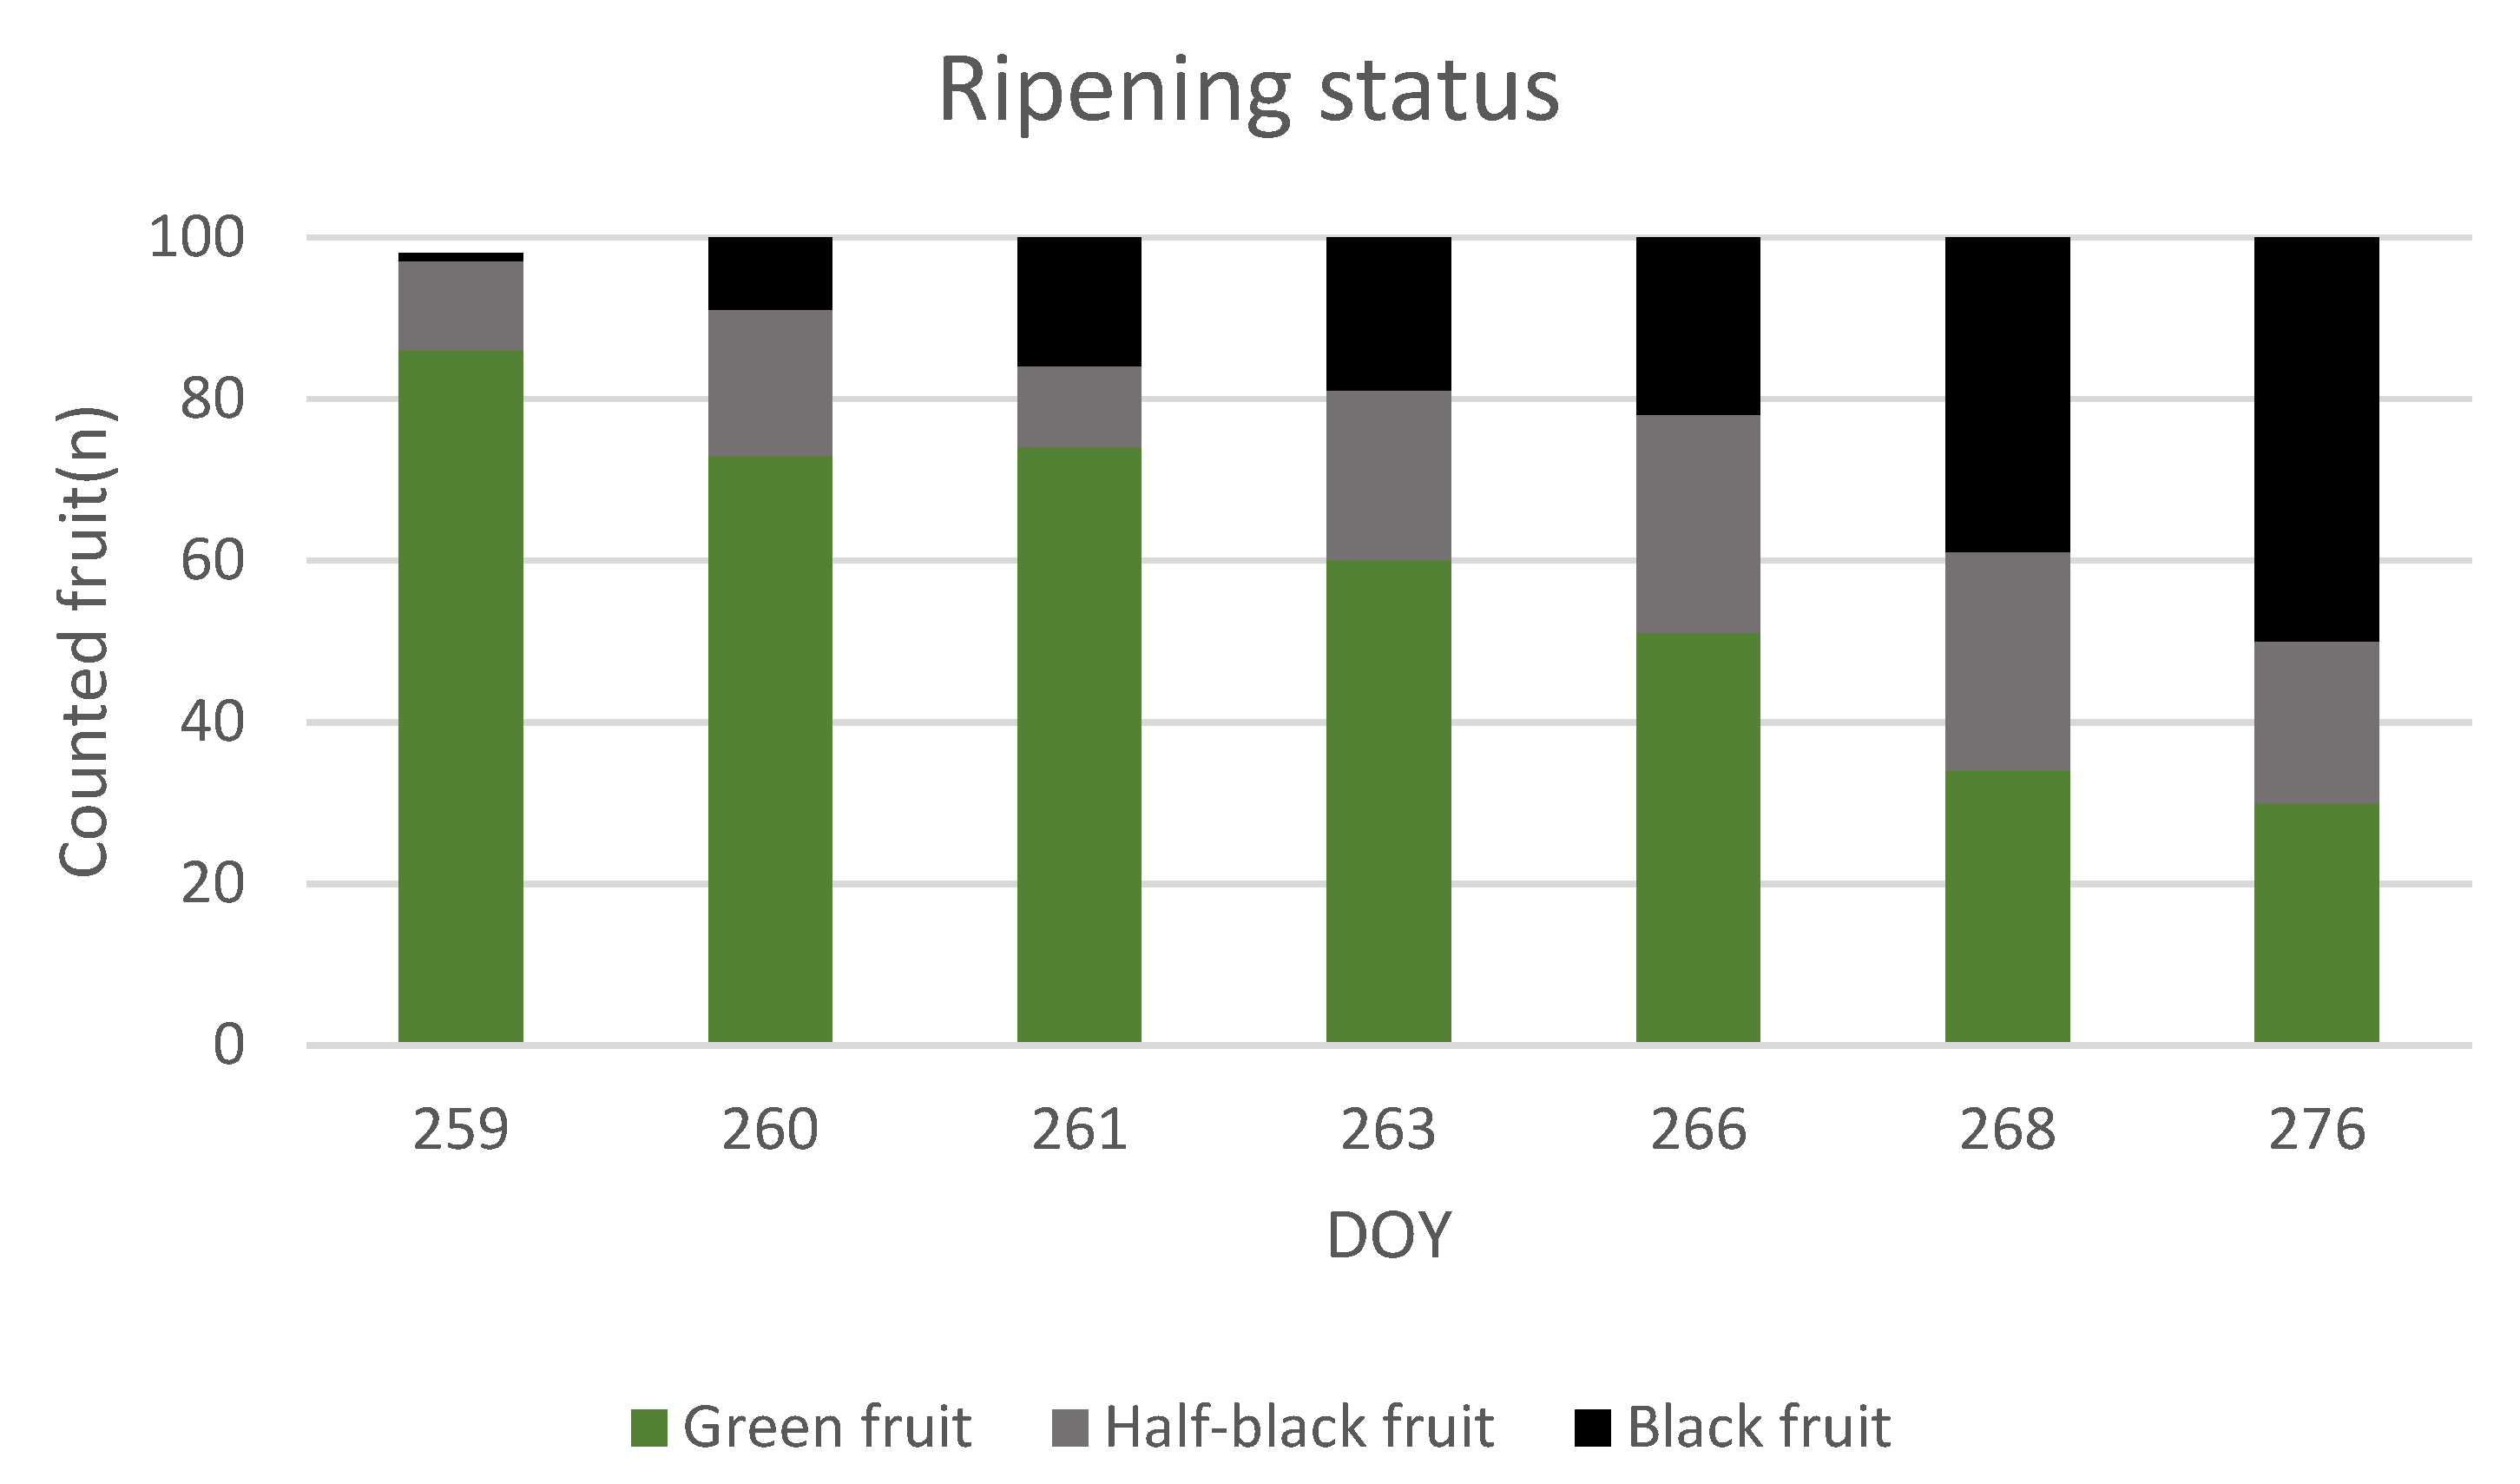
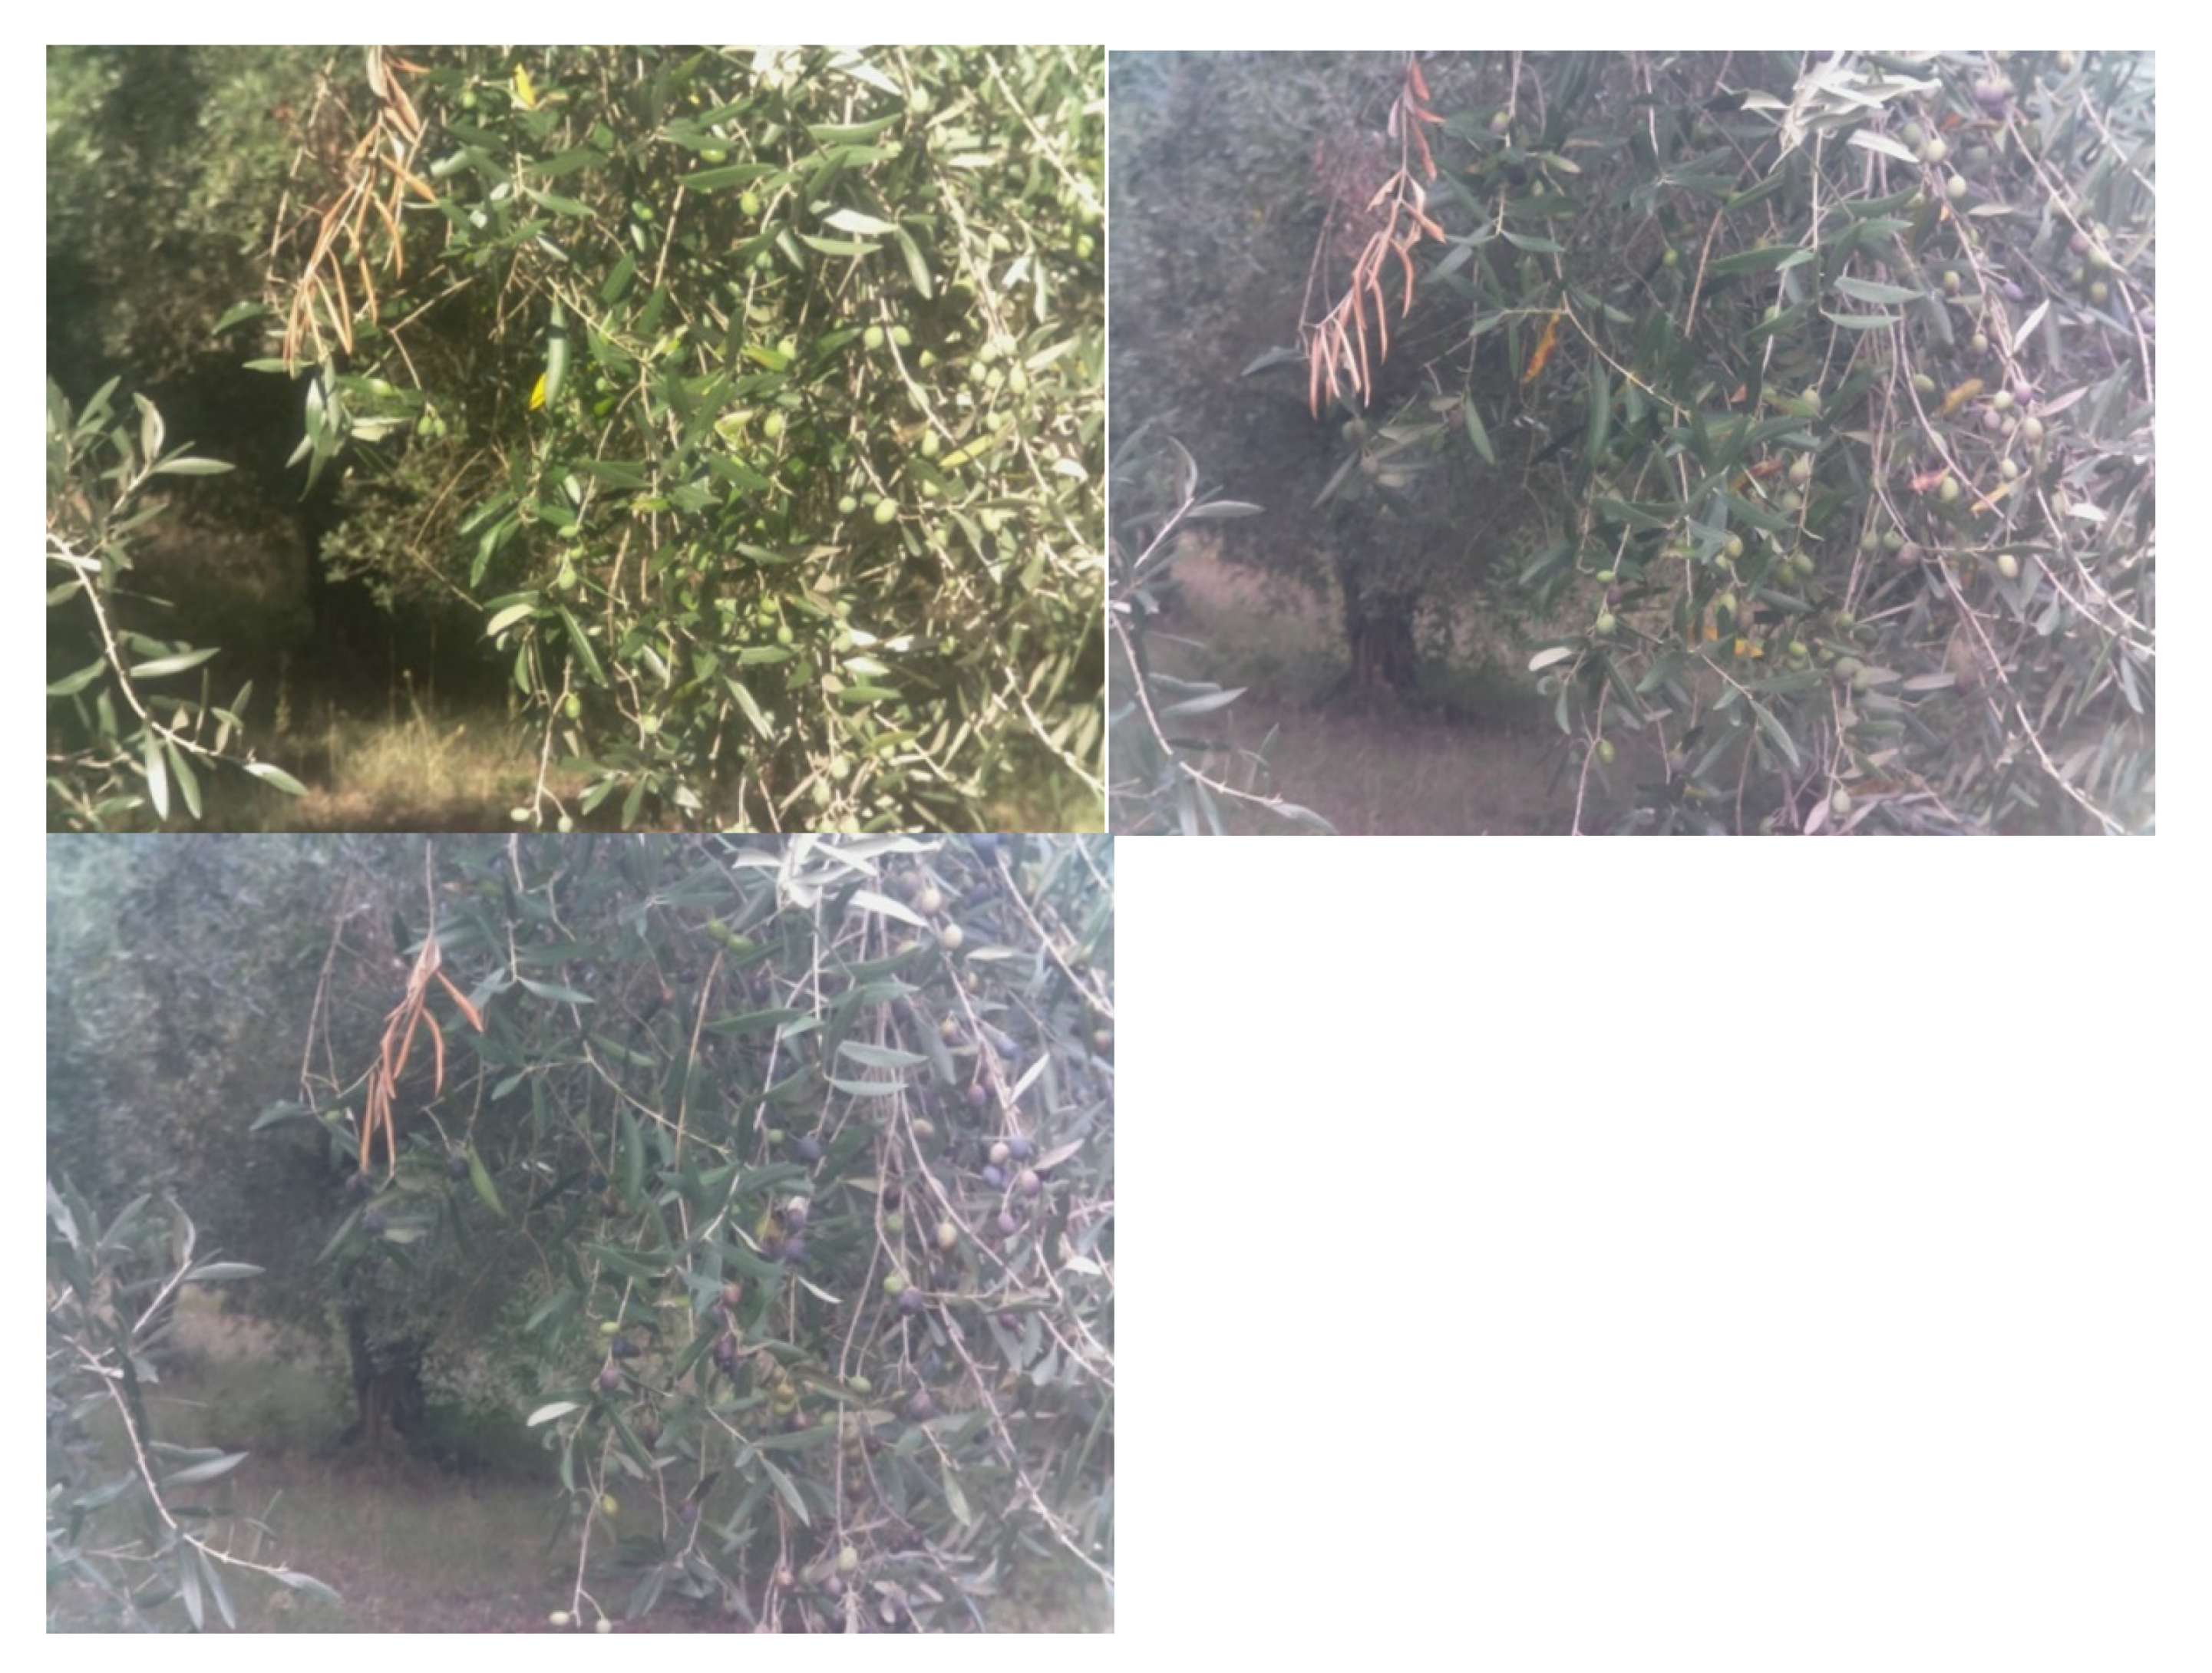
Figure 11 shows the fruit information such as countable fruits and ripening stage at random days of the first period of the experiment. According to camera images, fruits ripening started at DOY 259 (Figure 12), when the percentage of black olive fruits in the picture reached 5%. At the end of the first period, the ripening (population of countable black olive fruits) was 50% (Figure 11).

4. Discussion

Dendrometers have been recently used in other research works for continuous monitoring of olive fruit, in correlation with water stress and scheduling the irrigation method such as regular deficit irrigation (RDI). For instance, Fernandes et al. [15] explored the effect of water relations between leaves and fruits on fruit growth in a high-density olive orchard (cv. Arbequina) in southern Spain. Recent research [10] demonstrated that fruits acted as sinks of water during the night and as water sources during the day, leading to a strong daily shrinkage and swelling pattern in response to plant stress. This discovery highlights the important and still unrevealed role that fruits have as water storage compartments in drought resistance mechanisms of olives. Fruit daily diameter variation according to this research followed the same trend as our experiment, as reported in Figure 2. Additionally, Scalisi et al. [35] performed continuous monitoring of two Sicilian olive cultivars (Nocellara del Belice and Olivo di Mandanici), in phases two and three of fruit development. They aimed at detecting whether fruit and leaf water dynamics of two different olive cultivars were differently affected by water deficit and their response to changes of midday stem water potential. This showed anti-clockwise hysteretic relationships between relative rates of fruit diameter change and relative rates of leaf pressure change. Besides, the results highlighted the advantages of the integration of fruit and leaf water dynamics to estimate plant water status and the need for genotype-specific models in olive.
To the best of our knowledge, our work presents the first study on continuous measurement of transversal diameter of olive fruit with the description of fruit hysteresis according to daily variation of VPD. This study represents the results obtained only in ‘Frantoio’ cultivar in a specific range of environmental conditions, and it provides innovative information about detecting the fourth phase of fruit growth by hysteresis phenomenon.

4.1. Diurnal Transversal Diameter Change and Its Influencing Factor

In the first period of the experiment, daily fruit growth followed a two steps cycle (decrease and increase). Due to the research of Fernandes et al. [15] and Marino et al. [10], the daily variations in fruit transversal diameters can be expounded as changes in flows of water into and out of the fruit hence, these can be connected to VPD and tree water status. Furthermore, Morandi et al. [41] explained that water and assimilates were translocated to the fruit via phloem and xylem streams, while fruit epidermis transpiration and fruit respiration were the main outgoing fluxes. This study described that fruit diameter variation in a finite time interval can be viewed as the net contribution of phloem import, which is always positive, whereas xylem flow, may be positive or negative and transpiration through the cuticle, which is always negative. However, the olive species (Olea europaea L.) has a very wide genetic pool, which can respond to drought using different leaf and fruit physiological and morphological mechanisms [35,42]. It includes genotypes that can respond to drought using different mechanisms of leaf dehydration tolerance and leaf morphological and structural adaptations [35]. Lo Bianco and Scalisi [42] found different leaf stomatal regulation among olive cultivars.
We could monitor three exception days that did not show the daily trend of diameter decrease and increase (Figure 4). The ripening assessment data showed that the fruits in these 3 days where in different phenological phases. DOY 249 in the III phase and DOYs 262 and 276 in the IV phase of the fruit growth curve. The mean VPD in these 3 days was lower than periodic average of VPD (Table 1). Nevertheless, there were other days with average VPD lower than periodical average that did not show a different daily growth curve. Data of normalized VPD showed that all of these days had normalized VPD lower than 0.1. There was one day (DOY 266) which had normalized VPD lower than 0.1 but did not show a diverse daily growth curve. For the days with the exception daily pattern of diameter variation, the VPD daily variation was more than −41.2%; all the other days had much lower decrease percentage. Consequently, low daily average of VPD plus sudden decrease of VPD daily variation may have caused a different growth pattern during these 3 days.
In the first period of the experiment, the transversal diameter increased at the end of each day in comparison with starting point of same day. Only 5.1% of days for fruit A and 1.7% for fruit B showed an opposite pattern (lower diameter than the start of the day). The decreasing of the fruit transversal diameter can be caused by depletion of water reserves in fruit exposed to water stress. Considering meteorological data during all these days, the daily average of VPD was lower than periodic average of VPD (Table 1), however, there were other days with same weather condition which did not show daily reduction of transversal diameter.
In the second period of the experiment, daily growth pattern was described as a decrease followed by an increase of fruit transversal diameter. Besides, increasing transversal diameter at the end of each day in comparison with starting point of same day was not observable in all days. Indeed, percentage of days in which transversal diameter reduced at the end of the day with comparison of starting point of the same day was 52.38% for fruit A and 42.85% for fruit B. According to Kong et al. [43], decreasing transversal diameter for Olea europaea L. cv. ‘Frantoio’ could happen in the ripening stage. Data of Figure 10 shows that all days of the second period of the experiment had ripening percentage more than 50%, when fruits were in the IV phase of fruit growth. Consequently, fruit ripening caused increasing percentage of the days with reduction of transversal diameter at the ending point of each day. It could be hypothesized that variation of fruit growth trend between the first and second period of the experiment (the deformity on graph pattern) resulted from biotic parameters of fruit maturation, together with a high fluctuation of VPD and low periodic average of VPD at the second period of the experiment (Figure 2).

4.2. Hysteresis Loop, Challenges and Variations

Hysteresis is an indirect response of vegetation to diurnal changes in the external environment, because changes in such environmental controls often lead to complex physiological responses [44]. Under these environmental circumstances, VPD has been shown to be the major factor affecting the diurnal hysteresis loops [27,28,29,30,32,33]. Additionally, hysteresis can be seen as a way of self-protection for plants to avoid the overlapping of peak transpiration and peak VPD, thus preventing excessive extraction of water from the stem [45]. Indeed, as a self-protective mechanism to avoid extremely high transpiration rates and adapt to tough weather [45]. Therefore, the reaction time of plants is earlier than declines of meteorological variables which directly cause a hysteresis curve of fruit growth (transversal diameter) versus VPD.
In the first period of experiment (DOY 218–276) and from DOY 218 to 259, the percentage of complete clockwise hysteresis was 92.86 which declined to 35.3 in the period of DOY 260–276. This showed that with increasing fruit ripening, the percentage of complete clockwise hysteresis declined. Furthermore, in the same period data showed that the percentage of partial clockwise hysteresis and incomplete clockwise hysteresis increased from 2.38 to 29.4. The percentage for both kinds of hysteresis was the same. Therefore, with enhancing ripening percentage the partial clockwise hysteresis and incomplete clockwise hysteresis showed a reverse trend in comparison with complete clockwise hysteresis.
In the second period of the experiment (DOY 277–297) the percentage for complete clockwise hysteresis was 2.4, for incomplete hysteresis 64.3 and for partial hysteresis was 33.3. From Figure 10 it is observable that the percentage of ripening in the second period of experiment is 50%, so the fruit was at IV phase. Limitations to fruit growth and different fruit growth patterns at the ripening stage could be linked to changing in daily growth trends. In fact, with increasing fruit maturation the complete hysteresis loop started to show abnormality which appeared with incomplete or partial daily hysteresis loop, or with no daily hysteresis loop. When the percentage of black fruits is near 50%, the presence of a complete clockwise hysteresis loop diminished sensibly. Detecting the moment of disappearance of the complete clockwise hysteresis curve could be useful to evaluate more precisely the IV phase of the double sigmoid growth curve of olives. Several studies [30,46,47] showed that the magnitude of hysteresis loops is affected by biotic factors and abiotic factors. Additionally, findings by Scalisi et al. [35] suggested that an overall decrease of the hysteretic loop area occurred from the II phase to the III phase of fruit growth. This is probably driven by the different fruit growth pattern at II and III phases [35].
Moreover, changing of graph form from almond shape to oval shape (Figure 10) was the outcome of diverse growth patterns in the third and fourth stages of fruit growth. Monitoring hysteretic loops and detecting the magnitude change could be used as a method for detecting the growth stages. Further investigations need to be done to promote models that evaluate hysteretic loops of olive daily growth versus VPD in different cultivars and range of environmental conditions. Nevertheless, our research produced viable data for an identification of different growth phases in the ‘Frantoio’ cultivar.

5. Conclusions

This study investigated the continuous transversal diameter growth of the olive fruit from pit hardening to harvest. The results demonstrated that almost in all days of the II phase of fruit growth the response of fruit transversal diameter to VPD formed a complete clockwise hysteresis curve. With the beginning of the IV phase of fruit growth, the complete clockwise hysteresis curve showed significant abnormality and became rare. The disappearance of complete clockwise hysteresis loop could be a good indicator of fruit maturation stage. A visualization of hysteresis curve, in normalized diameter vs. VPD, can be a tool to translate measured data to precise phenological phases of fruit growth and can be used for orchard management. These results will be useful for creating more robust and precise models for olive fruit growth and to gather useful outputs for precision agriculture methods.

Author Contributions

Conceptualization, D.N. and A.M.; methodology, A.K. and M.Z.; software, A.M.; investigation, D.N.; data curation, A.M.; writing—original draft preparation, A.K. and M.Z.; writing—review and editing, D.N., A.K., V.G. and M.Z.; supervision, D.N.; project administration, D.N.; funding acquisition, D.N. and A.M. All authors have read and agreed to the published version of the manuscript.

Funding

This research was funded by the Polytechnic University of Marche through “The network of the Botanical Gardens of Ancona PSA 2017-18” project and by POR Marche FSE 2014/2020 Progetto “Dottorato Innovativo”-Borse di studio per dottorato di ricerca per l’innovazione del sistema regionale, Edizione Anno 2020.

Institutional Review Board Statement

Not applicable.

Informed Consent Statement

Not applicable.

Data Availability Statement

All data are available with an email request to the authors.

Acknowledgments

We thank Bruno Borsari for his critical review of this paper.

Conflicts of Interest

The authors declare no conflict of interest.

References

  1. Conde, C.; Delrot, S.; Gerós, H. Physiological, biochemical and molecular changes occurring during olive development and ripening. J. Plant Physiol. 2008, 165, 1545–1562. [Google Scholar] [CrossRef]
  2. Tombesi, A. Olive fruit growth and metabolism. Acta Hortic. 1994, 356, 225–232. [Google Scholar] [CrossRef]
  3. Martinelli, F.; Sebastiani, L.; Tonutti, P.; d’Andria, R. Molecular and metabolic analyses in developing olive fruit in relation to different water regimes. Acta Hortic. 2011, 888, 163–168. [Google Scholar] [CrossRef]
  4. Fernández, F.J.; Ladux, J.L.; Hammami, S.B.; Rapoport, H.F.; Searles, P.S. Fruit, mesocarp, and endocarp responses to crop load and to different estimates of source: Sink ratio in olive (cv. Arauco) at final harvest. Sci. Hortic. 2018, 234, 49–57. [Google Scholar] [CrossRef]
  5. Gucci, R.; Lodolini, E.M.; Rapoport, H.F. Water deficit-induced changes in mesocarp cellular processes and the relationship between mesocarp and endocarp during olive fruit development. Tree Physiol. 2009, 29, 1575–1585. [Google Scholar] [CrossRef] [PubMed]
  6. Corelli-Grappadelli, L.; Lakso, A.N. Fruit development in deciduous tree crops as affected by physiological factors and environmental conditions (keynote). In Proceedings of the XXVI International Horticultural Congress: Key Processes in the Growth and Cropping of Deciduous Fruit and Nut Trees 636, Toronto, ON, Canada, 11–17 August 2002; pp. 425–441. [Google Scholar]
  7. Hammami, S.B.; Manrique, T.; Rapoport, H.F. Cultivar-based fruit size in olive depends on different tissue and cellular processes throughout growth. Sci. Hortic. 2011, 130, 445–451. [Google Scholar] [CrossRef]
  8. Amitrano, C.; Arena, C.; Rouphael, Y.; De Pascale, S.; De Micco, V. Vapour pressure deficit: The hidden driver behind plant morphofunctional traits in controlled environments. Ann. Appl. Biol. 2019, 175, 313–325. [Google Scholar] [CrossRef]
  9. Zarco-Tejada, P.J.; Hubbard, N.; Loudjani, P. Precision Agriculture: An Opportunity for EU Farmers—Potential Support with the CAP 2014–2020; Joint Research Centre (JRC) of the European Commission; Monitoring Agriculture ResourseS (MARS) Unit H04: Brussels, Belgium, 2014. [Google Scholar]
  10. Marino, G.; Scalisi, A.; Guzmán-Delgado, P.; Caruso, T.; Marra, F.P.; Lo Bianco, R. Detecting Mild Water Stress in Olive with Multiple Plant-Based Continuous Sensors. Plants 2021, 10, 131. [Google Scholar] [CrossRef] [PubMed]
  11. Zucchini, M.; Khosravi, A.; Giorgi, V.; Mancini, A.; Neri, D. Is There Daily Growth Hysteresis versus Vapor Pressure Deficit in Cherry Fruit? Horticulturae 2021, 7, 131. [Google Scholar] [CrossRef]
  12. Fishman, S.; Génard, M. A biophysical model of fruit growth: Simulation of seasonal and diurnal dynamics of mass. Plant Cell Environ. 1998, 21, 739–752. [Google Scholar] [CrossRef]
  13. Brüggenwirth, M.; Winkler, A.; Knoche, M. Xylem, phloem, and transpiration flows in developing sweet cherry fruit. Trees 2016, 30, 1821–1830. [Google Scholar] [CrossRef]
  14. Manfrini, L.; Pierpaoli, E.; Taylor, J.A.; Morandi, B.; Losciale, P.; Zibordi, M.; Grappadelli, L.C.; Bastías, R.M. Precision fruit growing: How to collect and interpret data on seasonal variation in apple orchards. In Proceedings of the XXVIII International Horticultural Congress on Science and Horticulture for People (IHC2010): International Symposium on Plant 932, Lisbon, Portugal, 22–27 August 2010; pp. 461–469. [Google Scholar]
  15. Fernandes, R.D.M.; Cuevas, M.V.; Diaz-Espejo, A.; Hernandez-Santana, V. Effects of water stress on fruit growth and water relations between fruits and leaves in a hedgerow olive orchard. Agric. Water Manag. 2018, 210, 32–40. [Google Scholar] [CrossRef]
  16. Morandi, B.; Manfrini, L.; Zibordi, M.; Noferini, M.; Fiori, G.; Grappadelli, L.C. A Low-cost Device for Accurate and Continuous Measurements of Fruit Diameter. HortScience 2007, 42, 1380–1382. [Google Scholar] [CrossRef] [Green Version]
  17. Goldhamer, D.A. Regulated deficit irrigation for California canning olives. In Proceedings of the III International Symposium on Olive Growing 474, Chania, Greece, 12–26 September 1997; pp. 369–372. [Google Scholar]
  18. Tovar, M.J.; Romero-Fabregat, M.-P.; Alegre, S.M.; Girona, J.; Motilva, M.J. Composition and organoleptic characteristics of oil fromArbequina olive (Olea europaea L.) trees under deficit irrigation. J. Sci. Food Agric. 2002, 82, 1755–1763. [Google Scholar] [CrossRef]
  19. Tognetti, R.; d’Andria, R.; Lavini, A.; Morelli, G. The effect of deficit irrigation on crop yield and vegetative development of Olea europaea L.(cvs. Frantoio and Leccino). Eur. J. Agron. 2006, 25, 356–364. [Google Scholar] [CrossRef]
  20. Alhaoui, N.; Gómez-Caravaca, A.M.; Leon, L.; De la Rosa, R.; Fernandez-Gutierrez, A.; Segura-Carretero, A. Pattern of variation of fruit traits and phenol content in olive fruits from six different cultivars. J. Agric. Food Chem. 2015, 63, 10466–10476. [Google Scholar]
  21. Fernández, J. Plant-based methods for irrigation scheduling of woody crops. Horticulturae 2017, 3, 35. [Google Scholar] [CrossRef] [Green Version]
  22. Jones, H.G. Monitoring plant and soil water status: Established and novel methods revisited and their relevance to studies of drought tolerance. J. Exp. Bot. 2006, 58, 119–130. [Google Scholar] [CrossRef] [Green Version]
  23. Mayergoyz, I.D. Mathematical Models of Hysteresis and Their Applications, 2nd ed.; Electromagnetism; Academic Press: Cambridge, MA, USA, 2003; ISBN 978-0-12-480873-7. [Google Scholar]
  24. Phillips, J.D. Sources of nonlinearity and complexity in geomorphic systems. Prog. Phys. Geogr. 2003, 27, 1–23. [Google Scholar] [CrossRef]
  25. O’Kane, J.P. Hysteresis in hydrology. Acta Geophys. Pol. 2005, 53, 373–383. [Google Scholar]
  26. Zhang, Q.; Manzoni, S.; Katul, G.; Porporato, A.; Yang, D. The hysteretic evapotranspiration—Vapor pressure deficit relation. J. Geophys. Res. Biogeosciences 2014, 119, 125–140. [Google Scholar] [CrossRef]
  27. Ewers, B.E.; Gower, S.T.; Bond-lamberty, B.; Wang, C.K. Effects of stand age and tree species on canopy transpiration and average stomatal conductance of boreal forests. Plant Cell Environ. 2005, 28, 660–678. [Google Scholar] [CrossRef]
  28. Meinzer, F.C.; Goldstein, G.; Franco, A.C.; Bustamante, M.; Igler, E.; Jackson, P.; Caldas, L.; Rundel, P.W. Atmospheric and hydraulic limitations on transpiration in Brazilian cerrado woody species. Funct. Ecol. 1999, 13, 273–282. [Google Scholar] [CrossRef]
  29. O’Brien, J.J.; Oberbauer, S.F.; Clark, D.B. Whole tree xylem sap flow responses to multiple environmental variables in a wet tropical forest. Plant Cell Environ. 2004, 27, 551–567. [Google Scholar] [CrossRef]
  30. O’Grady, A.P.; Worledge, D.; Battaglia, M. Constraints on transpiration of Eucalyptus globulus in southern Tasmania, Australia. Agric. Meteorol. 2008, 148, 453–465. [Google Scholar] [CrossRef]
  31. Unsworth, M.H.; Phillips, N.; Link, T.; Bond, B.J.; Falk, M.; Harmon, M.E.; Hinckley, T.M.; Marks, D.; Paw, U.K.T. Components and controls of water flux in an old-growth douglas-fir-western hemlock ecosystem. Ecosystems 2004, 7, 468–481. [Google Scholar] [CrossRef]
  32. Wullschleger, S.D.; Hanson, P.J.; Tschaplinski, T.J. Whole-plant water flux in understory red maple exposed to altered precipitation regimes. Tree Physiol. 1998, 18, 71–79. [Google Scholar] [CrossRef]
  33. Zeppel, M.J.B.; Murray, B.R.; Barton, C.; Eamus, D. Seasonal responses of xylem sap velocity to VPD and solar radiation during drought in a stand of native trees in temperate Australia. Funct. Plant Biol. 2004, 31, 461–470. [Google Scholar] [CrossRef] [PubMed]
  34. Bai, Y.; Li, X.; Liu, S.; Wang, P. Modelling diurnal and seasonal hysteresis phenomena of canopy conductance in an oasis forest ecosystem. Agric. For. Meteorol. 2017, 246, 98–110. [Google Scholar] [CrossRef]
  35. Scalisi, A.; Marino, G.; Marra, F.P.; Caruso, T.; Lo Bianco, R. A Cultivar-Sensitive Approach for the Continuous Monitoring of Olive (Olea europaea L.) Tree Water Status by Fruit and Leaf Sensing. Front. Plant Sci. 2020, 11, 340. [Google Scholar] [CrossRef]
  36. Kottek, M.; Grieser, J.; Beck, C.; Rudolf, B.; Rubel, F. World map of the Köppen-Geiger climate classification updated. Meteorol. Z. 2006, 15, 259–263. [Google Scholar] [CrossRef]
  37. COI (International Olive Council). Guide for the Determination of the Characteristics of Oil Olives, COI/OH/Doc. No 1 November 2011. Available online: http://www.internationaloliveoil.org (accessed on 15 September 2021).
  38. Monteith, J.; Unsworth, M. Principles of Environmental Physics: Plants, Animals, and the Atmosphere; Academic Press: Cambridge, MA, USA, 2013. [Google Scholar]
  39. Perez-Martin, A.; Flexas, J.; Ribas-Carbó, M.; Bota, J.; Tomàs, M.; Infante, J.M.; Diaz-Espejo, A. Interactive effects of soil water deficit and air vapour pressure deficit on mesophyll conductance to CO2 in Vitis vinifera and Olea europaea. J. Exp. Bot. 2009, 60, 2391–2405. [Google Scholar] [CrossRef]
  40. Novick, K.A.; Miniat, C.F.; Vose, J.M. Drought limitations to leaf-level gas exchange: Results from a model linking stomatal optimization and cohesion-tension theory. Plant Cell Environ. 2016, 39, 583–596. [Google Scholar] [CrossRef] [Green Version]
  41. Morandi, B.; Rieger, M.; Grappadelli, L.C. Vascular flows and transpiration affect peach (Prunus persica Batsch.) fruit daily growth. J. Exp. Bot. 2007, 58, 3941–3947. [Google Scholar] [CrossRef] [Green Version]
  42. Bianco, R.L.; Scalisi, A. Water relations and carbohydrate partitioning of four greenhouse-grown olive genotypes under long-term drought. Trees 2016, 31, 717–727. [Google Scholar] [CrossRef]
  43. Kong, W.; Rui, H.; Na, L.; Wanming, B.; Junyi, M.; Xiaoyong, B.; Junyu, L.; Junlong, W.; Ji, Z. Dynamic assessment of the fruit quality of olives cultivated in Longnan (China) during ripening. Sci. Hortic. 2019, 253, 8–16. [Google Scholar] [CrossRef]
  44. Zhang, R.; Xu, X.; Liu, M.; Zhang, Y.; Xu, C.; Yi, R.; Luo, W.; Soulsby, C. Hysteresis in sap flow and its controlling mechanisms for a deciduous broad-leaved tree species in a humid karst region. Sci. China Earth Sci. 2019, 62, 1744–1755. [Google Scholar] [CrossRef]
  45. Chen, L.; Zhang, Z.; Li, Z.; Tang, J.; Caldwell, P.; Zhang, W. Biophysical control of whole tree transpiration under an urban environment in Northern China. J. Hydrol. 2011, 402, 388–400. [Google Scholar] [CrossRef]
  46. Bai, Y.; Zhu, G.; Su, Y.; Zhang, K.; Han, T.; Ma, J.; Wang, W.; Ma, T.; Feng, L. Hysteresis loops between canopy conductance of grapevines and meteorological variables in an oasis ecosystem. Agric. For. Meteorol. 2015, 214-215, 319–327. [Google Scholar] [CrossRef]
  47. Janssen, R.H.H.; Meinders, M.B.J.; van Nes, E.H.; Scheffer, M. Microscale vegetation-soil feedback boosts hysteresis in a regional vegetation-climate system. Glob. Chang. Biol. 2008, 14, 1104–1112. [Google Scholar] [CrossRef]
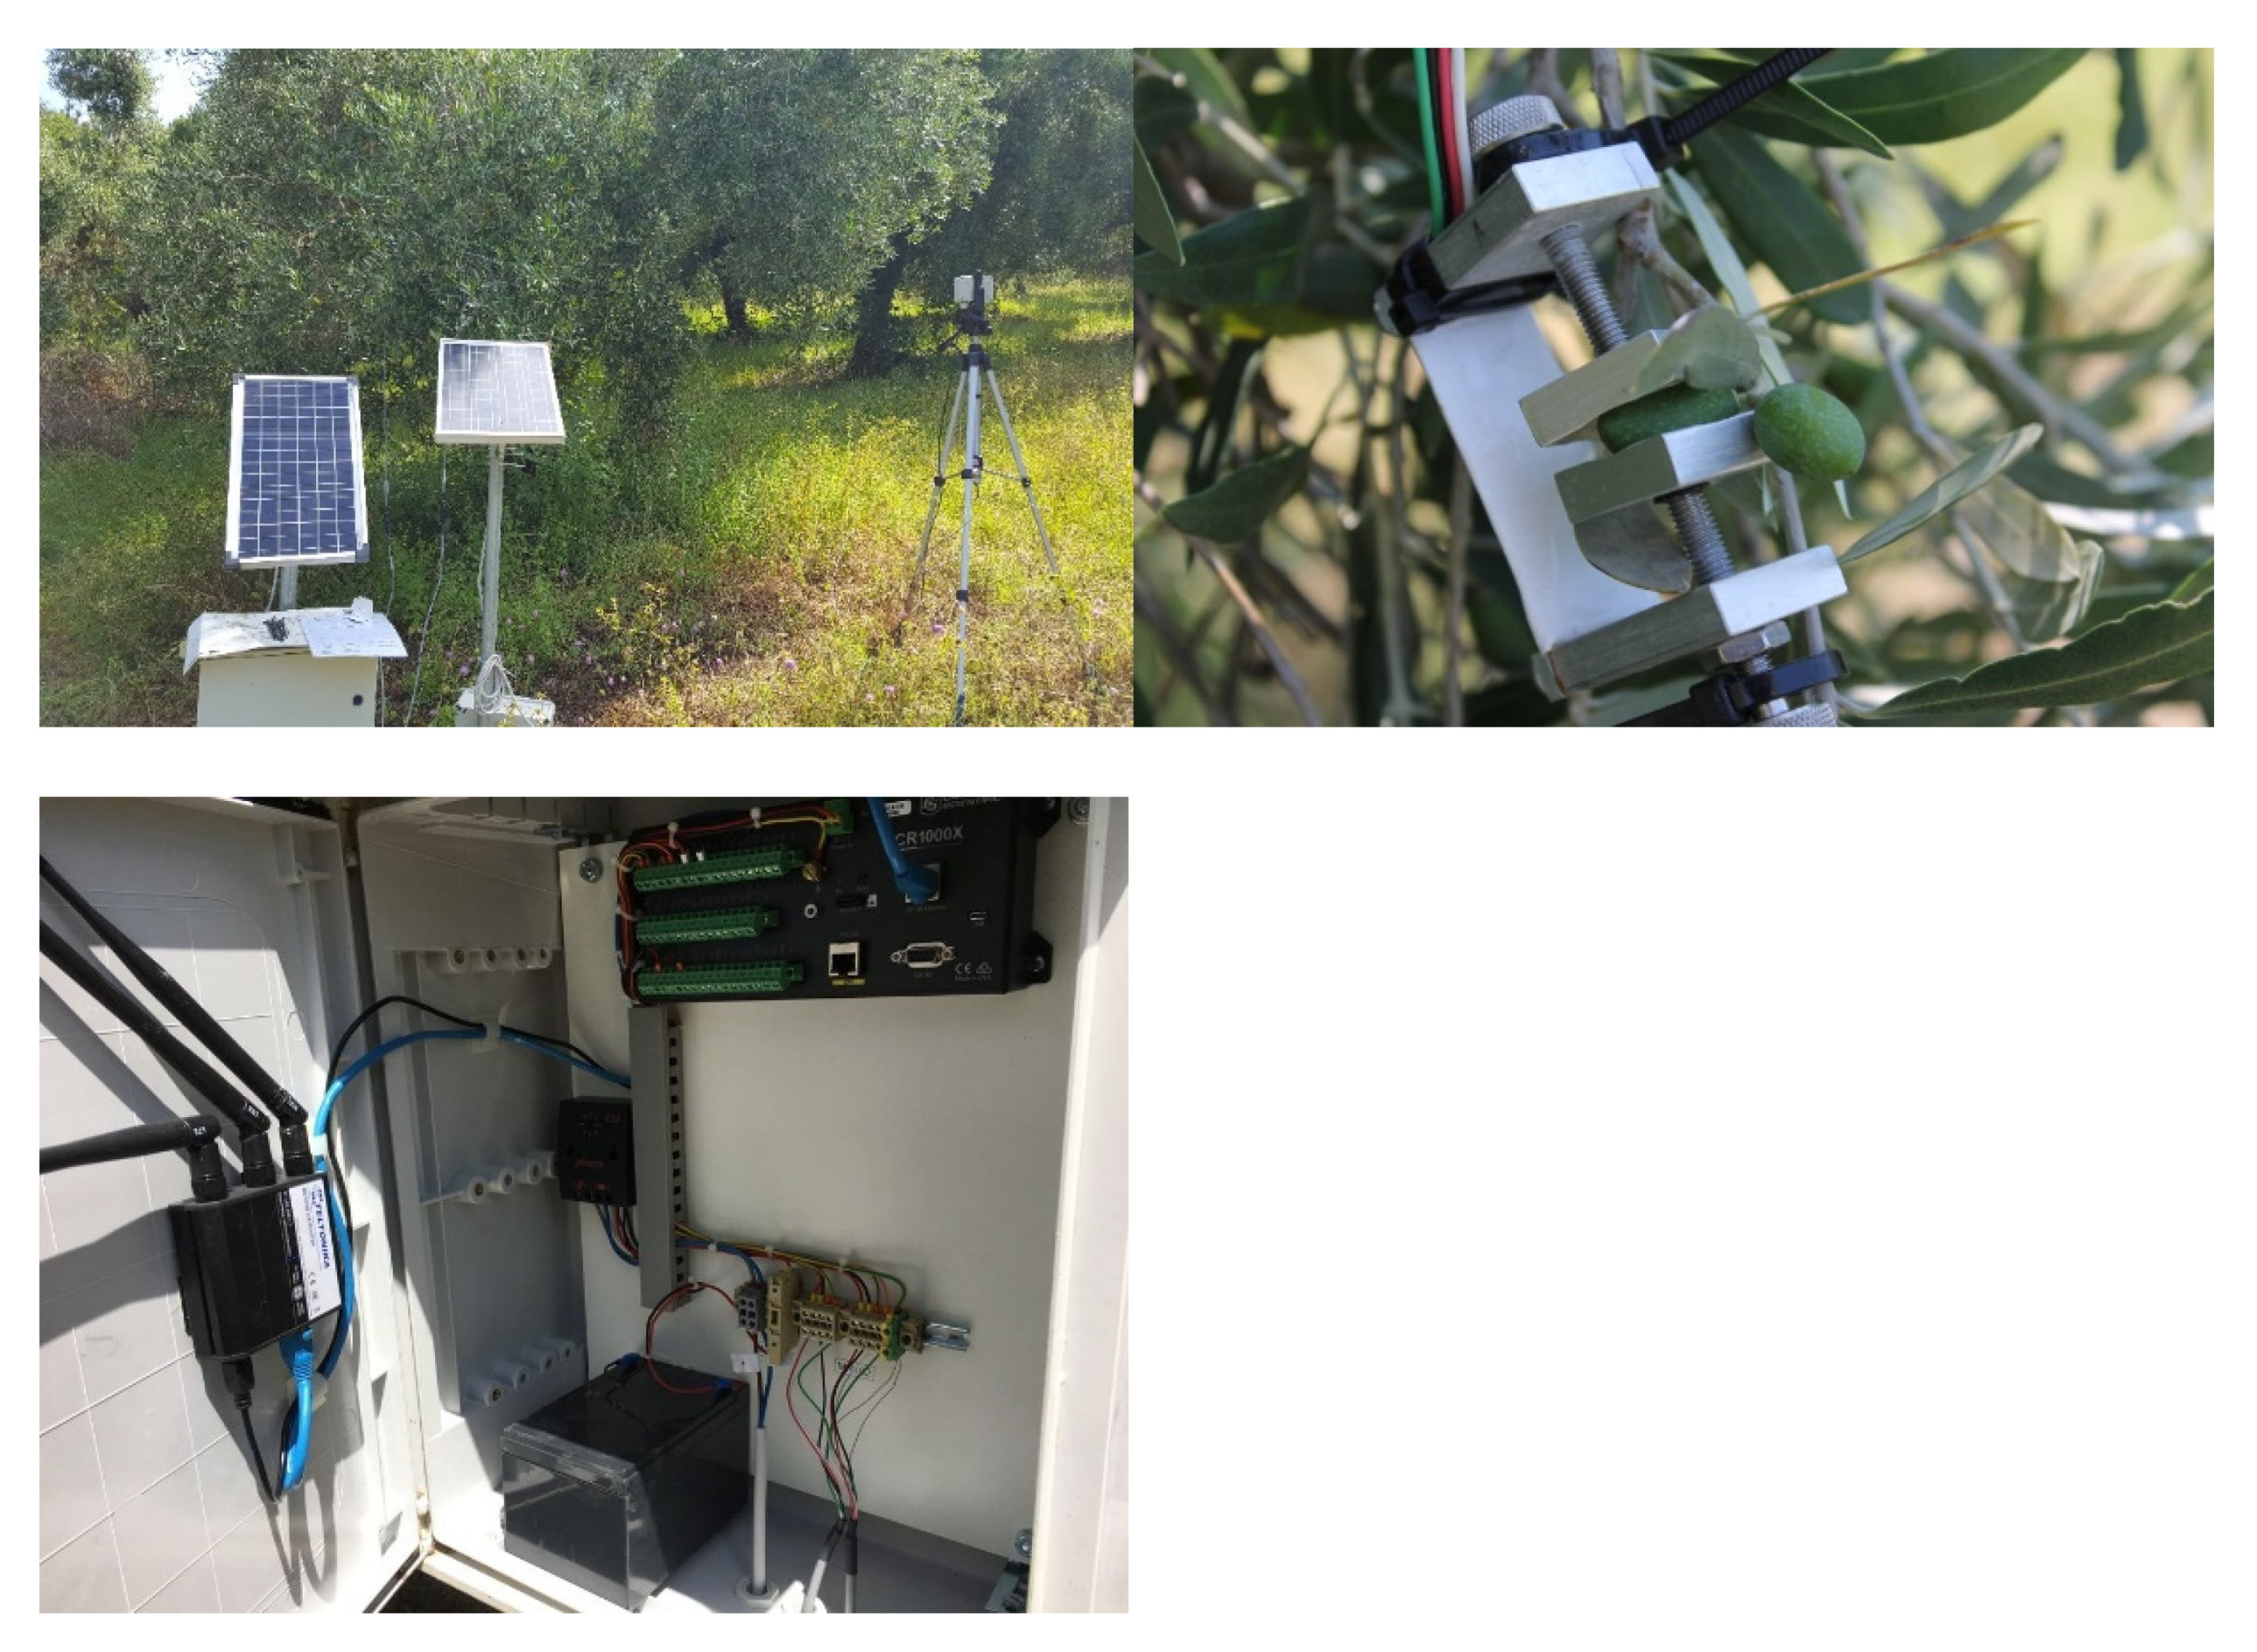
Figure 1. Olive orchard with camera and extensimeter in the olive tree powered by solar panel. Camera equipped with solar panel and AWS S3 storage(Amazon Web Services, Inc., Seattle, WA, USA) (lefttop); highly precise DEX20 extensimeters (righttop); Campbell scientific data logger CR1000X inside the metal box of data logger (leftdown).
Horticulturae 07 00349 g001
Figure 2. Continuous measurements of transversal diameter of fruit A (blue) and B (red). The first period of the study was from DOY 218 to 276 in 2019 and the second period of the study was from DOY 277 to 298 in 2019. Green dashed lines were drawn to separate fruit growth phases. An interval period of one week separated the end of the II phase from the following one. For this reason, there are two green dashed lines for ending the II phase of fruit growth.
Horticulturae 07 00349 g002
Figure 3. Continuous measurements of transversal diameter of fruit A and fruit B at selected days during the first period of the experiment.
Horticulturae 07 00349 g003
Figure 4. Continuous measurements of transversal diameter of fruit A and fruit B in exceptional days of the first period of the experiment.
Horticulturae 07 00349 g004aHorticulturae 07 00349 g004b
Figure 5. Continuous measurements of transversal diameter of fruit A and fruit B at example days of the second period of the experiment.
Horticulturae 07 00349 g005
Figure 6. Correlation between transversal diameter and VPD for fruit A and B in four example days of the first period of the experiment: (a) complete clockwise hysteresis curve; (b) no noticeable model of hysteresis curve; (c) partial clockwise hysteresis curve; (d) incomplete clockwise hysteresis curve.
Horticulturae 07 00349 g006
Figure 7. Transversal diameter versus VPD in all days of the first period of the experiment.
Horticulturae 07 00349 g007
Figure 8. Correlation between transversal diameter and VPD for fruit A and B in four example days of the second period of the experiment: (a) incomplete clockwise hysteresis loop; (b) hysteresis loop which is near partial clockwise hysteresis loop; (c) partial clockwise hysteresis loop; (d) incomplete clockwise hysteresis loop for fruit A and complete clockwise hysteresis for fruit B.
Horticulturae 07 00349 g008
Figure 9. Transversal diameter versus VPD in all days of the second period of the experiment.
Horticulturae 07 00349 g009
Figure 10. VPD versus transversal diameter for fruits A and B in both periods (first and second) of the experiment. The red box shows the area with minimum VPD and maximum transversal diameter. The orange dotted line shows almond shapes for both parts of the first period of the experiment and oval shapes for the second part.
Horticulturae 07 00349 g010aHorticulturae 07 00349 g010b
Figure 11. Fruit ripening data extracted from images of time-lapse video.
Horticulturae 07 00349 g011
Figure 12. Pictures taken by automatic camera at three random days of the experiment. September 3rd (DOY 246) (lefttop); 17th of September (DOY 259) (righttop); October 4th (DOY 277) (leftdown). The image covering area was designed to represent the same fruit situation as fruits that were installed in the extensimeters. The collected images represented the canopy situation at the selected area.
Horticulturae 07 00349 g012
Table 1. VPD raw data. DOY 218 was beginning of experiment. So, the percentage of changing VPD in comparison with the same measured the day before (VPD daily variation) was exclude from table.
DOYVPD (kPa)VPD Daily Variation (%)Normalized VPDDOYVPD (kPa)VPD Daily Variation (%)Normalized VPDDOYVPD (kPa)VPD Daily Variation (%)Normalized VPD
2182.48-0.782450.98−33.330.252721.58−13.190.46
2191.96−21.000.592460.90−8.160.222731.8517.090.56
2201.53−21.910.442471.4763.330.422741.28−30.810.36
2211.540.750.452481.6411.560.482750.80−37.500.19
2222.5766.990.812490.41−75.000.052760.47−41.250.07
2232.9715.560.952500.6660.980.142770.9397.870.37
2242.72−8.420.862512.02206.060.622780.48−48.390.10
2251.65−39.340.492521.45−28.220.422791.15139.580.50
2261.41−14.550.402531.19−17.930.322800.94−18.260.37
2271.8833.330.572541.10−7.560.292810.973.190.39
2281.65−12.230.492551.187.270.322821.9297.940.95
2291.9920.610.612561.10−6.780.292831.08−43.750.46
2302.6633.670.842571.2715.450.352840.53−50.930.13
2312.836.390.902580.99−22.050.252850.6624.530.21
2322.79−1.410.892591.5253.540.442860.46−30.300.09
2331.76−36.920.522602.1843.420.672870.39−15.220.05
2341.39−21.020.392611.58−27.520.462880.95143.590.38
2350.96−30.940.242620.51−67.720.092891.3441.050.61
2361.2530.210.352631.30154.900.362900.98−26.870.40
2371.03−17.600.272641.19−8.460.322911.024.080.42
2381.2521.360.352650.69−42.020.152920.88−13.730.34
2391.5826.400.462660.51−26.090.092930.935.680.37
2401.643.800.482670.7241.180.162940.83−10.750.31
2411.43−12.800.412680.8619.440.212950.40−51.810.06
2421.7018.880.502690.62−27.910.122960.5127.500.12
2431.42−16.470.412700.8841.940.222970.510.000.12
2441.473.520.422711.82106.820.55
Publisher’s Note: MDPI stays neutral with regard to jurisdictional claims in published maps and institutional affiliations.