
Acidified Biochar Confers Improvement in Quality and Yield Attributes of Sufaid Chaunsa Mango in Saline Soil

 ,
,  ,
,  ,
,  and
and 
Abstract
:1. Introduction
2. Materials and Methods
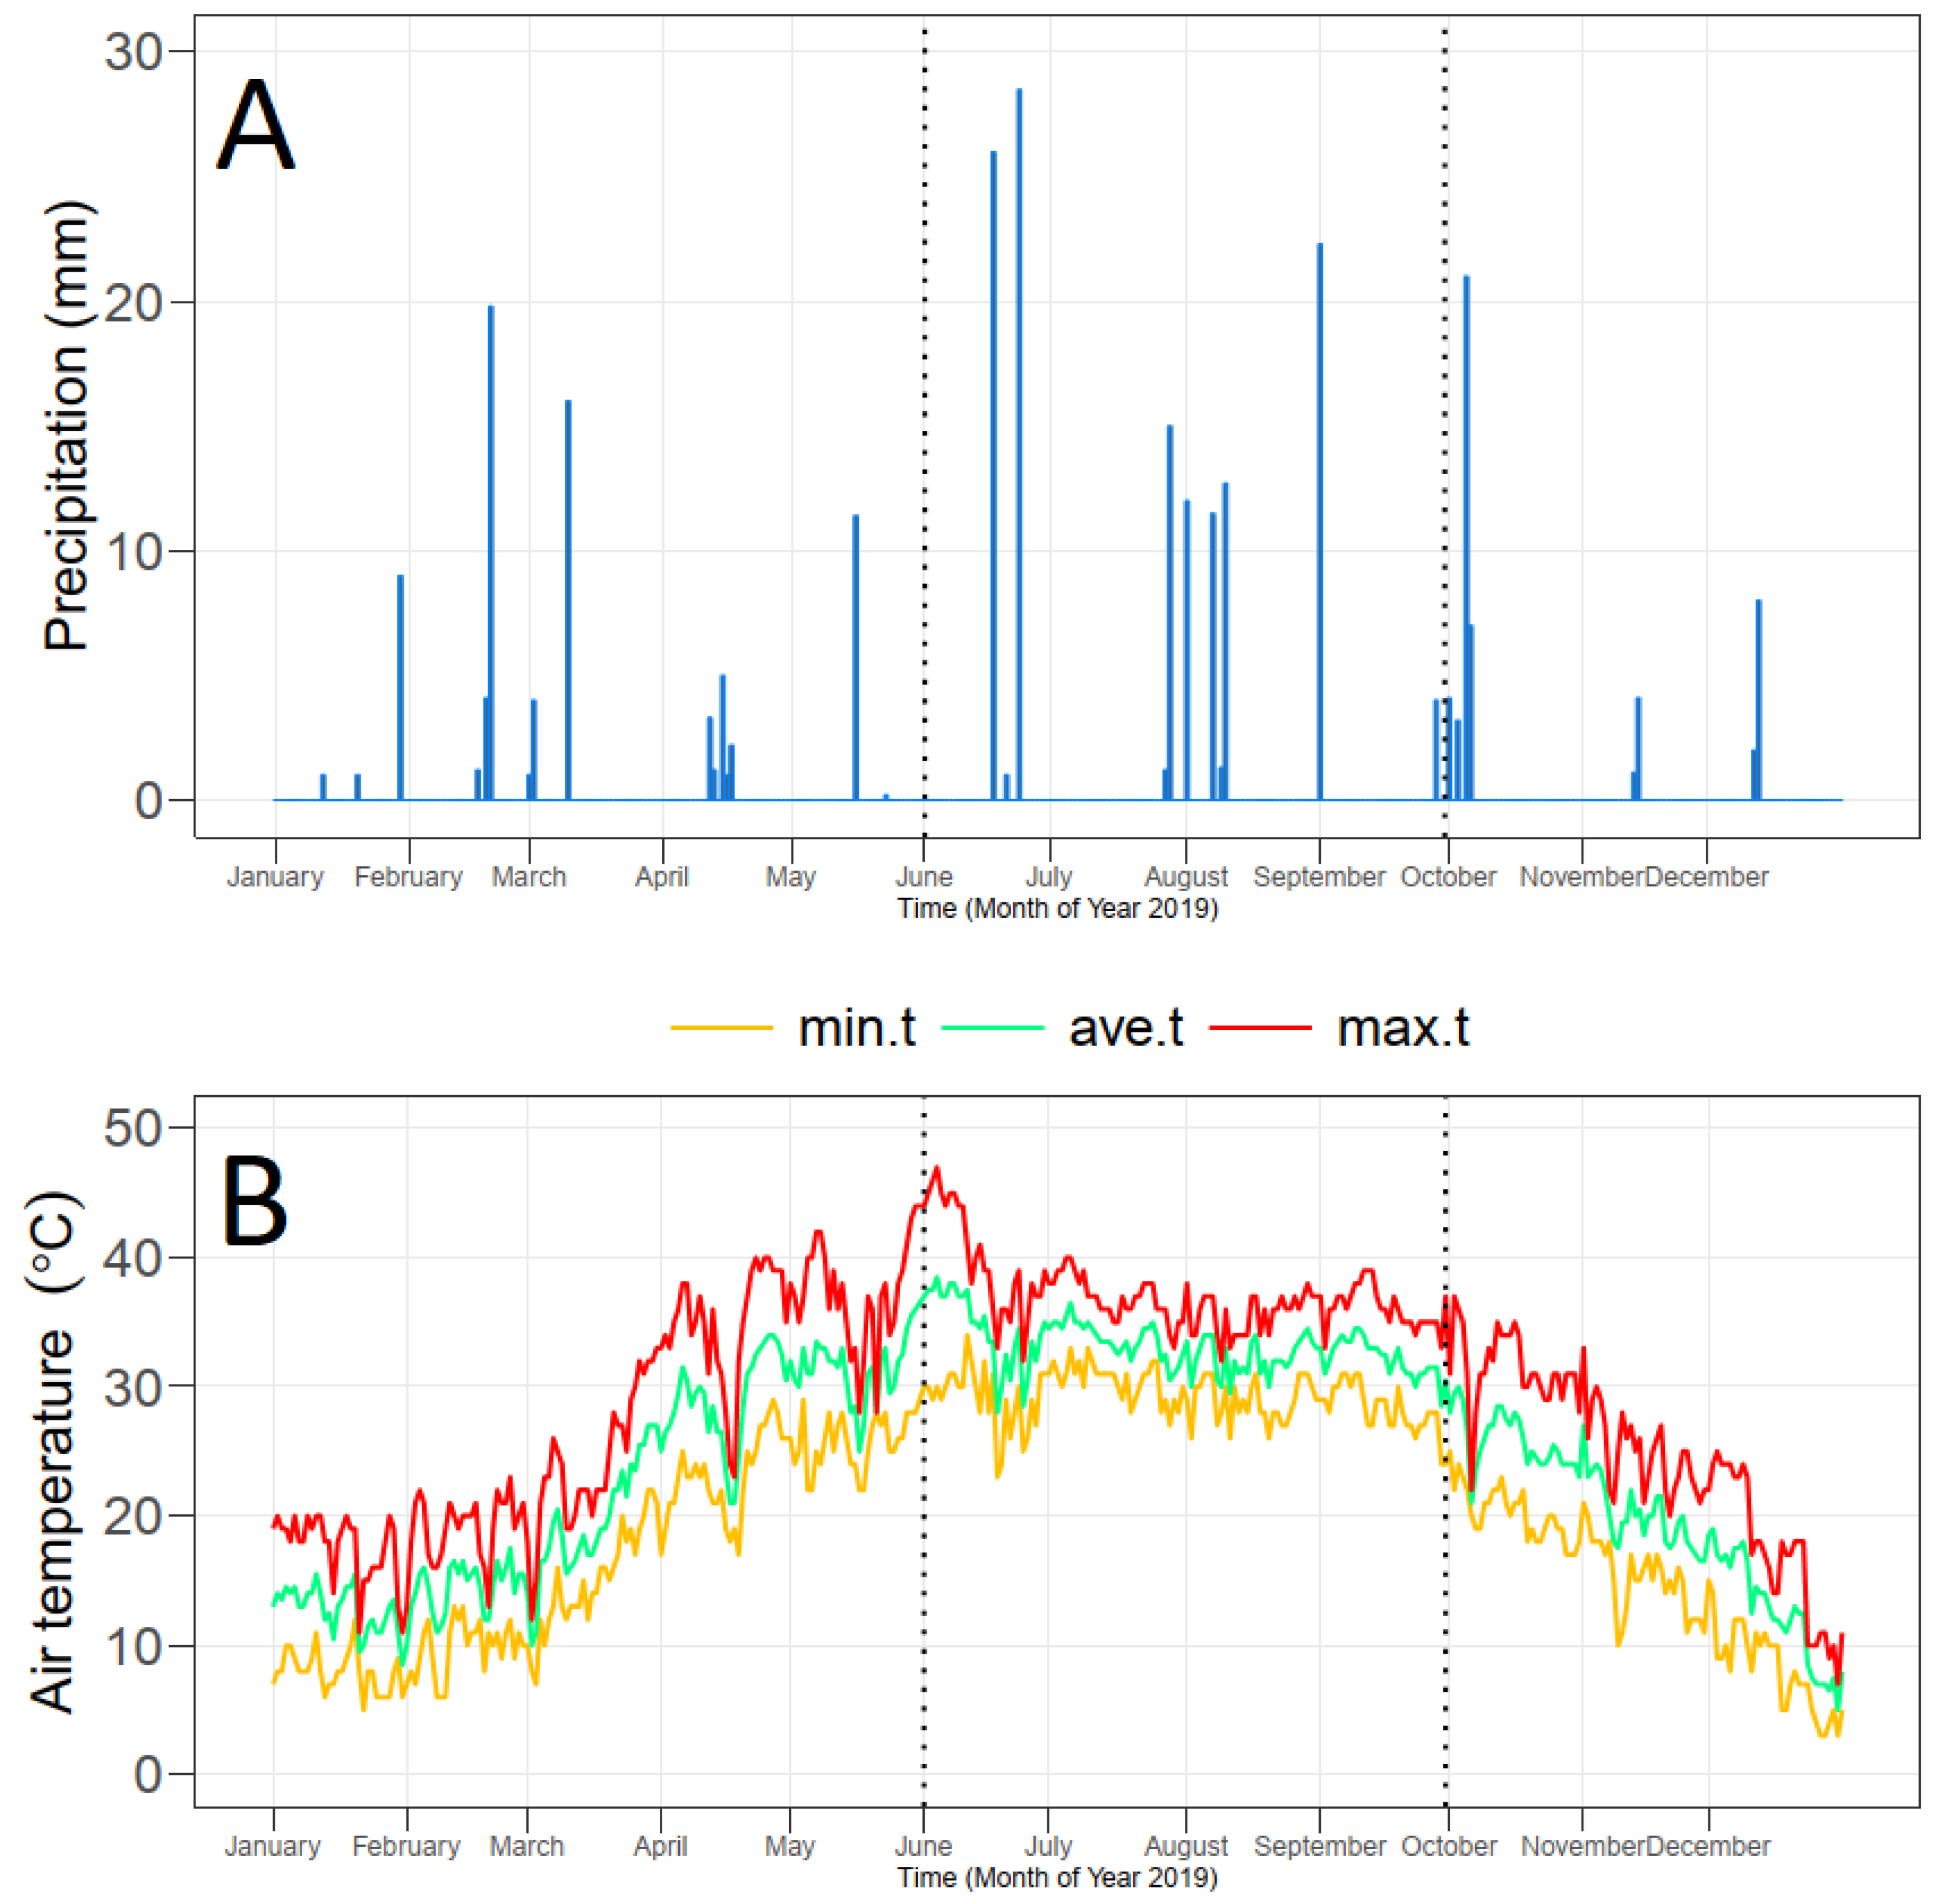
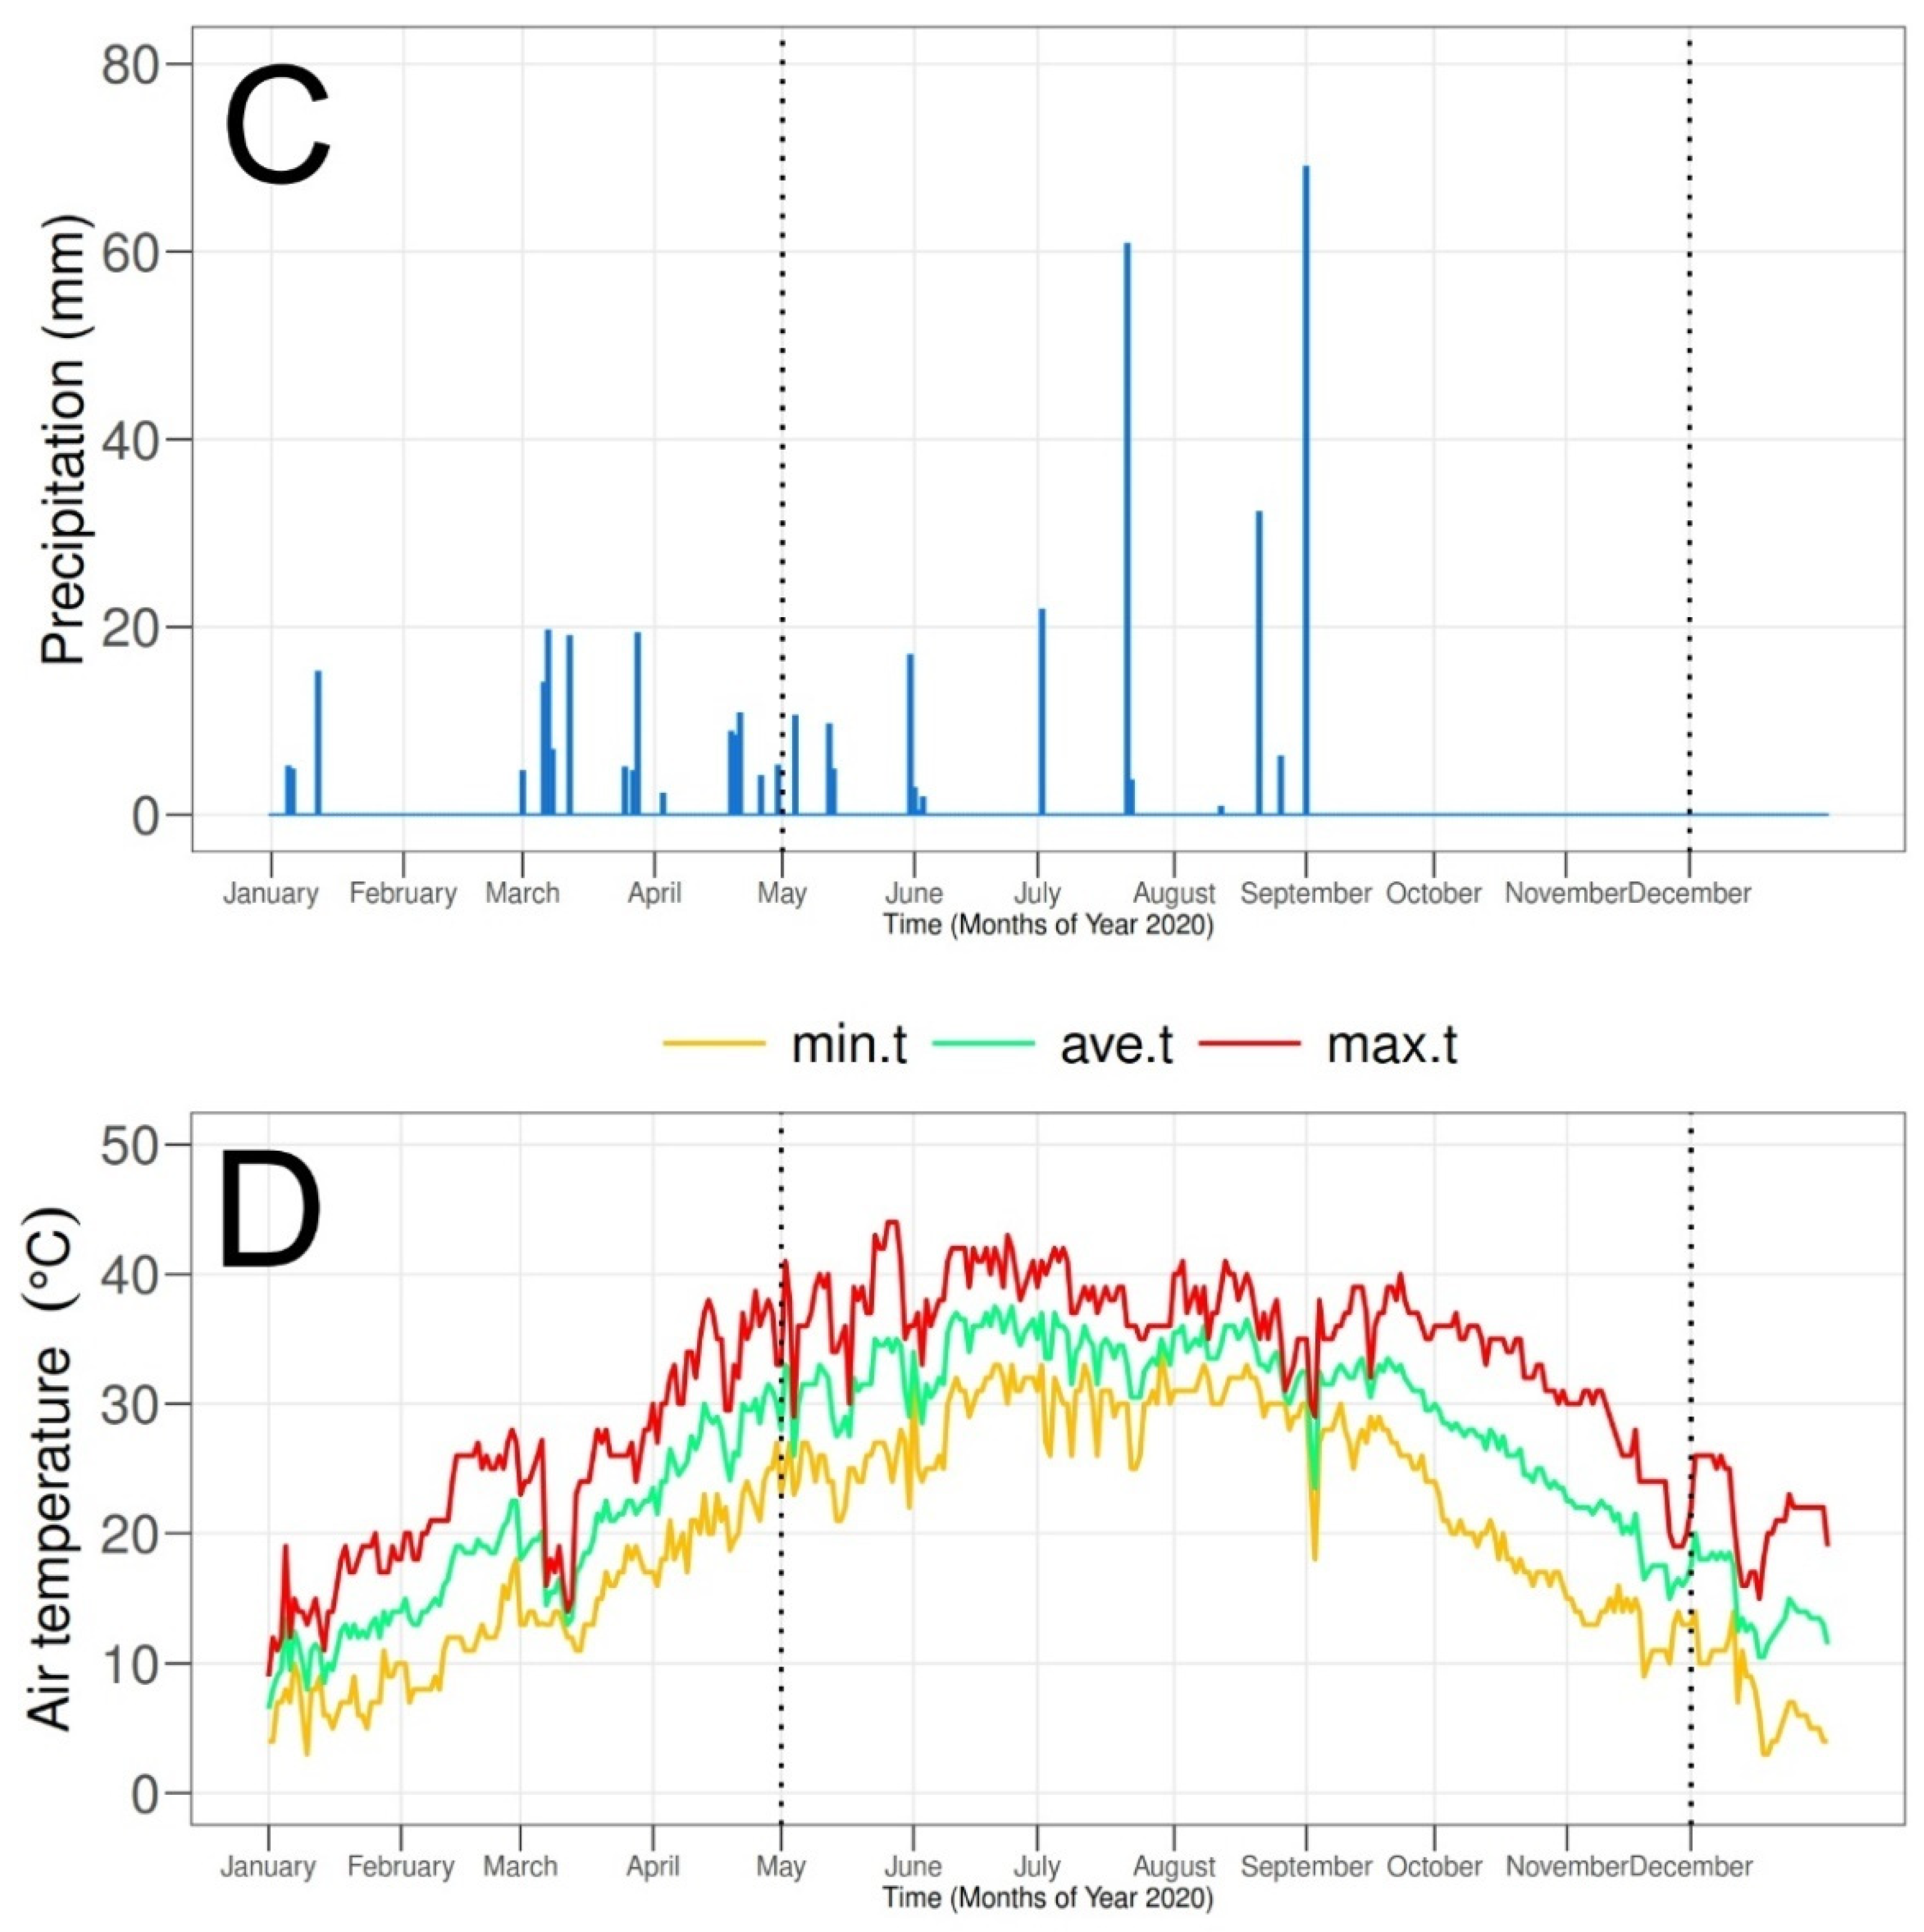
2.1. Experimental Site
2.2. Soil Characteristics
2.3. Biochar Preparations and Characterization
2.4. Treatment Plan and Mango Trees
2.5. NPK Application
2.6. Irrigation Practices
2.7. Analysis of Yield Attributes
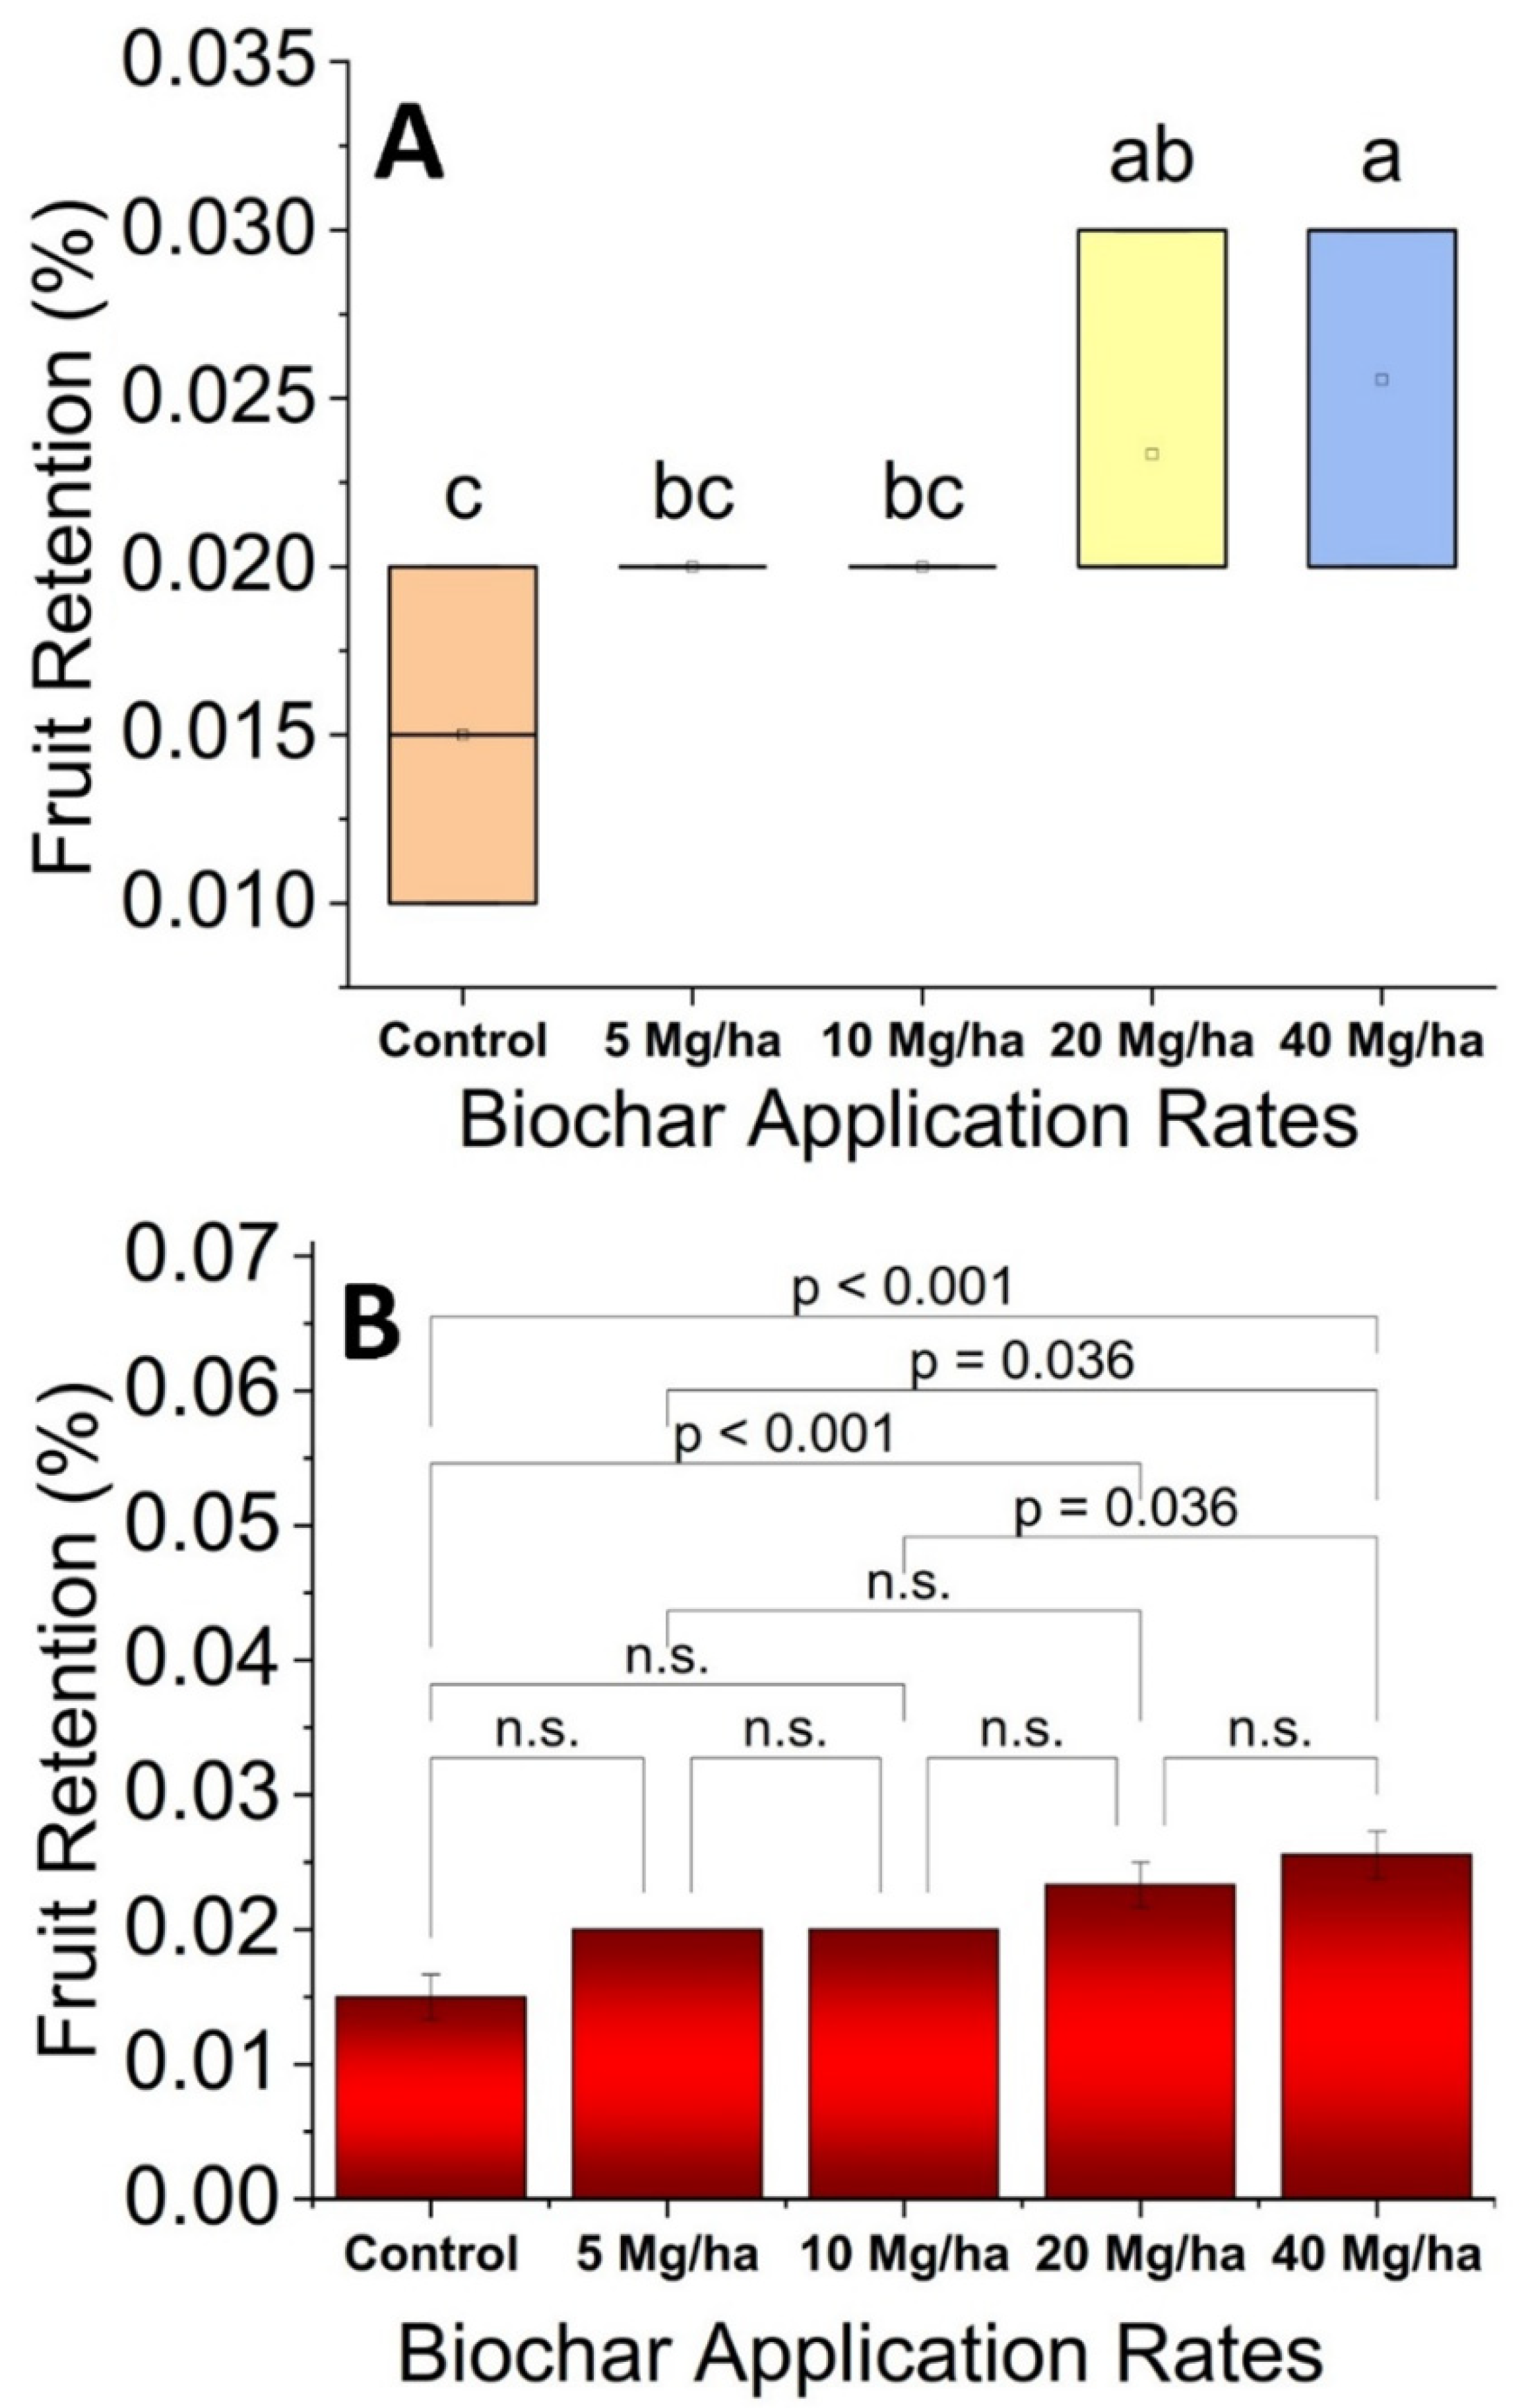
2.8. Fruit Retention
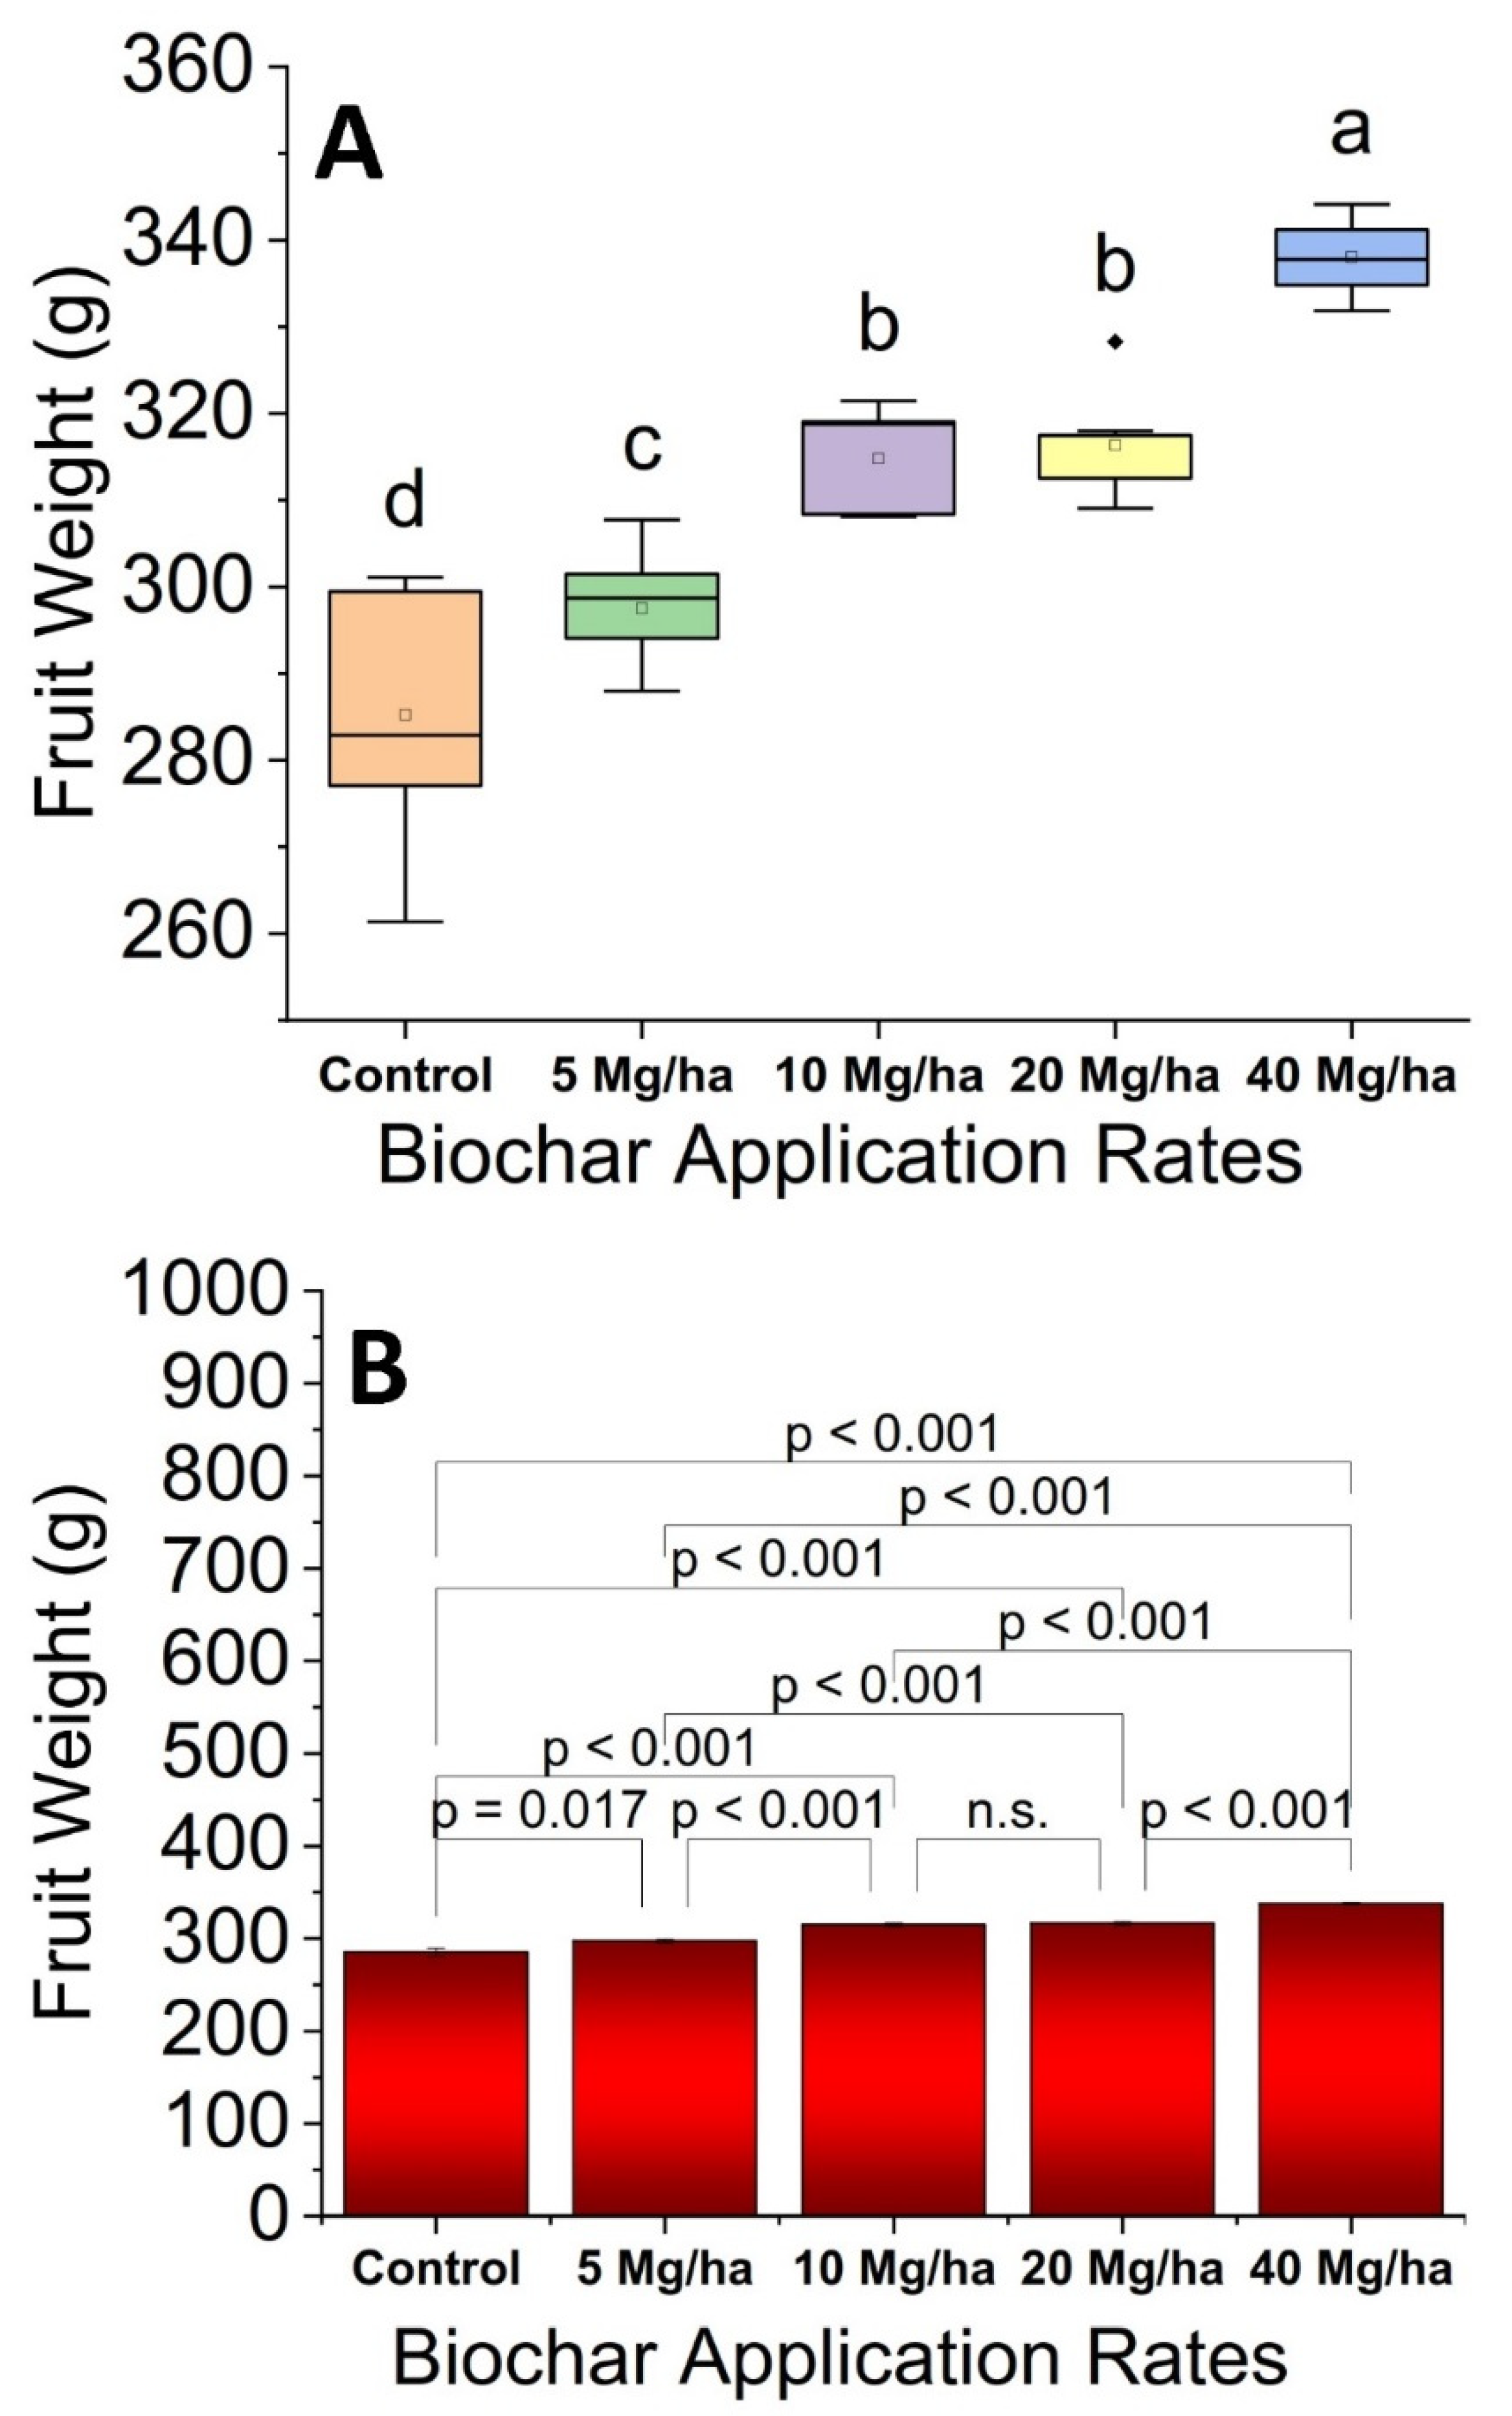
2.9. Fruit Weight
2.10. Fruit Yield
2.11. Soluble Sugars
2.12. Acidity
2.13. Ash Content
2.14. Total Soluble Solids (TSS)
2.15. Statistical Analysis
3. Results and Discussion
3.1. Fruit Retention
3.2. Fruit Weight
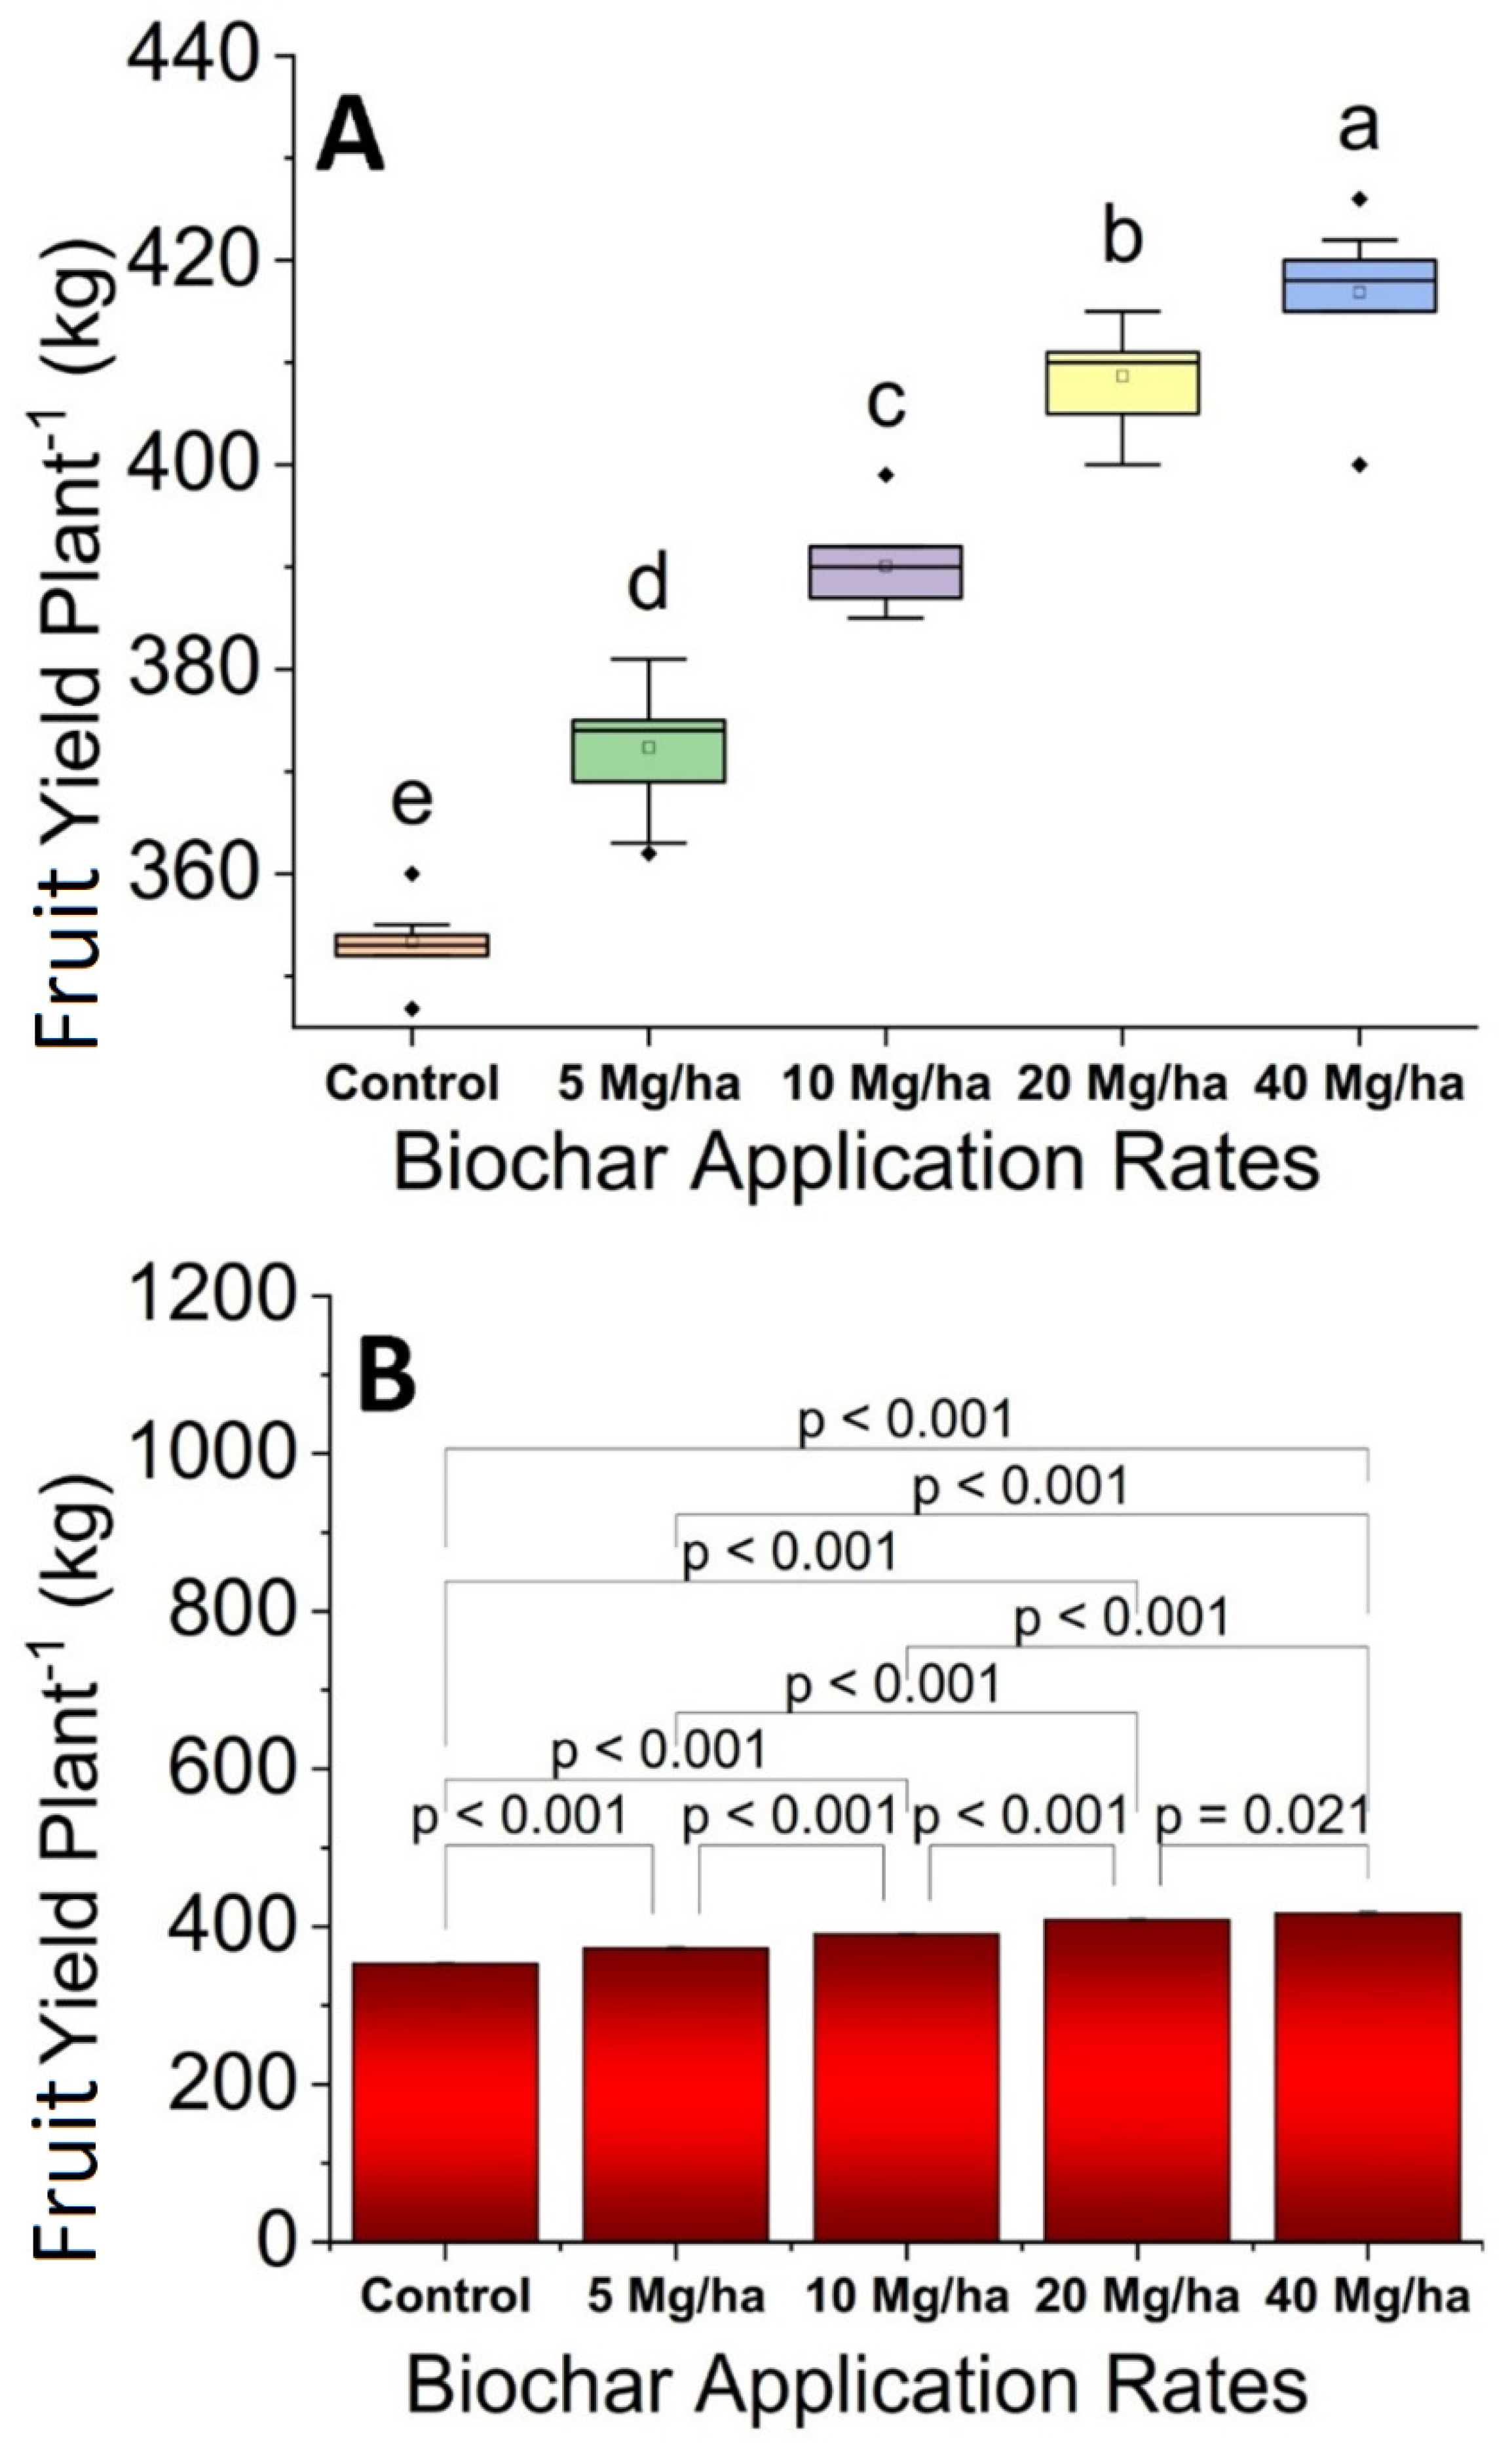
3.3. Fruit Yield
3.4. Sugar Contents
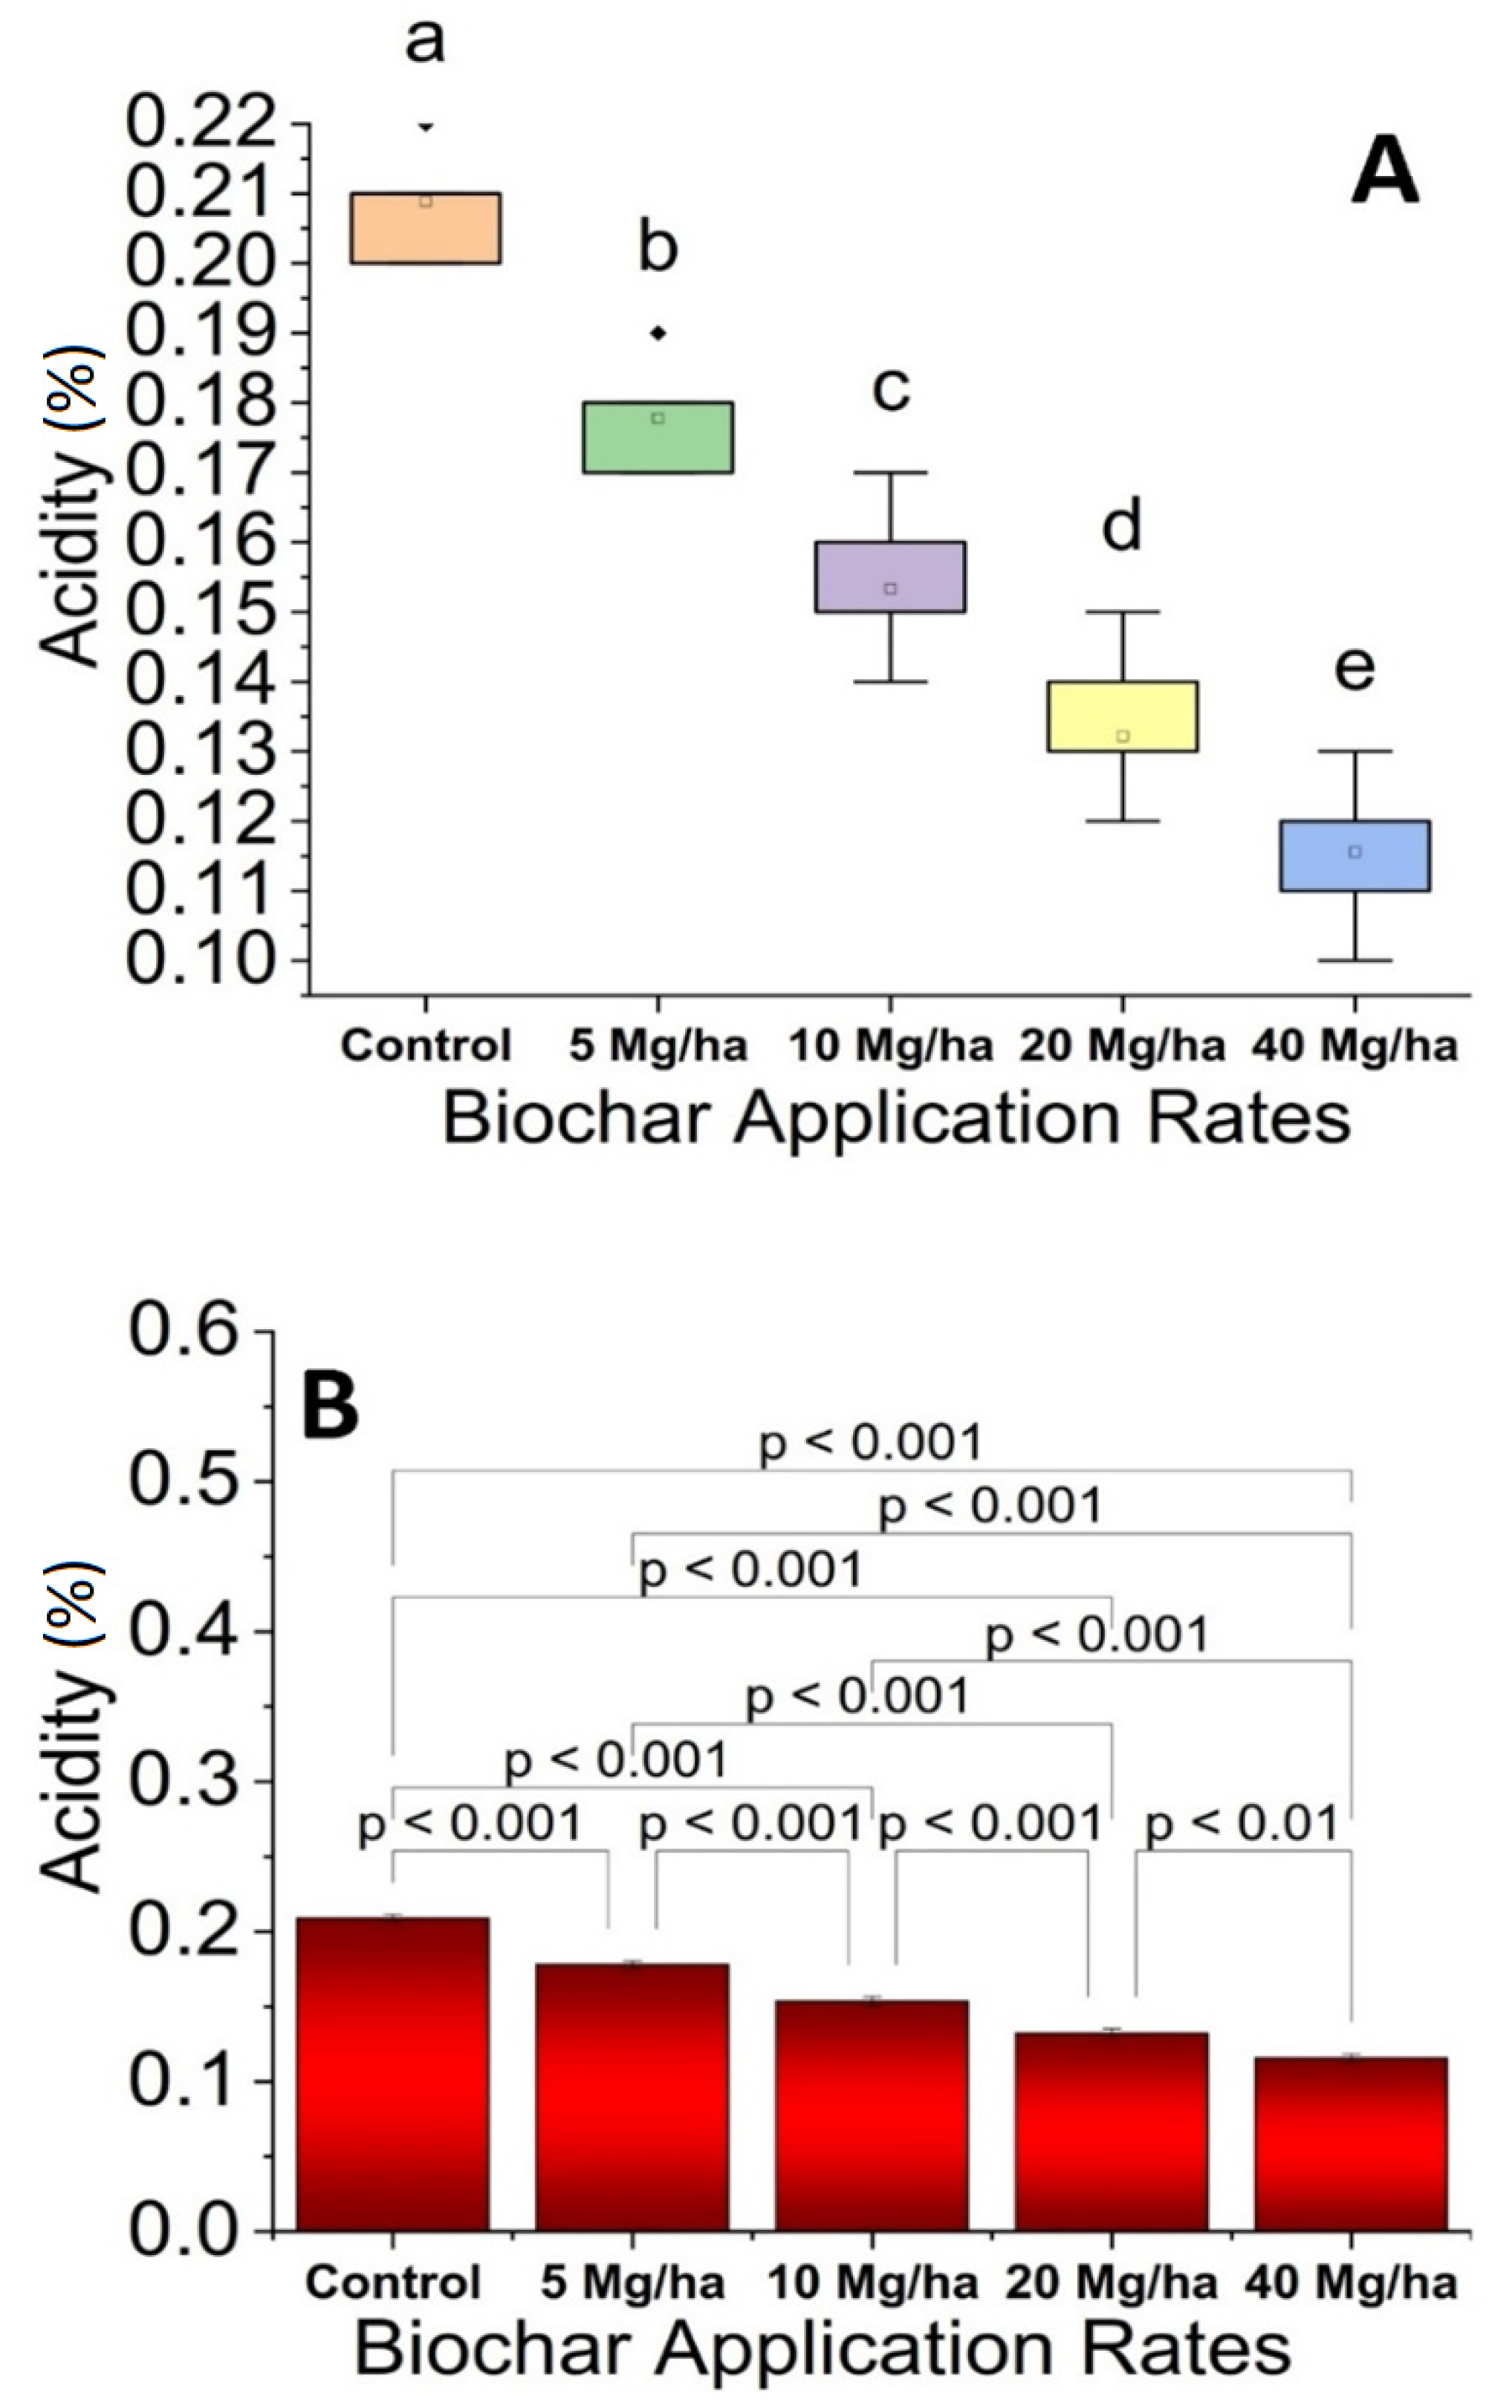
3.5. Acidity
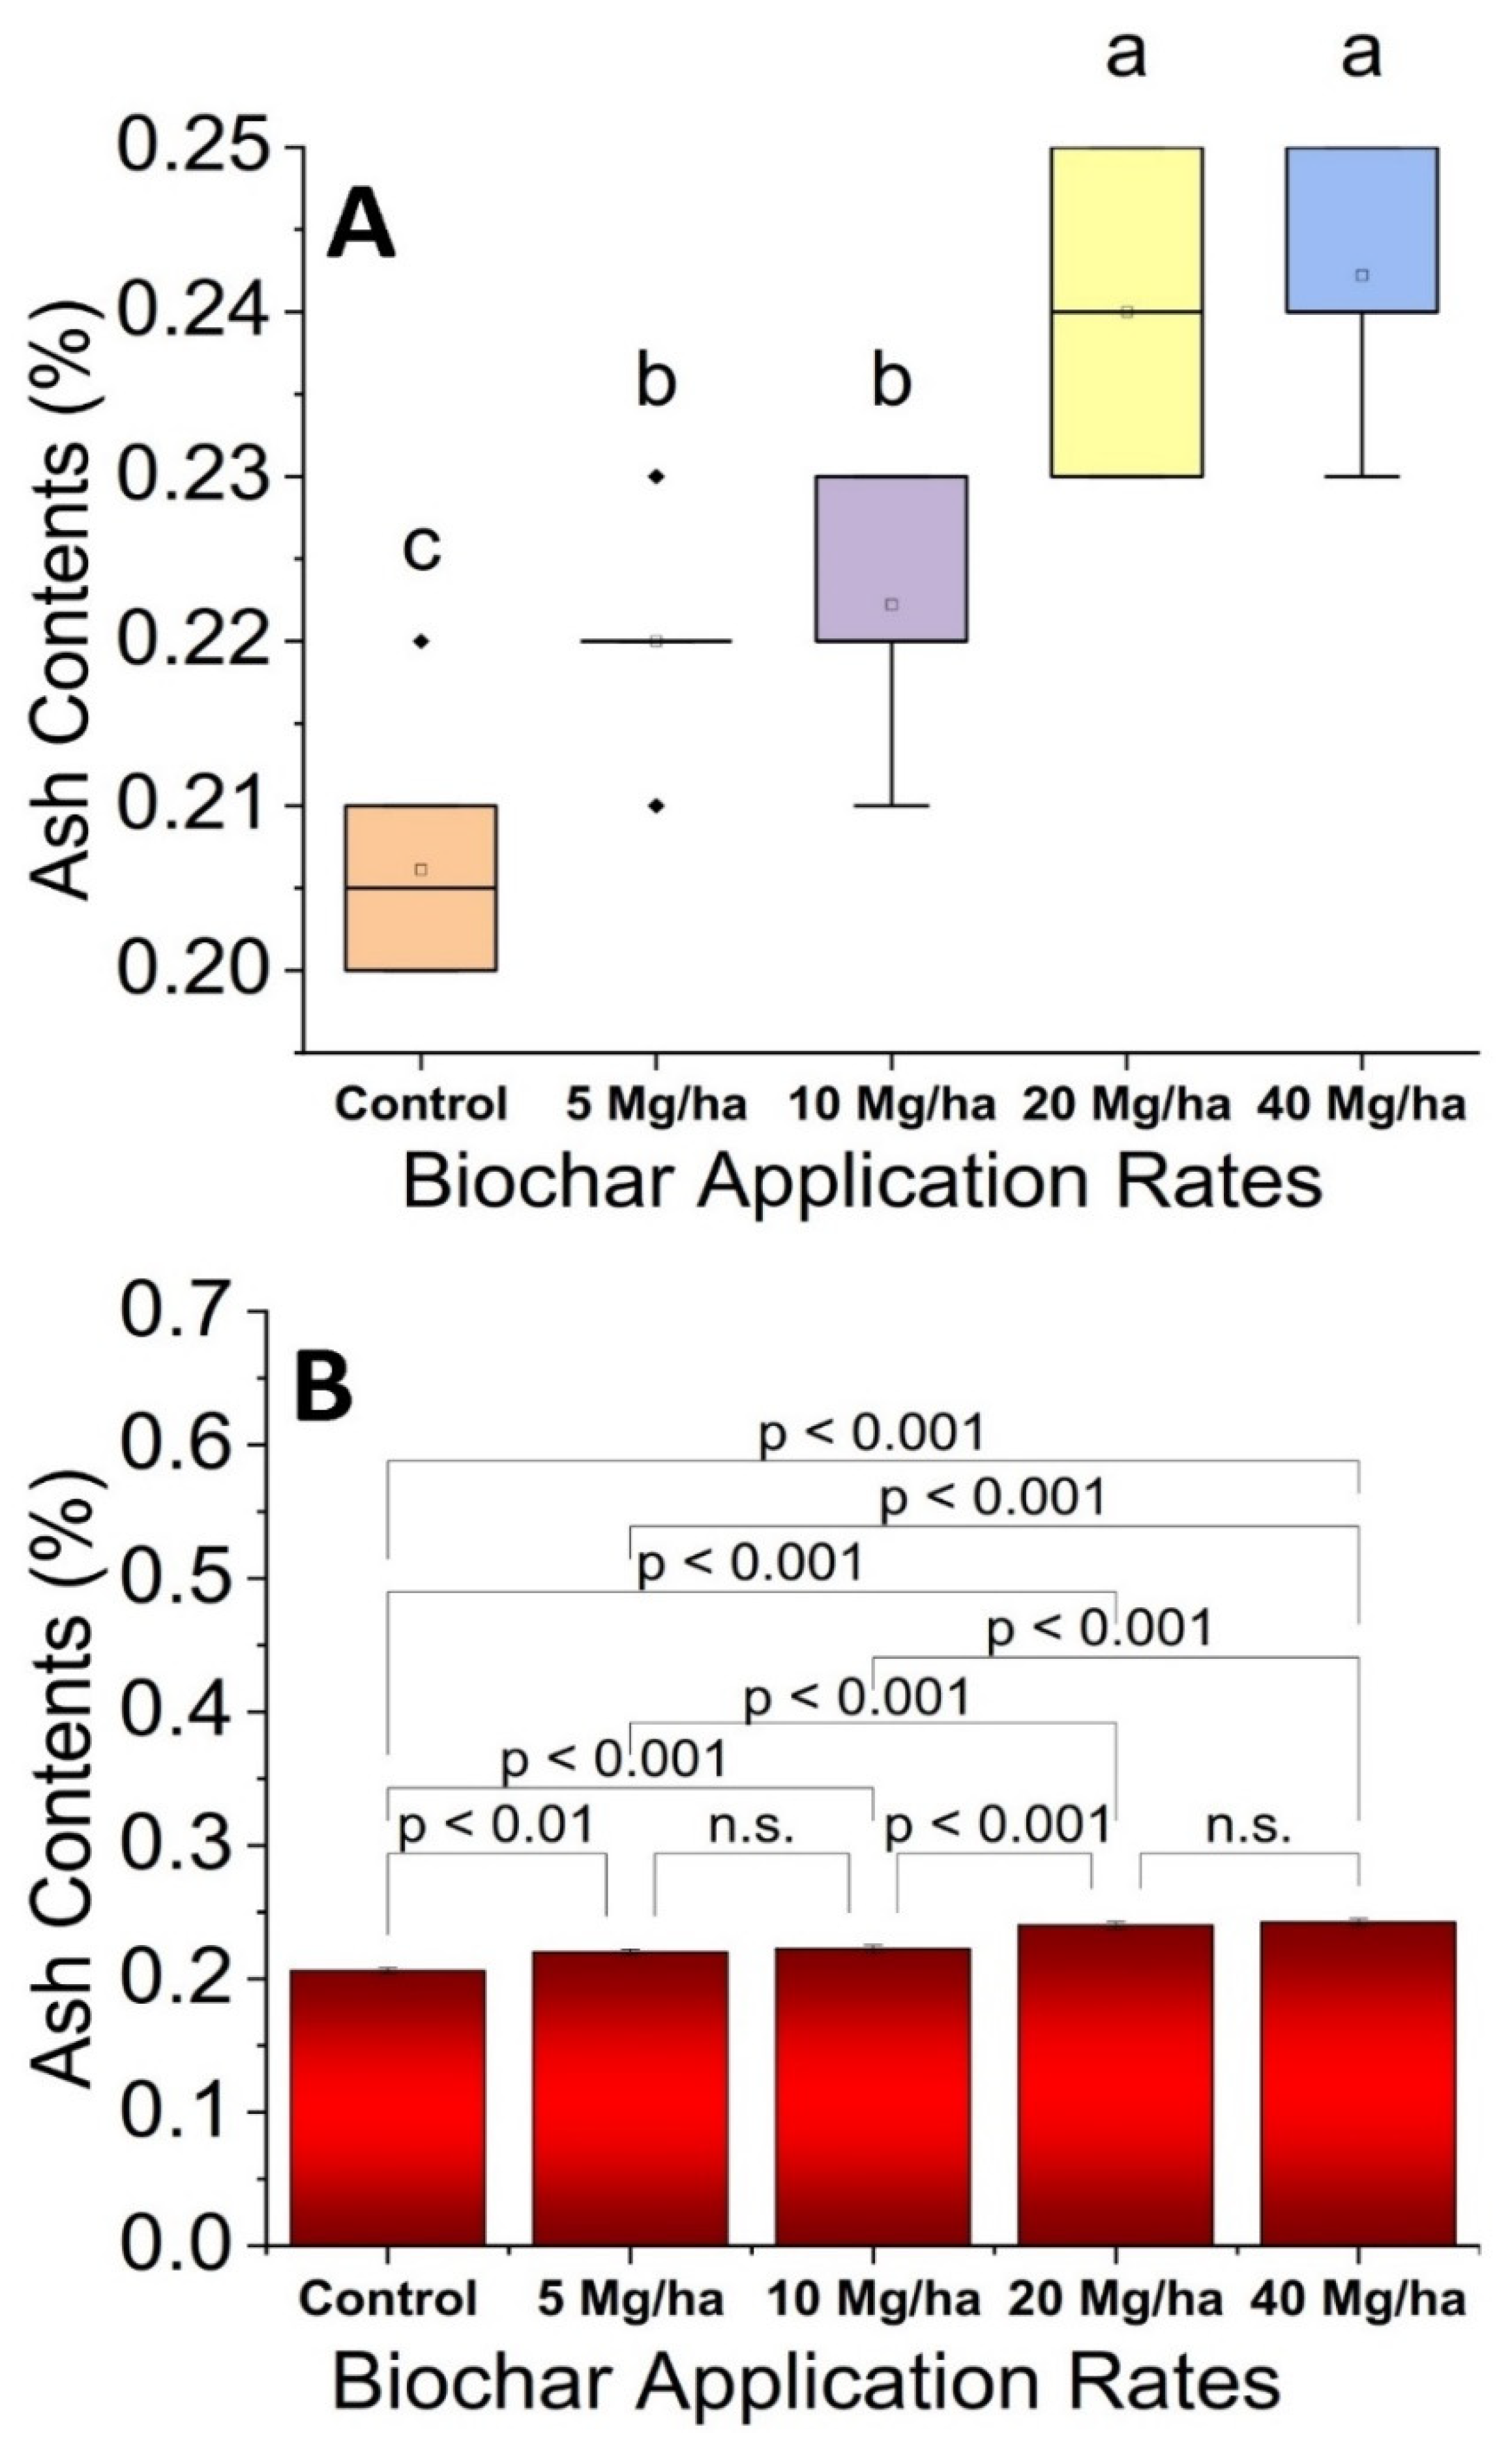
3.6. Ash Contents
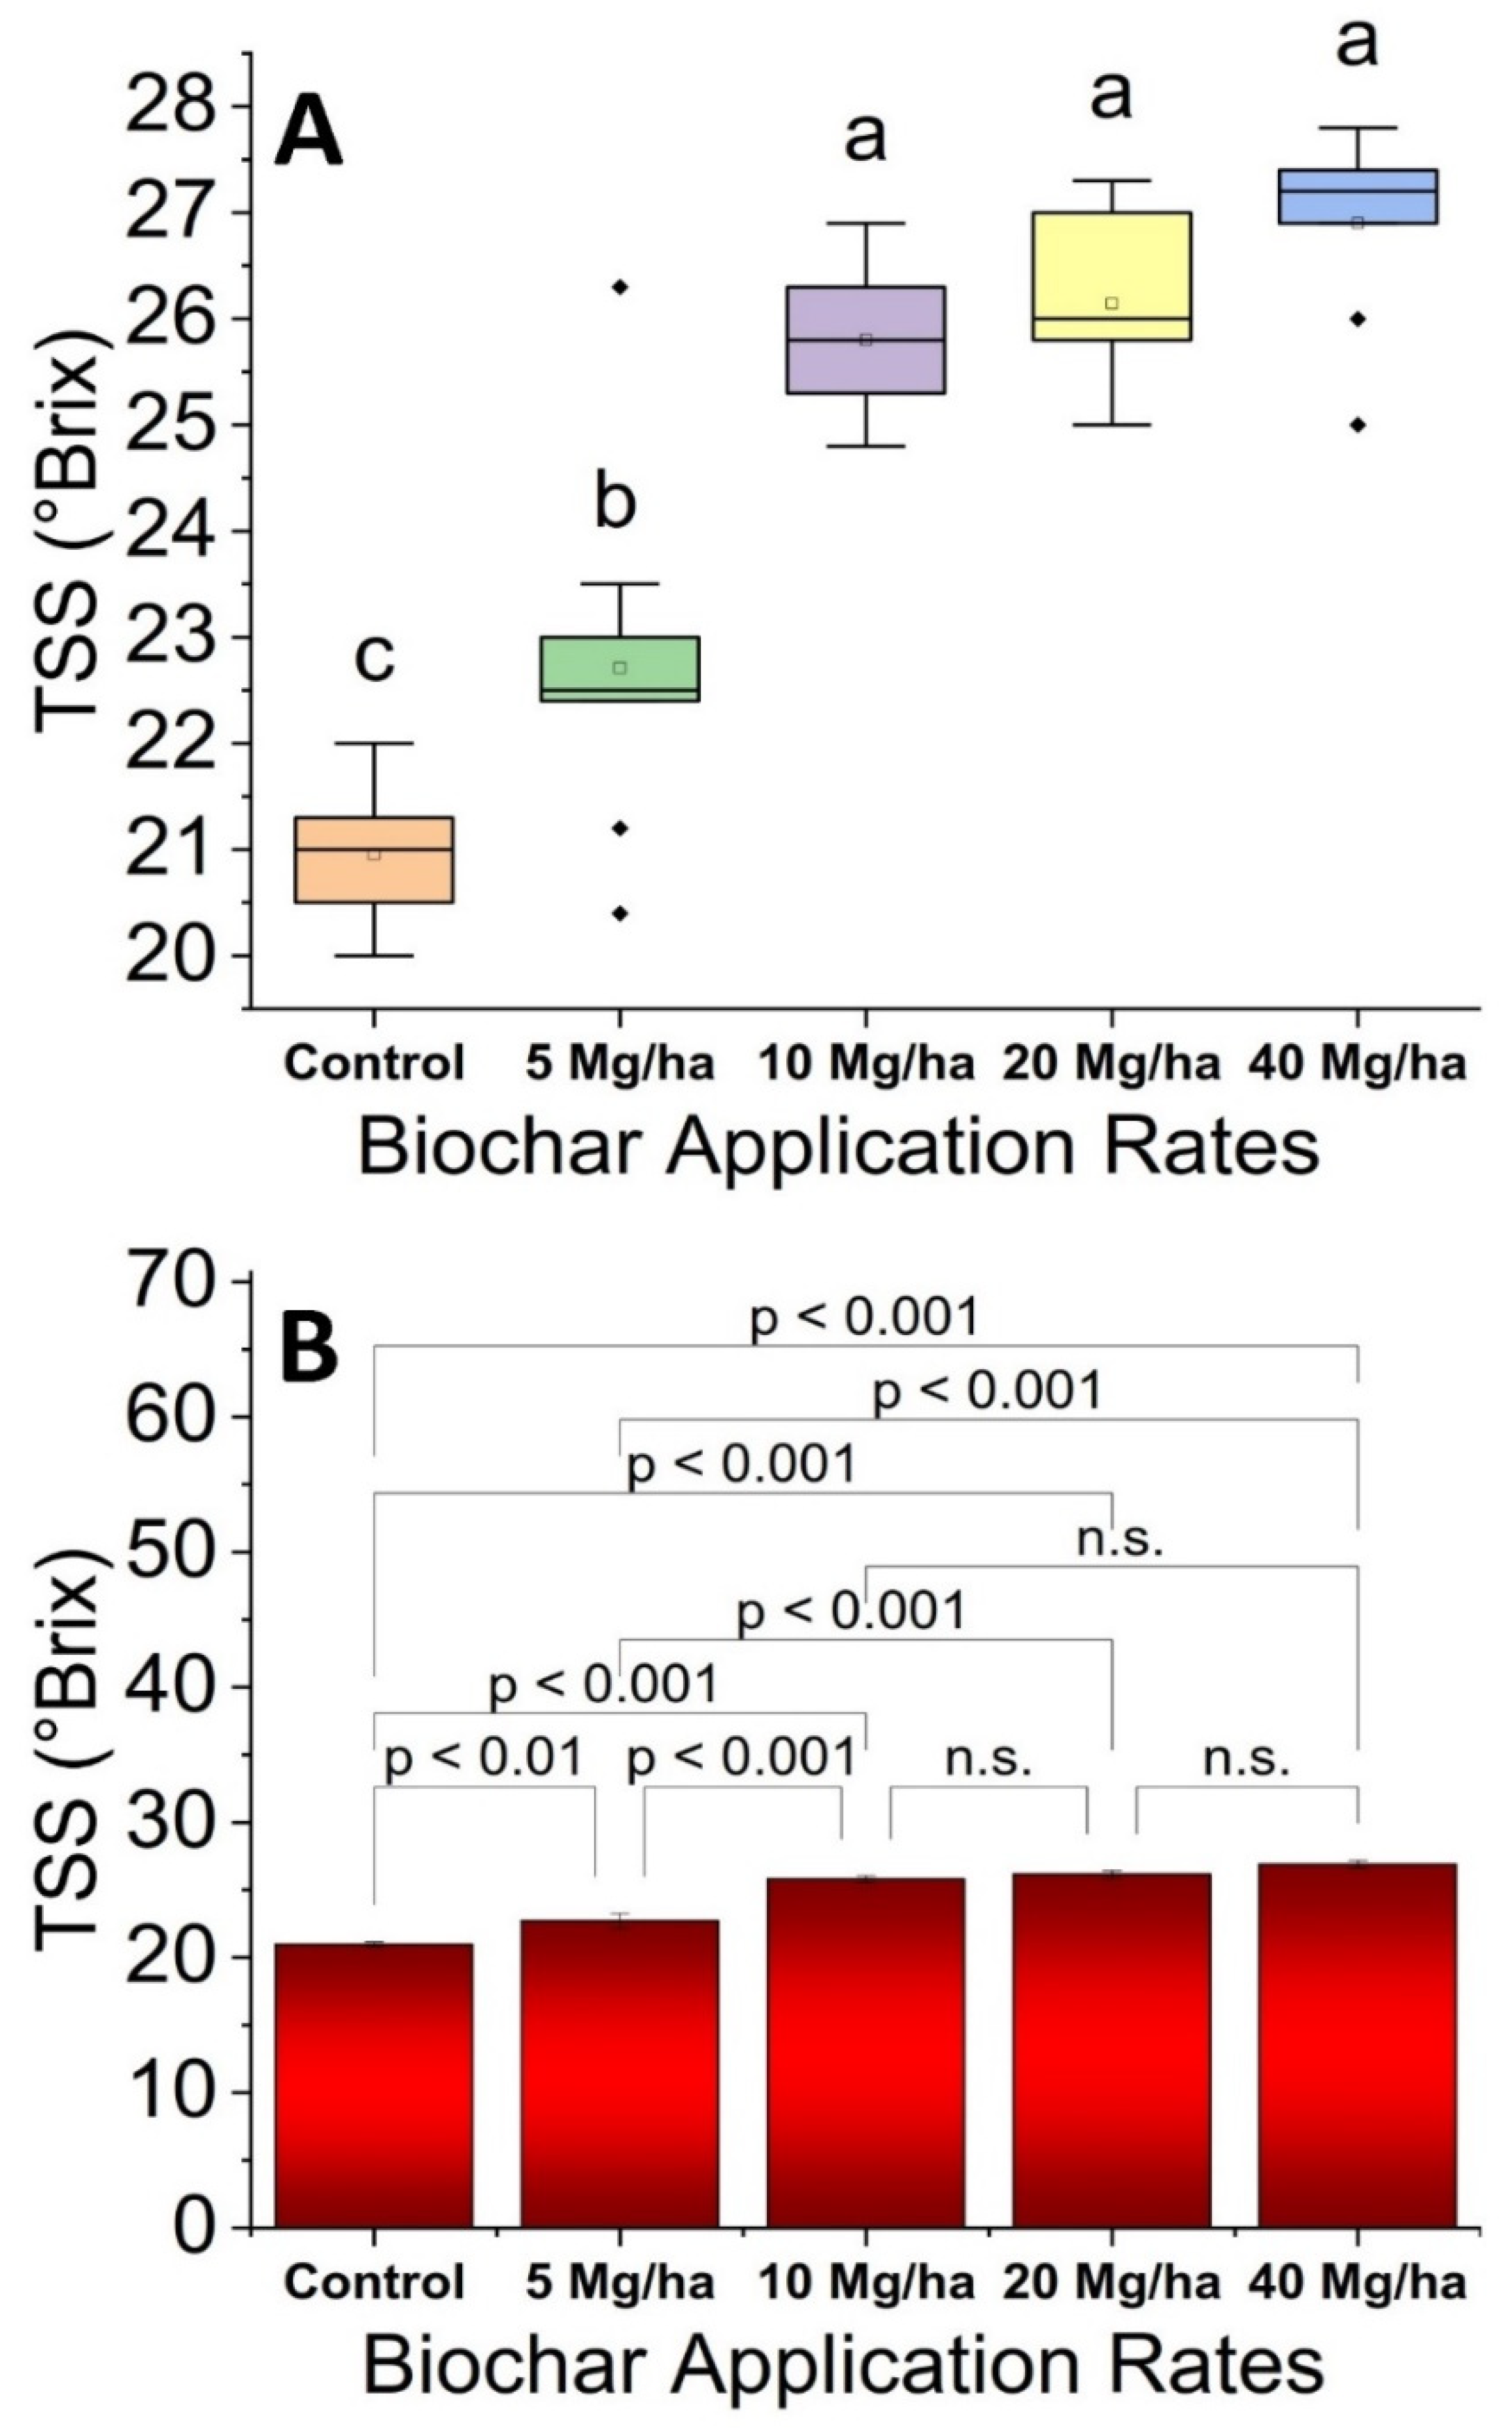
3.7. Total Soluble Solids (TSS) Content
3.8. Nutrient Concentrations
4. Conclusions
Author Contributions
Funding
Institutional Review Board Statement
Informed Consent Statement
Data Availability Statement
Conflicts of Interest
References
- Murtaza, M.R.; Mehmood, T.; Ahmad, A.; Mughal, U.A. With and without intercropping economic evaluation of mango fruits: Evidence from Southern Punjab, Pakistan. Sarhad J. Agric. 2020, 36, 192–197. [Google Scholar] [CrossRef]
- Bibi, F.; Ahmad, I.; Bakhsh, A.; Kiran, S.; Danish, S.; Ullah, H. Effect of Foliar Application of Boron with Calcium and Potassium on Quality and Yield of Mango cv. Summer Bahisht (SB) Chaunsa. Open Agric. 2019, 4, 98–106. [Google Scholar] [CrossRef]
- Mirza, B.; Croley, C.R.; Ahmad, M.; Pumarol, J.; Das, N.; Sethi, G.; Bishayee, A. Mango (Mangifera indica L.): A magnificent plant with cancer preventive and anticancer therapeutic potential. Crit. Rev. Food Sci. Nutr. 2021, 61, 2125–2151. [Google Scholar] [CrossRef] [PubMed]
- Chaves, M.M.; Flexas, J.; Pinheiro, C. Photosynthesis under drought and salt stress: Regulation mechanisms from whole plant to cell. Ann. Bot. 2009, 103, 551–560. [Google Scholar] [CrossRef] [PubMed] [Green Version]
- Fageria, N.K.; Gheyi, H.R.; Moreira, A. Nutrient bioavailability in salt affected soils. J. Plant Nutr. 2011, 34, 945–962. [Google Scholar] [CrossRef]
- Abbas, F. Analysis of a historical (1981–2010) temperature record of the Punjab Province of Pakistan. Earth Interact. 2013, 17, 1–23. [Google Scholar] [CrossRef]
- Acosta-Motos, J.; Ortuño, M.; Bernal-Vicente, A.; Diaz-Vivancos, P.; Sanchez-Blanco, M.; Hernandez, J. Plant Responses to Salt Stress: Adaptive Mechanisms. Agronomy 2017, 7, 18. [Google Scholar] [CrossRef] [Green Version]
- Di Caterina, R.; Giuliani, M.M.; Rotunno, T.; De Caro, A.; Flagella, Z. Influence of salt stress on seed yield and oil quality of two sunflower hybrids. Ann. Appl. Biol. 2007, 151, 145–154. [Google Scholar] [CrossRef]
- El Rabey, H.A.; Al-Malki, A.L.; Abulnaja, K.O. Proteome Analysis of Date Palm (Phoenix dactylifera L.) under Severe Drought and Salt Stress. Int. J. Genom. 2016, 2016, 7840759. [Google Scholar] [CrossRef] [Green Version]
- El-Mageed, T.A.A.; Semida, W.M.; El-Wahed, M.H.A. Effect of mulching on plant water status, soil salinity and yield of squash under summer-fall deficit irrigation in salt affected soil. Agric. Water Manag. 2016, 173, 1–12. [Google Scholar] [CrossRef]
- Ahmed, N.; Khalid, S.; Grewal, A.G.; Ali, M.A.; Anjum, M.A.; Rahi, A.A.; Danish, S. Performance of mango scion cultivars under various levels of artificially induced salinity stress. Pak. J. Bot. 2020, 52, 1143–1158. [Google Scholar] [CrossRef]
- Diatta, A.A.; Fike, J.H.; Battaglia, M.L.; Galbraith, J.M.; Baig, M.B. Effects of biochar on soil fertility and crop productivity in arid regions: A review. Arab. J. Geosci. 2020, 13, 595. [Google Scholar] [CrossRef]
- Dawar, K.; Fahad, S.; Alam, S.S.; Khan, S.A.; Dawar, A.; Younis, U.; Danish, S.; Datta, R.; Dick, R.P. Influence of variable biochar concentration on yield-scaled nitrous oxide emissions, Wheat yield and nitrogen use efficiency. Sci. Rep. 2021, 11, 16774. [Google Scholar] [CrossRef] [PubMed]
- Farhangi-Abriz, S.; Torabian, S. Effect of biochar on growth and ion contents of bean plant under saline condition. Environ. Sci. Pollut. Res. 2018, 25, 11556–11564. [Google Scholar] [CrossRef] [PubMed]
- Ali, S.; Rizwan, M.; Qayyum, M.F.; Ok, Y.S.; Ibrahim, M.; Riaz, M.; Arif, M.S.; Hafeez, F.; Al-Wabel, M.I.; Shahzad, A.N. Biochar soil amendment on alleviation of drought and salt stress in plants: A critical review. Environ. Sci. Pollut. Res. 2017, 24, 12700–12712. [Google Scholar] [CrossRef] [PubMed]
- Sultan, H.; Ahmed, N.; Mubashir, M.; Danish, S. Chemical production of acidified activated carbon and its influences on soil fertility comparative to thermo-pyrolyzed biochar. Sci. Rep. 2020, 10, 595. [Google Scholar] [CrossRef] [Green Version]
- Sadegh-Zadeh, F.; Parichehreh, M.; Jalili, B.; Bahmanyar, M.A. Rehabilitation of calcareous saline-sodic soil by means of biochars and acidified biochars. Land Degrad. Dev. 2018, 29, 3262–3271. [Google Scholar] [CrossRef]
- Guo, L.; Yu, H.; Kharbach, M.; Zhang, W.; Wang, J.; Niu, W. Biochar improves soil-tomato plant, tomato production, and economic benefits under reduced nitrogen application in northwestern china. Plants 2021, 10, 759. [Google Scholar] [CrossRef]
- Keabetswe, L.; Shao, G.C.; Cui, J.; Lu, J.; Stimela, T. A combination of biochar and regulated deficit irrigation improves tomato fruit quality: A comprehensive quality analysis. Folia Hortic. 2019, 31, 181–193. [Google Scholar] [CrossRef] [Green Version]
- Agegnehu, G.; Srivastava, A.K.; Bird, M.I. The role of biochar and biochar-compost in improving soil quality and crop performance: A review. Appl. Soil Ecol. 2017, 119, 156–170. [Google Scholar] [CrossRef]
- Brantley, K.; Savin, M.; Brye, K.; Longer, D. Pine Woodchip Biochar Impact on Soil Nutrient Concentrations and Corn Yield in a Silt Loam in the Mid-Southern U.S. Agriculture 2015, 5, 30–47. [Google Scholar] [CrossRef] [Green Version]
- Akhtar, S.S.; Li, G.; Andersen, M.N.; Liu, F. Biochar enhances yield and quality of tomato under reduced irrigation. Agric. Water Manag. 2014, 138, 37–44. [Google Scholar] [CrossRef]
- Jeffery, S.; Abalos, D.; Prodana, M.; Bastos, A.C.; Van Groenigen, J.W.; Hungate, B.A.; Verheijen, F. Biochar boosts tropical but not temperate crop yields. Environ. Res. Lett. 2017, 12, 53001. [Google Scholar] [CrossRef]
- Jeffery, S.; Verheijen, F.G.A.; van der Velde, M.; Bastos, A.C. A quantitative review of the effects of biochar application to soils on crop productivity using meta-analysis. Agric. Ecosyst. Environ. 2011, 144, 175–187. [Google Scholar] [CrossRef]
- Gee, G.W.; Bauder, J.W. Particle-size analysis. In Methods of Soil Analysis. Part 1. Physical and Mineralogical Methods; John Wiley & Sons, Inc.: Madison, WI, USA, 1986; pp. 383–411. ISBN 978-0-89118-864-3. [Google Scholar]
- Page, A.L.; Miller, R.H.; Keeny, D.R. Soil pH and lime requirement. In Methods of Soil Analysis; American Society of Agronomy; John Wiley & Sons, Inc.: Madison, WI, USA, 1982; pp. 199–208. [Google Scholar]
- Rhoades, J.D. Salinity: Electrical Conductivity and Total Dissolved Solids. In Methods of Soil Analysis, Part 3, Chemical Methods; Sparks, D.L., Page, A.L., Helmke, P.A., Loeppert, R.H., Soltanpour, P.N., Tabatabai, M.A., Johnston, C.T., Sumner, M.E., Eds.; Soil Science Society of America; John Wiley & Sons, Inc.: Madison, WI, USA, 1996; Volume 5, pp. 417–435. [Google Scholar]
- Loeppert, R.H.; Suarez, D.L. Carbonate and Gypsum. In Methods of Soil Analysis, Part 3, Chemical Methods; Soil Science Society of America; John Wiley & Sons, Inc.: Madison, WI, USA, 2018; Volume 9, pp. 181–197. [Google Scholar]
- Nelson, D.W.; Sommers, L.E. Total Carbon, Organic Carbon, and Organic Matter. In Methods of Soil Analysis: Part 2 Chemical and Microbiological Properties; Page, A.L., Ed.; American Society of Agronomy; Crop Science Society of America; Soil Science Society of America; John Wiley & Sons, Inc.: Madison, WI, USA, 1982; pp. 539–579. [Google Scholar]
- Bremner, M. Nitrogen-Total. In Methods of Soil Analysis Part 3. Chemical Methods-SSSA Book Series 5; Sparks, D.L., Page, A.L., Helmke, P.A., Loeppert, R.H., Soltanpour, P.N., Tabatabai, M.A., Johnston, C.T., Sumner, M.E., Eds.; John Wiley & Sons, Inc.: Madison, WI, USA, 1996; pp. 1085–1121. [Google Scholar]
- Kuo, S. Phosphorus. In Methods of Soil Analysis Part 3: Chemical Methods; Sparks, D.L., Page, A.L., Helmke, P.A., Loeppert, R.H., Soltanpour, P.N., Tabatabai, M.A., Johnston, C.T., Sumner, M.E., Eds.; John Wiley & Sons, Ltd.: Madison, WI, USA, 1996; pp. 869–919. [Google Scholar]
- Pratt, P.F. Potassium. In Methods of Soil Analysis: Part 2 Chemical and Microbiological Properties, 9.2; Norman, A.G., Ed.; John Wiley & Sons, Ltd.: Madison, WI, USA, 1965; pp. 1022–1030. [Google Scholar]
- Lindsay, W.L.; Norvell, W.A. A DTPA soil test for zinc, iron, manganese and copper. Soil Sci. Soc. Am. J. 1978, 42, 421–428. [Google Scholar] [CrossRef]
- Qayyum, M.F.; Abid, M.; Danish, S.; Saeed, M.K.; Ali, M.A. Effects of various biochars on seed germination and carbon mineralization in an alkaline soil. Pak. J. Agric. Sci. 2014, 51, 977–982. [Google Scholar]
- Danish, S.; Tahir, F.A.; Rasheed, M.K.; Ahmad, N.; Ali, M.A.; Kiran, S.; Younis, U.; Irshad, I.; Butt, B. Effect of foliar application of Fe and banana peel waste biochar on growth, chlorophyll content and accessory pigments synthesis in spinach under chromium (IV) toxicity. Open Agric. 2019, 4, 381–390. [Google Scholar] [CrossRef]
- Miller, O. Nitric-Perchloric Acid Wet Digestion in an Open Vessel. In Reference Methods for Plant Analysis; Kalra, Y., Ed.; CRC Press: Washington, DC, USA, 1998; pp. 57–62. [Google Scholar]
- Yemm, E.W.; Willis, A.J. The estimation of carbohydrates in plant extracts by anthrone. Biochem. J. 1954, 57, 508–514. [Google Scholar] [CrossRef] [Green Version]
- Ranganna, S. Titratable Acidity; Ranganna, S., Ed.; Tata McGraw Hill Publ. Co. Ltd.: New Delhi, India, 1979. [Google Scholar]
- Mclaughlin, H. Characterizing Biochars prior to Addition to Soils–Version I. Alterna Biocarbon Inc. 2010, 333, 334. [Google Scholar]
- Origin. OriginLab Corporation OriginPro; OriginLab: Northampton, MA, USA, 2021. [Google Scholar]
- Naeem, M.A.; Khalid, M.; Aon, M.; Abbas, G.; Amjad, M.; Murtaza, B.; Khan, W.-U.-D.; Ahmad, N. Combined application of biochar with compost and fertilizer improves soil properties and grain yield of maize. J. Plant Nutr. 2018, 41, 112–122. [Google Scholar] [CrossRef]
- Malik, A.U.; Singh, Z. Improved fruit retention, yield and fruit quality in mango with exogenous application of polyamines. Sci. Hortic. (Amst.) 2006, 110, 167–174. [Google Scholar] [CrossRef]
- Danish, S.; Zafar-ul-Hye, M. Combined role of ACC deaminase producing bacteria and biochar on cereals productivity under drought. Phyton 2020, 89, 217–227. [Google Scholar] [CrossRef]
- Danish, S.; Zafar-ul-Hye, M.; Fahad, S.; Saud, S.; Brtnicky, M.; Hammerschmiedt, T.; Datta, R. Drought stress alleviation by ACC deaminase producing Achromobacterxylosoxidans and Enterobacter cloacae, with and without timber waste biochar in maize. Sustainability 2020, 12, 6286. [Google Scholar] [CrossRef]
- Zafar-Ul-Hye, M.; Danish, S.; Abbas, M.; Ahmad, M.; Munir, T.M. ACC deaminase producing PGPR Bacillus amyloliquefaciens and agrobacterium fabrum along with biochar improve wheat productivity under drought stress. Agronomy 2019, 9, 343. [Google Scholar] [CrossRef] [Green Version]
- Baiea, M.H.M.; El-Sharony, T.F.; Eman, A.A.; Moneim, A.E. Effect of different forms of potassium on growth, yield and fruit quality of mango cv. Hindi. Int. J. Chem.Tech. Res. 2015, 8, 1582–1587. [Google Scholar]
- Eliwa, G.I. Effect of foliar spray of some micronutrients and Gibberellin on leaf mineral content, fruit set, yield and fruit quality of “Anna” apple trees. Alex. J. Agric. Res. 2003, 48, 137–143. [Google Scholar]
- Deenik, J.L.; Cooney, M.J. The potential benefits and limitations of corn cob and sewage sludge biochars in an infertile Oxisol. Sustainability 2016, 8, 131. [Google Scholar] [CrossRef] [Green Version]
- Gupta, R.K. Monika Biochar: Effects on crop productivity and soil properties. Int. J. Trop. Agric. 2016, 34, 1721–1729. [Google Scholar]
- Younis, U.; Danish, S.; Malik, S.A.; Ahmed, N.; Munir, T.M.; Rasheed, M.K. Role of cotton sticks biochar in immobilization of nickel under induced toxicity condition and growth indices of Trigonellacorniculata L. Environ. Sci. Pollut. Res. 2020, 27, 1752–1761. [Google Scholar] [CrossRef] [PubMed]
- Gunes, A.; Inal, A.; Taskin, M.B.; Sahin, O.; Kaya, E.C.; Atakol, A. Effect of phosphorus-enriched biochar and poultry manure on growth and mineral composition of lettuce (Lactuca sativa L. cv.) grown in alkaline soil. Soil Use Manag. 2014, 30, 182–188. [Google Scholar] [CrossRef]
- Jasmitha, B.G.; Honnabyraiah, M.K.; Anil Kumar, S.; Swamy, G.S.K.; Patil, S.V.; Jayappa, J. Effect of enriched biochar on growth of mango seedlings in nursery. Int. J. Chem. Stud. 2018, 6, 415–417. [Google Scholar]
- Dutta, P. Effect of foliar boron application on panicle growth, fruit retention and physico-chemical characters of mango cv. Himsagar. Indian J. Hortic. 2004, 61, 265–266. [Google Scholar]
- Chen, Y.; Aviad, T. Effects of Humic Substances on Plant Growth. In Proceedings of the Humic Substances in Soil and Crop Sciences: Selected Readings; Soil Science Society of America; John Wiley & Sons, Inc.: Madison, MI, USA, 1990; pp. 161–186. [Google Scholar]
- Chan, K.Y.; Van Zwieten, L.; Meszaros, I.; Downie, A.; Joseph, S. Using poultry litter biochars as soil amendments. Soil Res. 2008, 46, 437. [Google Scholar] [CrossRef]
- Ram, R.A.; Singha, A.; Singh, V.K. Improvement in yield and fruit quality of mango (Mangiferaindica) with organic amendments. Indian J. Agric. Sci. 2019, 89, 1429–1433. [Google Scholar]
- Marschner, H. Marschner’s Mineral Nutrition of Higher Plants, 3rd ed.; Marschner, P., Ed.; Academic Press: Cambridge, MA, USA, 2011. [Google Scholar]
- Tohidloo, G.; Souri, M.K.; Eskandarpour, S. Growth and fruit biochemical characteristics of three strawberry genotypes under different potassium concentrations of nutrient solution. Open Agric. 2018, 3, 356–362. [Google Scholar] [CrossRef]
- Danish, S.; Younis, U.; Nasreen, S.; Akhtar, N.; Iqbal, M.T. Biochar consequences on cations and anions of sandy soil. J. Biodivers. Environ. Sci. 2015, 6, 121–131. [Google Scholar]
- Abd El-Mageed, T.A.; Abdurrahman, H.A.; Abd El-Mageed, S.A. Residual acidified biochar modulates growth, physiological responses, and water relations of maize (Zea mays) under heavy metal–contaminated irrigation water. Environ. Sci. Pollut. Res. 2020, 27, 22956–22966. [Google Scholar] [CrossRef] [PubMed]
- Ali, S.; Noureen, S.; Shakoor, M.B.; Haroon, M.Y.; Rizwan, M.; Jilani, A.; Arif, M.S.; Khalil, U. Comparative evaluation of wheat straw and press mud biochars for Cr(VI) elimination from contaminated aqueous solution. Environ. Technol. Innov. 2020, 19, 101017. [Google Scholar] [CrossRef]
- Suthar, R.G.; Wang, C.; Nunes, M.C.N.; Chen, J.; Sargent, S.A.; Bucklin, R.A.; Gao, B. Bamboo biochar pyrolyzed at low temperature improves tomato plant growth and fruit quality. Agriculture 2018, 8, 153. [Google Scholar] [CrossRef] [Green Version]
- Beesley, L.; Moreno-Jiménez, E.; Gomez-Eyles, J.L.; Harris, E.; Robinson, B.; Sizmur, T. A review of biochars’ potential role in the remediation, revegetation and restoration of contaminated soils. Environ. Pollut. 2011, 159, 3269–3282. [Google Scholar] [CrossRef]
- Bruun, E.W.; Ambus, P.; Egsgaard, H.; Hauggaard-Nielsen, H. Effects of slow and fast pyrolysis biochar on soil C and N turnover dynamics. Soil Biol. Biochem. 2012, 46, 73–79. [Google Scholar] [CrossRef]
- Major, J.; Rondon, M.; Molina, D.; Riha, S.J.; Lehmann, J. Maize yield and nutrition during 4 years after biochar application to a Colombian savanna oxisol. Plant Soil 2010, 333, 117–128. [Google Scholar] [CrossRef]
- Mahmood, T.; Anwar, F.; Abbas, M.; Boyce, M.C.; Saari, N. Compositional variation in sugars and organic acids at different maturity stages in selected small fruits from Pakistan. Int. J. Mol. Sci. 2012, 13, 1380–1392. [Google Scholar] [CrossRef] [PubMed]
- de Souza, V.R.; Pereira, P.A.P.; Teixeira, T.R.; da Silva, T.L.T.; Pio, R.; Queiroz, F. Influence of processing on the antioxidant capacity and bioactive compounds in jellies from different blackberry cultivars. Int. J. Food Sci. Technol. 2015, 50, 1658–1665. [Google Scholar] [CrossRef]
- Abo-Ogiala, A.M.M.E. Impact of Biochar on Vegetative Parameters, Leaf Mineral Content, Yield and Fruit Quality of Grande Naine Banana in Saline-sodic Soil. Egypt. J. Hort. 2018, 45, 315–322. [Google Scholar] [CrossRef]
- Zafar-ul-Hye, M.; Tahzeeb-ul-Hassan, M.; Abid, M.; Fahad, S.; Brtnicky, M.; Dokulilova, T.; Datta, R.; Danish, S. Potential role of compost mixed biochar with rhizobacteria in mitigating lead toxicity in spinach. Sci. Rep. 2020, 10, 12159. [Google Scholar] [CrossRef] [PubMed]


| Treatments | Nitrogen | Phosphorus | Potassium | Boron |
|---|---|---|---|---|
| Control | 0.75 ± 0.03 d | 0.08 ± 0.001 c | 0.35 ± 0.003 d | 15.23 ± 0.10 e |
| 5 Mg/ha biochar | 0.77 ± 0.04 d | 0.11 ± 0.007 b | 0.35 ± 0.004 d | 16.11 ± 0.12 d |
| 10 Mg/ha biochar | 0.85 ± 0.01 c | 0.11 ± 0.003 b | 0.38 ± 0.001 c | 19.74 ± 0.30 b |
| 15 Mg/ha biochar | 0.88 ± 0.01 b | 0.11 ± 0.005 b | 0.40 ± 0.003 b | 18.55 ± 0.11 c |
| 20 Mg/ha biochar | 0.91 ± 0.02 a | 0.12 ± 0.002 a | 0.44 ± 0.005 a | 21.32 ± 0.15 a |
Publisher’s Note: MDPI stays neutral with regard to jurisdictional claims in published maps and institutional affiliations. |
© 2021 by the authors. Licensee MDPI, Basel, Switzerland. This article is an open access article distributed under the terms and conditions of the Creative Commons Attribution (CC BY) license (https://creativecommons.org/licenses/by/4.0/).
Share and Cite
Iqbal, J.; Kiran, S.; Hussain, S.; Iqbal, R.K.; Ghafoor, U.; Younis, U.; Zarei, T.; Naz, M.; Germi, S.G.; Danish, S.; et al. Acidified Biochar Confers Improvement in Quality and Yield Attributes of Sufaid Chaunsa Mango in Saline Soil. Horticulturae 2021, 7, 418. https://doi.org/10.3390/horticulturae7110418
Iqbal J, Kiran S, Hussain S, Iqbal RK, Ghafoor U, Younis U, Zarei T, Naz M, Germi SG, Danish S, et al. Acidified Biochar Confers Improvement in Quality and Yield Attributes of Sufaid Chaunsa Mango in Saline Soil. Horticulturae. 2021; 7(11):418. https://doi.org/10.3390/horticulturae7110418
Chicago/Turabian StyleIqbal, Javed, Sidra Kiran, Shabir Hussain, Rana Khalid Iqbal, Umber Ghafoor, Uzma Younis, Tayebeh Zarei, Misbah Naz, Sevda Ghasemi Germi, Subhan Danish, and et al. 2021. "Acidified Biochar Confers Improvement in Quality and Yield Attributes of Sufaid Chaunsa Mango in Saline Soil" Horticulturae 7, no. 11: 418. https://doi.org/10.3390/horticulturae7110418
APA StyleIqbal, J., Kiran, S., Hussain, S., Iqbal, R. K., Ghafoor, U., Younis, U., Zarei, T., Naz, M., Germi, S. G., Danish, S., Ansari, M. J., & Datta, R. (2021). Acidified Biochar Confers Improvement in Quality and Yield Attributes of Sufaid Chaunsa Mango in Saline Soil. Horticulturae, 7(11), 418. https://doi.org/10.3390/horticulturae7110418