
Interactive Effects of Drought and Saline Aerosol Stress on Morphological and Physiological Characteristics of Two Ornamental Shrub Species


Abstract
:1. Introduction
2. Materials and Methods
2.1. Experimental Conditions and Plant Materials
2.2. Biomass and Leaf Area
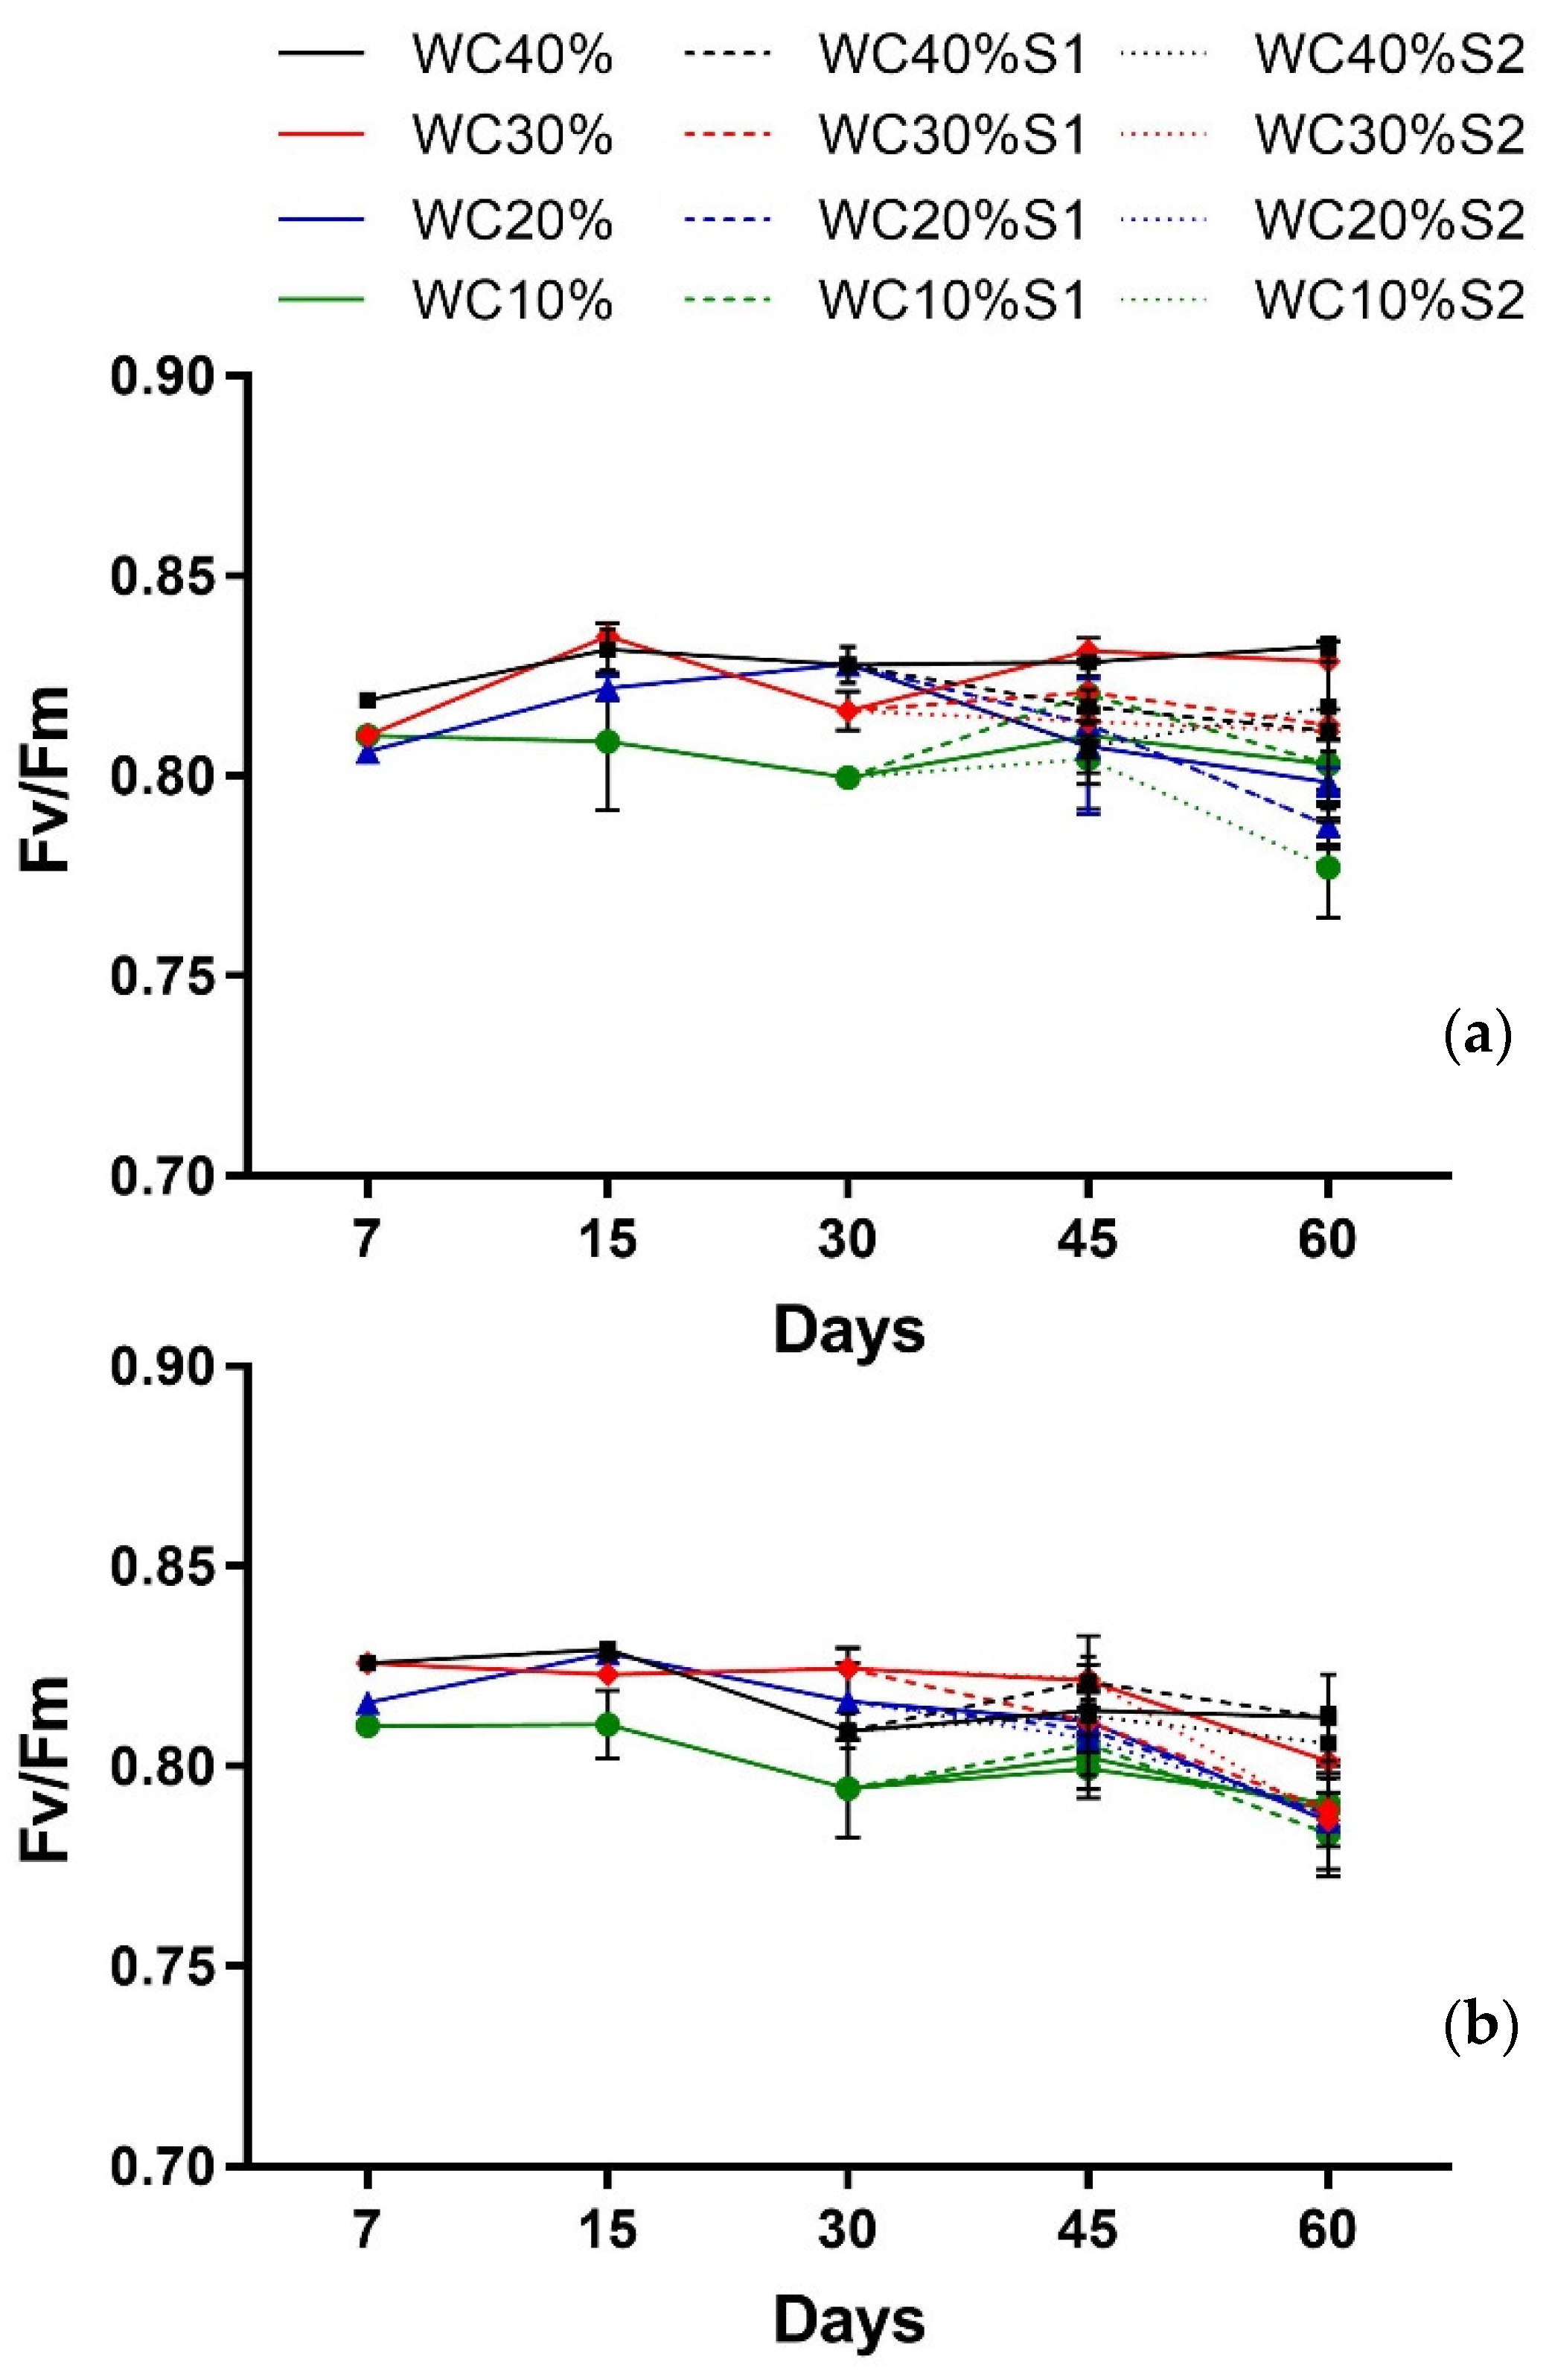
2.3. Leaf Gas Exchanges, Chlorophyll a Fluorescence, and Relative Water Content
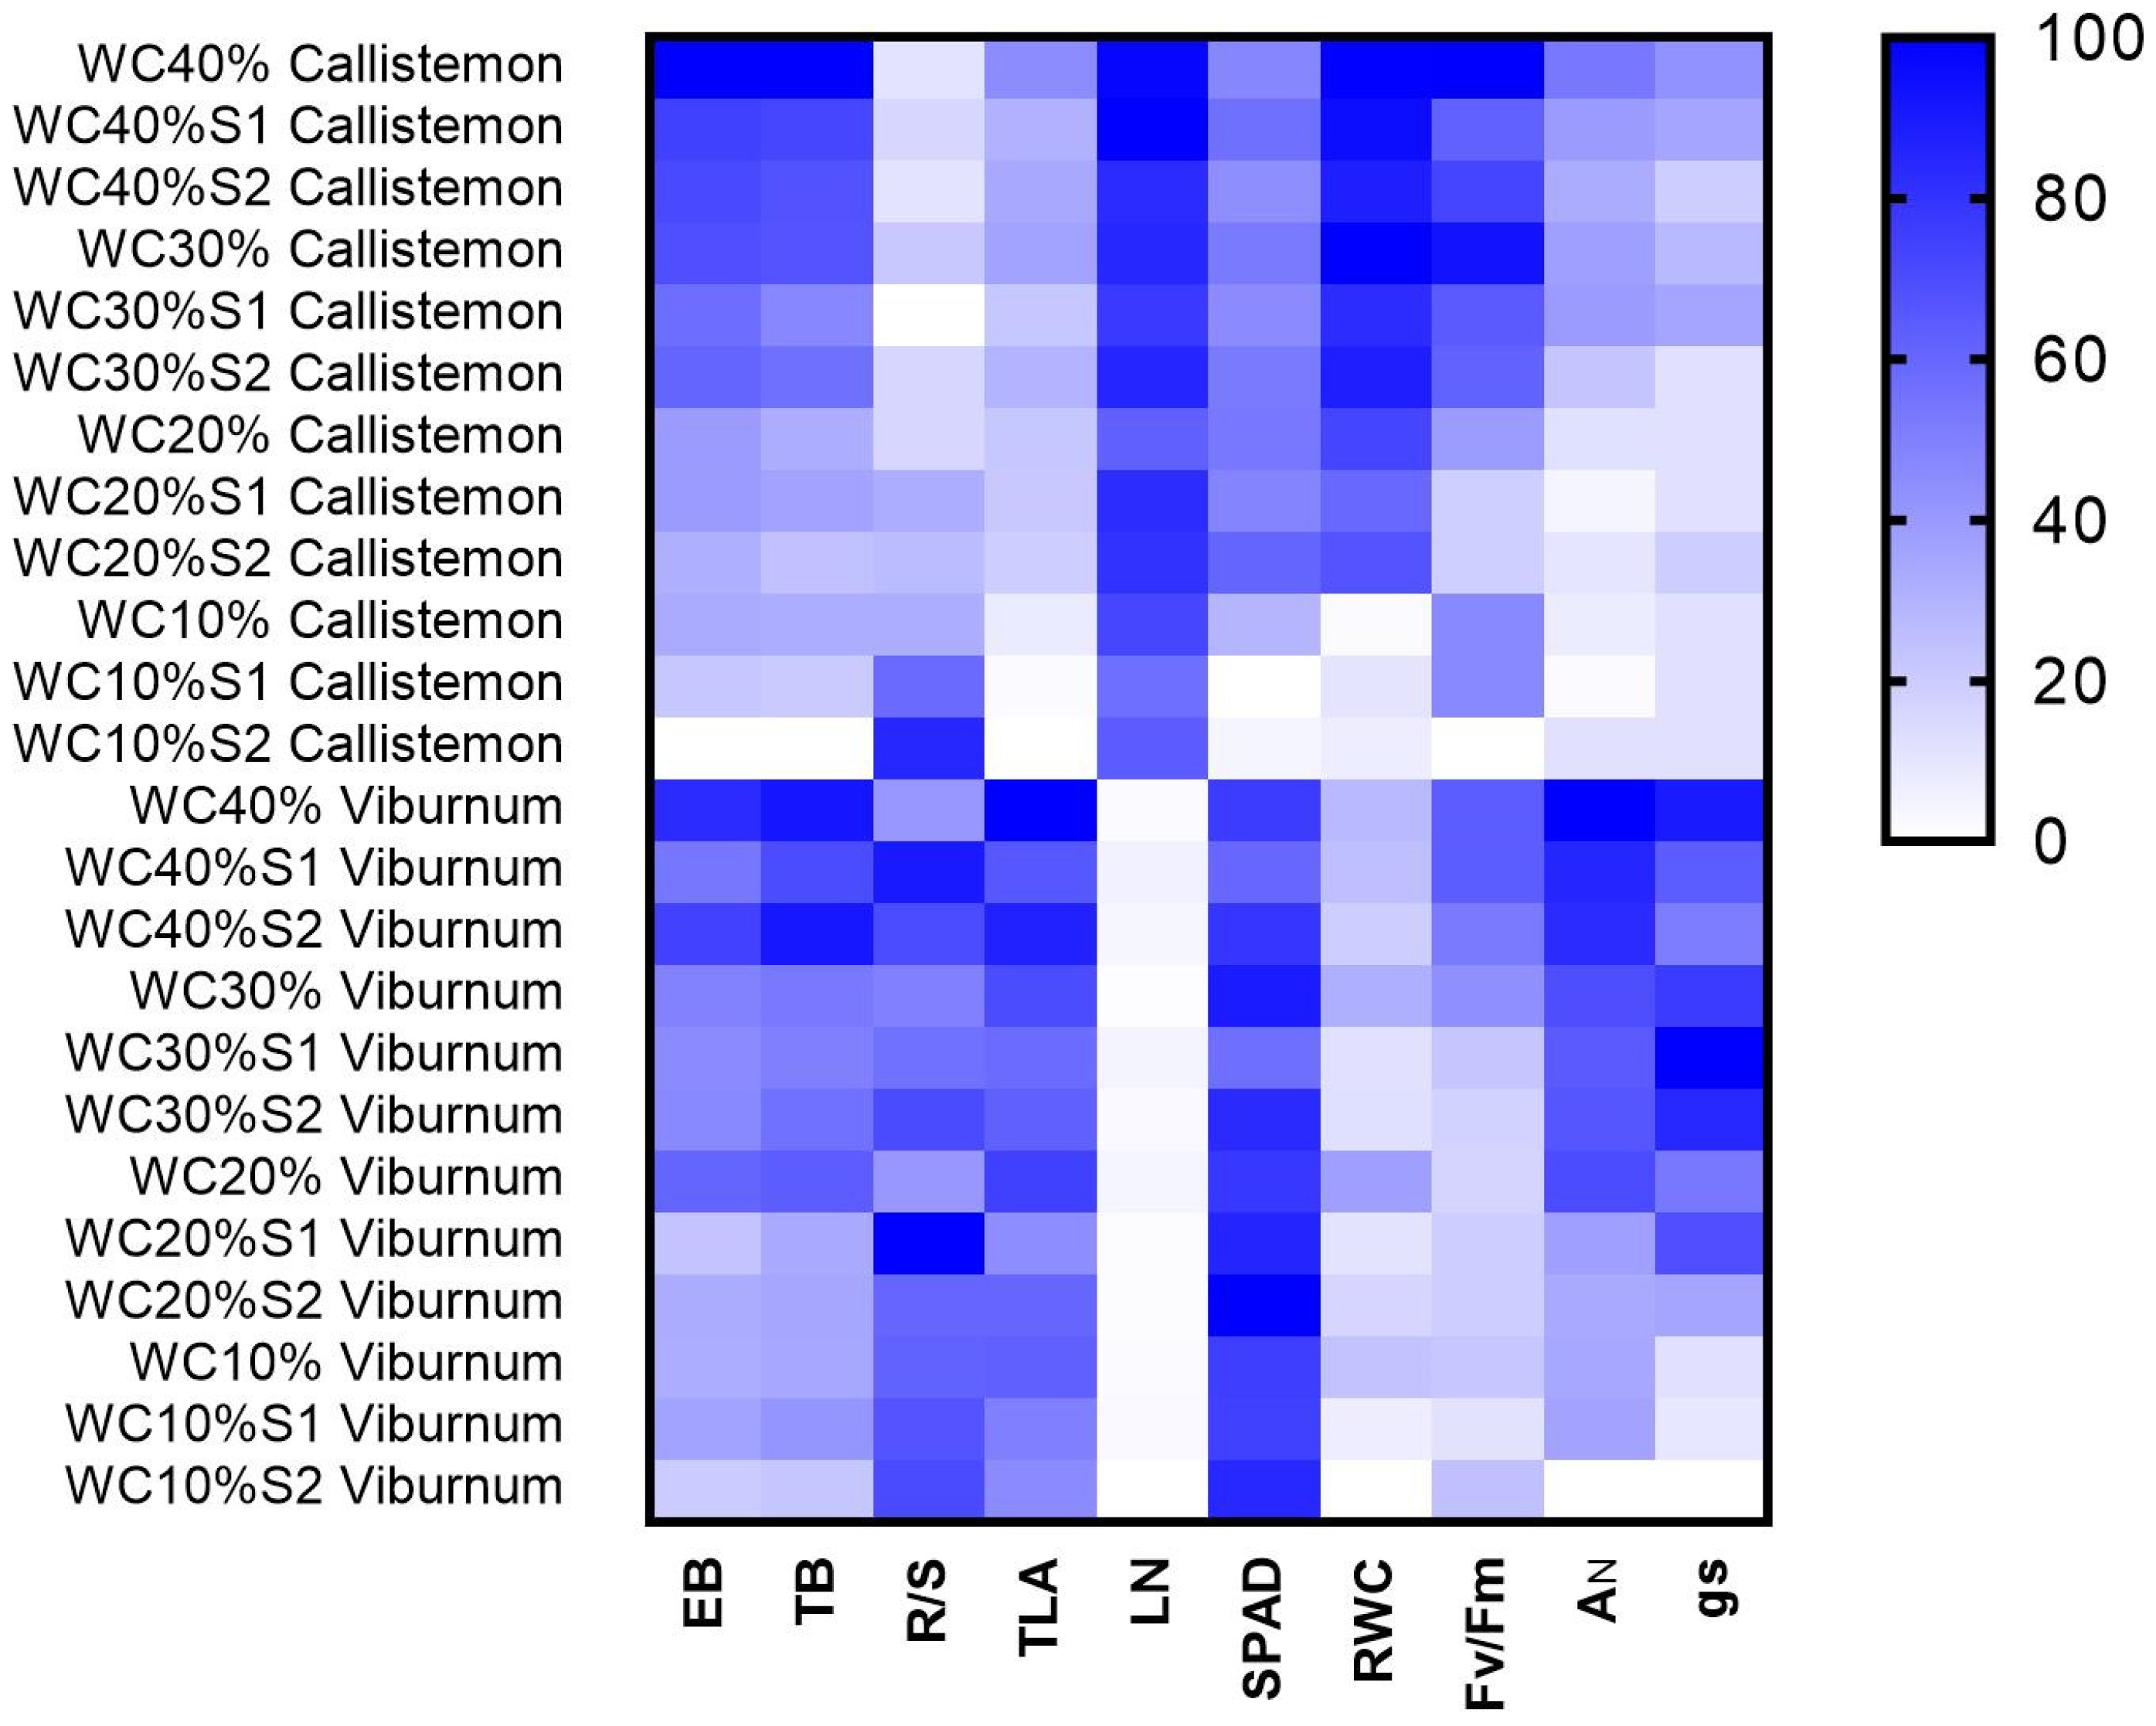
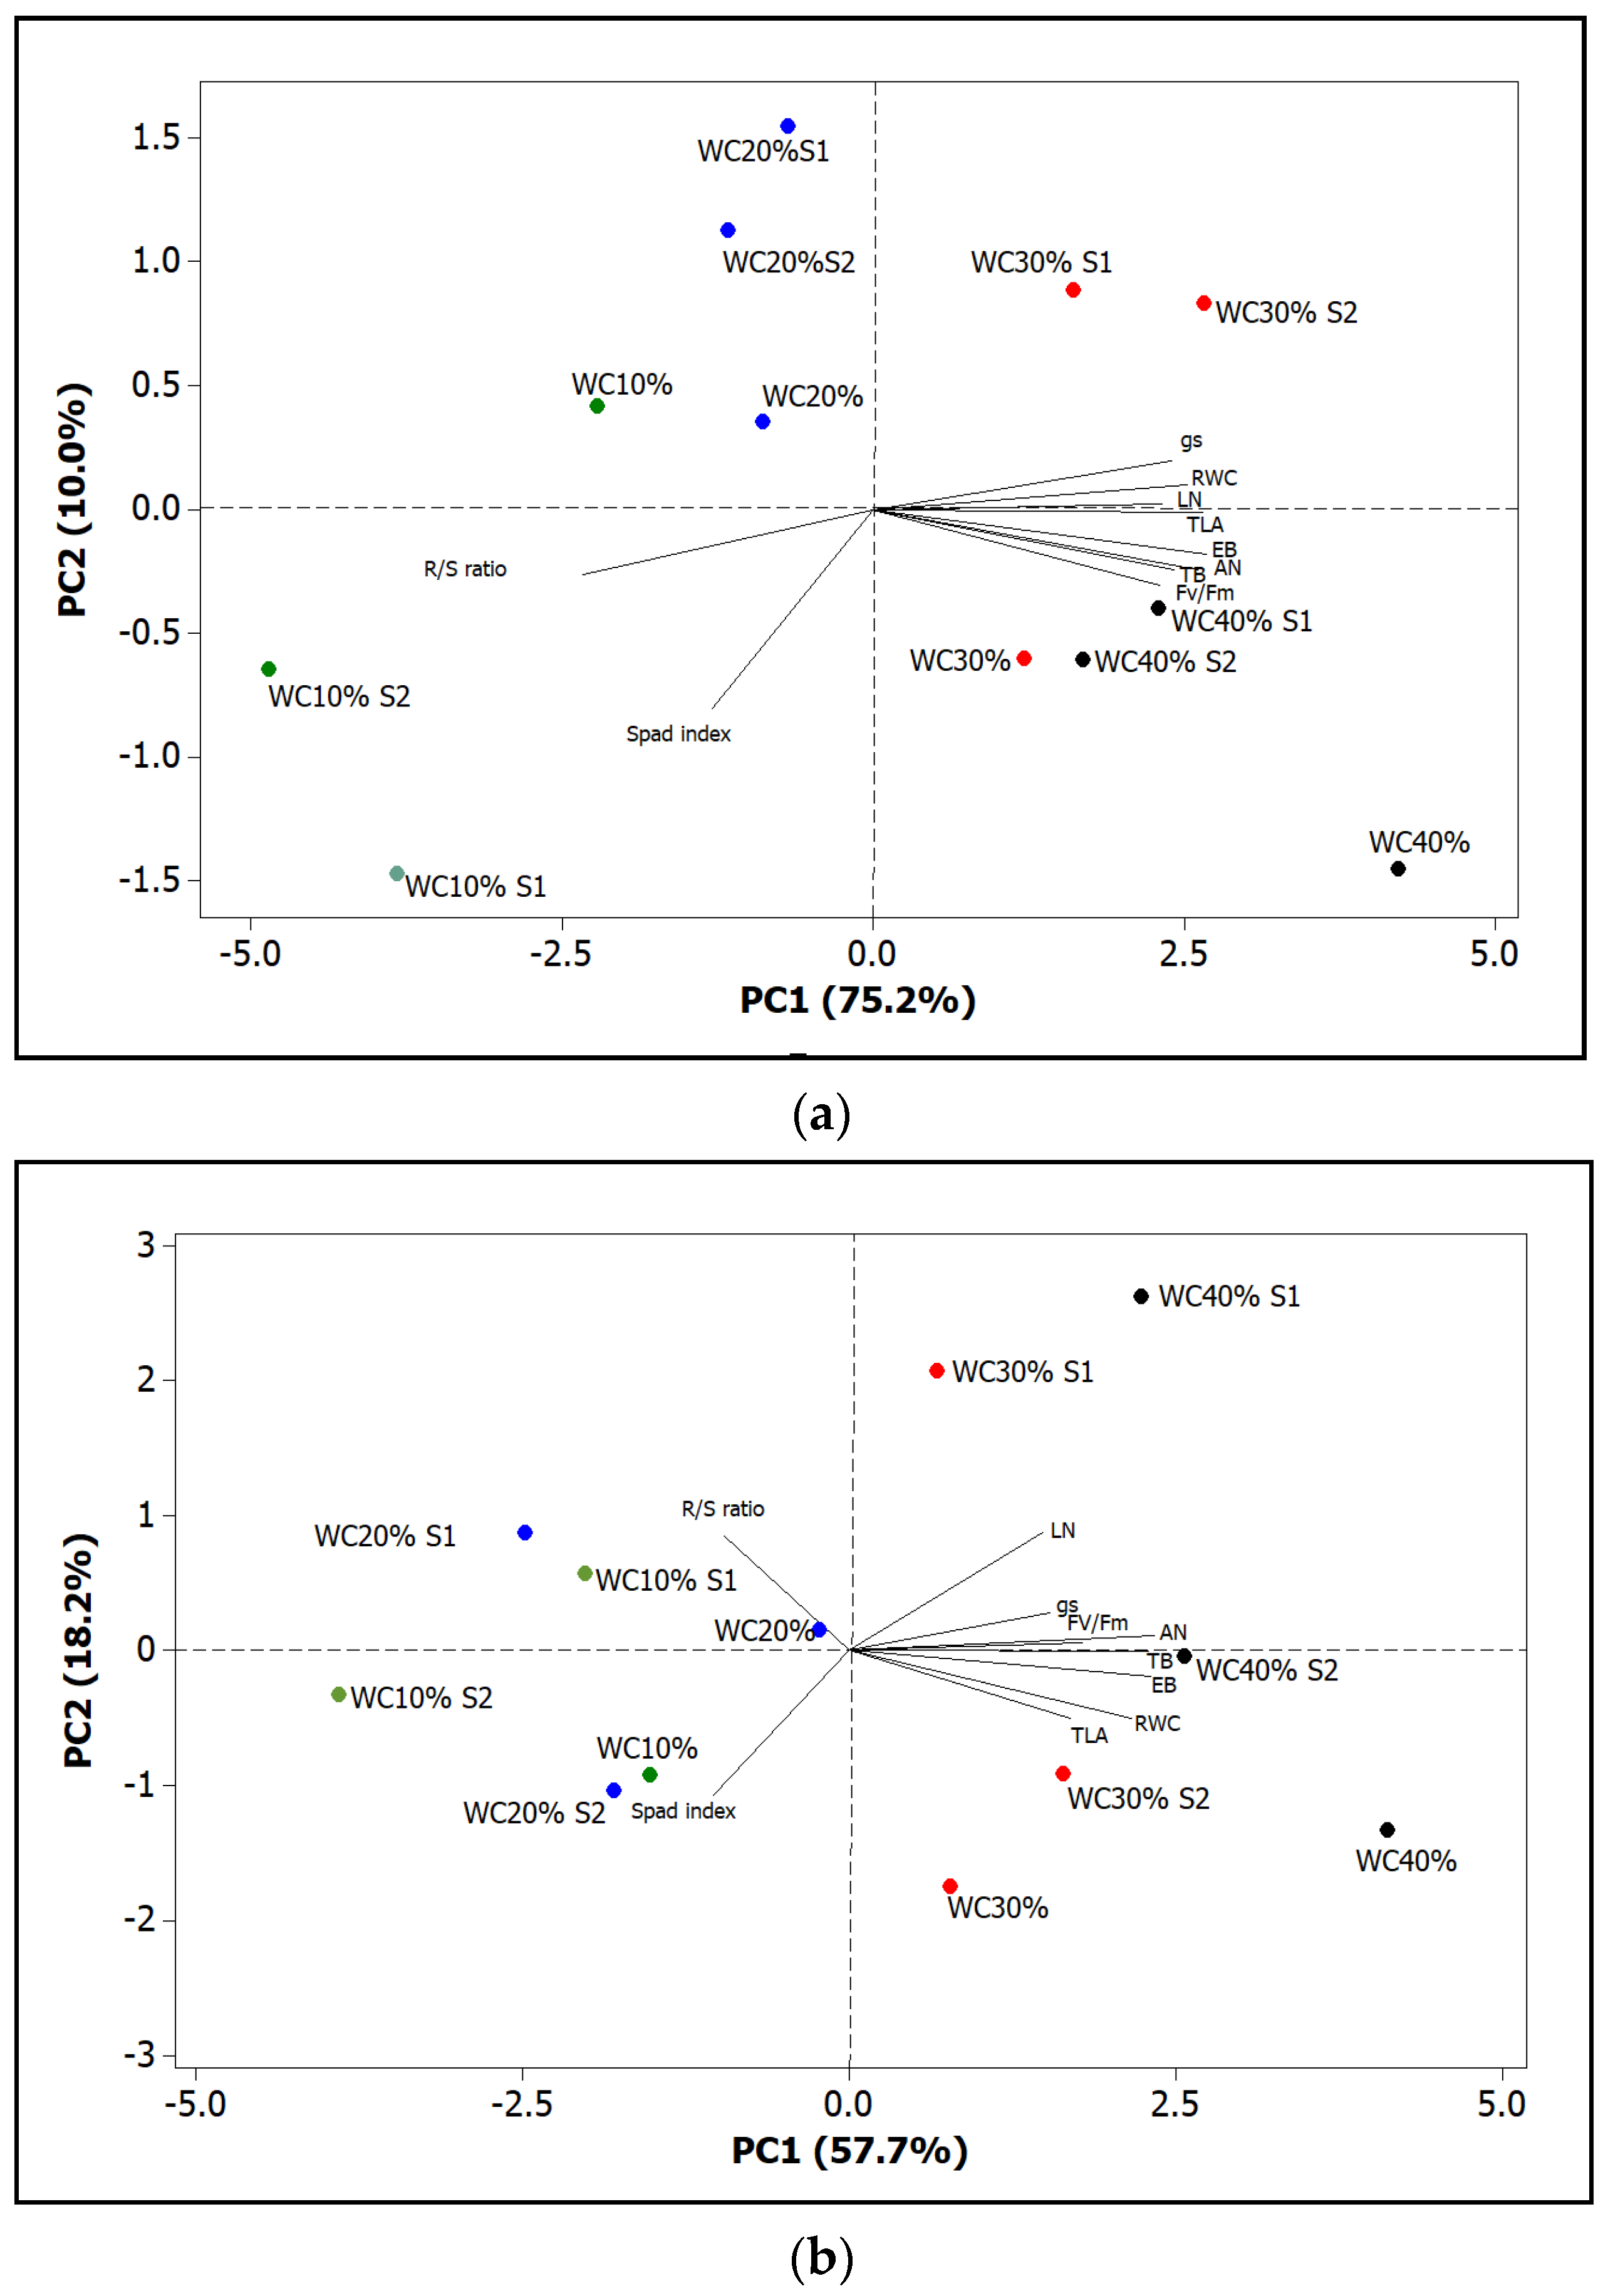
2.4. Statistical Analysis
3. Results
4. Discussion
5. Conclusions
Supplementary Materials
Author Contributions
Funding
Institutional Review Board Statement
Informed Consent Statement
Data Availability Statement
Conflicts of Interest
References
- Savé, R.; Castell, C.; Terradas, J. Gas exchange and water relations. In Ecology of Mediterranean Evergreen Oak Forest; Rodá, F., Retama, J., Gracia, A., Bellot, J., Eds.; Ecological Studies, Springer: Berlin, Geramny, 1999; pp. 135–147. [Google Scholar]
- Farieri, E.; Toscano, S.; Ferrante, A.; Romano, D. Identification of ornamental shrubs tolerant to saline aerosol for coastal urban and peri-urban greening. Urban For Urban Green 2016, 18, 9–18. [Google Scholar] [CrossRef]
- Glenn, E.P.; Nelson, S.G.; Ambrose, B.; Martinez, R.; Soliz, D.; Pabendinskas, V.; Hultine, K. Comparison of salinity tolerance of three Atriplex spp. in well-watered and drying soils. Environ. Exp. Bot. 2012, 83, 62–72. [Google Scholar] [CrossRef]
- Álvarez, S.; Sánchez-Blanco, M.J. Comparison of individual and combined effects of salinity and deficit irrigation on physiological, nutritional and ornamental aspects of tolerance in Callistemon laevis plants. J. Plant Physiol. 2015, 185, 65–74. [Google Scholar] [CrossRef] [PubMed] [Green Version]
- Abdelraheem, A.; Esmaeili, N.; O’Connell, M.; Zhang, J. Progress and perspective on drought and salt stress tolerance in cotton. Ind. Crops Prod. 2019, 130, 118–129. [Google Scholar] [CrossRef]
- Ferrante, A.; Trivellini, A.; Malorgio, F.; Carmassi, G.; Vernieri, P.; Serra, G. Effect of seawater aerosol on leaves of six plant species potentially useful for ornamental purposes in coastal areas. Sci. Hortic. 2011, 128, 332–341. [Google Scholar] [CrossRef]
- EEA-UNEP/MAP Action Plan, 2014. In Horizon 2020 Mediterranean Report toward Shared Environmental Information Systems (Technical Report No 6/2014); Publications Office of the European Union: Luxembourg, 2014; Available online: https://www.eea.europa.eu/publications/horizon-2020-mediterranean-report/file (accessed on 12 November 2021).
- Pinna, M.S.; Bacchetta, G.; Cogoni, D.; Fenu, G. Is vegetation an indicator for evaluating the impact of tourism on the conservation status of Mediterranean coastal dunes? Sci. Total Environ. 2019, 674, 255–263. [Google Scholar] [CrossRef]
- Domene, E.; Saurí, D. Urbanisation and water consumption: Influencing factors in the metropolitan region of Barcelona. Urban Stud. 2006, 43, 1605–1623. [Google Scholar] [CrossRef]
- Toscano, S.; Ferrante, A.; Romano, D. Response of Mediterranean ornamental plants to drought stress. Horticulturae 2019, 5, 6. [Google Scholar] [CrossRef] [Green Version]
- Araújo-Alves, J.P.L.; Torres-Pereira, J.M.; Biel, C.; De Herralde, F.; Savé, R. Effects of minimum irrigation technique on ornamental parameters of two Mediterranean species used in xerigardening and landscaping. Acta Hortic. 1999, 541, 353–358. [Google Scholar] [CrossRef]
- Giordano, M.; Petropoulos, S.A.; Rouphael, Y. Response and defence mechanisms of vegetable crops against drought, heat and salinity stress. Agriculture 2021, 11, 463. [Google Scholar] [CrossRef]
- Acquaah, G. Principles of Plant Genetics and Breeding, 2nd ed.; John Wiley & Sons, Ltd.: Chichester, UK, 2012; p. 740. [Google Scholar]
- Mittler, R. Abiotic stress, the field environment and stress combination. Trend Plant Sci. 2006, 11, 15–19. [Google Scholar] [CrossRef]
- Atkinson, N.J.; Urwin, P.E. The interaction of plant biotic and abiotic stresses: From genes to the field. J. Exp. Bot. 2012, 63, 3523–3543. [Google Scholar] [CrossRef] [Green Version]
- Kissoudis, C.; van de Wiel, C.; Visser, R.G.; van der Linden, G. Enhancing crop resilience to combined abiotic and biotic stress through the dissection of physiological and molecular crosstalk. Front. Plant Sci. 2014, 5, 207. [Google Scholar] [CrossRef] [PubMed] [Green Version]
- Ramegowda, V.; Senthil-Kumar, M. The interactive effects of simultaneous biotic and abiotic stresses on plants: Mechanistic understanding from drought and pathogen combination. J. Plant Physiol. 2015, 176, 47–54. [Google Scholar] [CrossRef] [Green Version]
- Suzuki, N.; Rivero, R.M.; Shulaev, V.; Blumwald, E.; Mittler, R. Abiotic and biotic stress combinations. New Phytol. 2014, 203, 32–43. [Google Scholar] [CrossRef] [PubMed]
- Sánchez-Blanco, M.J.; Rodriguez, P.; Morales, M.A.; Torrecillas, A. Comparative growth and water relations of Cistus albidus and Cistus monspeliensis plants during water deficit conditions and recovery. Plant Sci. 2002, 162, 107–113. [Google Scholar] [CrossRef]
- Cai, X.; Starman, T.; Niu, G.; Hall, C.; Lombardini, L. Response of selected garden roses to drought stress. HortScience 2012, 47, 1050–1055. [Google Scholar] [CrossRef] [Green Version]
- Lumis, G.P.; Hofstra, G.; Hall, R. Sensitivity of roadside trees and shrubs to aerial drift of deicing salts in soils around trees. J. Arboric. 1973, 20, 196–200. [Google Scholar]
- Sánchez-Blanco, M.J.; Rodríguez, P.; Morales, M.A.; Torrecillas, A. Contrasting physiological responses of dwarf sea-lavender and marguerite to simulated sea aerosol deposition. J. Environ. Qual. 2003, 32, 3338–3344. [Google Scholar] [CrossRef]
- Ashraf, M.; McNeilly, T.; Bradshaw, A.D. Tolerance of Holcus lanatus and Agrostis stolonifera to sodium chloride in soil solution and saline spray. Plant Soil 1986, 96, 77–84. [Google Scholar] [CrossRef]
- Wu, L.; Guo, X.; Harivandi, A. Salt tolerance and salt accumulation of landscape plants irrigated by sprinkler and drip irrigation systems. J. Plant Nutr. 2001, 24, 1473–1490. [Google Scholar] [CrossRef]
- Niinemets, Ü. Responses of forest trees to single and multiple environmental stresses from seedlings to mature plants: Past stress history, stress interactions, tolerance and acclimation. For. Ecol. Manag. 2010, 260, 1623–1639. [Google Scholar] [CrossRef]
- Bussotti, F.; Grossoni, P.; Pantani, F. The role of marine salt and surfactants in the decline of Tyrrhenian coastal vegetation in Italy. Ann. For. Sci. 1995, 52, 251–261. [Google Scholar] [CrossRef]
- Waisel, Y. Biology of Halophytes; Academic Press: New York, NY, USA, 1972; p. 410. [Google Scholar]
- Shannon, M.C. Adaptation of plants to salinity. Adv. Agron. 1997, 60, 75–120. [Google Scholar] [CrossRef]
- Boyce, S.G. The salt spray community. Ecol. Monogr. 1954, 24, 29–67. [Google Scholar] [CrossRef]
- Bussotti, F.; Bottacci, A.; Grossoni, P.; Mori, B.; Tani, C. Cytological and structural changes in Pinus pinea L. needles following the application of an anionic surfactant. Plant Cell Environ. 1997, 20, 513–520. [Google Scholar] [CrossRef]
- Schönherr, J.; Bauer, H. Analysis of effects of surfactants on permeability of plant cuticles. In Adjuvant and Agrichemicals; Foy, C.L., Ed.; CRC: Boca Raton, FL, USA, 1992; pp. 17–35. [Google Scholar]
- Jefree, E.J. The cuticle, epicuticular waxes and trichomes of plants, with reference to their structure, functions and evolution. In Insects and the Plant Surface; Juniper, B., Southwood, R., Eds.; Edward Arnold: London, UK, 1986; pp. 23–64. [Google Scholar]
- Esch, A.; Mengel, K. Combined effects of acid mist and frost drought on the water status of young spruce trees (Picea abies). Environ. Exp. Bot. 1998, 39, 57–65. [Google Scholar] [CrossRef]
- Burkhardt, J.; Basi, S.; Pariyar, S.; Hunsche, M. Stomatal penetration by aqueous solutions–an update involving leaf surface particles. New Phytol. 2012, 196, 774–787. [Google Scholar] [CrossRef]
- Rodríguez, P.; Torrecillas, A.; Morales, M.A.; Ortũno, M.F.; Sánchez-Blanco, M.J. Effects of NaCl salinity and water stress on growth and leaf water relations of Asteriscus maritimus plants. Environ. Exp. Bot. 2005, 53, 113–123. [Google Scholar] [CrossRef]
- Navarro, A.; Bañón, S.; Conejero, W.; Sánchez-Blanco, M.J. Ornamental characters, ion accumulation and water status in Arbutus unedo seedlings irrigated with saline water and subsequent relief and transplanting. Environ. Exp. Bot. 2008, 62, 364–370. [Google Scholar] [CrossRef]
- Vernieri, P.; Mugnai, S.; Borghesi, E.; Petrognani, L.; Serra, G. Non-chemical growth control of potted Callistemon laevis. Agric. Med. 2006, 160, 85–90. [Google Scholar]
- Gori, R.; Lubello, C.; Ferrini, F.; Nicese, F.P.; Coppini, E. Reuse of industrial wastewater for the irrigation of ornamental plants. Water Sci. Technol. 2008, 57, 883–889. [Google Scholar] [CrossRef] [PubMed]
- Álvarez, S.; Sánchez-Blanco, M.J. Long-term effect of salinity on plant quality, water relations, photosynthetic parameters and ion distribution in Callistemon citrinus. Plant Biol. 2014, 16, 757–764. [Google Scholar] [CrossRef] [PubMed] [Green Version]
- Cirillo, C.; De Micco, V.; Arena, C.; Carillo, P.; Pannico, A.; De Pascale, S.; Rouphael, Y. Biochemical, Physiological and Anatomical Mechanisms of Adaptation of Callistemon citrinus and Viburnum lucidum to NaCl and CaCl2 Salinization. Front. Plant Sci. 2019, 10, 742. [Google Scholar] [CrossRef]
- Starr, J.L.; Paltineanu, I.C. Methods for Measurement of SoilWater Content: Capacitance Devices. In Methods of Soil Analysis; United States Department of Agriculture, Agricultural Research Service: Washington, DC, USA, 2002. [Google Scholar]
- Tribulato, A.; Toscano, S.; Di Lorenzo, V.; Romano, D. Effects of water stress on gas exchange, water relations and leaf structure in two ornamental shrubs in the Mediterranean area. Agronomy 2019, 9, 381. [Google Scholar] [CrossRef] [Green Version]
- Toscano, S.; Branca, F.; Romano, D.; Ferrante, A. An evaluation of different parameters to screen ornamental shrubs for salt spray tolerance. Biology 2020, 9, 250. [Google Scholar] [CrossRef] [PubMed]
- Sidari, M.; Mallamaci, C.; Muscolo, M. Drought, salinity and heat differently affect seed germination of Pinus pinea. J. For. Res. 2008, 13, 326–330. [Google Scholar] [CrossRef]
- Savé, R.; Biel, C.; Domingo, R.; Ruiz-Sánchez, M.C.; Torrecillas, A. Some physiological and morphological characteristics of citrus plants for drought resistance. Plant Sci. 1995, 110, 167–172. [Google Scholar] [CrossRef]
- Ruiz-Sánchez, M.C.; Domingo, R.; Torrecillas, A.; Pérez-Pastor, A. Water stress preconditioning to improve drought resistance in young apricot plants. Plant Sci. 2000, 156, 245–251. [Google Scholar] [CrossRef] [Green Version]
- Zhou, G.; Zhou, X.; Nie, Y.; Bai, S.H.; Zhou, L.; Shao, J.; Cheng, W.; Wang, J.; Hu, F.; Fu, Y. Drought-induced changes in root biomass largely result from altered root morphological traits: Evidence from a synthesis of global field trials. Plant Cell Environ. 2018, 41, 2589–2599. [Google Scholar] [CrossRef]
- Chaves, M.M.; Maroco, J.P.; Pereira, J.S. Understanding plant responses to drought—From genes to the whole plant. Funct. Plant Biol. 2003, 30, 239–264. [Google Scholar] [CrossRef] [PubMed]
- Munns, R. Comparative physiology of salt and water stress. Plant Cell Environ. 2002, 25, 239–250. [Google Scholar] [CrossRef] [PubMed]
- Alarcón, J.J.; Morales, M.A.; Ferrández, T.; Sánchez-Blanco, M.J. Effects of water and salt stresses on growth, water relations and gas exchange in Rosmarinus officinalis. J. Hortic. Sci. Biotechnol. 2006, 81, 845–853. [Google Scholar] [CrossRef]
- Álvarez, S.; Castillo, M.; Acosta, J.; Navarro, A.; Sánchez-Blanco, M. Photosynthetic response, biomass distribution and water status changes in Rhamnus alaternus plants during drought. Acta Hortic. 2012, 937, 853–860. [Google Scholar] [CrossRef]
- Pandey, P.; Ramegowda, V.; Senthil-Kumar, M. Shared and unique responses of plants to multiple individual stresses and stress combinations: Physiological and molecular mechanisms. Front. Plant Sci. 2015, 6, 723. [Google Scholar] [CrossRef] [Green Version]
- Chaves, M.M.; Flexas, J.; Pinheiro, C. Photosynthesis under drought and salt stress: Regulation mechanisms from whole plant to cell. Ann. Bot. 2009, 103, 551–560. [Google Scholar] [CrossRef] [Green Version]
- Toscano, S.; Ferrante, A.; Tribulato, A.; Romano, D. Leaf physiological and anatomical responses of Lantana and Ligustrum species under different water availability. Plant Physiol. Biochem. 2018, 127, 380–392. [Google Scholar] [CrossRef]
- Farooq, M.; Basra, S.M.A.; Wahid, A.; Rehman, H. Exogenously applied nitric oxide enhances the drought tolerance in fine grain aromatic rice (Oryza sativa L.). J Agron Crop Sci. 2009, 195, 254–261. [Google Scholar] [CrossRef]
- Xu, C.; Leskovar, D.I. Growth, physiology and yield responses of cabbage to deficit irrigation. Hortic. Sci. 2014, 41, 138–146. [Google Scholar] [CrossRef] [Green Version]
- Ors, S.; Ekinci, M.; Yildirim, E.; Sahin, U. Changes in gas exchange capacity and selected physiological properties of squash seedlings (Cucurbita pepo L.) under well-watered and drought stress conditions. Arch. Agron. Soil Sci. 2016, 62, 1700–1710. [Google Scholar] [CrossRef]
- Ekinci, M.; Ors, S.; Yildirim, E.; Turan, M.E.T.İ.N.; Sahin, U.; Dursun, A.; Kul, R. Determination of physiological indices and some antioxidant enzymes of chard exposed to nitric oxide under drought stress. Russ. J Plant Physiol. 2020, 67, 740–749. [Google Scholar] [CrossRef]
- Achuo, E.A.; Prinsen, E.; Höfte, M. Influence of drought, salt stress and abscisic acid on the resistance of tomato to Botrytis cinerea and Oidium neolycopersici. Plant Pathol. 2006, 55, 178–186. [Google Scholar] [CrossRef]
- Adams, H.D.; Germino, M.J.; Breshears, D.D.; Barron-Gafford, G.A.; Guardiola-Claramonte, M.; Zou, C.B.; Huxmanet, T.E. Nonstructural leaf carbohydrate dynamics of Pinus edulis during drought-induced tree mortality reveal role for carbon metabolism in mortality mechanism. New Phytol. 2013, 197, 1142–1151. [Google Scholar] [CrossRef] [PubMed]
- Chen, L.; Zhang, S.; Zhao, H.; Korpelainen, H.; Li, C. Sex-related adaptive responses to interaction of drought and salinity in Populus yunnanensis. Plant Cell Environ. 2010, 33, 1767–1778. [Google Scholar] [CrossRef] [PubMed]
- Choat, B.; Brodribb, T.J.; Brodersen, C.R.; Remko, A.; Duursma, R.A.; Rosana López, R.; Medlyn, B.E. Triggers of tree mortality under drought. Nature 2018, 558, 531–539. [Google Scholar] [CrossRef]
- Hartmann, H.; Trumbore, S. Understanding the roles of nonstructural carbohydrates in forest trees—From what we can measure to what we want to know. New Phytol 2016, 211, 386–403. [Google Scholar] [CrossRef] [PubMed] [Green Version]
- Karst, J.; Gaster, J.; Wiley, E.; Simon, M.; Landhäusser, S.M. Stress differentially causes roots of tree seedlings to exude carbon. Tree Physiol. 2017, 37, 154–164. [Google Scholar] [CrossRef] [PubMed] [Green Version]
- Umar, M.; Uddin, Z.; Siddiqui, Z.S. Responses of photosynthetic apparatus in sunflower cultivars to combined drought and salt stress. Photosynthetica 2019, 57, 627–639. [Google Scholar] [CrossRef] [Green Version]
- Nogués, S.; Baker, N.R. Effects of drought on photosynthesis in Mediterranean plants grown under enhanced UV-B radiation. J. Exp. Bot. 2000, 51, 1309–1317. [Google Scholar] [CrossRef] [PubMed] [Green Version]
- Sharif, P.; Seyedsalehi, M.; Paladino, O.; Van Damme, P.; Sillanpää, M.; Sharifi, A.A. Effect of drought and salinity stresses on morphological and physiological characteristics of canola. Int. J. Environ. Sci. Technol. 2018, 15, 1859–1866. [Google Scholar] [CrossRef]
- Zhu, Y.; Luo, X.; Nawaz, G.; Yin, J.; Yang, J. Physiological and biochemical responses of four cassava cultivars to drought stress. Sci. Rep. 2020, 10, 6968. [Google Scholar] [CrossRef] [PubMed] [Green Version]
- Chaves, M. Effects of water deficits on carbon assimilation. J. Exp. Bot. 1991, 42, 1–16. [Google Scholar] [CrossRef]
- Lawlor, D.W. Limitation to photosynthesis in water-stressed leaves: Stomata vs. metabolism and the role of ATP. Ann. Bot. 2002, 89, 871–885. [Google Scholar] [CrossRef] [PubMed]
- Yan, W.; Zhong, Y.; Shangguan, Z. A meta-analysis of leaf gas exchange and water status responses to drought. Sci. Rep. 2016, 6, 20917. [Google Scholar] [CrossRef] [Green Version]
- Dehbalaei, S.; Farshadfar, E.; Farshadfar, M. Assessment of drought tolerance in bread wheat genotypes based on resistance/tolerance indices. Int. J. Agric. Crop Sci. 2013, 5, 2352–2358. [Google Scholar]
- Sun, J.; Luo, H.; Fu, J.; Huang, B. Classification of genetic variation for drought tolerance in Tall Fescue using physiological traits and molecular markers. Crop Sci. 2013, 53, 647–654. [Google Scholar] [CrossRef]


| TB | EB | R/S | TLA | LN | SPAD | |
|---|---|---|---|---|---|---|
| Main Effects | ||||||
| Drought (D) | F 41.86 p < 0.001 *** | F 45.77 p < 0.001 *** | F 3.28 p < 0.001 *** | F 32.49 p < 0.001 *** | F 5.09 p < 0.01 ** | F 2.34 ns |
| Saline Aerosol (A) | F 24.25 p < 0.001 *** | F 34.18 p < 0.001 *** | F 5.63 p < 0.01 ** | F 46.51 p < 0.001 *** | F 3.49 p < 0.05 * | F 4.12 p < 0.05 * |
| Species (S) | F 0.85 ns | F 22.91 p < 0.001 *** | F 154.95 p < 0.001 *** | F 448.94 p < 0.001 *** | F 1195.39 p < 0.001 *** | F 19.12 p < 0.001 *** |
| Interaction | ||||||
| D × A | F 9.40 p < 0.001 *** | F 10.34 p< 0.001 *** | F 1.35 ns | F 4.29 p < 0.01 ** | F 6.07 p < 0.001 *** | F 1.30 ns |
| D × S | F 1.92 p < 0.001 ** | F 0.67 p < 0.01 ** | F 1.85 p < 0.01 ** | F 4.29 p < 0.01 ** | F 3.62 p < 0.05 * | F 2.73 ns |
| A × S | F 6.33 p < 0.001 ** | F 4.23 p < 0.05 * | F 3.53 p < 0.05 * | F 0.50 ns | F 4.62 p < 0.05 * | F 3.43 p < 0.05 * |
| D × A × S | F 10.77 p < 0.001 *** | F 14.11 p < 0.001 *** | F 1.80 ns | F 6.20 p < 0.001 *** | F 5.00 p < 0.001 *** | F 1.13 ns |
| Aerosol/Drought | WC 40% | WC 30% | WC 20% | WC 10% | Mean | A × D |
|---|---|---|---|---|---|---|
| TB (g plant−1) | ns | |||||
| S0 | 130.9 ± 2.9 | 113.2 ± 2.4 | 94.2 ± 1.6 | 94.2 ± 0.9 | 108.1 ± 4.7 a ** | |
| S1 | 116.1 ± 0.7 | 102.3 ± 8.5 | 96.4 ± 0.9 | 88.1 ± 4.4 | 100.7 ± 3.7 b | |
| S2 | 113.4 ± 1.9 | 107.1 ± 6.9 | 89.9 ± 2.2 | 77.0 ± 3.5 | 96.9 ± 4.7 b | |
| Mean | 120.1 ± 2.9 A *** | 107.6 ± 3.6 B | 93.5 ± 1.3 C | 86.4 ± 3.0 C | ||
| EB (g plant−1) | ns | |||||
| S0 | 113.0 ± 2.4 | 96.1 ± 0.9 | 80.2 ± 1.6 | 76.8 ± 2.0 | 91.5 ± 4.4 a ** | |
| S1 | 99.3 ± 1.6 | 89.7 ± 8.6 | 80.3 ± 1.8 | 70.6 ± 2.8 | 84.9 ± 3.8 b | |
| S2 | 97.4 ± 1.8 | 91.6 ± 6.6 | 75.8 ± 1.0 | 58.9 ± 1.2 | 80.9 ± 4.8 b | |
| Mean | 103.2 ± 2.7 A *** | 92.5 ± 3.3 B | 78.8 ± 1.0 C | 68.8 ± 2.8 D | ||
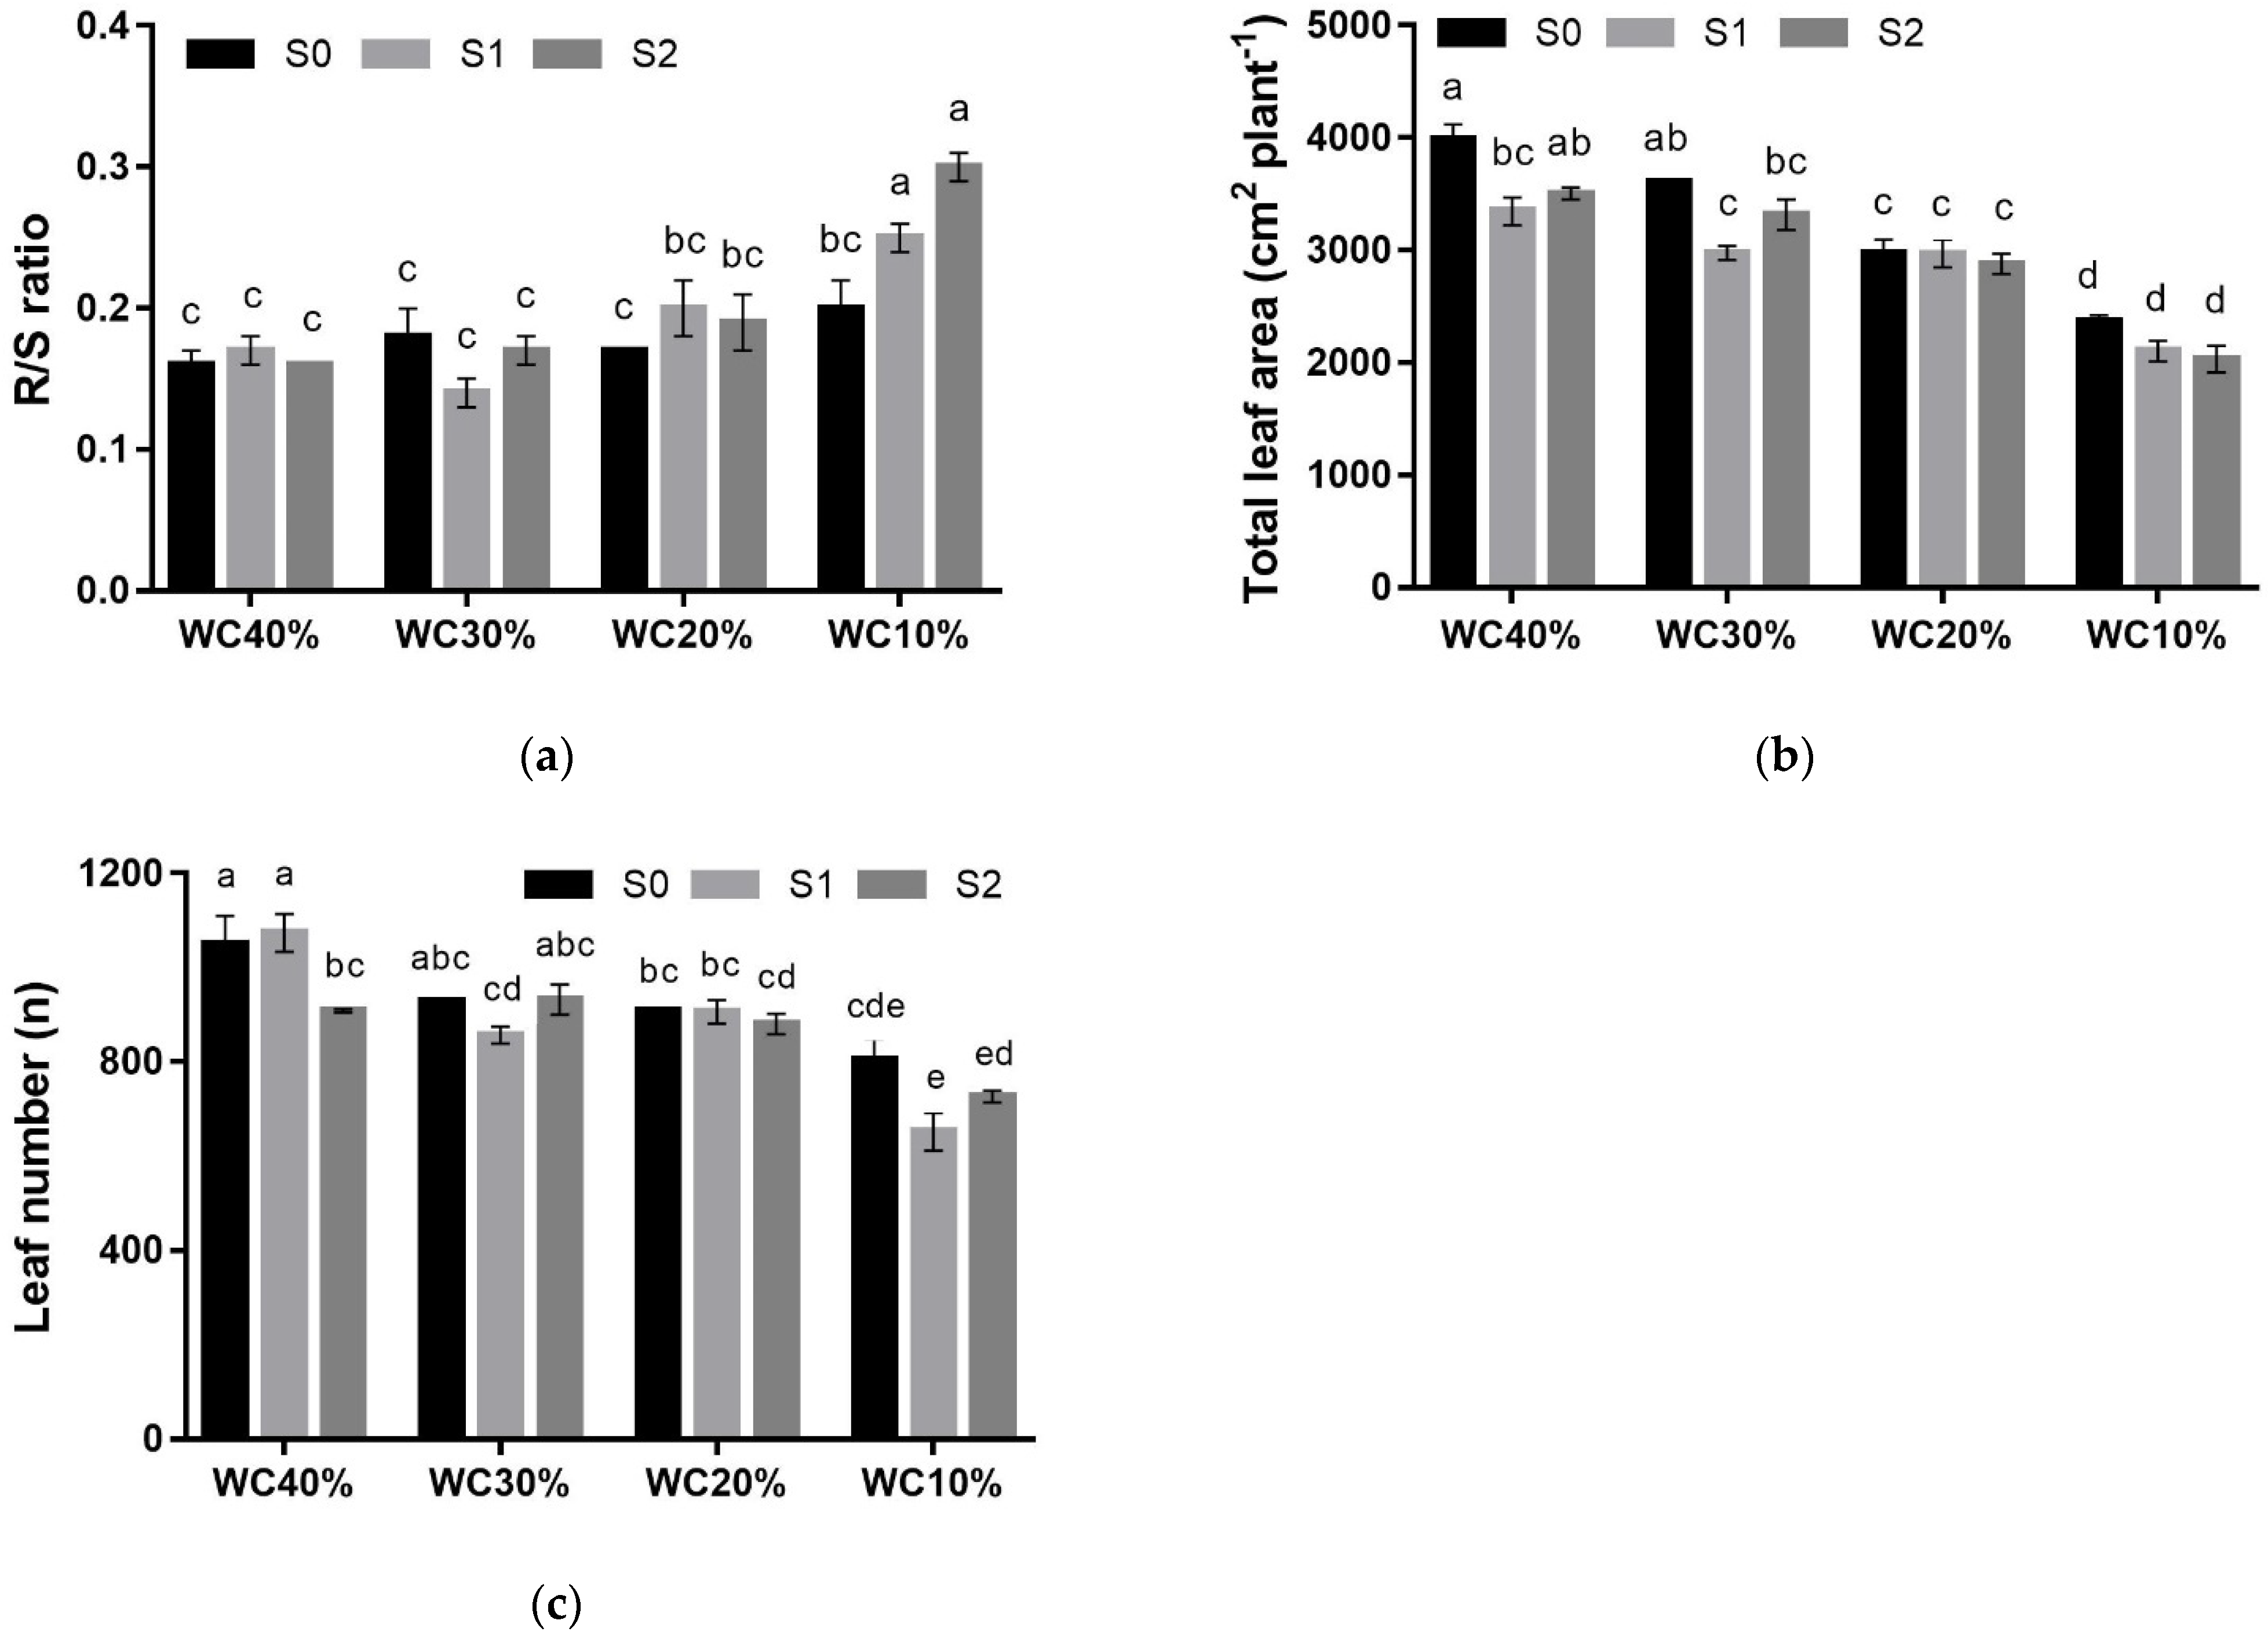
| R/S | p < 0.01 | |||||
| S0 | 0.16 ± 0.01 | 0.18 ± 0.02 | 0.17 ± 0.00 | 0.20 ± 0.02 | 0.18 ± 0.01 ns | |
| S1 | 0.17 ± 0.01 | 0.14 ± 0.01 | 0.20 ± 0.02 | 0.25 ± 0.01 | 0.19 ± 0.01 | |
| S2 | 0.16 ± 0.00 | 0.17 ± 0.01 | 0.19 ± 0.02 | 0.30 ± 0.01 | 0.20 ± 0.02 | |
| Mean | 0.17 ± 0.01 B *** | 0.16 ± 0.01 B | 0.19 ± 0.01 B | 0.25 ± 0.02 A | ||
| TLA (cm2) | p < 0.05 | |||||
| S0 | 3979.9 ± 139.3 | 3611.7 ± 14.0 | 2978.9 ± 116.3 | 2364.8 ± 60.1 | 3233.8 ± 190.3 a *** | |
| S1 | 3345.9 ± 123.7 | 2977.2 ± 61.2 | 2969.4 ± 122.4 | 2101.6 ± 90.8 | 2932.1 ± 144.7 b | |
| S2 | 3503.9 ± 51.0 | 3315.5 ± 136.2 | 2878.1 ± 90.3 | 2030.8 ± 115.2 | 2848.5 ± 176.7 b | |
| Mean | 3609.9 ± 110.4 A *** | 3301.5 ± 101.4 B | 2942.1 ± 57.6 C | 2165.7 ± 68.4 D | ||
| LN (n°) | p < 0.01 | |||||
| S0 | 1050.2 ± 59.7 | 928.1 ± 13.3 | 908.5 ± 57.2 | 804.5 ± 43.2 | 922.7 ± 30.7 a * | |
| S1 | 1073.0 ± 40.0 | 865.5 ± 118.0 | 905.6 ± 25.1 | 651.8 ± 39.9 | 871.7 ± 47.3 ab | |
| S2 | 907.8 ± 13.8 | 931.4 ± 86.1 | 913.6 ± 160.0 | 727.7 ± 69.5 | 861.3 ± 25.7 b | |
| Mean | 1010.3 ± 33.2 A *** | 905.3 ± 43.9 B | 898.0 ± 10.7 B | 727.3 ± 34.3 C |
| Aerosol/Drought | WC 40% | WC 30% | WC 20% | WC 10% | Mean | A × D |
|---|---|---|---|---|---|---|
| TB (g plant−1) | p> 0.05 | |||||
| S0 | 126.3 ± 8.0 | 105.2 ± 0.7 | 111.4 ± 2.8 | 95.4 ± 2.1 | 109.6 ± 3.9 ns | |
| S1 | 114.7 ± 1.6 | 103.8 ± 3.6 | 95.0 ± 4.4 | 99.4 ± 6.1 | 103.2 ± 2.9 | |
| S2 | 126.0 ± 3.9 | 106.9 ± 2.2 | 95.6 ± 1.2 | 88.9 ± 2.2 | 104.3 ± 3.5 | |
| Mean | 122.3 ± 3.2 A *** | 105.3 ± 1.3 B | 100.7 ± 3.1 BC | 94.6 ± 2.8 C | ||
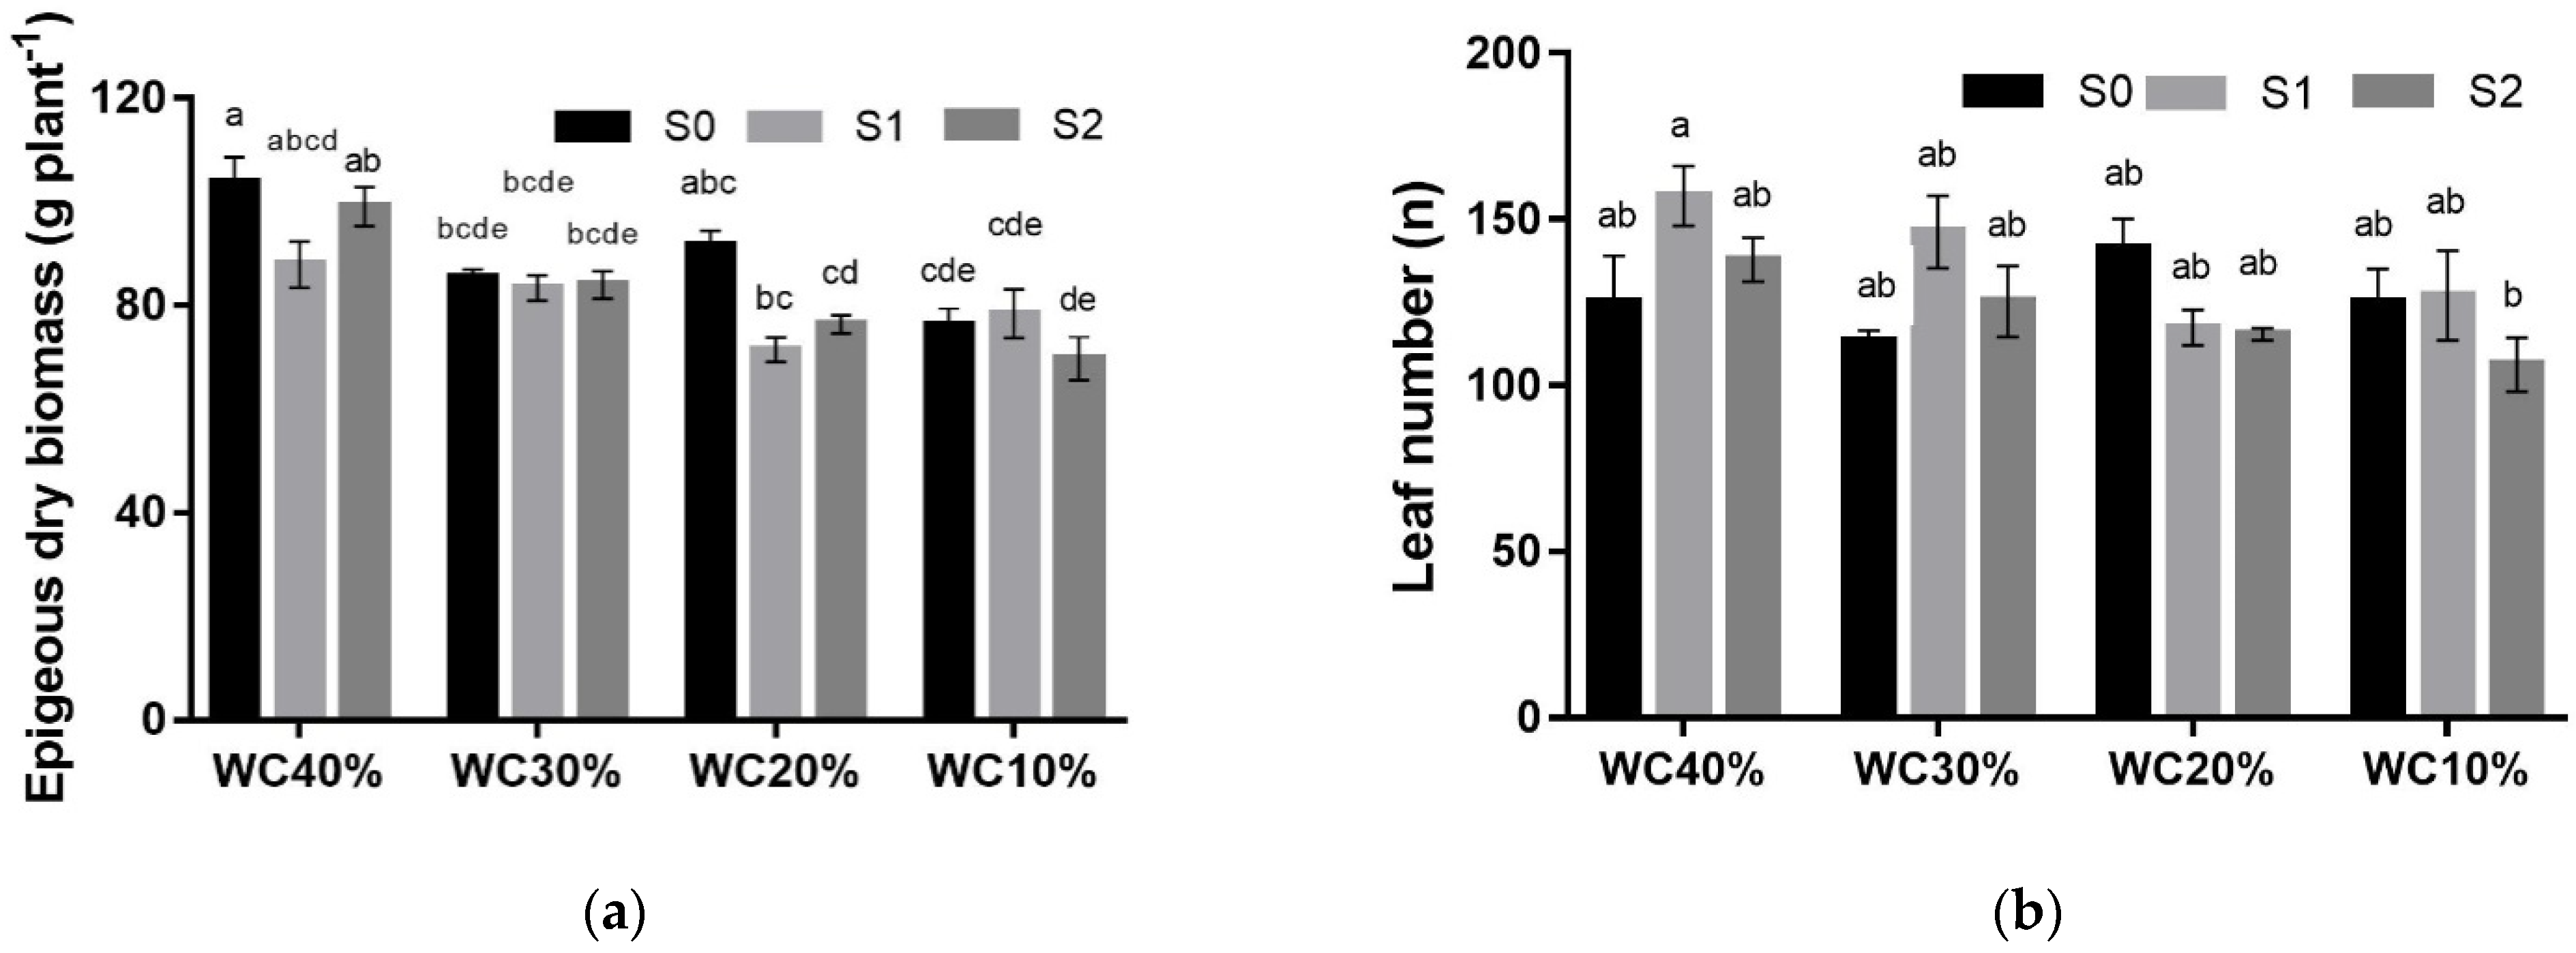
| EB (g plant−1) | p< 0.05 | |||||
| S0 | 103.8 ± 4.9 | 85.3 ± 1.6 | 91.6 ± 2.8 | 76.2 ± 3.3 | 89.2 ± 3.3 a ** | |
| S1 | 87.9 ± 4.5 | 83.4 ± 2.4 | 71.5 ± 2.3 | 78.5 ± 4.7 | 80.3 ± 2.4 ab | |
| S2 | 99.1 ± 3.8 | 84.0 ± 2.7 | 76.4 ± 1.8 | 69.8 ± 4.2 | 82.3 ± 3.6 b | |
| Mean | 96.9 ± 3.2 A *** | 84.3 ± 1.2 B | 79.8 ± 3.3 BC | 74.8 ± 2.4 C | ||
| R/S | ns | |||||
| S0 | 0.22 ± 0.0 | 0.23 ± 0.0 | 0.22 ± 0.0 | 0.26 ± 0.1 | 0.23 ± 0.0 b * | |
| S1 | 0.31 ± 0.1 | 0.24 ± 0.0 | 0.33 ± 0.0 | 0.27 ± 0.0 | 0.29 ± 0.0 a | |
| S2 | 0.27 ± 0.0 | 0.27 ± 0.0 | 0.25 ± 0.0 | 0.27 ± 0.0 | 0.27 ± 0.1 ab | |
| Mean | 0.27 ± 0.0 ns | 0.25 ± 0.0 | 0.27 ± 0.0 | 0.27 ± 0.0 | ||
| TLA (cm2) | ns | |||||
| S0 | 6386.0 ± 240.3 | 5073.1 ± 9.9 | 5288.2 ± 436.3 | 4736.0 ± 111.4 | 5370.8 ± 215.9 a *** | |
| S1 | 4890.8 ± 184.6 | 4584.9 ± 124.1 | 3963.6 ± 268.0 | 4202.1 ± 202.5 | 4401.4 ± 136.3 c | |
| S2 | 5805.8 ± 251.1 | 4732.9 ± 308.6 | 4637.6 ± 145.8 | 4008.3 ± 319.6 | 4796.2 ± 225.3 b | |
| Mean | 5694.2 ± 245.5 A *** | 4784.9 ± 123.0 B | 4629.8 ± 245.3 BC | 4315.5 ± 157.5 C | ||
| LN (n°) | p< 0.05 | |||||
| S0 | 125.0 ± 14.0 | 113.3 ± 3.2 | 141.4 ± 8.7 | 125.0 ± 10.1 | 126.2 ± 5.2 ab * | |
| S1 | 157.1 ± 8.9 | 146.2 ± 11.0 | 117.5 ± 5.3 | 127.1 ± 13.5 | 137.0 ± 6.4 a | |
| S2 | 137.8 ± 6.6 | 125.2 ± 10.7 | 115.5 ± 1.8 | 106.2 ± 8.2 | 121.2 ± 4.8 b | |
| Mean | 140.0 ± 7.0 ns | 128.2 ± 6.6 | 124.8 ± 5.1 | 119.4 ± 6.3 |
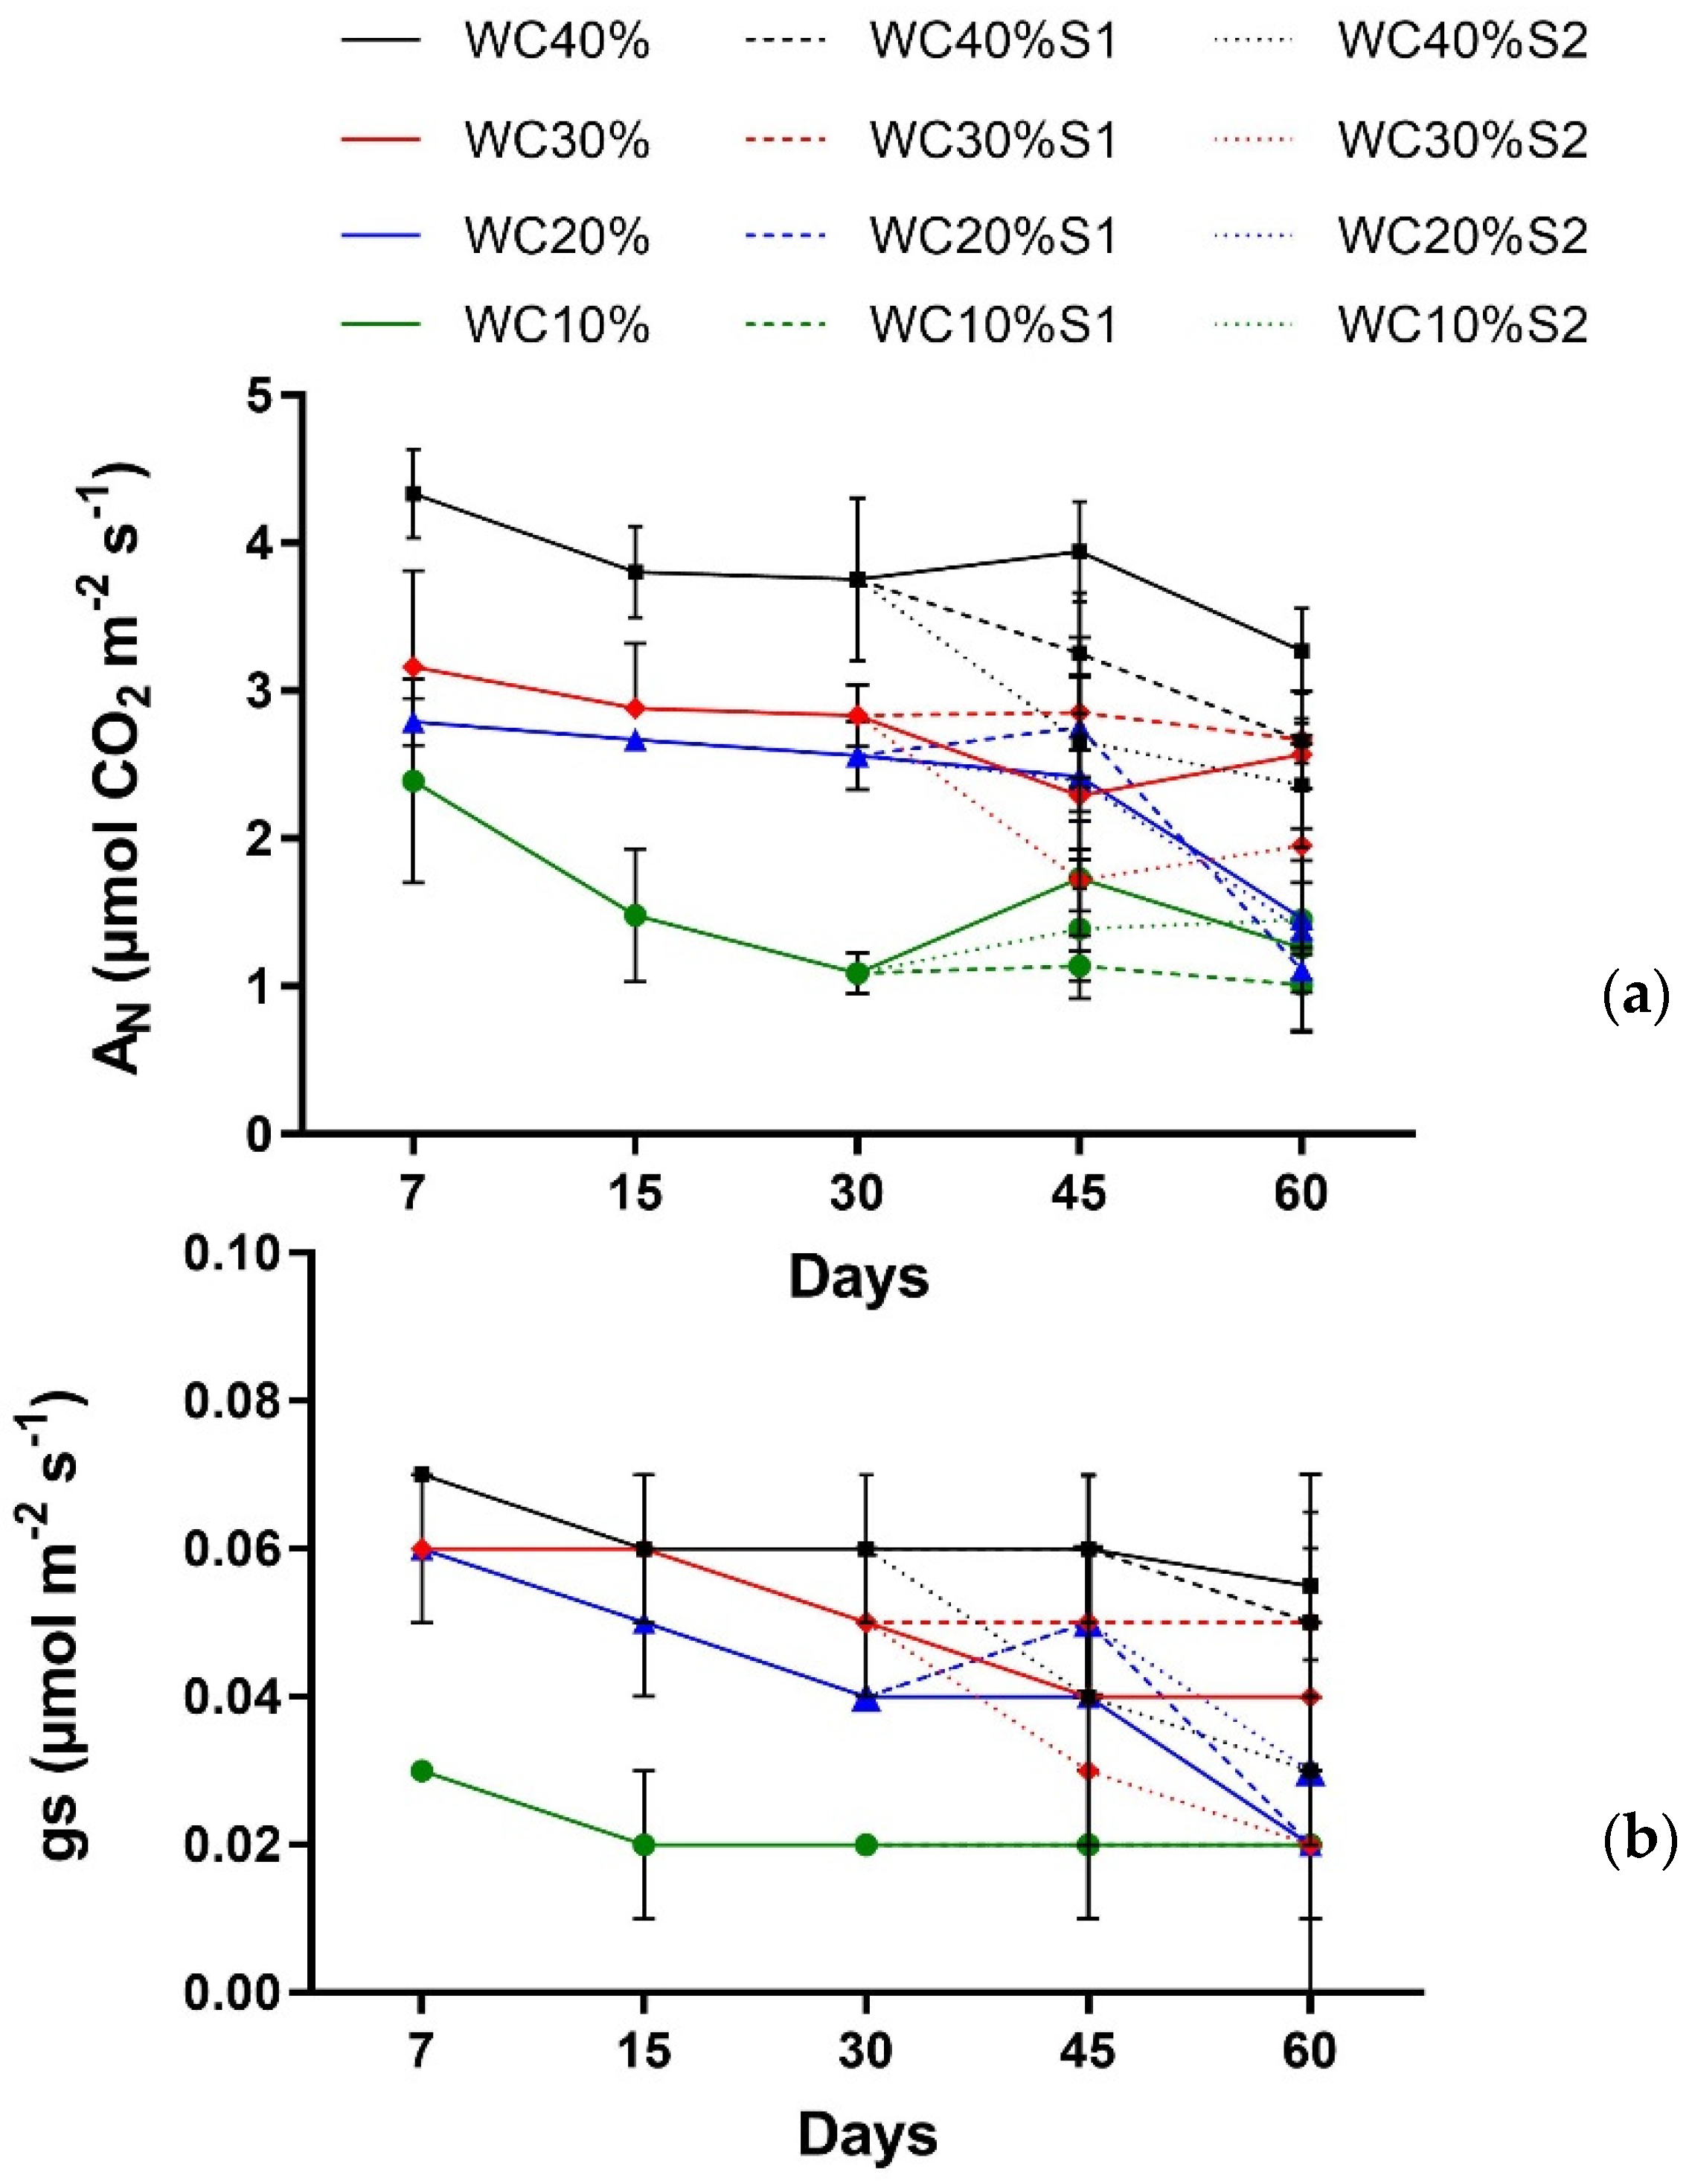
| Factor | AN | gs |
|---|---|---|
| Main effect | ||
| Days (T) | p > 0.1360 ns | p > 0.9479 ns |
| Drought (D) | p < 0.001 *** | p < 0.001 *** |
| Interaction | ||
| T × D | p > 0.9195 ns | p > 0.3881 ns |
| Main effect | ||
| Days (T) | p < 0.000 *** | p > 0.9335 ns |
| Drought (D) | p < 0.000 *** | p > 0.7446 ns |
| Aerosol Saline (A) | p < 0.0223 * | p > 0.7487 ns |
| Interaction | ||
| T × D | p < 0.02 * | p > 0.1859 ns |
| T × A | p > 0.2517 ns | p > 0.4371 ns |
| D × A | p < 0.0492 * | p > 0.1965 ns |
| T × D × A | p > 0.695 ns | p > 0.4665 ns |
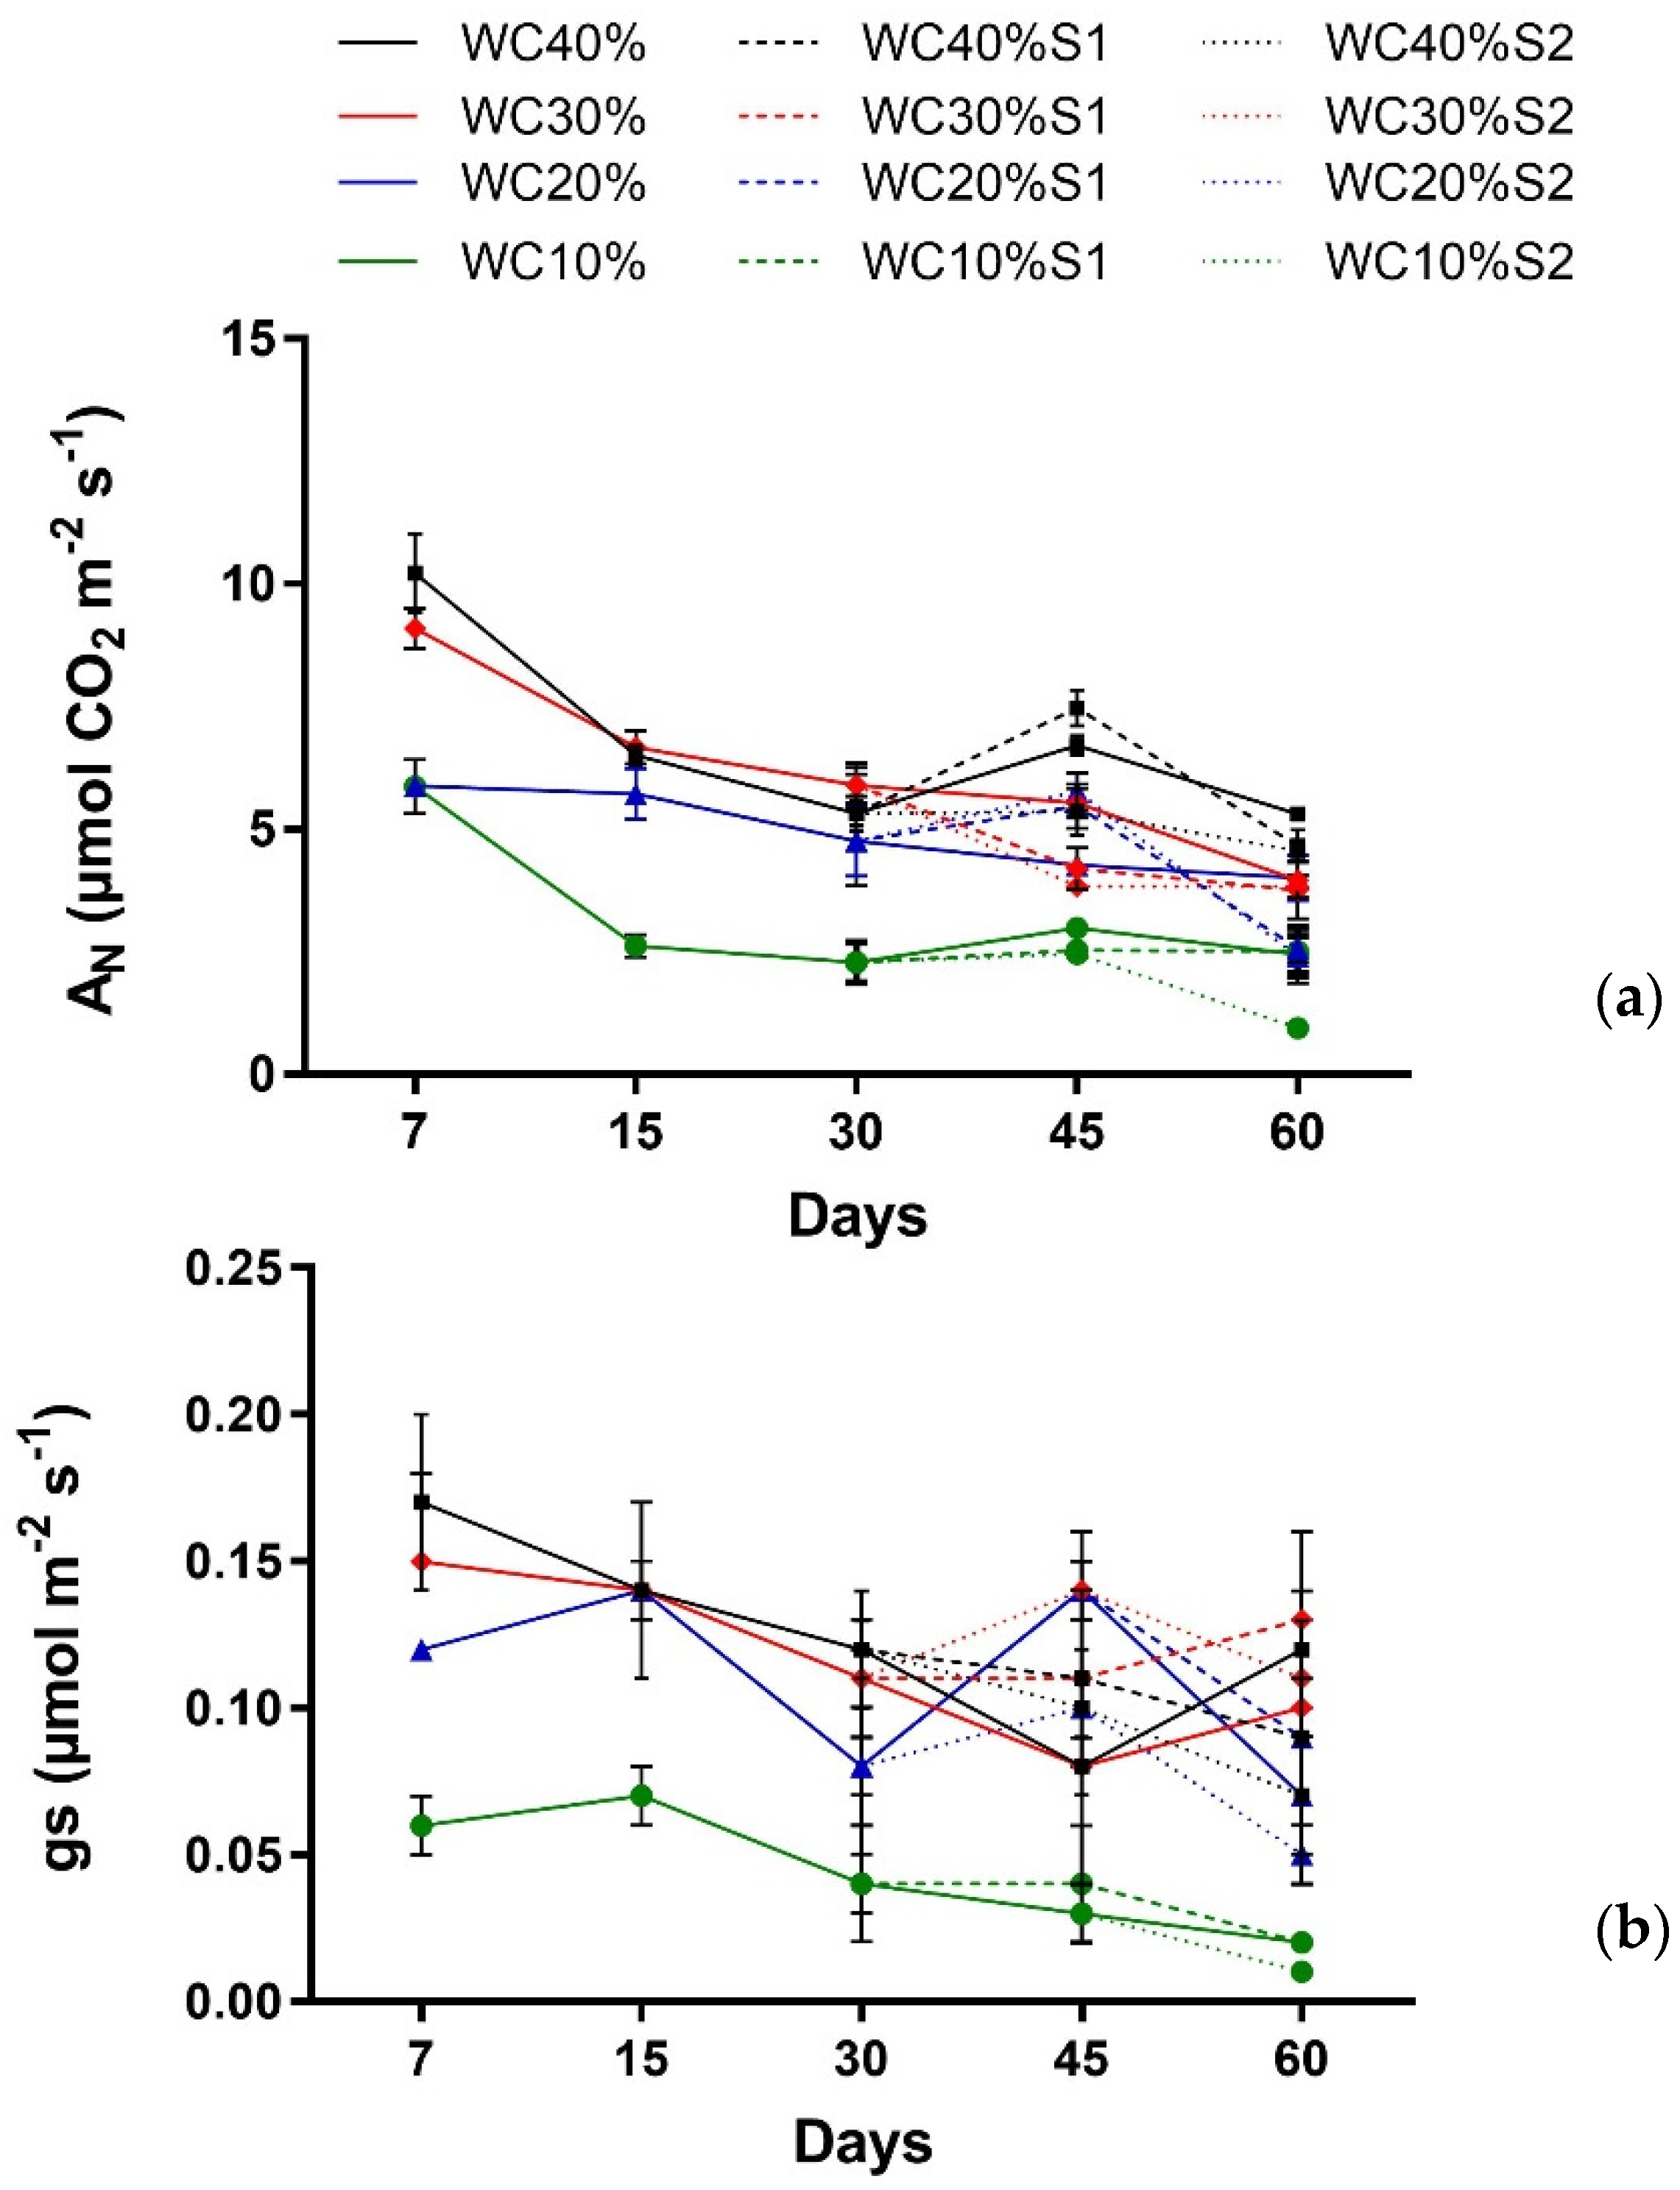
| Factor | AN | gs |
|---|---|---|
| Main effect | ||
| Days (T) | p < 0.001 *** | p < 0.0024 ** |
| Drought (D) | p < 0.001 *** | p < 0.000 *** |
| Interaction | ||
| T × D | p < 0.0117 * | p > 0.6831 ns |
| Main effect | ||
| Days (T) | p < 0.0000 *** | p < 0.0123 * |
| Drought (D) | p < 0.0000 *** | p < 0.0000 *** |
| Aerosol Saline (A) | p < 0.0001 *** | p > 0.1899 ns |
| Interaction | ||
| T × D | p < 0.0002 *** | p < 0.0298 * |
| T × A | p> 0.1567 ns | p > 0.2644 ns |
| D × A | p > 0.0677 ns | p> 0.1738 ns |
| T × D × A | p < 0.0000*** | p > 0.5243 ns |
| Factor | Fv/Fm Callistemon | Fv/Fm Viburnum |
|---|---|---|
| Main effect | ||
| Days (T) | p < 0.0001 *** | p < 0.0002 *** |
| Drought (D) | p < 0.0000 *** | p < 0.0000 *** |
| Interaction | ||
| T × D | p < 0.0018 ** | p < 0.0259 * |
| Main effect | ||
| Days (T) | p > 0.4355 ns | p < 0.0000 *** |
| Drought (D) | p < 0.0000 *** | p < 0.0005 *** |
| Aerosol Saline (A) | p < 0.0000 *** | p > 0.7511 ns |
| Interaction | ||
| T × D | p > 0.4146 ns | p < 0.0157 * |
| T × A | p < 0.0418 * | p > 0.1429 ns |
| D × A | p < 0.0000 *** | p < 0.4412 * |
| T × D × A | p < 0.0099 ** | p > 0.6064 ns |
Publisher’s Note: MDPI stays neutral with regard to jurisdictional claims in published maps and institutional affiliations. |
© 2021 by the authors. Licensee MDPI, Basel, Switzerland. This article is an open access article distributed under the terms and conditions of the Creative Commons Attribution (CC BY) license (https://creativecommons.org/licenses/by/4.0/).
Share and Cite
Toscano, S.; Ferrante, A.; Romano, D.; Tribulato, A. Interactive Effects of Drought and Saline Aerosol Stress on Morphological and Physiological Characteristics of Two Ornamental Shrub Species. Horticulturae 2021, 7, 517. https://doi.org/10.3390/horticulturae7120517
Toscano S, Ferrante A, Romano D, Tribulato A. Interactive Effects of Drought and Saline Aerosol Stress on Morphological and Physiological Characteristics of Two Ornamental Shrub Species. Horticulturae. 2021; 7(12):517. https://doi.org/10.3390/horticulturae7120517
Chicago/Turabian StyleToscano, Stefania, Antonio Ferrante, Daniela Romano, and Alessandro Tribulato. 2021. "Interactive Effects of Drought and Saline Aerosol Stress on Morphological and Physiological Characteristics of Two Ornamental Shrub Species" Horticulturae 7, no. 12: 517. https://doi.org/10.3390/horticulturae7120517